Article

Effects of Driving Frequency and Voltage on the Performances of Vibrating Mesh Nebulizers

1
Department of Medical Engineering, Dongguk University College of Medicine, Goyang-si 10326, Korea
2
Graduate Program of Biomedical Engineering, Yonsei University, Seoul 03722, Korea
3
Department of Electrical & Biological Physics, Kwangwoon University, Seoul 01897, Korea
4
Institute of Biomaterials, Kwangwoon University, Seoul 01897, Korea
5
Department of Medical Engineering, Yonsei University College of Medicine, Seoul 03722, Korea
*
Authors to whom correspondence should be addressed.
Appl. Sci. 2021, 11(3), 1296; https://doi.org/10.3390/app11031296
Submission received: 23 December 2020 / Revised: 21 January 2021 / Accepted: 27 January 2021 / Published: 1 February 2021
(This article belongs to the Section Applied Biosciences and Bioengineering)

Abstract

:
The functional components of vibrating mesh nebulizers are a piezoelectric ceramic with a mesh mounted on one side, a reservoir, and a driving circuit. The piezoelectric material vibrates at a specific intrinsic frequency, and when the mechanical resonance frequency of the piezoelectric ceramic and the frequency of the applied electrical signal match, the vibration amplitude of the ceramic is greatest. In the present study, nebulizing performances were tested with respect to driving voltage amplitude after automatic resonance frequency tuning (ARFT) and/or impedance matching (IM) for salbutamol and glycerol solutions. A 1% mismatch of resonance frequency reduced the output rate by 11.0~30.1% and increased particle size by 1.6~7.7% and power consumption increased by 6.6~13.6%. Driving at 30 Vpp after ARFT and IM increased output rate by 45% and decreased power consumption by 31% compared with operation at nominal resonance frequency without IM at 50 Vpp. Nebulization of viscous solutions was also enhanced by applying ARFT with IM. The study shows the application of ARFT with IM improves vibrating mesh nebulizer performance and reduces power consumption.

1. Introduction

Nebulizers of various types are commercially available, such as jet, ultrasonic, and mesh types, for the treatment of various respiratory diseases [1,2,3,4]. Jet nebulizers can be used to aerosolize liquid, have simple constructions, and are trusted medical devices, but vibrate and are large and noisy. On the other hand, ultrasonic nebulizers are relatively quieter and smaller than jet nebulizer but involve heating liquids depending on operating frequency, which damages drugs [1]. Vibrating mesh nebulizers generate aerosols using a piezoelectric ceramic (Lead Zirconate Titanate, PZT) and mesh (Figure 1) and are portable, relatively quiet, and do not heat nebulizing solutions.
Vibrating mesh nebulizers are composed of a piezoelectric ceramic with mesh mounted on one side, a reservoir, and a driving circuit. The piezoelectric material vibrates at high frequencies when driven at a specific frequency and voltage. In addition, nebulization characteristics (output rate and particle size) are affected by the physicochemical properties of solutions [5,6]. Much research has been performed to enhance nebulization characteristics by optimizing mesh properties, such as mesh hole size, pitch, and hole number [7,8,9,10,11,12,13]. Recent research suggests a relationship exists between output rate and voltage at a fixed resonance frequency and that output rate increases with driving voltage [14,15]. The piezoelectric element vibrates most at its resonant frequency [15,16], and output rates peak when the driving frequency is close to the resonance frequency of the piezoelectric ceramic [16]. However, actual resonance frequencies differ from the nominal resonance frequencies issued by manufacturers. The resonance frequency is dependent on impedance changes induced by temperature and pressure of the PZT and/or medium viscosity [17,18,19]. Automatic resonance frequency tuning (ARFT) was devised to find resonance frequencies automatically [20,21]. Resonance frequencies can be determined by monitoring maximum driving current while changing driving frequency before driving the piezoelectric. Impedance matching (IM) is a method of reducing the impedance difference between the driving circuit and a PZT [22,23,24] and can improve energy transfer to a PZT and, thus, generate larger vibrations.
In this paper, we sought to determine the effects of driving frequency and voltage on the output rate, particle size, and power consumption of a vibrating mesh nebulizer and investigated the impacts of the driving voltage, impedance matching, and automatic resonance frequency tuning using salbutamol and glycerol solutions.

2. Materials and Methods

2.1. PZT for Nebulizer

A PZT for a nebulizer must have a large displacement and be rigid enough to vibrate the mesh. Of the ‘hard’ PZTs, one with a high Curie temperature (Tc), electromechanical constant (Kt), elastic constant (Y33), and mechanical quality factor (Qm), should be considered [25]. In the present study, the PZT was made of a modified PZT-4 SMMOD14F135 (Steiner & Martins, Davenport, FL, USA). Figure 2 summarizes the parameters of the PZT and metal mesh used.

2.2. PZT Driving Circuit

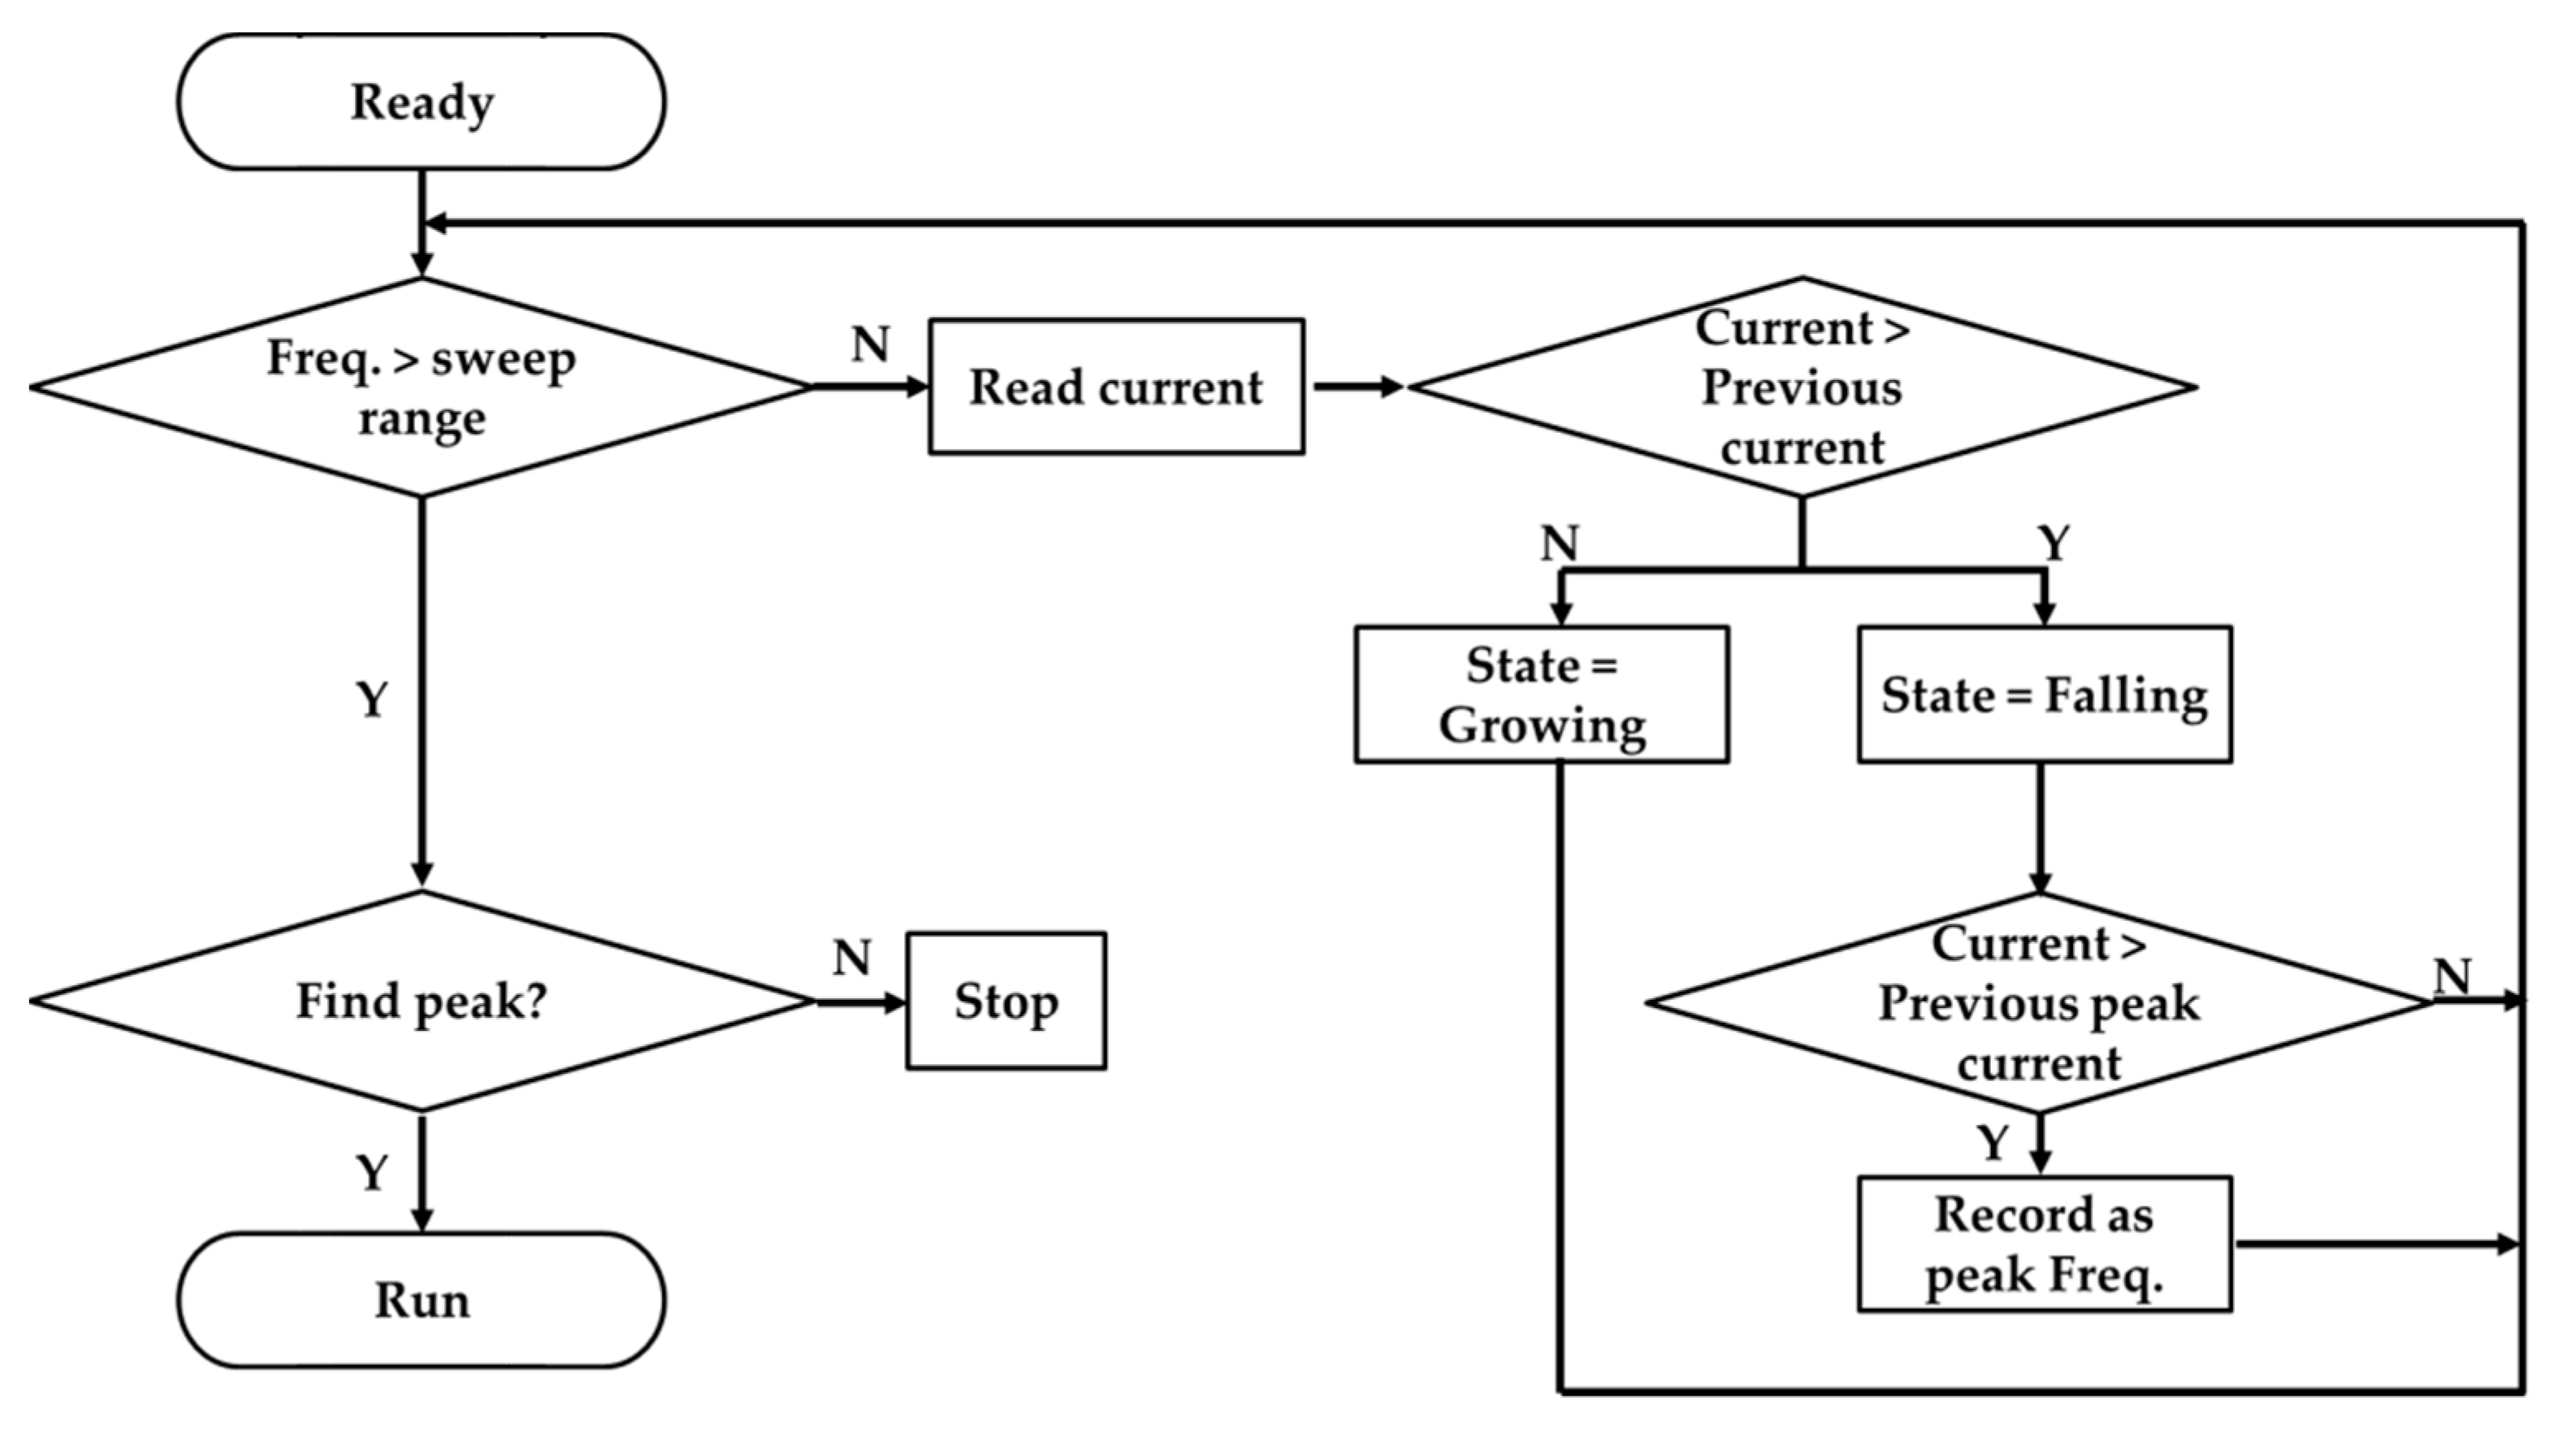
A previously described vibrating mesh nebulizer demonstration circuit (microchip, Chandler, AZ, USA) was modified for this study [21]. Figure 3 shows the automatic resonance frequency tuning (ARFT) method used to find the resonance frequency by monitoring the maximum driving current while changing the driving frequency from 90 to 160 kHz.

2.3. Impedance Matching (IM)

Connecting the transformer to a PZT can change PZT impedance [22,23,24]. The winding ratio of the transformer was calculated based on the assumption that the wattages of the primary and secondary circuits were identical. The impedance of the PZT at resonance frequency was measured using an impedance analyzer (E4990A, Keysight, Santa Rosa, CA, USA) and fed into the equation below to calculate the winding ratio. The output impedance of the driving system was 53.2 Ω. The transformer was made by winding a 0.2 mm diameter copper wire around a ferrite core (outer diameter 10 mm, inner diameter 5 mm, thickness 3 mm).
L 1   : L 2 =   Z o u t   ( d r i v i n g   c i r c u i t )   :   Z ( P Z T )

2.4. Output Rate

Test solutions (1 mL) were accurately weighed using a precision balance (XT320M, Precisa, Dietikon, Switzerland) and placed in the nebulizer reservoir. After the driving system had operated for 1 min, solution weight was remeasured, and the output rate was calculated using the following equation. Volumes were determined gravimetrically, and evaporation was negligible [26,27,28].
O u t p u t   r a t e   ( m L / m i n ) =   C h a r g e d   v o l u m e   ( m L ) R e s i d u a l   v o l u m e   ( m L ) N e b u l i z a t i o n   t i m e   ( m i n )

2.5. Power Consumption

To calculate power consumptions, voltages and currents applied to the PZT were measured using an oscilloscope (DSOX4034A, Keysight, Santa Rosa, CA, USA).

2.6. Particle Size

Particle sizes were measured as mass median diameters (MMDs) using a Spraytec (Malvern Instruments, Malvern, UK), which analyzes droplet size distribution by laser diffraction [27,28,29]. Fifty percent volume diameters (Dv(50)) were automatically calculated by Spraytec software. Average sizes of particles generated over 1 min from 10 s after starting delivery were recorded.

2.7. Nebulization Characteristics by Driving Frequency and Voltage

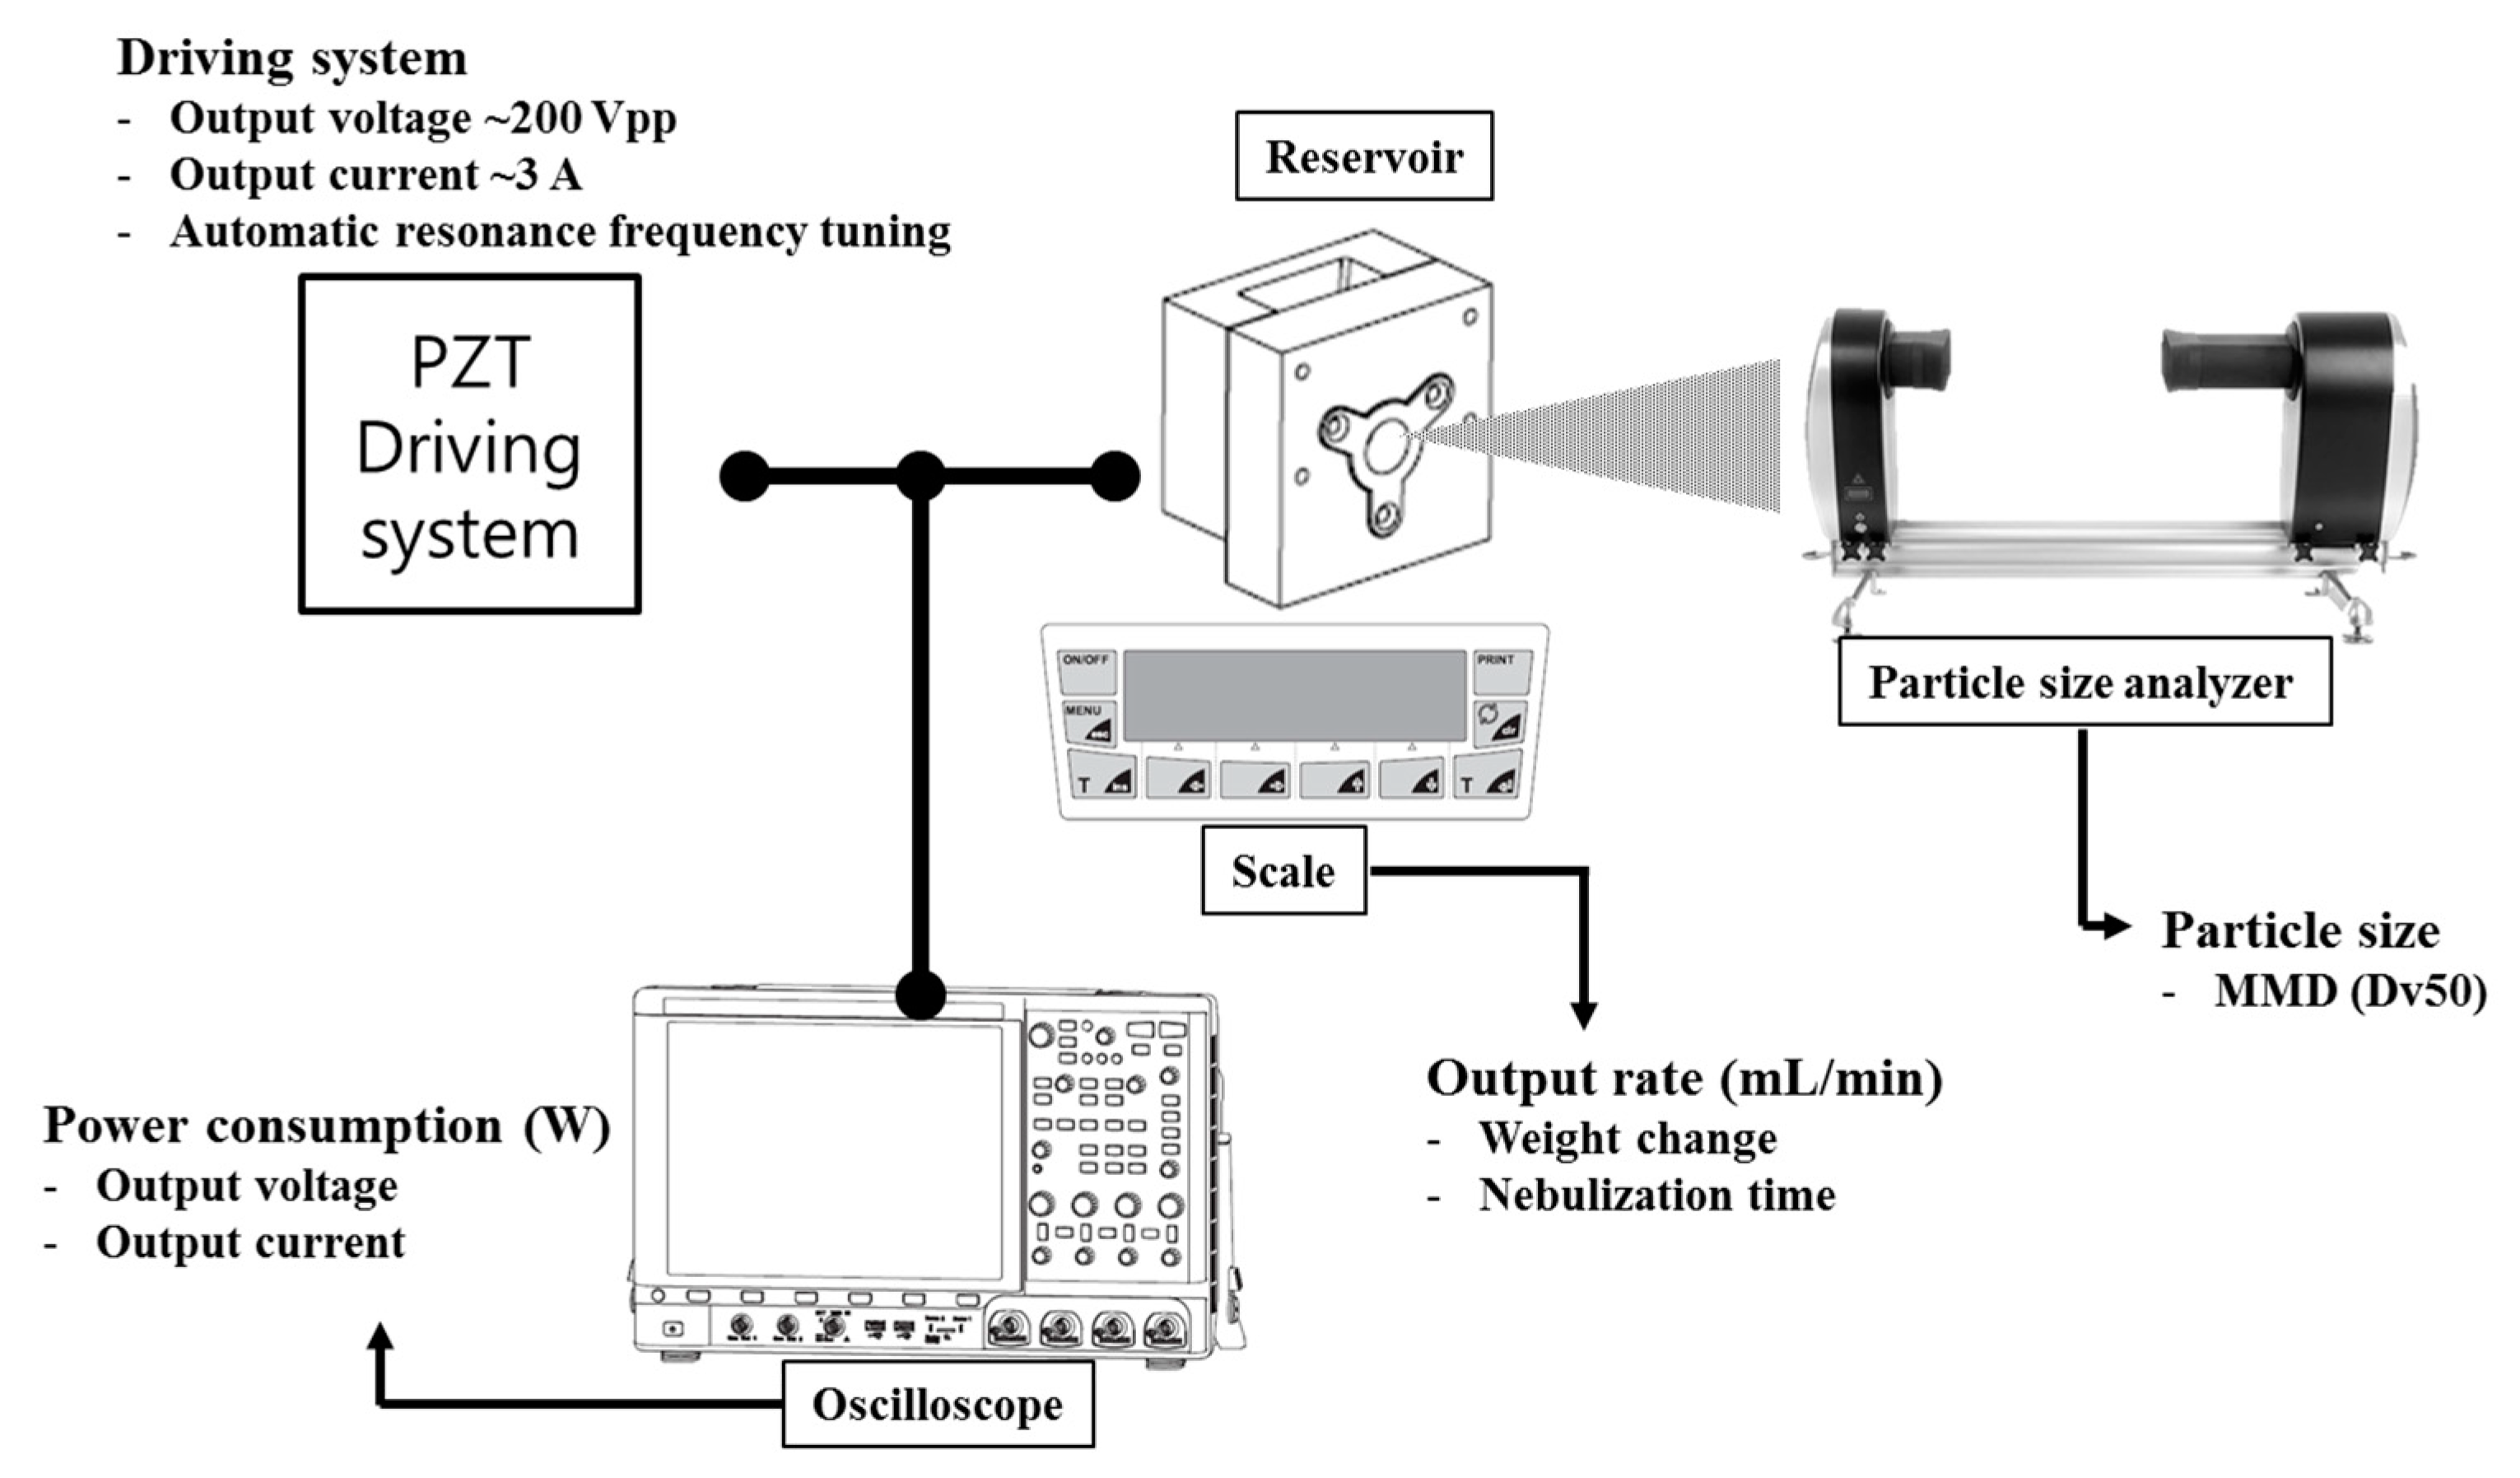
Output rates, particle sizes, and power consumptions were measured for salbutamol solution, according to driving frequency and voltage after IM. Resonance frequencies (Fr) of 3 PZT samples were determined by ARFT, and then driving frequencies were set to Fr ± 0~3% (in 1% steps). The driving voltage was set to 50, 60, 70, 80, or 90 Vpp (Table 1). Salbutamol (Sigma–Aldrich Co., St. Louis, MO, USA) was prepared and used at 0.1% (M/V), which is the standard for measuring particle sizes in ISO 27427:2013 [30], by dissolving salbutamol powder in saline to a concentration of 1 mg/mL. Figure 4 shows the experimental settings used for measuring output rate, power consumption, and particle size.

2.8. Nebulization Characteristics after ARFT and IM

Output rates, particle sizes, and power consumptions were measured for different driving voltages (30, 40, 50 Vpp) with or without ARFT and/or IM (Table 2). Salbutamol nebulizing solutions were used as is routinely used for nebulizer testing or 17.5%, which has a viscosity of 1.48 mPa·s.

2.9. Temperature Profile during Nebulization

The increase in solution temperature caused drug degradation in the nebulizer [1]. The temperature was measured to confirm the heating effect of ARFT and IM. Two milliliters of saline and glycerol solution were nebulized by ARFT and ARFT + IM at 50 Vpp. The temperature was measured for 5 min in a reservoir using a digital multimeter (34465A, Keysight, Santa Rosa, CA, USA) with a k-type thermocouple.

2.10. Statistical Analysis

A two-way analysis of variance followed by Tukey’s test was used to determine the significances of differences between the experimental condition and the 50 Vpp + nominal resonance frequency as control in each solution. The paired t-test was used to compare results for glycerol and salbutamol solutions. Statistical analysis was performed using SPSS Ver. 25 (IBM, Armonk, NY, USA). Results are presented as means ± SDs, and p-values of <0.05 were considered significant.

3. Results

3.1. Nebulization Characteristics by Driving Frequency and Voltage

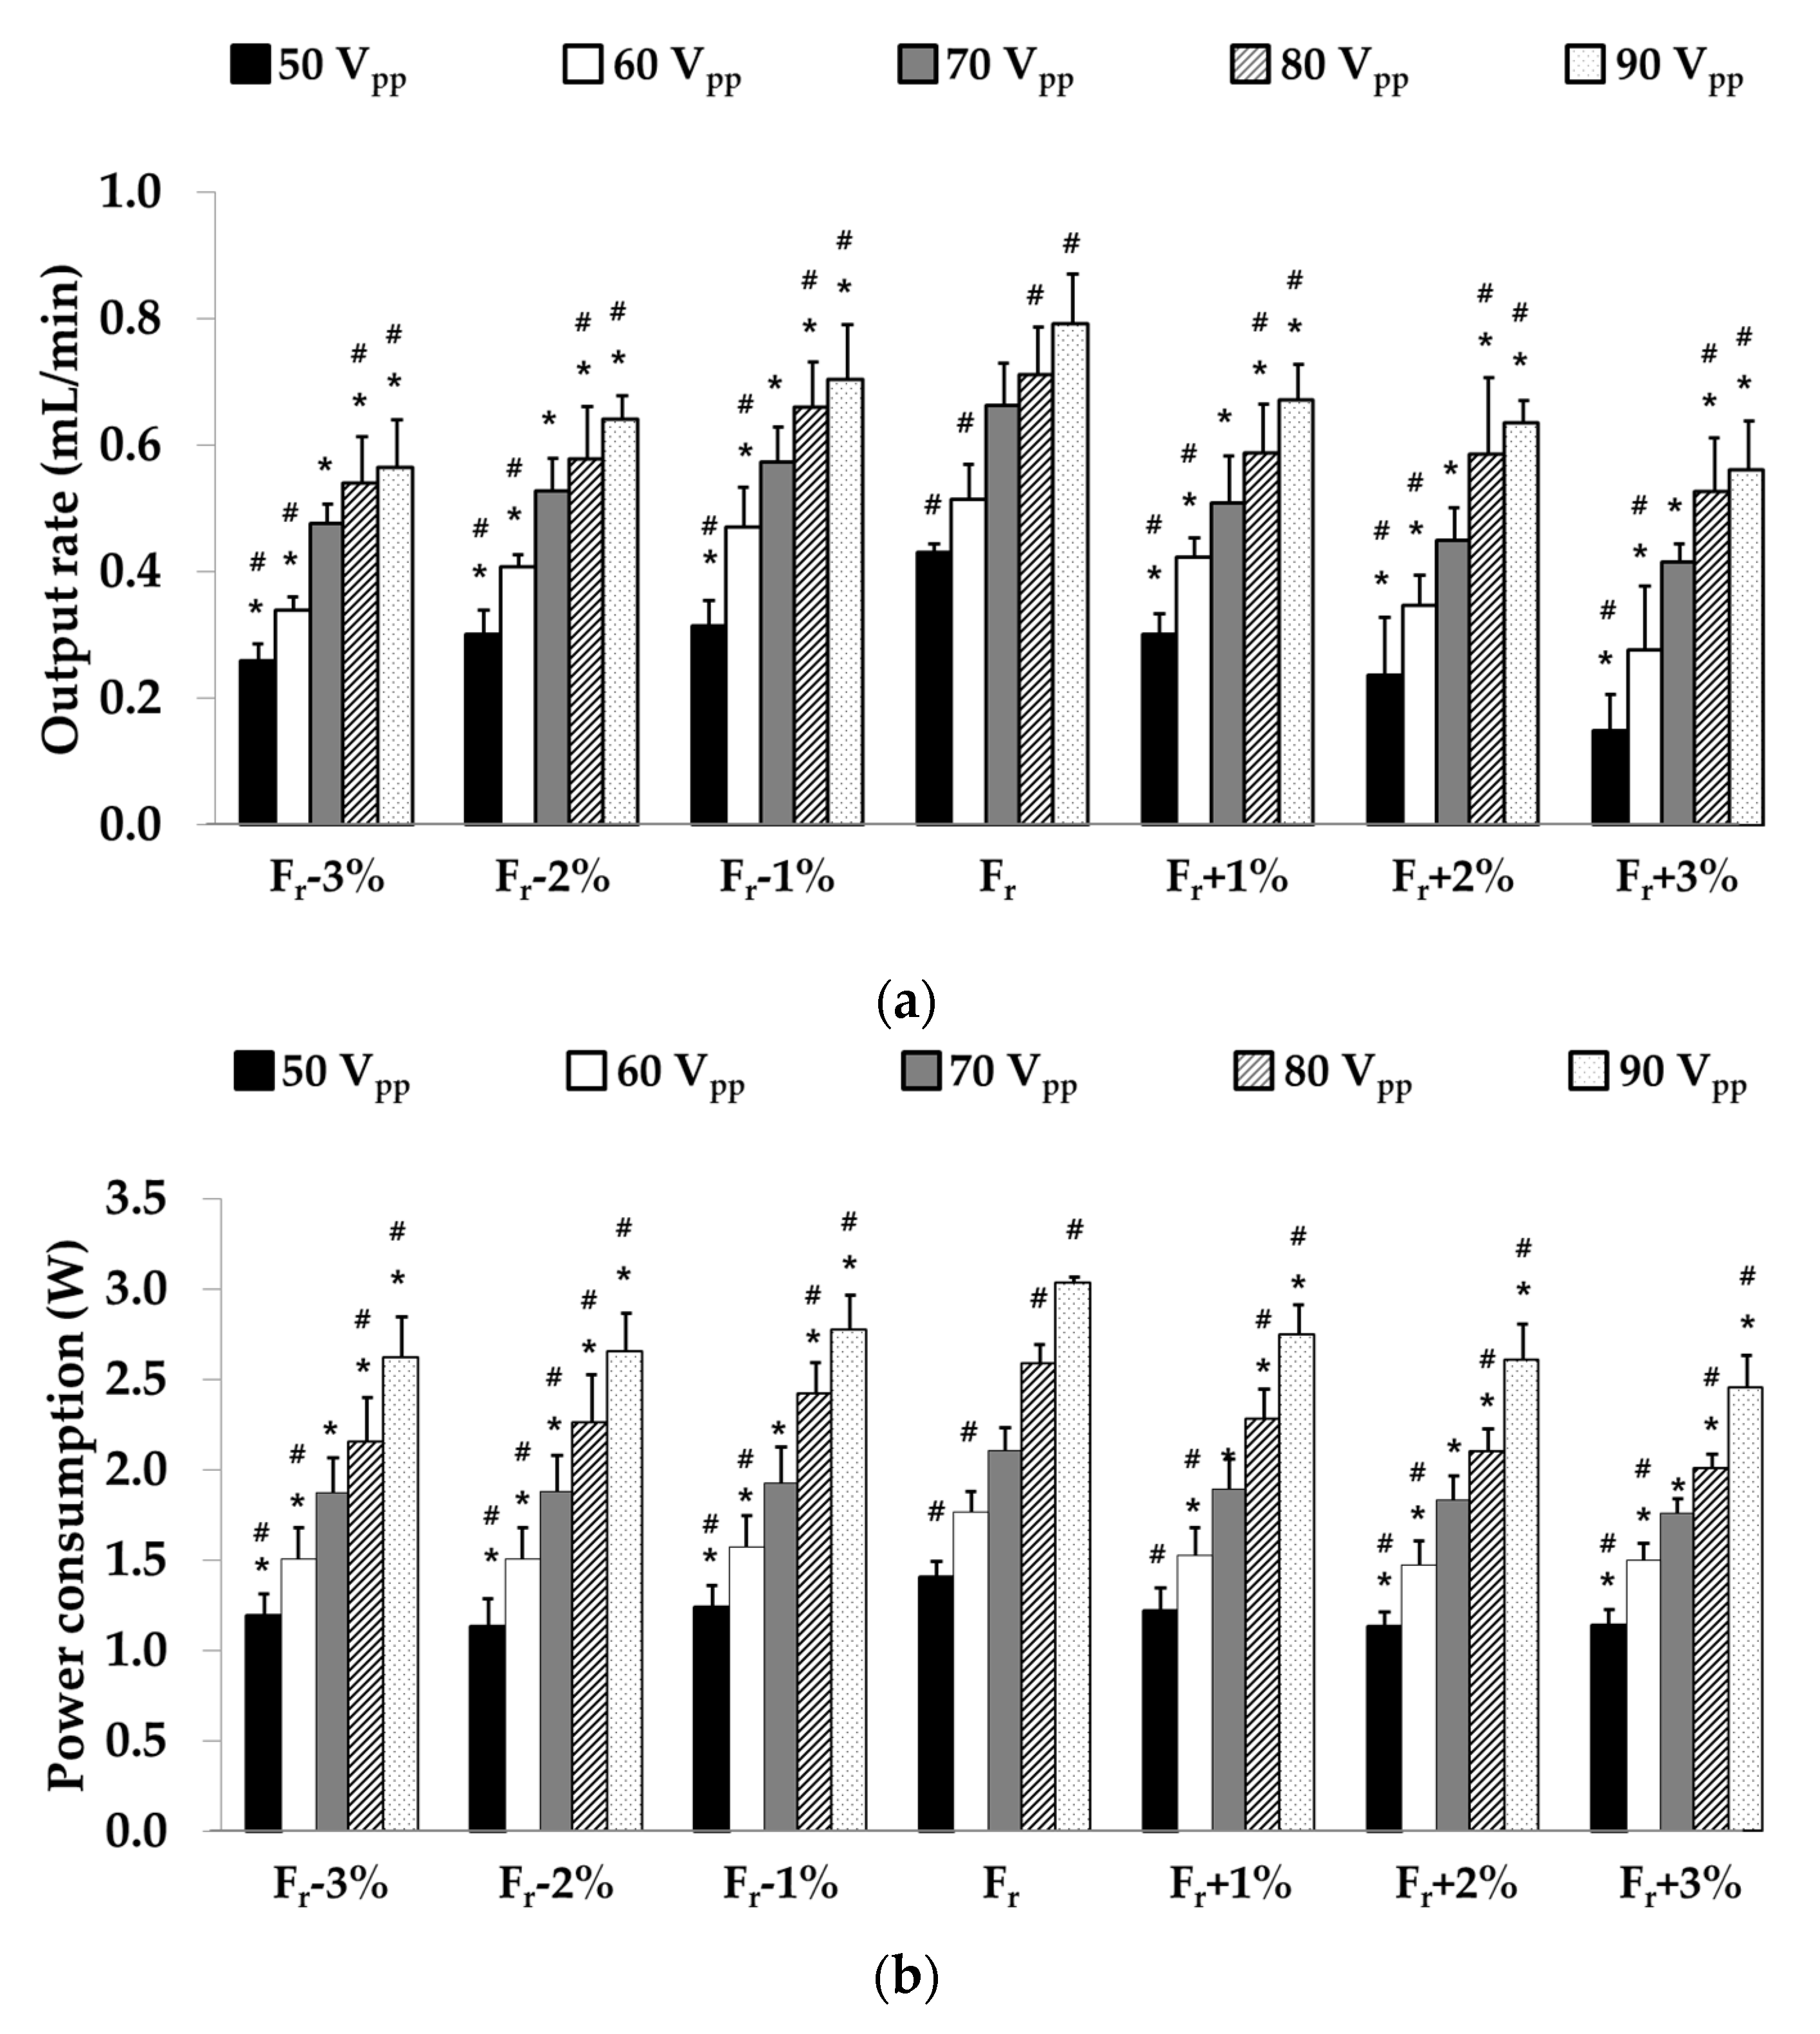
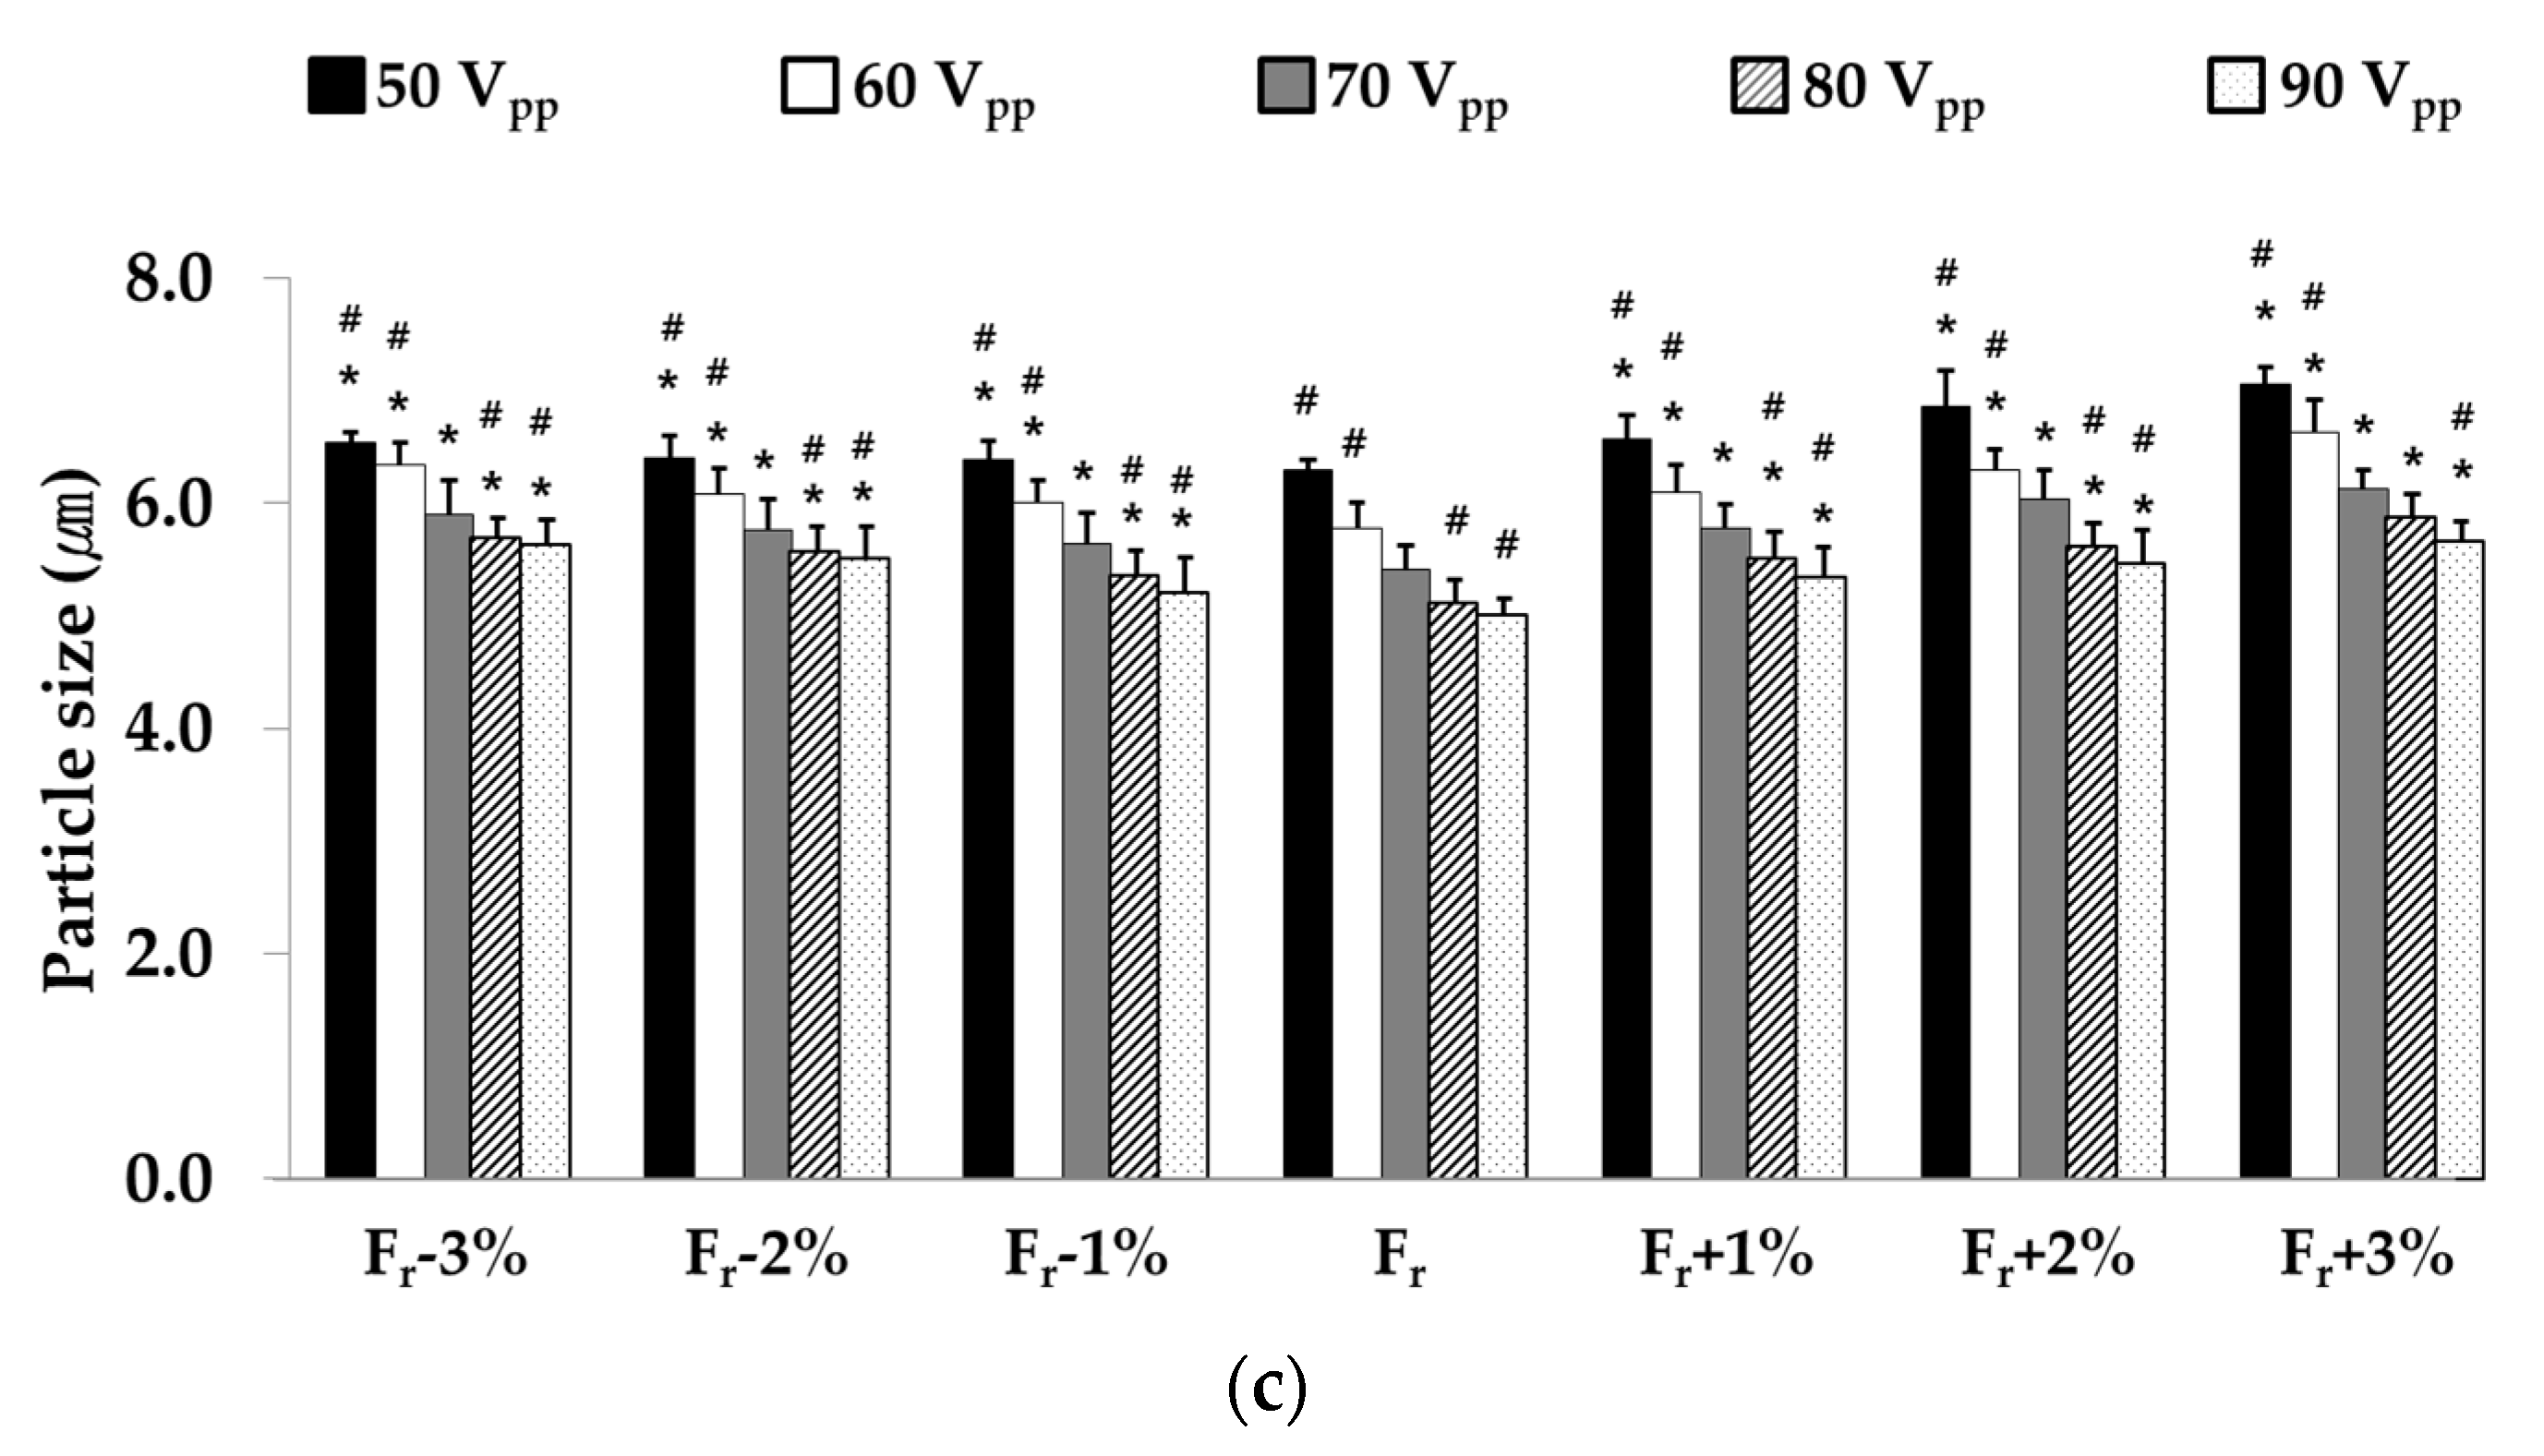
As shown in Figure 5, output rates and power consumption increased significantly as driving voltage increased. In Figure 5a, output rates for driving frequencies not equal to resonance frequencies were significantly reduced. Output rates were reduced by 11.0~30.1%, 17.5~45.2%, and 24.0~46.4% at driving frequency discrepancies of Fr ± 1%, 2%, and 3%, respectively. Percentage output rates versus output rates at maximum voltage 70 Vpp suggested by the manufacturer were −45.4~19.0%, −42.8~21.2%, −45.0~22.9%, −35.0~19.4%, −40.8~32.1%, 47.5~41.2%, and −64.0~35.4% at these driving frequency discrepancies, respectively. In Figure 5b, power consumptions decreased significantly at non-resonance driving frequencies and reduced by 6.6~13.6%, 9.5~19.2%, and 11.0~22.5% for driving frequency discrepancies of Fr ± 1%, 2%, and 3%, respectively. Power consumption changes were −36.4~39.5%, −39.4~41.2%, −35.6~44.0%, −33.4~44.0%, −35.7~44.9%, −38.1~42.2%, and −34.9~39.5% for 70 Vpp at these driving frequency discrepancies, respectively. Particle sizes were significantly greater at non-resonance driving frequencies at constant driving voltage (Figure 5c). Particle size increases by frequencies changes from the resonance frequency were 1.6~7.7%, 1.8~11.3%, 4.0~15.0% at Fr ± 1%, 2%, and 3%, respectively.

3.2. Resonance Frequency Changes by Impedance Matching

Resonance frequencies were determined before and after impedance matching (Table 3). Three PZT samples with the same nominal resonance frequency (135 ± 8 kHz) had different measured resonance frequencies. Resonance frequency differences were 2.4~2.9% after IM because of the inductance change caused by the transformer.

3.3. Dependence of Nebulization Characteristics on ARFT and IM

A shown in result Section 3.1, significant changes in nebulization characteristics were observed when driving frequency was altered by only ± 1%. Resonance frequencies of PZTs are known to depend on temperature, pressure, and medium viscosity [5,6,17], which means the resonance frequencies of individual PZTs should be determined.
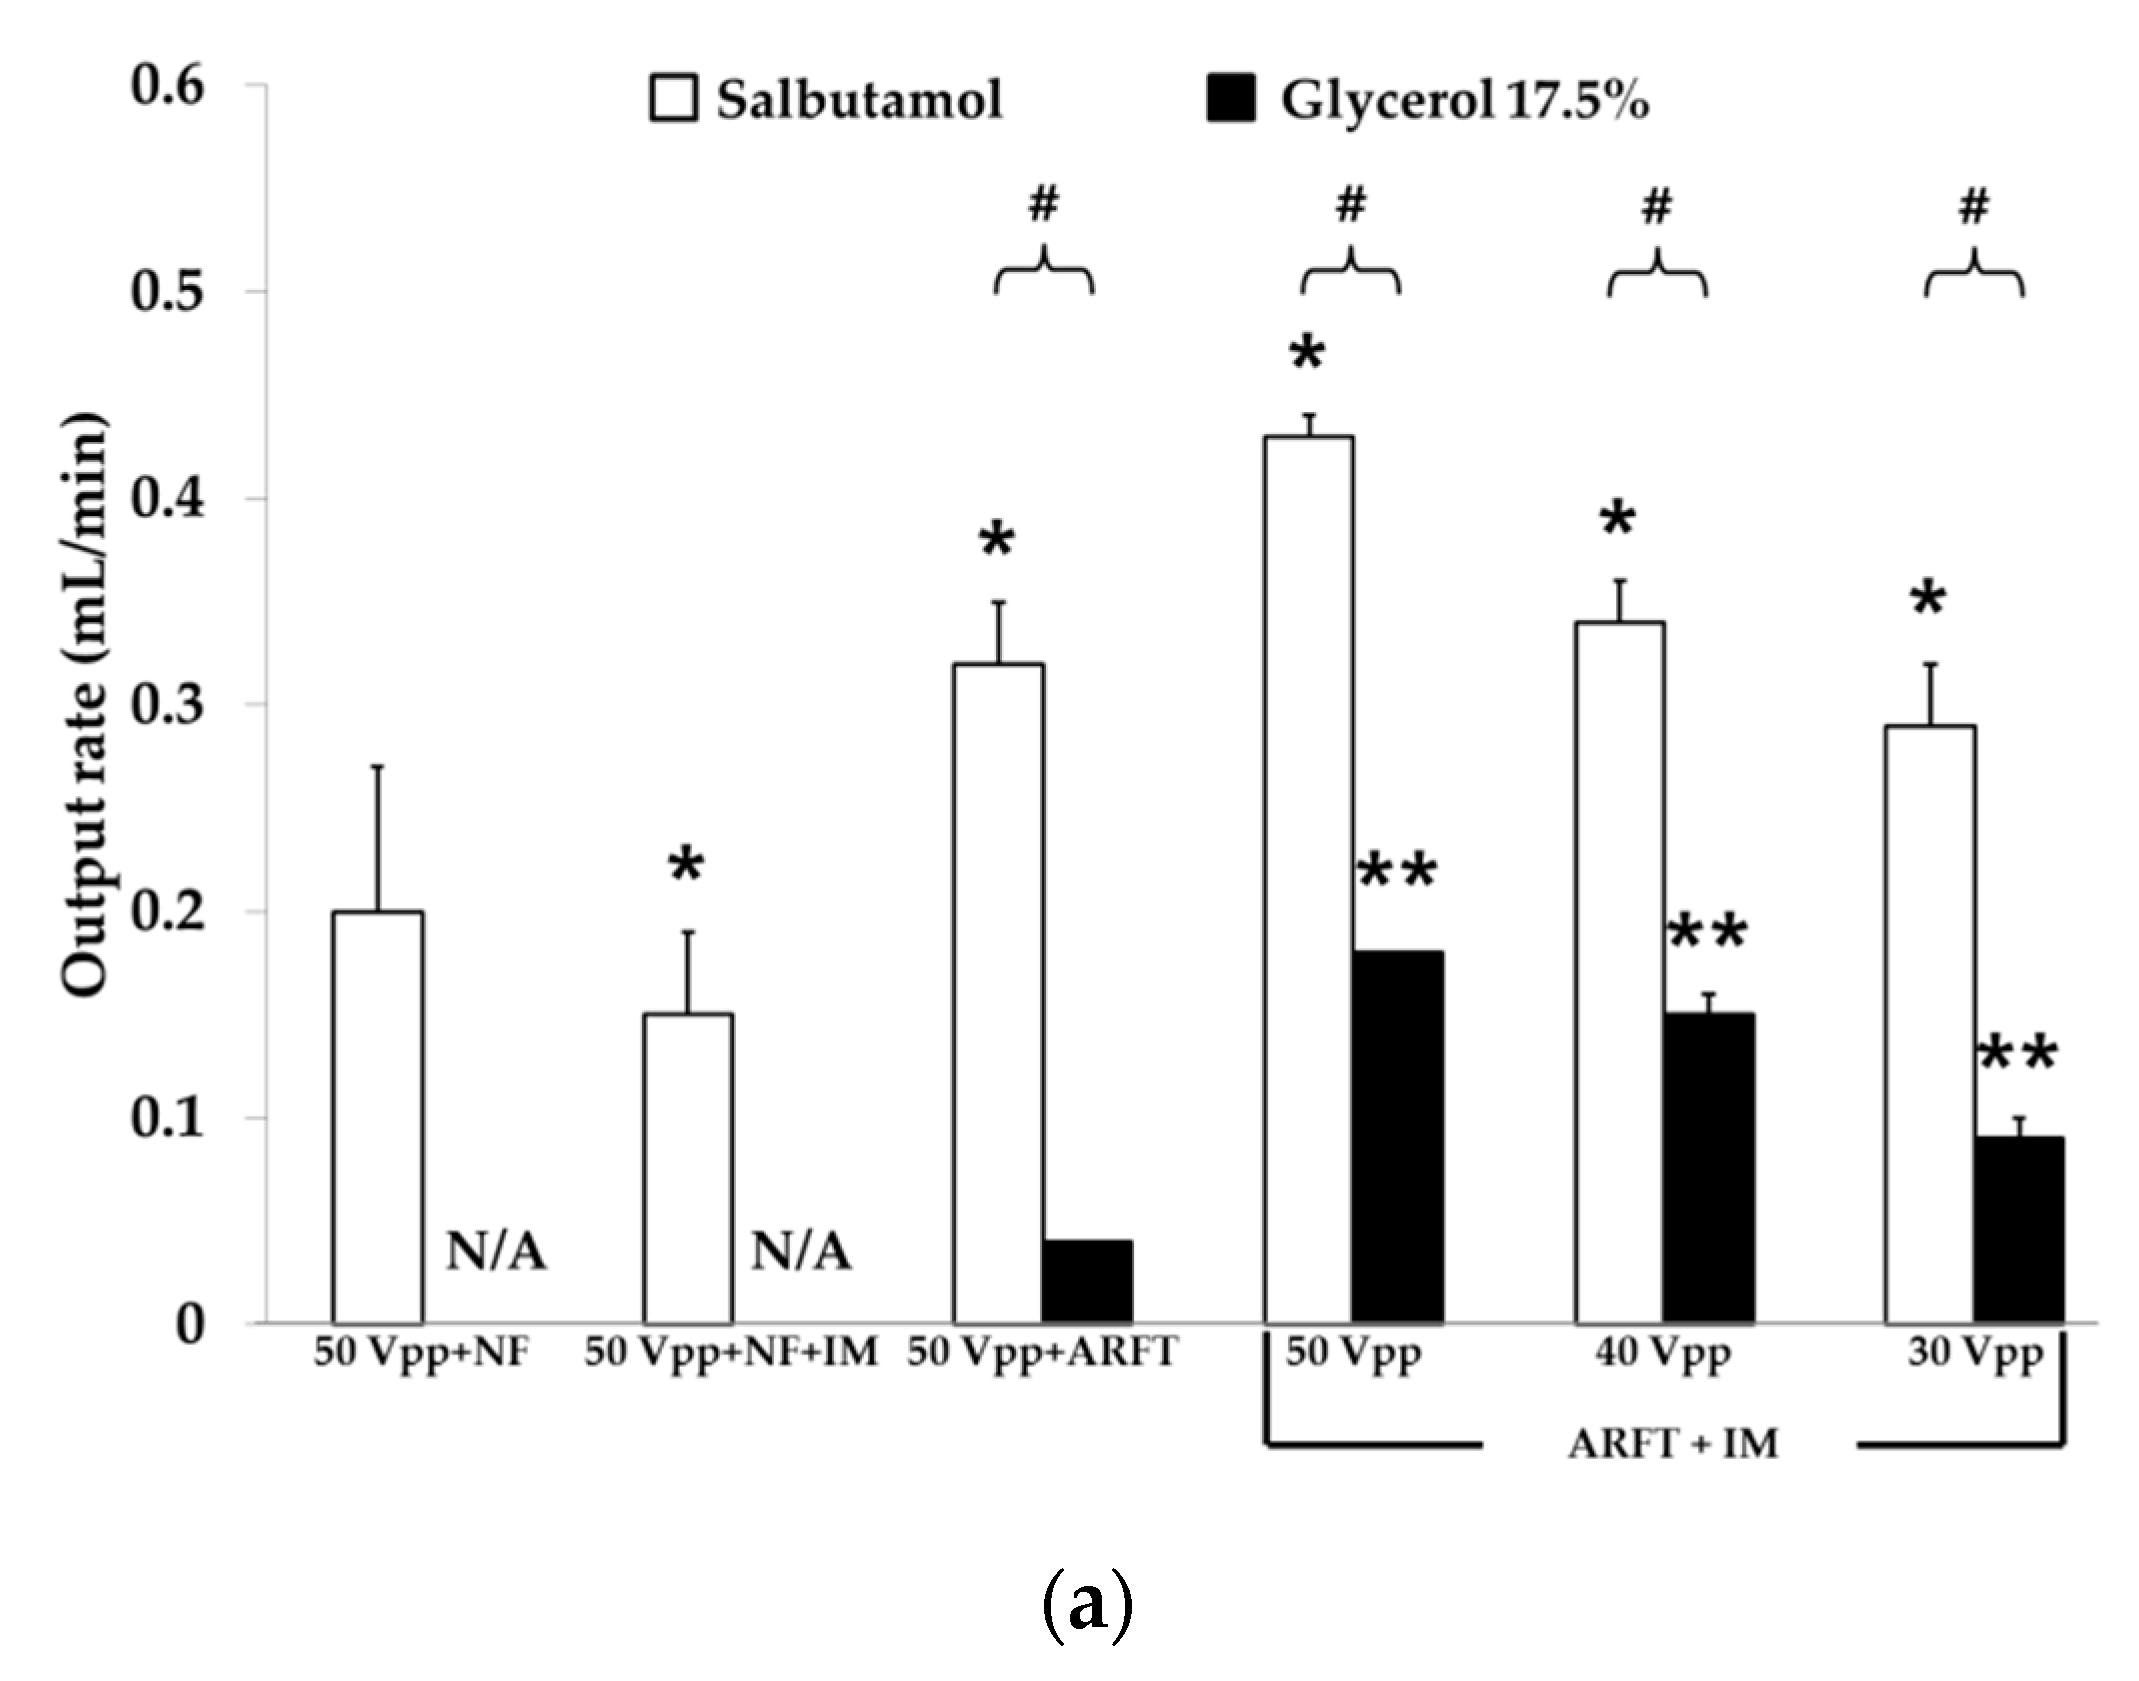
Figure 6 shows the effects of ARFT and IM on output rate, particle size, and power consumption. Experimental groups were compared with the control (50 Vpp and nominal resonance frequency (NF)). Figure 6a shows the output rate of ‘50 Vpp + NF + IM’, ‘50 Vpp + ARFT’, and ‘50 Vpp + ARFT + IM’ changed by −25%, 60%, and 115% versus the control. In combination, ARFT and IM increased output rates at the same driving voltage. The output rates of ‘ARFT + IM’ at 40 and 30 Vpp were 21% and 33% lower than at 50 Vpp. The output rate of ‘30 Vpp + ARFT + IM’ was 45% higher than that of the control. For glycerol solution, ‘50 Vpp + NF’ and ‘50 Vpp + ARFT + IM’ were not nebulized. The output rates of ‘ARFT + IM’ at 50, 40, and 30 Vpp were 350%, 275%, and 125% higher, respectively, than at ‘50 Vpp + ARFT’. Even when the driving frequency was at the resonance frequency, the amplitude of mesh vibration was not enough to nebulize glycerol solution. As shown in Figure 5a, the output rate of salbutamol solution was increased due to increasing driving voltage. We expect a commercial nebulizer output rate of >0.25 mL/min for the glycerol solution when a higher 50 Vpp is used in conjunction with ‘ARFT + IM’. The output rates of glycerol solution were compared with salbutamol solution for each experimental group (‘50 Vpp + ARFT’, ‘50 Vpp + ARFT + IM’, ‘40 Vpp + ARFT + IM’, and ‘30 Vpp + ARFT + IM’) and were 87.5%, 58.1%, 55.9%, and 69.0% lower, respectively.
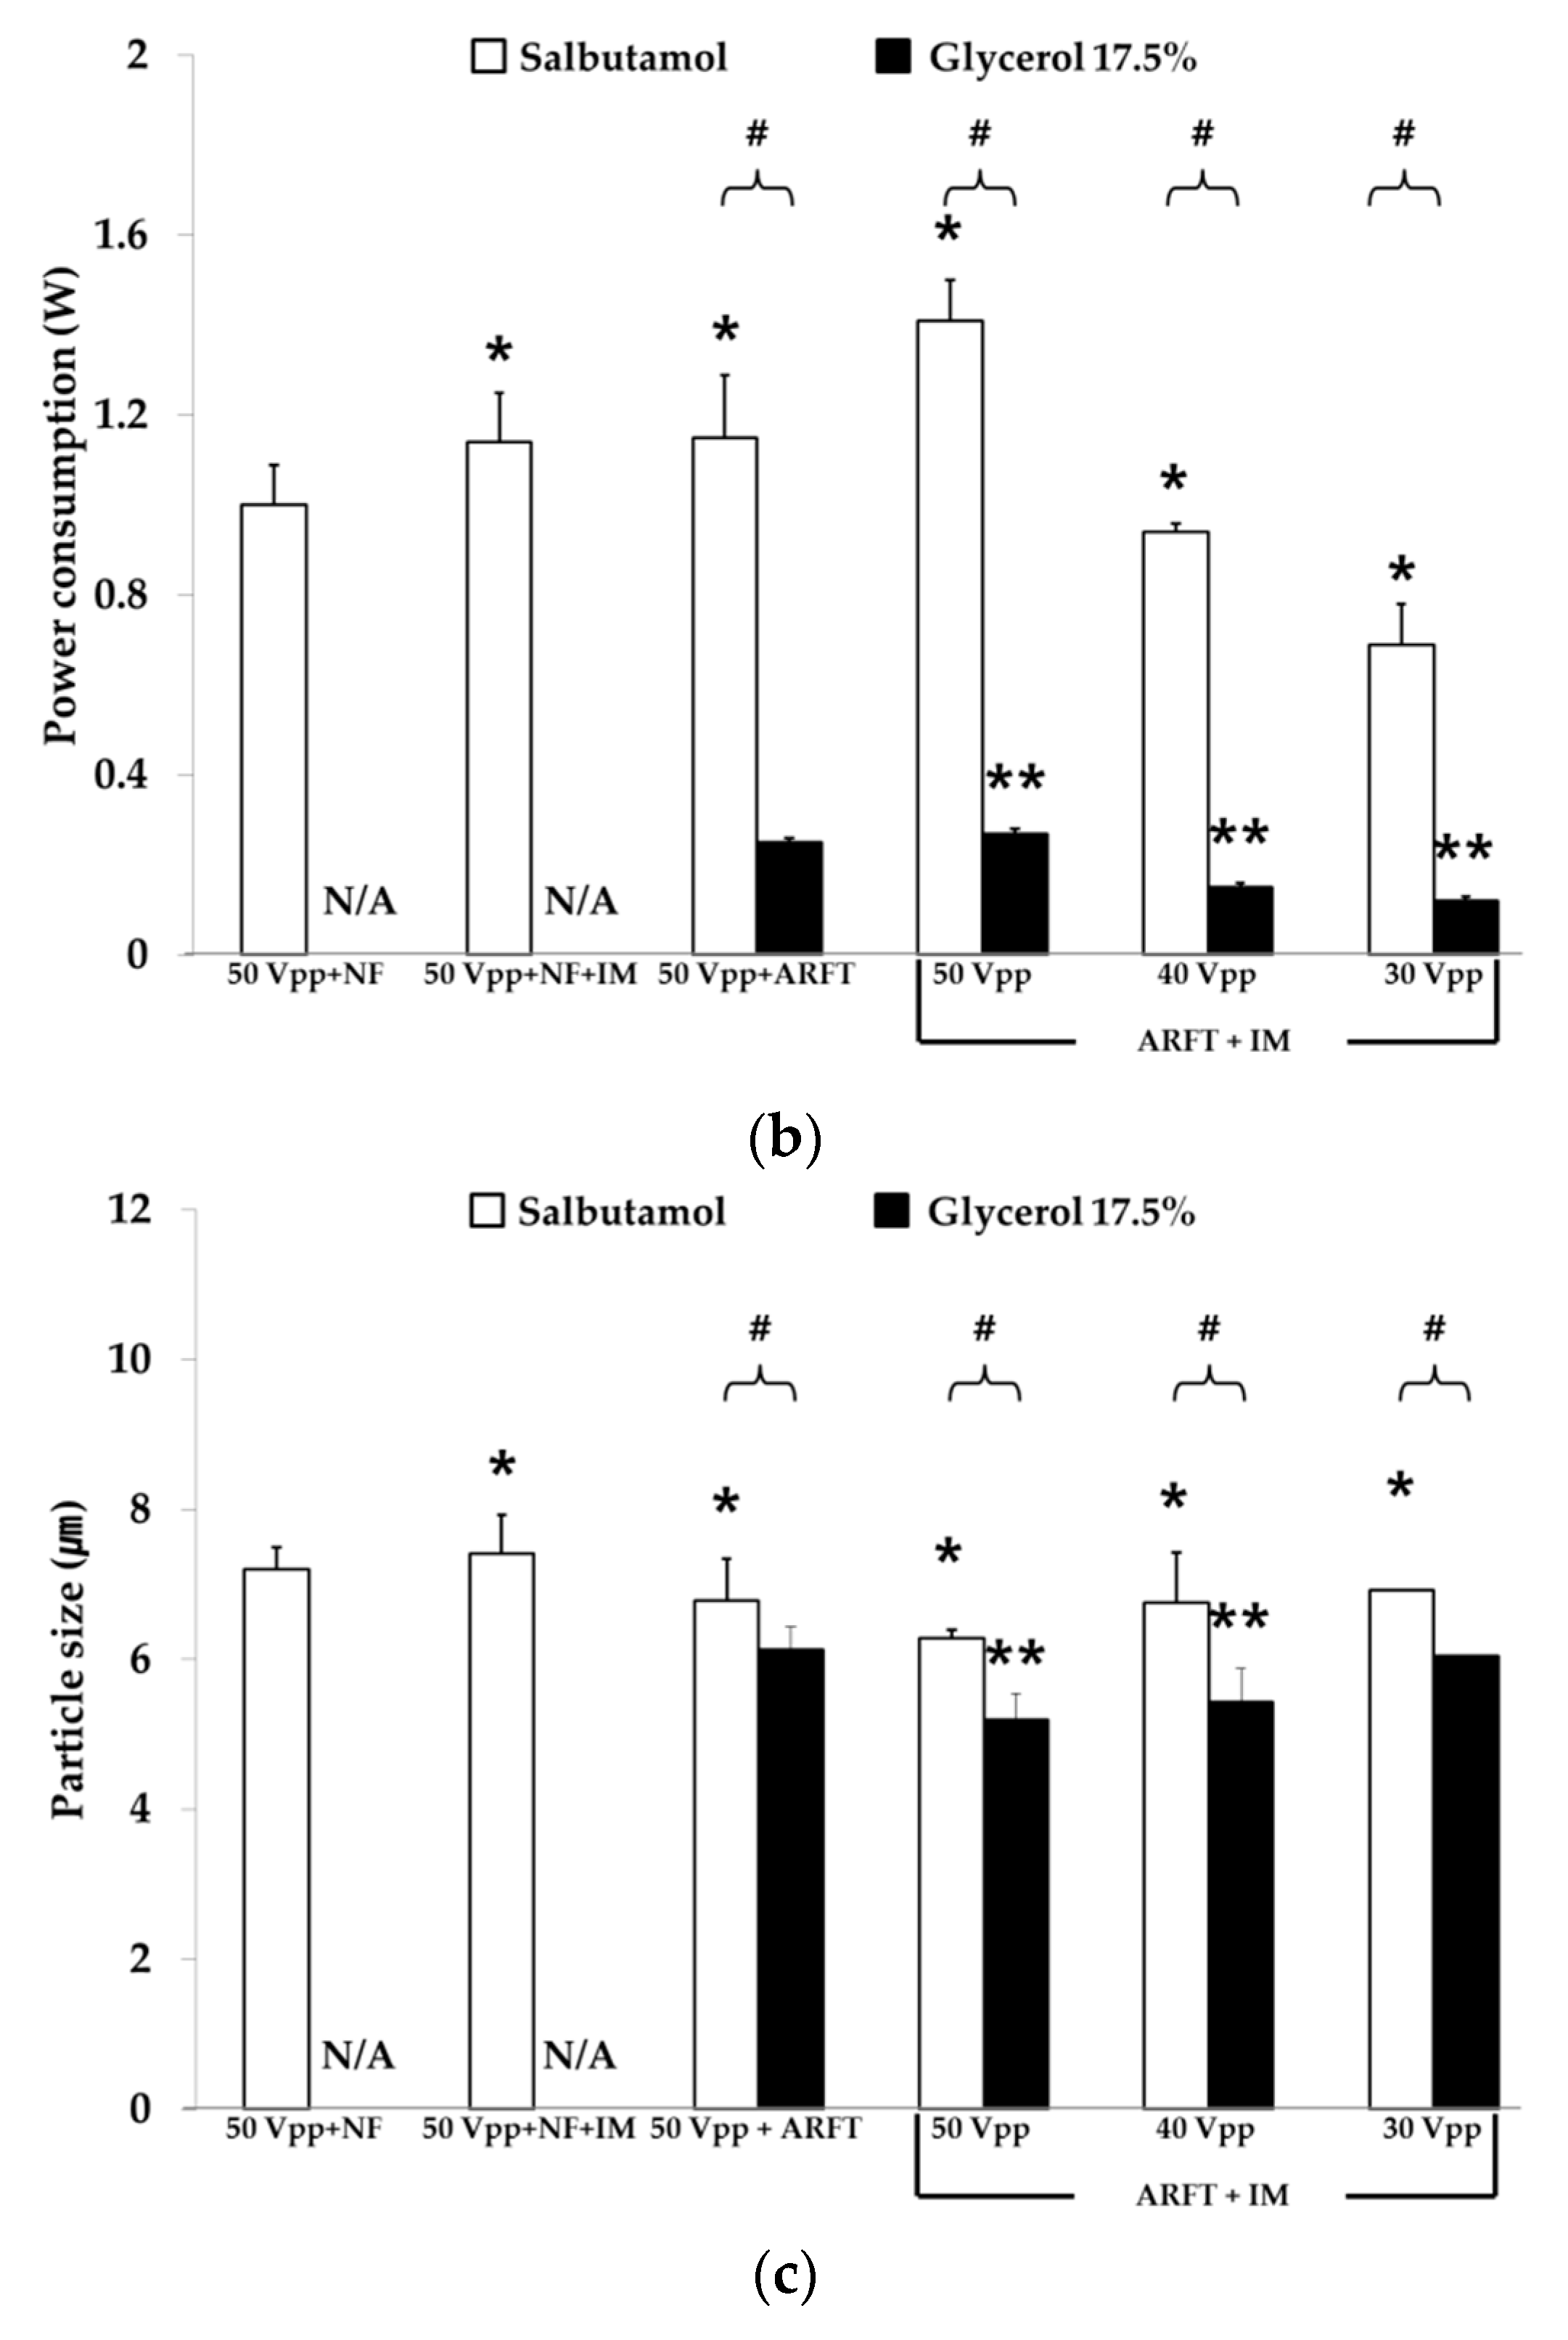
Power consumptions of ‘50 Vpp + NF + IM’, ‘50 Vpp + ARFT’, and ‘50 Vpp + ARFT + IM’ were 14%, 15%, and 41% higher than that of the control (Figure 6b), which means that ARFT and IM raised power transfer by matching output impedances of the driving system and the PZT. The power consumptions of ‘ARFT + IM’ at 40 and 30 Vpp were −6 and −31% that of the control, respectively. Considering the tradeoff between output rate and power consumption, ‘30 Vpp + ARFT + IM’ was deemed acceptable for the achievement of the minimum requirement because it had an output rate of >0.29 mL/min and 0.69 W. For glycerol solution, power consumptions of ‘ARFT + IM’ at 50, 40, and 30 Vpp were 8%, −40%, and −52%, respectively, compared with ‘50 Vpp + ARFT’. ‘ARFT + IM’ was more effective at decreasing power consumption than ARFT. Power consumptions required for the nebulization of glycerol solution in the experimental groups were 78.3%, 80.9%, 84.0%, and 82.6% lower than in the correlation salbutamol experimental groups’. These results suggested that the energy transfer to the PZT was reduced by the viscous solution because of the impedance change [18,19].
In Figure 6c, particle sizes (MMDs) of ‘50 Vpp + NF’, ‘50 Vpp + NF + IM’, ‘50 Vpp + ARFT’, and ‘50 Vpp + ARFT + IM’ were 7.20, 7.42, 6.78, and 6.29 μm, respectively, for salbutamol solution. These results show the ARFT and IM might reduce particle size. The particle sizes of ‘ARFT + IM’ at 50, 40, and 30 Vpp for salbutamol solution were 6.29, 6.76, and 6.92 μm, respectively. Considering output rate and power consumption, ‘30 Vpp + ARFT + IM’ was acceptable. The particle size requirement in ISO 27427:2013 is a mass median aerodynamic diameter (MMAD) of <5 μm, which is 29% smaller than MMD for salbutamol [30,31]. In addition, particle size could be reduced by increasing driving voltage (Figure 5c). For glycerol solution, particle sizes of ‘50 Vpp + ARFT’, ‘ARFT + IM’ at 50, 40, and 30 Vpp were 6.13, 5.20, 5.44, and 6.05 μm, respectively. The particle sizes of glycerol solution in the experimental groups were 9.6%, 21.9%, 19.5%, and 12.6%, respectively, less than that of salbutamol.
In Figure 7, the temperature of saline and glycerol was increased to 36.3 °C and 32.1 °C, respectively. The unfolding temperature of proteins, such as chymotrypsin, insulin, BSA, candida cylindracea lipase, and citrate synthase, was 48~77 °C [1,32,33].

4. Discussion

The driving frequency of the PZT used in the present study was 127~143 kHz, that is, 6% removed from its nominal frequency of 135 kHz. Measured resonance frequencies of before and after impedance matching differed by −7.3~13.3% and 4.4~10.4%, respectively. Driving voltage and frequency significantly influenced output rates, power consumptions, and particle sizes. As the driving voltage increased, particle size decreased significantly, presumably because higher driving voltages deformed the nebulizing mesh [14,16]. For a difference of only 1% in resonance frequency, output rates decreased by 11.0~30.1%, particle sizes increased by 1.6~7.7%, and power consumption increased by 6.6~13.6%.
The PZT resonance frequencies were sensitive to medium temperature, pressure, and viscosity. In addition, changes in resonance frequency due to IM should be considered. Because it is not practical to determine the actual resonance frequencies of every PZT and adjust driving frequencies accordingly, we propose using ARFT. In combination, ARFT and IM provided better glycerol nebulization, higher output rates, and smaller particle sizes, but increased power consumptions. Driving with ‘30 Vpp + ARFT + IM’ decreased power consumption by 31% and increased output rate by 45% compared with 50 Vpp at a nominal resonance frequency. Commercial nebulizers have an output rate of about 0.25 mL/min and power consumption of 1.4~2 W. ‘30 Vpp + ARFT + IM’ produced an output rate of 0.29 mL/min at 0.69 W for salbutamol solution, which means ‘ARFT + IM’ enabled the use of lower voltages at power consumptions but maintained performance and extended battery lifetime. Ghazanfari et al. showed that higher concentrations of glycerol reduced output rates [5], and in the present study, glycerol output rates were lower than salbutamol output rates, and the use of ‘ARFT + IM’ increased output rates.
The limitations of this study are that only one type of PZT was tested, particle sizes were evaluated by MMD instead of MMAD, and the same impedance matching transformer was used for salbutamol and glycerol nebulization. Although the driving voltages used were up to 50 Vpp (Figure 6) in glycerol solution, higher output rates are expected by higher driving voltage.

5. Conclusions

The resonance frequency and driving voltage should be considered for optimal nebulization performance. Automatic resonance frequency tuning could enhance nebulization performances in terms of output rates, particle sizes, and power consumption compared with those achieved when nominal resonance frequencies without impedance matching are used. Our findings showed that the use of ARFT and IM improves nebulization characteristics at lower power consumption levels.

Author Contributions

S.-H.M., K.H.C., H.M.P., B.J.P., K.C.N. planned and performed experiments; S.-H.M., K.H.C., K.C.N. analyzed and calculated the data; S.-H.M., K.H.C., H.M.P., B.J.P., K.C.N., S.K.Y. wrote, reviewed, and revised the paper. All authors have read and agreed to the published version of the manuscript.

Funding

This work was supported by the National Research Foundation (NRF) grant funded by the Korea government (MSIT) (NRF-2020R1A2C1101048).

Conflicts of Interest

The authors have no conflict of interest to declare.

References

  1. Ari, A. Jet, ultrasonic, and mesh nebulizers: An evaluation of nebulizers for better clinical outcomes. Eurasian J. Pulmonol. 2014, 16, 1–7. [Google Scholar] [CrossRef]
  2. Newman, S.P.; Clark, S.W. Therapeutic aerosols 1-physical and practical considerations. Thorax 1983, 38, 881–886. [Google Scholar] [CrossRef] [PubMed] [Green Version]
  3. Pitance, L.; Vecellio, L.; Leal, T.; Reychler, G.; Reychler, H.; Liistro, G. Delivery efficacy of a vibrating mesh nebulizer and a jet nebulizer under different configurations. J. Aerosol. Med. Pulm. Drug Deliv. 2010, 23, 389–396. [Google Scholar] [CrossRef] [PubMed]
  4. Dolovich, M.B.; Dhand, R. Aerosol drug delivery: Developments in device design and clinical use. Lancet 2011, 377, 1032–1045. [Google Scholar] [CrossRef]
  5. Ghazanfari, T.; Elhissi, A.M.A.; Ding, Z.; Taylor, K.M.G. The influence of fluid physicochemical properties on vibrating-mesh nebulization. Int. J. Pharm. 2007, 339, 103–111. [Google Scholar] [CrossRef] [PubMed]
  6. Hertel, S.P. Pulmonary Delivery of Pharmaceutical Proteins by Means of Vibrating Mesh Nebulization. Ph.D. Thesis, Ludwig Maximillian University of Munich, Munich, Germany, 7 July 2014. [Google Scholar]
  7. Choi, K.H.; Moon, S.H.; Park, S.K.; Cho, G.; Nam, K.C.; Park, B.J. Fabrication and Characterization of Medical Mesh-Nebulizer for Aerosol Drug Delivery. Appl. Sci. 2018, 8, 604. [Google Scholar] [CrossRef] [Green Version]
  8. Shen, S.C. A new cymbal-shaped high power microactuator for nebulizer application. Microelectron. Eng. 2010, 87, 89–97. [Google Scholar] [CrossRef]
  9. Olszewski, O.Z.; MacLoughlin, R.; Blake, A.; O’Neill, M.; Mathewsona, A.; Jacksona, N. A silicon-based MEMS vibrating mesh nebulizer for inhaled drug delivery. Procedia Eng. 2016, 168, 1521–1524. [Google Scholar] [CrossRef]
  10. Huang, J.; Chen, C. Microelectroforming of a nickel nozzle plate featured with anti-stiction for a piezoelectric atomizer. In Proceedings of the 8th Annual IEEE International Conference on Nano/Micro Engineered and Molecular Systems, Suzhou, China, 7–10 April 2013; pp. 490–493. [Google Scholar]
  11. Lin, C.; Meng, H.; Fu, C. An ultrasonic aerosol therapy nebulizer using electroformed palladium–nickel alloy nozzle plates. Sens. Actuator A Phys. 2011, 169, 187–193. [Google Scholar] [CrossRef]
  12. Shen, S.; Wang, Y.; Chen, Y. Design and fabrication of medical micro-nebulizer. Sens. Actuator A Phys. 2008, 144, 135–143. [Google Scholar] [CrossRef]
  13. Zhang, G.; David, A.; Wiedmann, T.S. Performance of the vibrating membrane aerosol generation device: Aeroneb micropump nebulizer™. J. Aerosol. Med. 2007, 20, 408–416. [Google Scholar] [CrossRef] [PubMed]
  14. Yan, Q.; Wu, C.; Zhang, J. Effect of the dynamic cone angle on the atomization performance of a piezoceramic vibrating mesh atomizer. Appl. Sci. 2019, 9, 1836. [Google Scholar] [CrossRef] [Green Version]
  15. Kuo, Y.; Chan, W.; Lin, C.; Huang, S.; Chen, C. Characterization of Vibrating Mesh Aerosol Generators. Aerosol. Air Qual. Res. 2019, 19, 1678–1687. [Google Scholar] [CrossRef] [Green Version]
  16. Yan, Q.; Sun, W.; Zhang, J. Study on the Influencing Factors of the Atomization Rate in a Piezoceramic Vibrating Mesh Atomizer. Appl. Sci. 2020, 10, 2422. [Google Scholar] [CrossRef] [Green Version]
  17. Huynh, T.; Kim, J.T. Quantification of temperature effect on impedance monitoring via PZT interface for prestressed tendon anchorage. Smart Mater. Struct. 2017, 26, 1–19. [Google Scholar] [CrossRef]
  18. Wang, G.; Tan, C.; Li, F. A contact resonance viscometer based on the electromechanical impedance of a piezoelectric cantilever. Sens. Actuator A Phys. 2017, 267, 401–408. [Google Scholar] [CrossRef]
  19. Shih, W.Y.; Li, X.; Gu, H.; Shih, W.; Aksay, I.A. Simultaneous liquid viscosity and density determination with piezoelectric unimorph cantilevers. J. Appl. Phys. 2001, 89, 1497–1505. [Google Scholar] [CrossRef] [Green Version]
  20. Boontaklang, S.; Chompoo-Inwai, C. Automatic Resonance-Frequency Tuning and Tracking Technique for a 1MHz Ultrasonic-Piezoelectric-Transducer Driving Circuit in Medical Therapeutic Applications Using dsPIC Microcontroller and PLL Techniques. Int. J. Intell. Eng. Syst. 2019, 12, 14–24. [Google Scholar] [CrossRef]
  21. Hawkins, B.; Feng, Z. AN2265: Vibrating Mesh Nebulizer Reference Design. Available online: http://ww1.microchip.com/downloads/en/AppNotes/00002265B.pdf (accessed on 11 December 2020).
  22. Rathod, V.T. A Review of Electric Impedance Matching Techniques for Piezoelectric Sensors, Actuators and Transducers. Electronics 2019, 8, 169. [Google Scholar] [CrossRef] [Green Version]
  23. Garcia-Rodriguez, M.; Garcia-Alvarez, J.; Yanez, Y.; Garcia-Hernandez, M.J.; Salazar, J.; Turo, A.; Chavez, J.A. Low cost matching network for ultrasonic transducers. Phys. Procedia 2010, 3, 1025–1031. [Google Scholar] [CrossRef] [Green Version]
  24. Yang, K.C. Use Resonance with a High-Voltage Piezo Driver. Available online: https://www.electronicdesign.com/power-management/article/21808584/use-resonance-with-a-highvhighvo-piezo-driver (accessed on 11 December 2020).
  25. Rodal, J.J.A. Mach effect propulsion, an exact electroelasticity solution. In Proceedings of the Estes Park Advanced Propulsion Workshop, Mojave, NY, USA, 1–3 November 2017; pp. 127–136. [Google Scholar]
  26. Tandon, R.; McPeck, M.; Smaldone, G.C. Measuring Nebulizer Output Aerosol Production vs Gravimetric Analysis. Chest 1997, 111, 1361–1365. [Google Scholar] [CrossRef] [PubMed] [Green Version]
  27. Chang, K.H.; Moon, S.; Oh, J.Y.; Yoon, Y.; Gu, N.; Lim, C.; Park, B.J.; Nam, K.C. Comparison of Salbutamol Delivery Efficiency for Jet versus Mesh Nebulizer Using Mice. Pharmaceutics 2019, 11, 192. [Google Scholar] [CrossRef] [Green Version]
  28. Chang, K.H.; Moon, S.; Yoo, S.K.; Park, B.J.; Nam, K.C. Aerosol Delivery of Dornase Alfa Generated by Jet and Mesh Nebulizers. Pharmaceutics 2020, 12, 721. [Google Scholar] [CrossRef] [PubMed]
  29. Song, X.; Hu, J.; Zhan, S.; Zhang, R.; Tan, W. Effects of Temperature and Humidity on Laser Diffraction Measurements to Jet Nebulizer and Comparison with NGI. AAPS PharmSciTech 2016, 17, 380–388. [Google Scholar] [CrossRef] [PubMed] [Green Version]
  30. ISO 27427:2013. Anaesthetic and Respiratory Equipment—Nebulizing Systems and Components; International Organization for Standardization ISO Central Secretariat: Geneva, Switzerland, 2013. [Google Scholar]
  31. Kwong, W.T.; Ho, S.L.; Coates, A.L. Comparison of nebulized particle size distribution with Malvern laser diffraction analyzer versus Andersen cascade impactor and low-flow Marple personal cascade impactor. J. Aerosol. Med. 2000, 13, 303–314. [Google Scholar] [CrossRef]
  32. Cipollar, D.C.; Clark, A.R.; Chan, H.-K.; Gonda, I.; Shire, S.J. Assessment of aerosol delivery systems for recombinant human deoxyribonuclease. STP Pharma Sci. 1994, 4, 50–62. [Google Scholar]
  33. Zeles-Hahn, M.; Anchordoquy, T.J.; Lengsfeld, C.S. Observations on the impact of aerosolization on macromolecular therapeutics. In Proceedings of the European Conference on Liquid Atomization and Spray-Systems, Como lake, Italy, 8–10 September 2008; pp. 8–13. [Google Scholar]
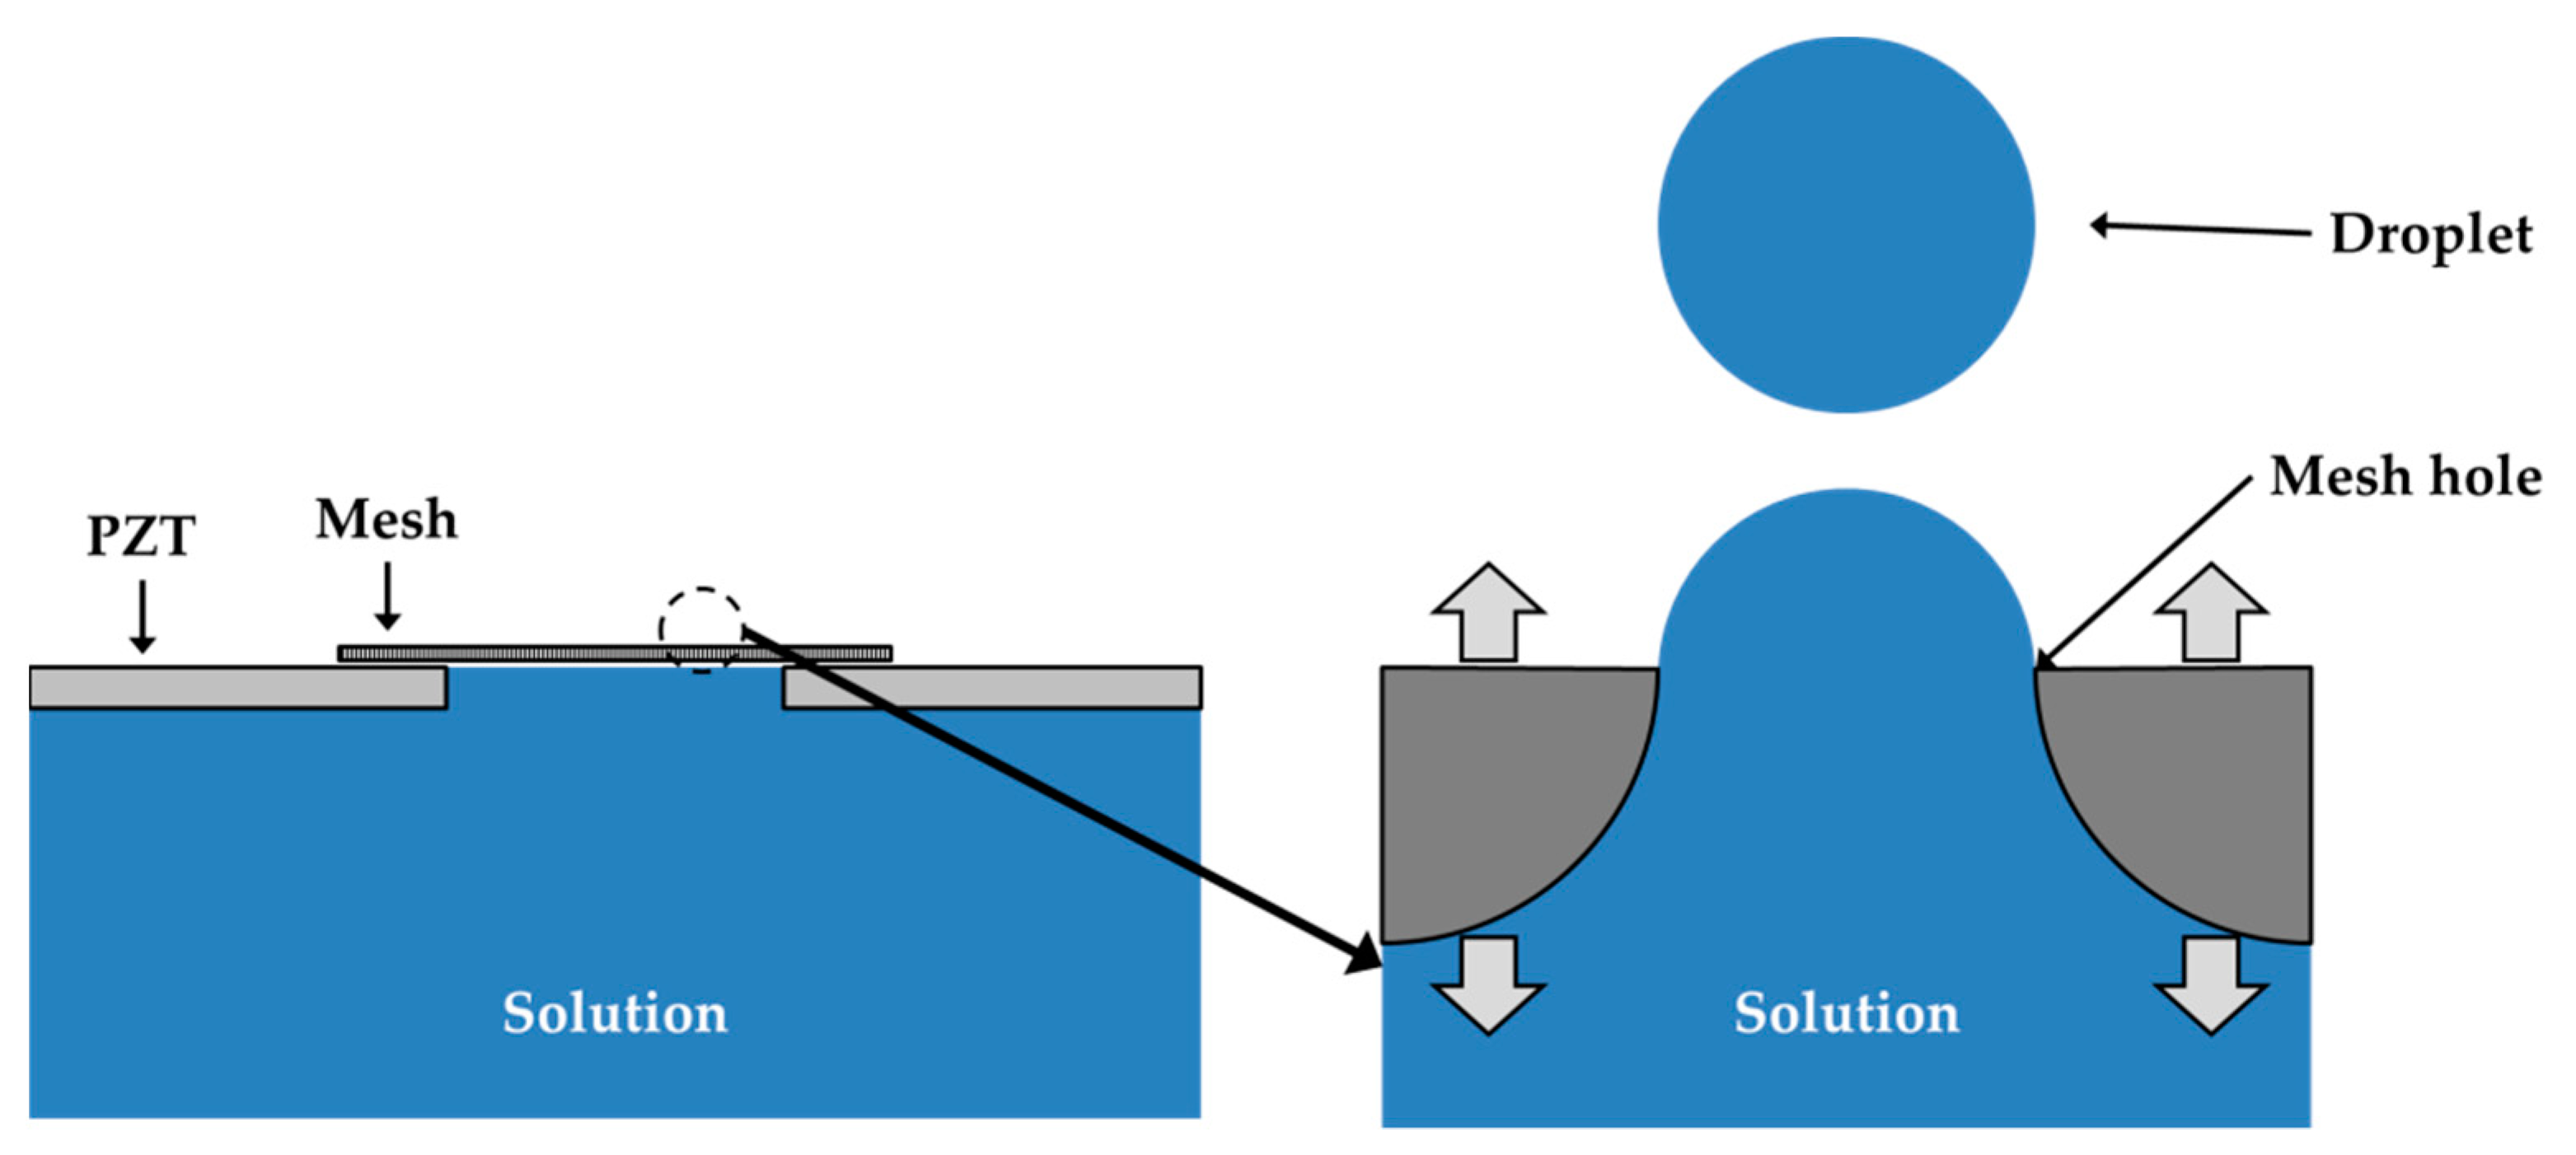
Figure 1. Vibrating mesh nebulizer working principle.
Applsci 11 01296 g001
Figure 2. Piezoelectric ceramic (PZT) and metal mesh module dimension.
Applsci 11 01296 g002
Figure 3. Automatic resonance frequency tuning algorithm [21].
Applsci 11 01296 g003
Figure 4. Experiment setting for measuring output rates, particle sizes, and power consumptions.
Applsci 11 01296 g004
Figure 5. Nebulization characteristics of salbutamol solution by driving frequency and voltage: (a) Output rates; (b) Power consumptions; (c) Particle sizes; All values are means ± SDs, * p < 0.05 versus Fr at each driving voltage, # p < 0.05 versus 70 Vpp at each driving frequency.
Applsci 11 01296 g005aApplsci 11 01296 g005b
Figure 6. Nebulization characteristics of salbutamol and glycerol solutions after automatic resonance frequency tuning (ARFT) and impedance matching (IM): (a) Output rates; (b) Power consumptions; (c) Particle sizes. Results are presented as means ± SDs. * p < 0.05 versus ‘50 Vpp + NF’ for salbutamol, ** p < 0.05 versus ‘50 Vpp + ARFT’ for glycerol, # p < 0.05 versus salbutamol.
Applsci 11 01296 g006aApplsci 11 01296 g006b
Figure 7. Temperature profile during nebulization.
Applsci 11 01296 g007
Table 1. Driving frequency and voltage conditions.
Voltage (Vpp)FrequencyImpedance Matching
50~90 (10 Vpp interval)Resonance frequency (Fr)Applied
Fr ± 3% (1% interval)
Table 2. Effects of automatic resonance frequency tuning (ARFT) and impedance matching (IM) on experimental conditions.
Experimental ConditionPurpose
50 Vpp + Nominal resonance frequency (NF)Control
50 Vpp + NF + Impedance matching (IM)IM effect
50 Vpp + Automatic resonance frequency tuning (ARFT)ARFT effect
50 Vpp + ARFT + IMARFT + IM effect
40 Vpp + ARFT + IMARFT + IM + driving voltage effect
30 Vpp + ARFT + IMARFT + IM + driving voltage effect
Table 3. Resonance frequencies of piezoelectric ceramics (PZTs) before and after impedance matching.
PZT SampleResonance Frequency (kHz)
Before Impedance MatchingAfter Impedance Matching
#1144.80 ± 0.49141.30 ± 0.36
#2148.32 ± 0.26144.10 ± 0.15
#3153.47 ± 0.01149.00 ± 0.00
Publisher’s Note: MDPI stays neutral with regard to jurisdictional claims in published maps and institutional affiliations.