
Flexural Behavior of Reinforced Concrete Beams Retrofitted with Modularized Steel Plates


Abstract
:1. Introduction
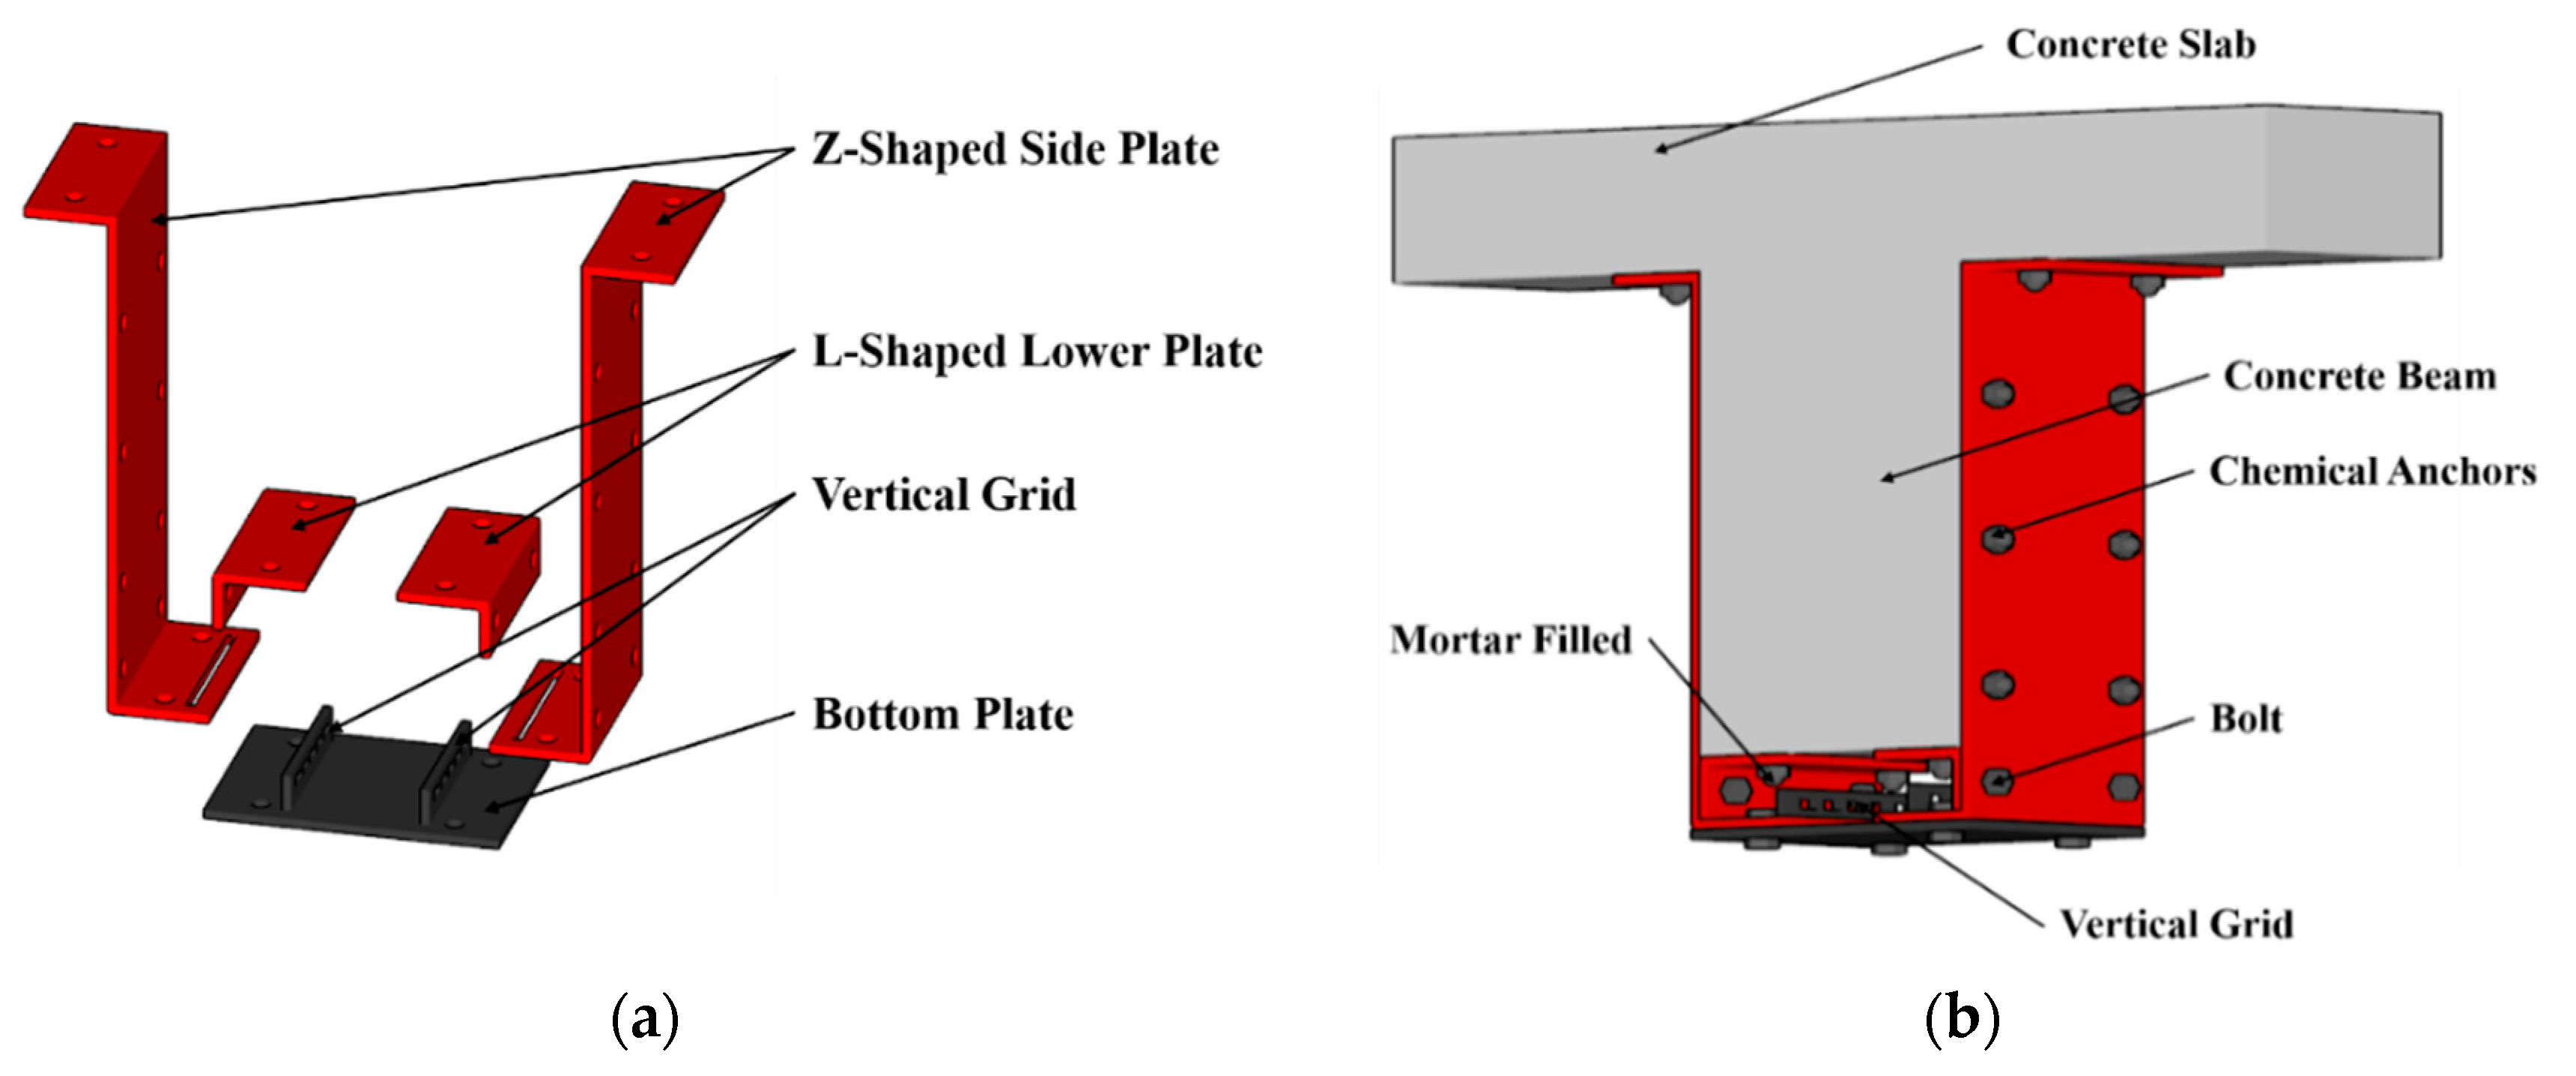
2. The Retrofitting Method for Reinforced Concrete Beams
3. Parametric Studies
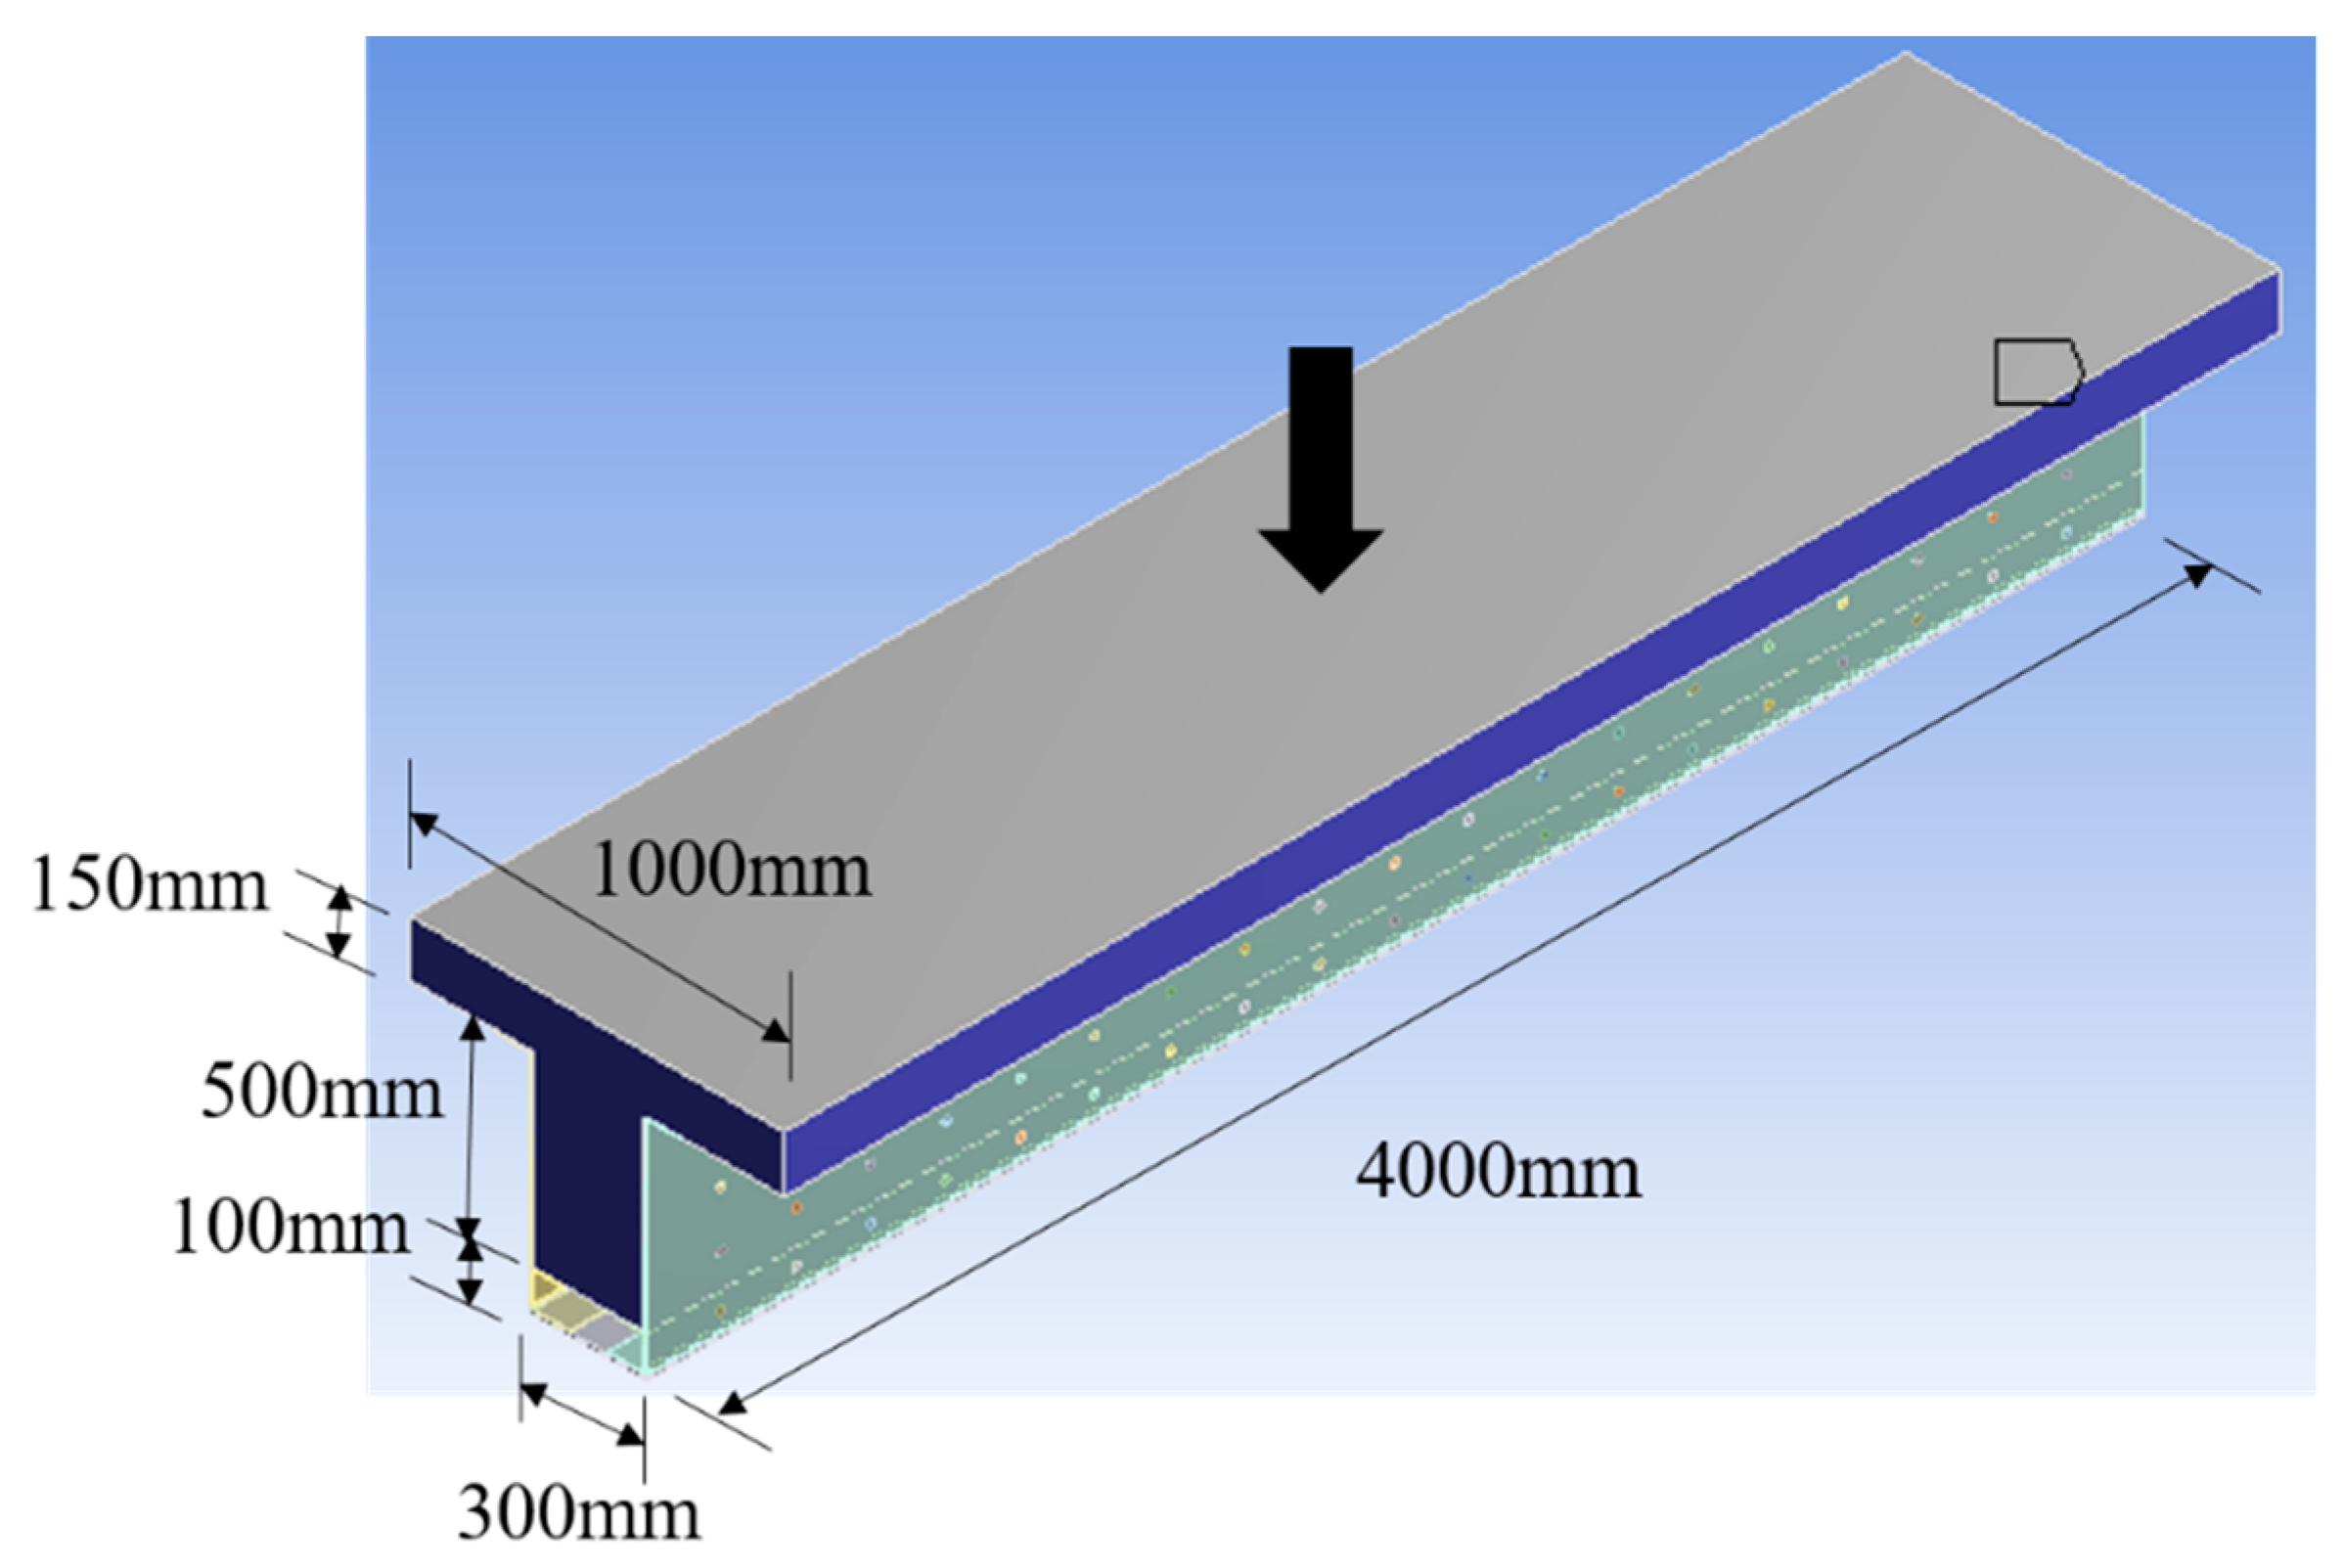
3.1. Analytical Model
3.2. Determinations of the Details of the Proposed Retrofitting System
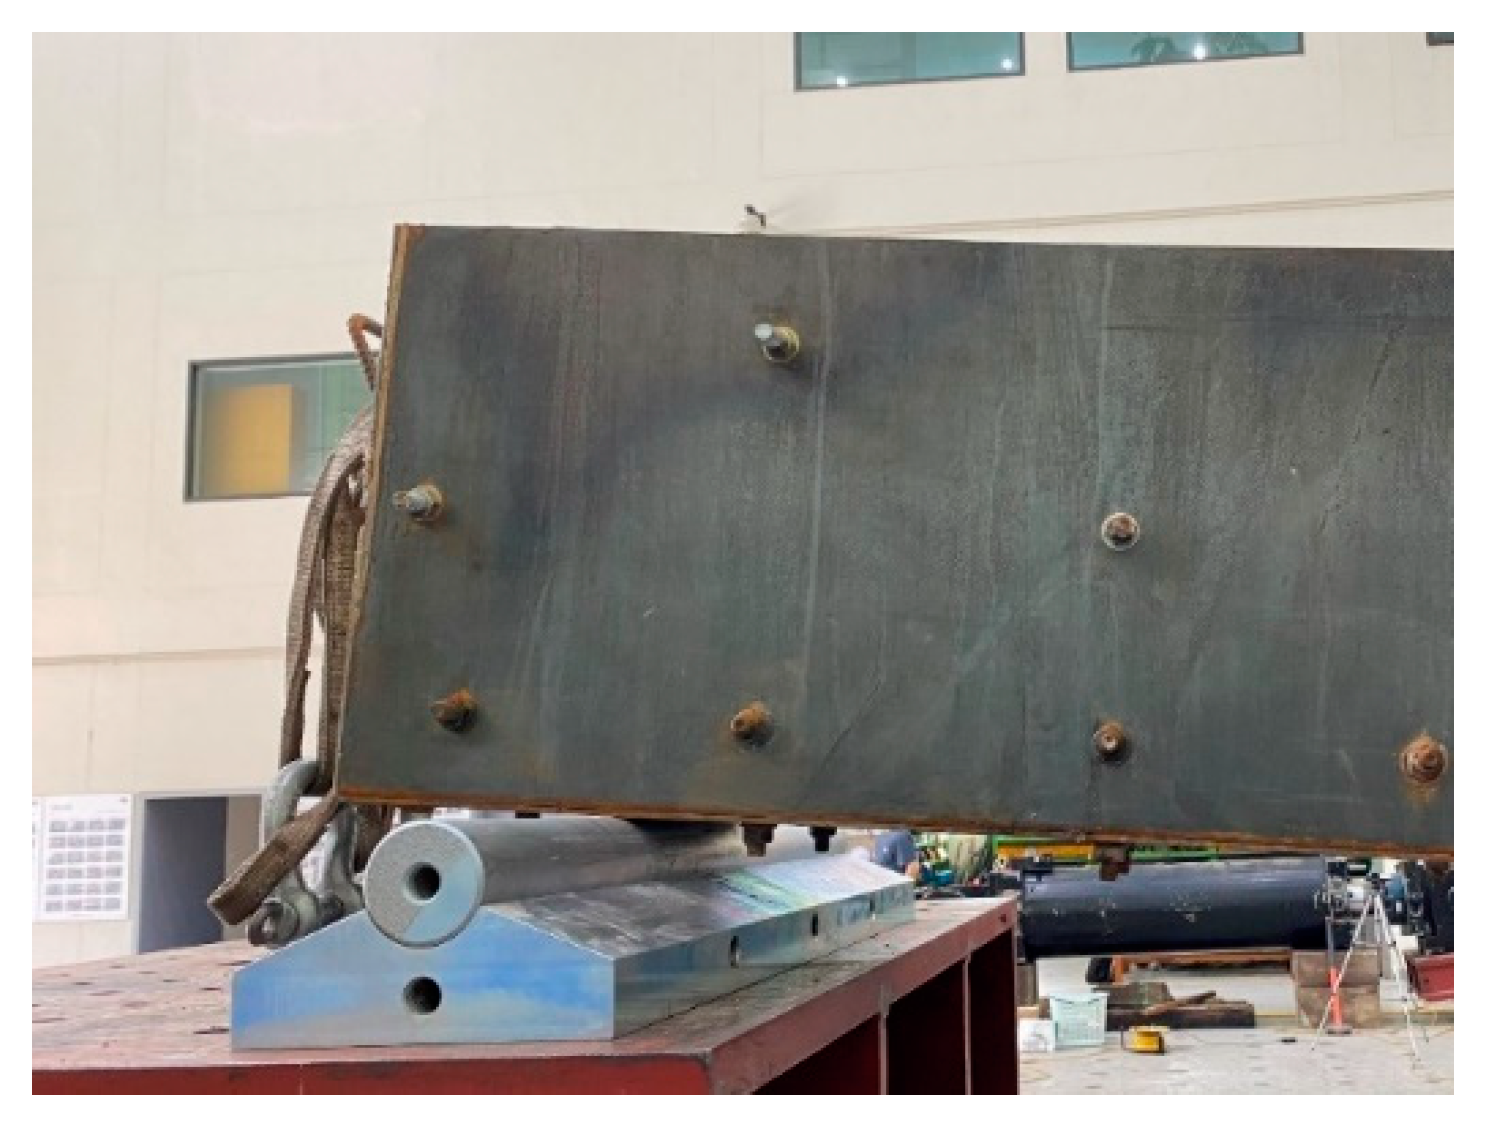
4. Experimental Program
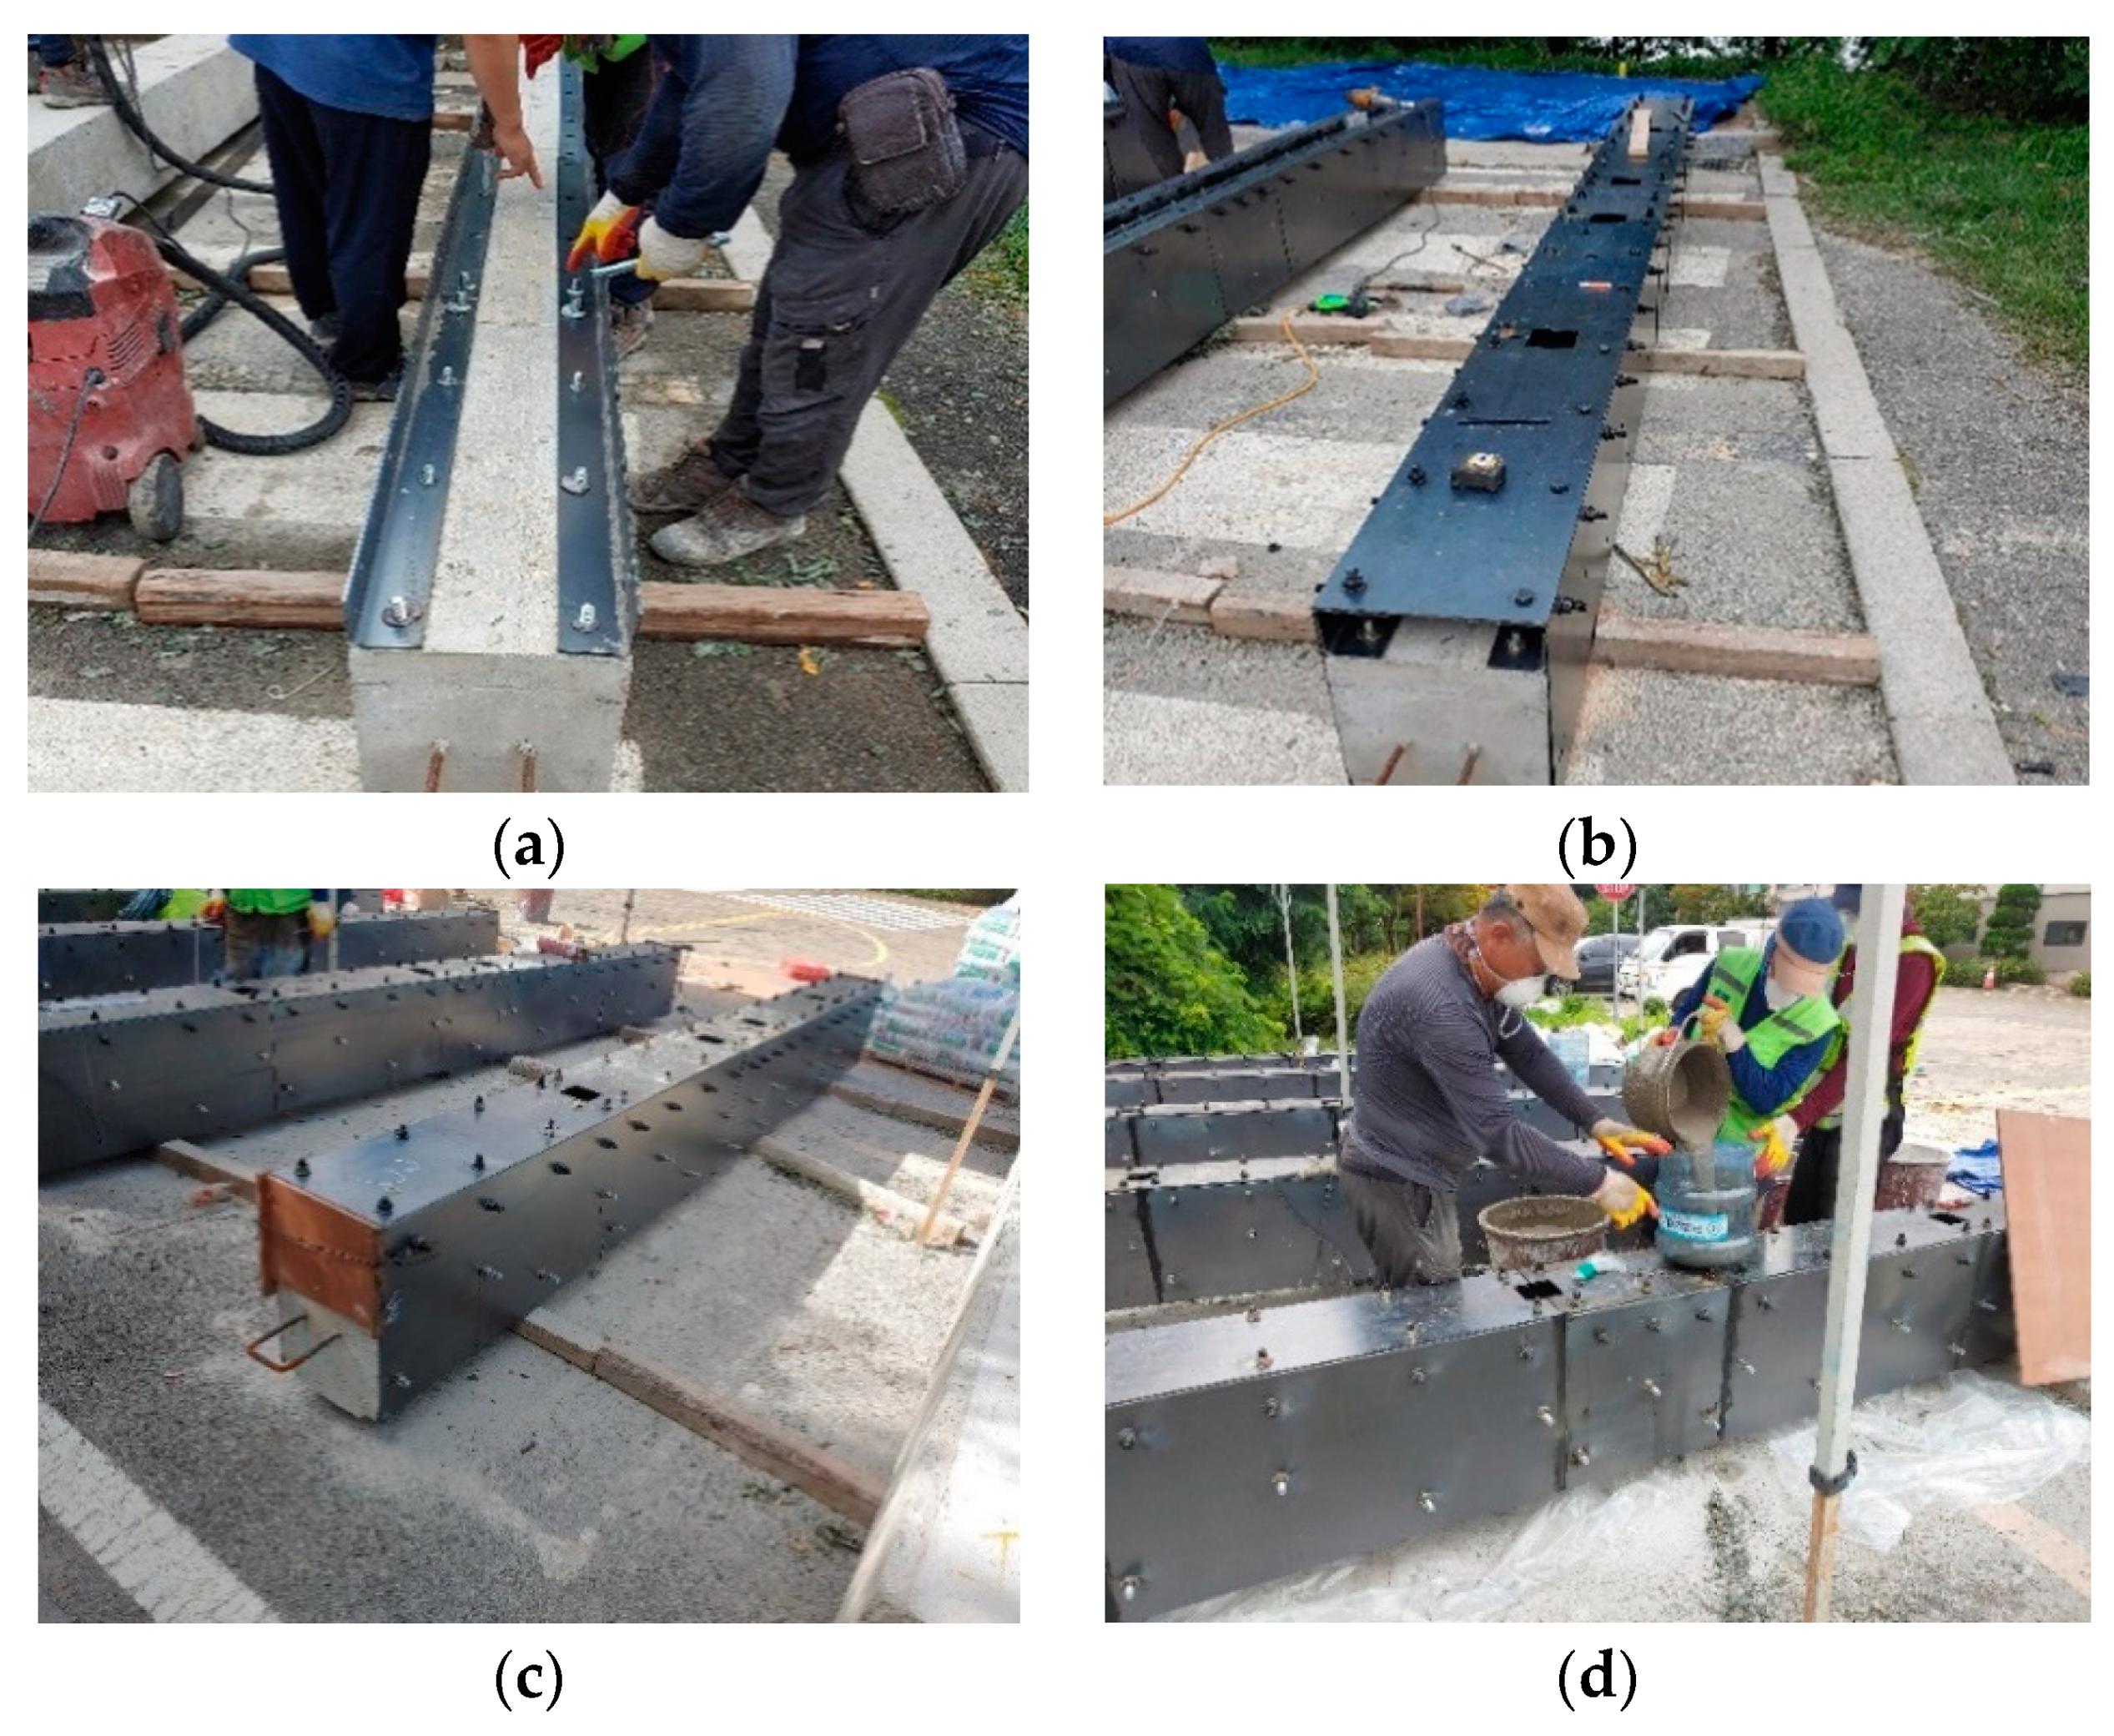
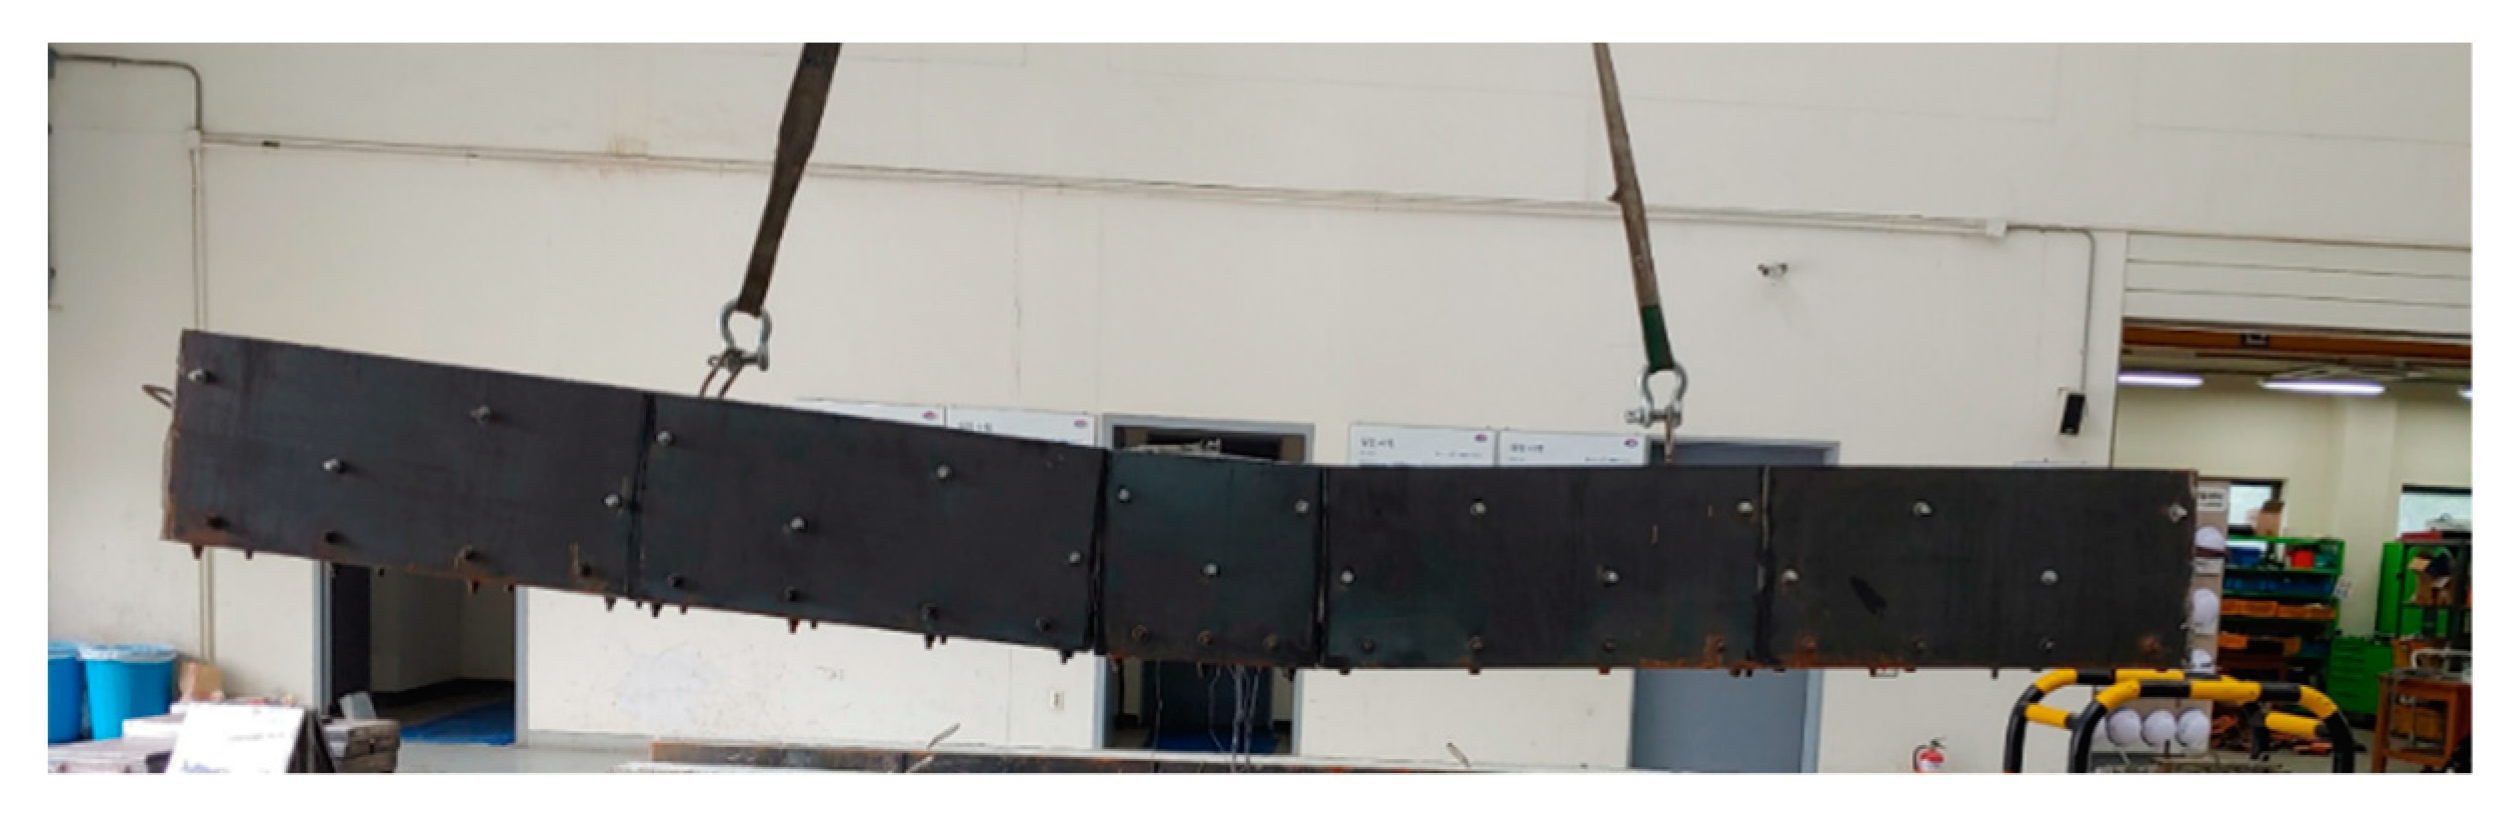
4.1. Sequence of Construction
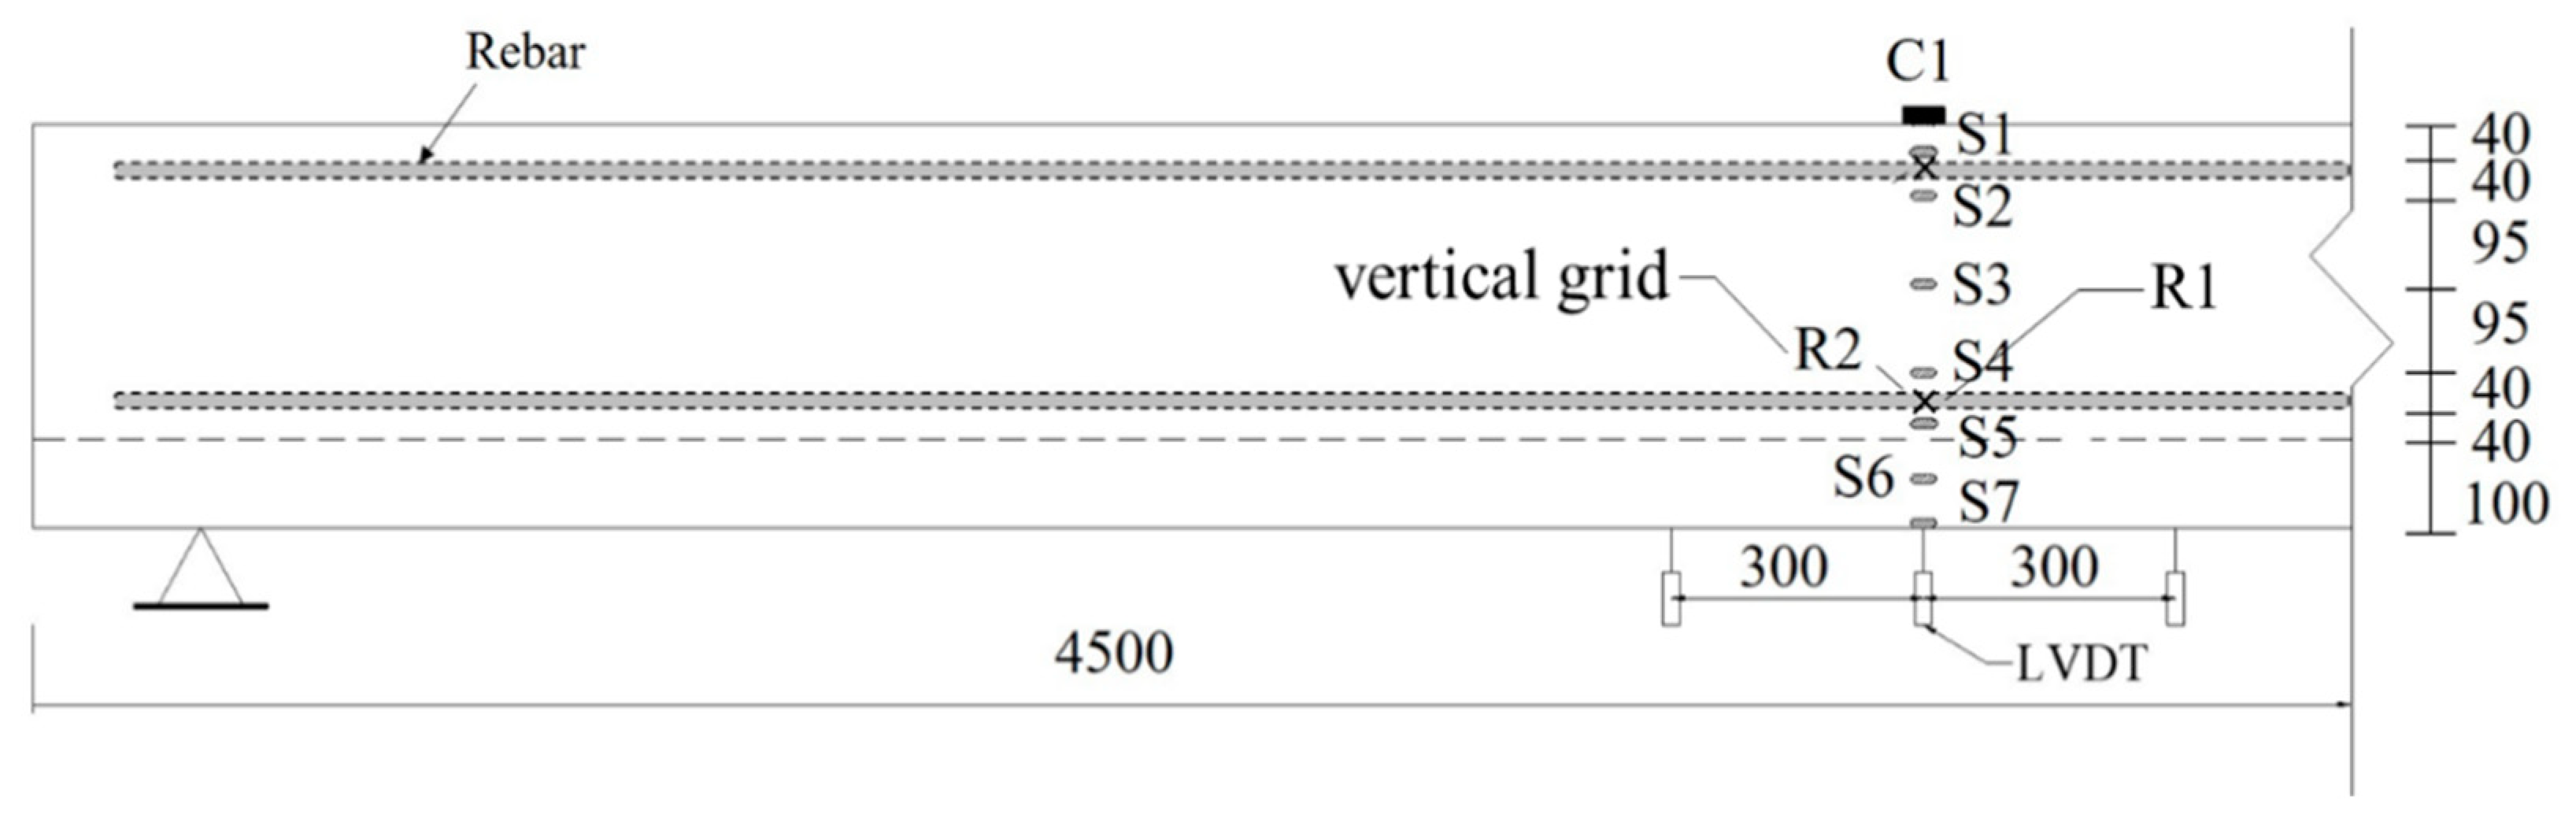
4.2. Specimen Details and Test Parameters
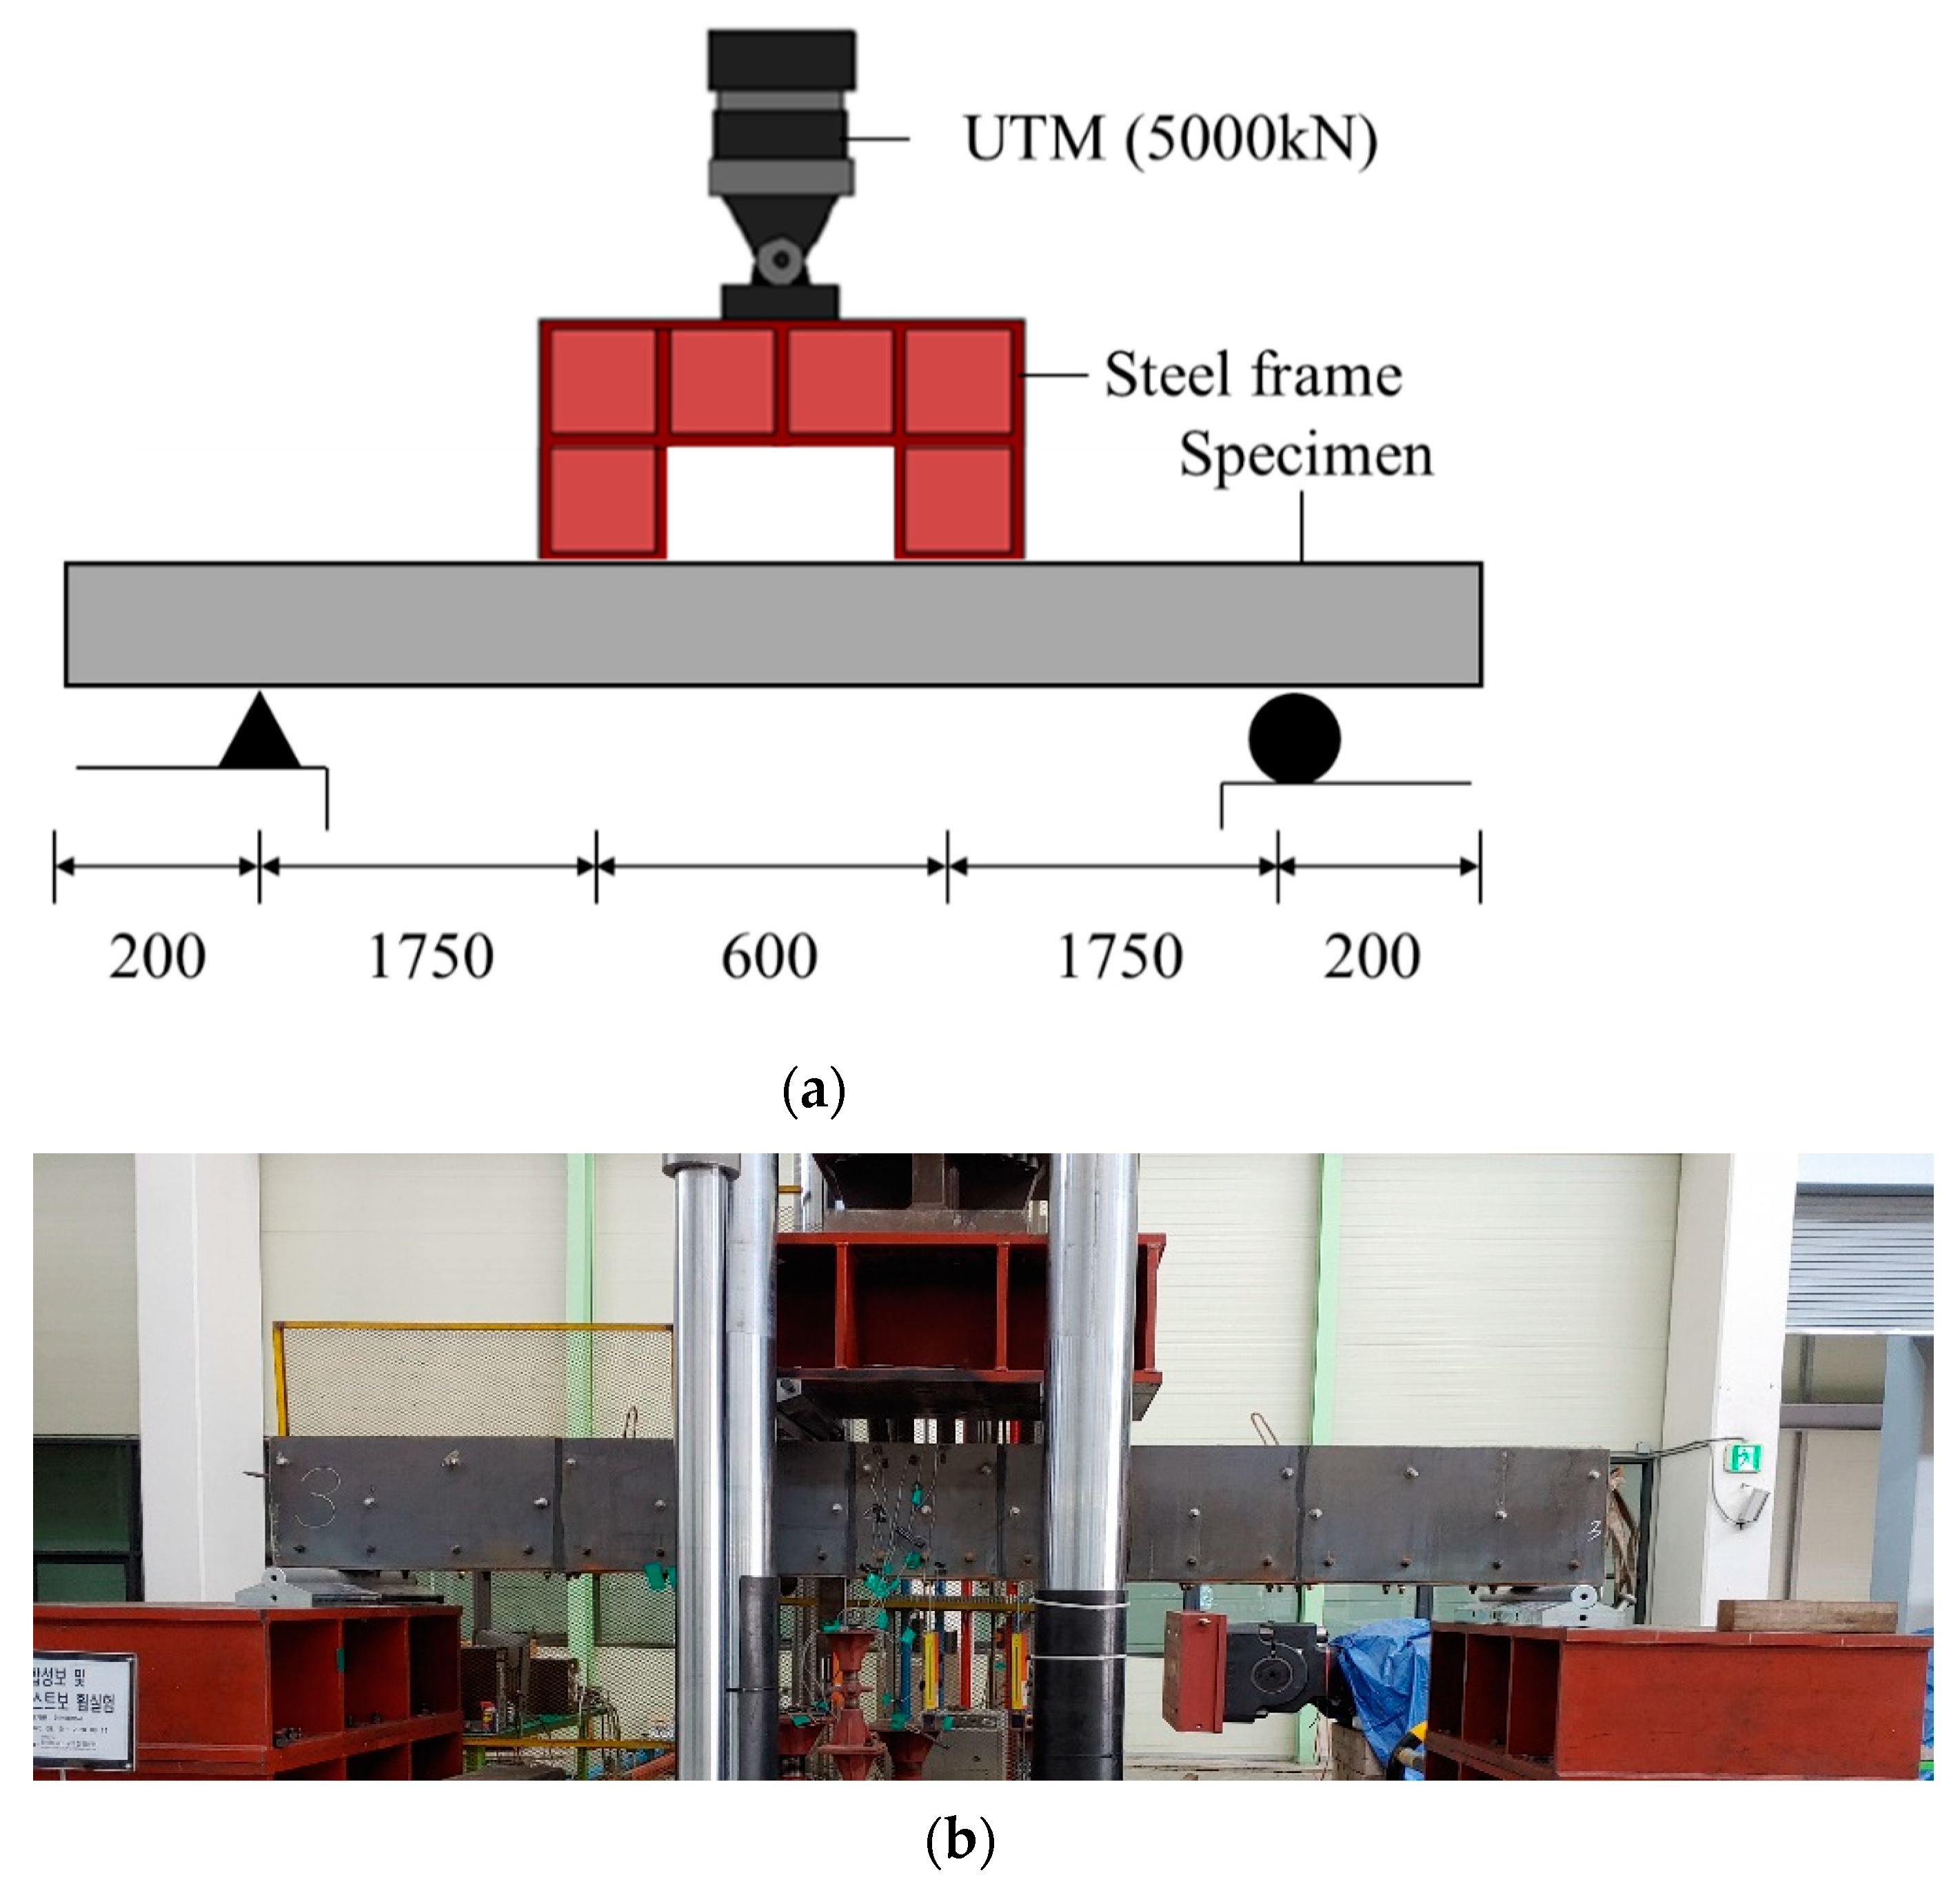
4.3. Test Set Up
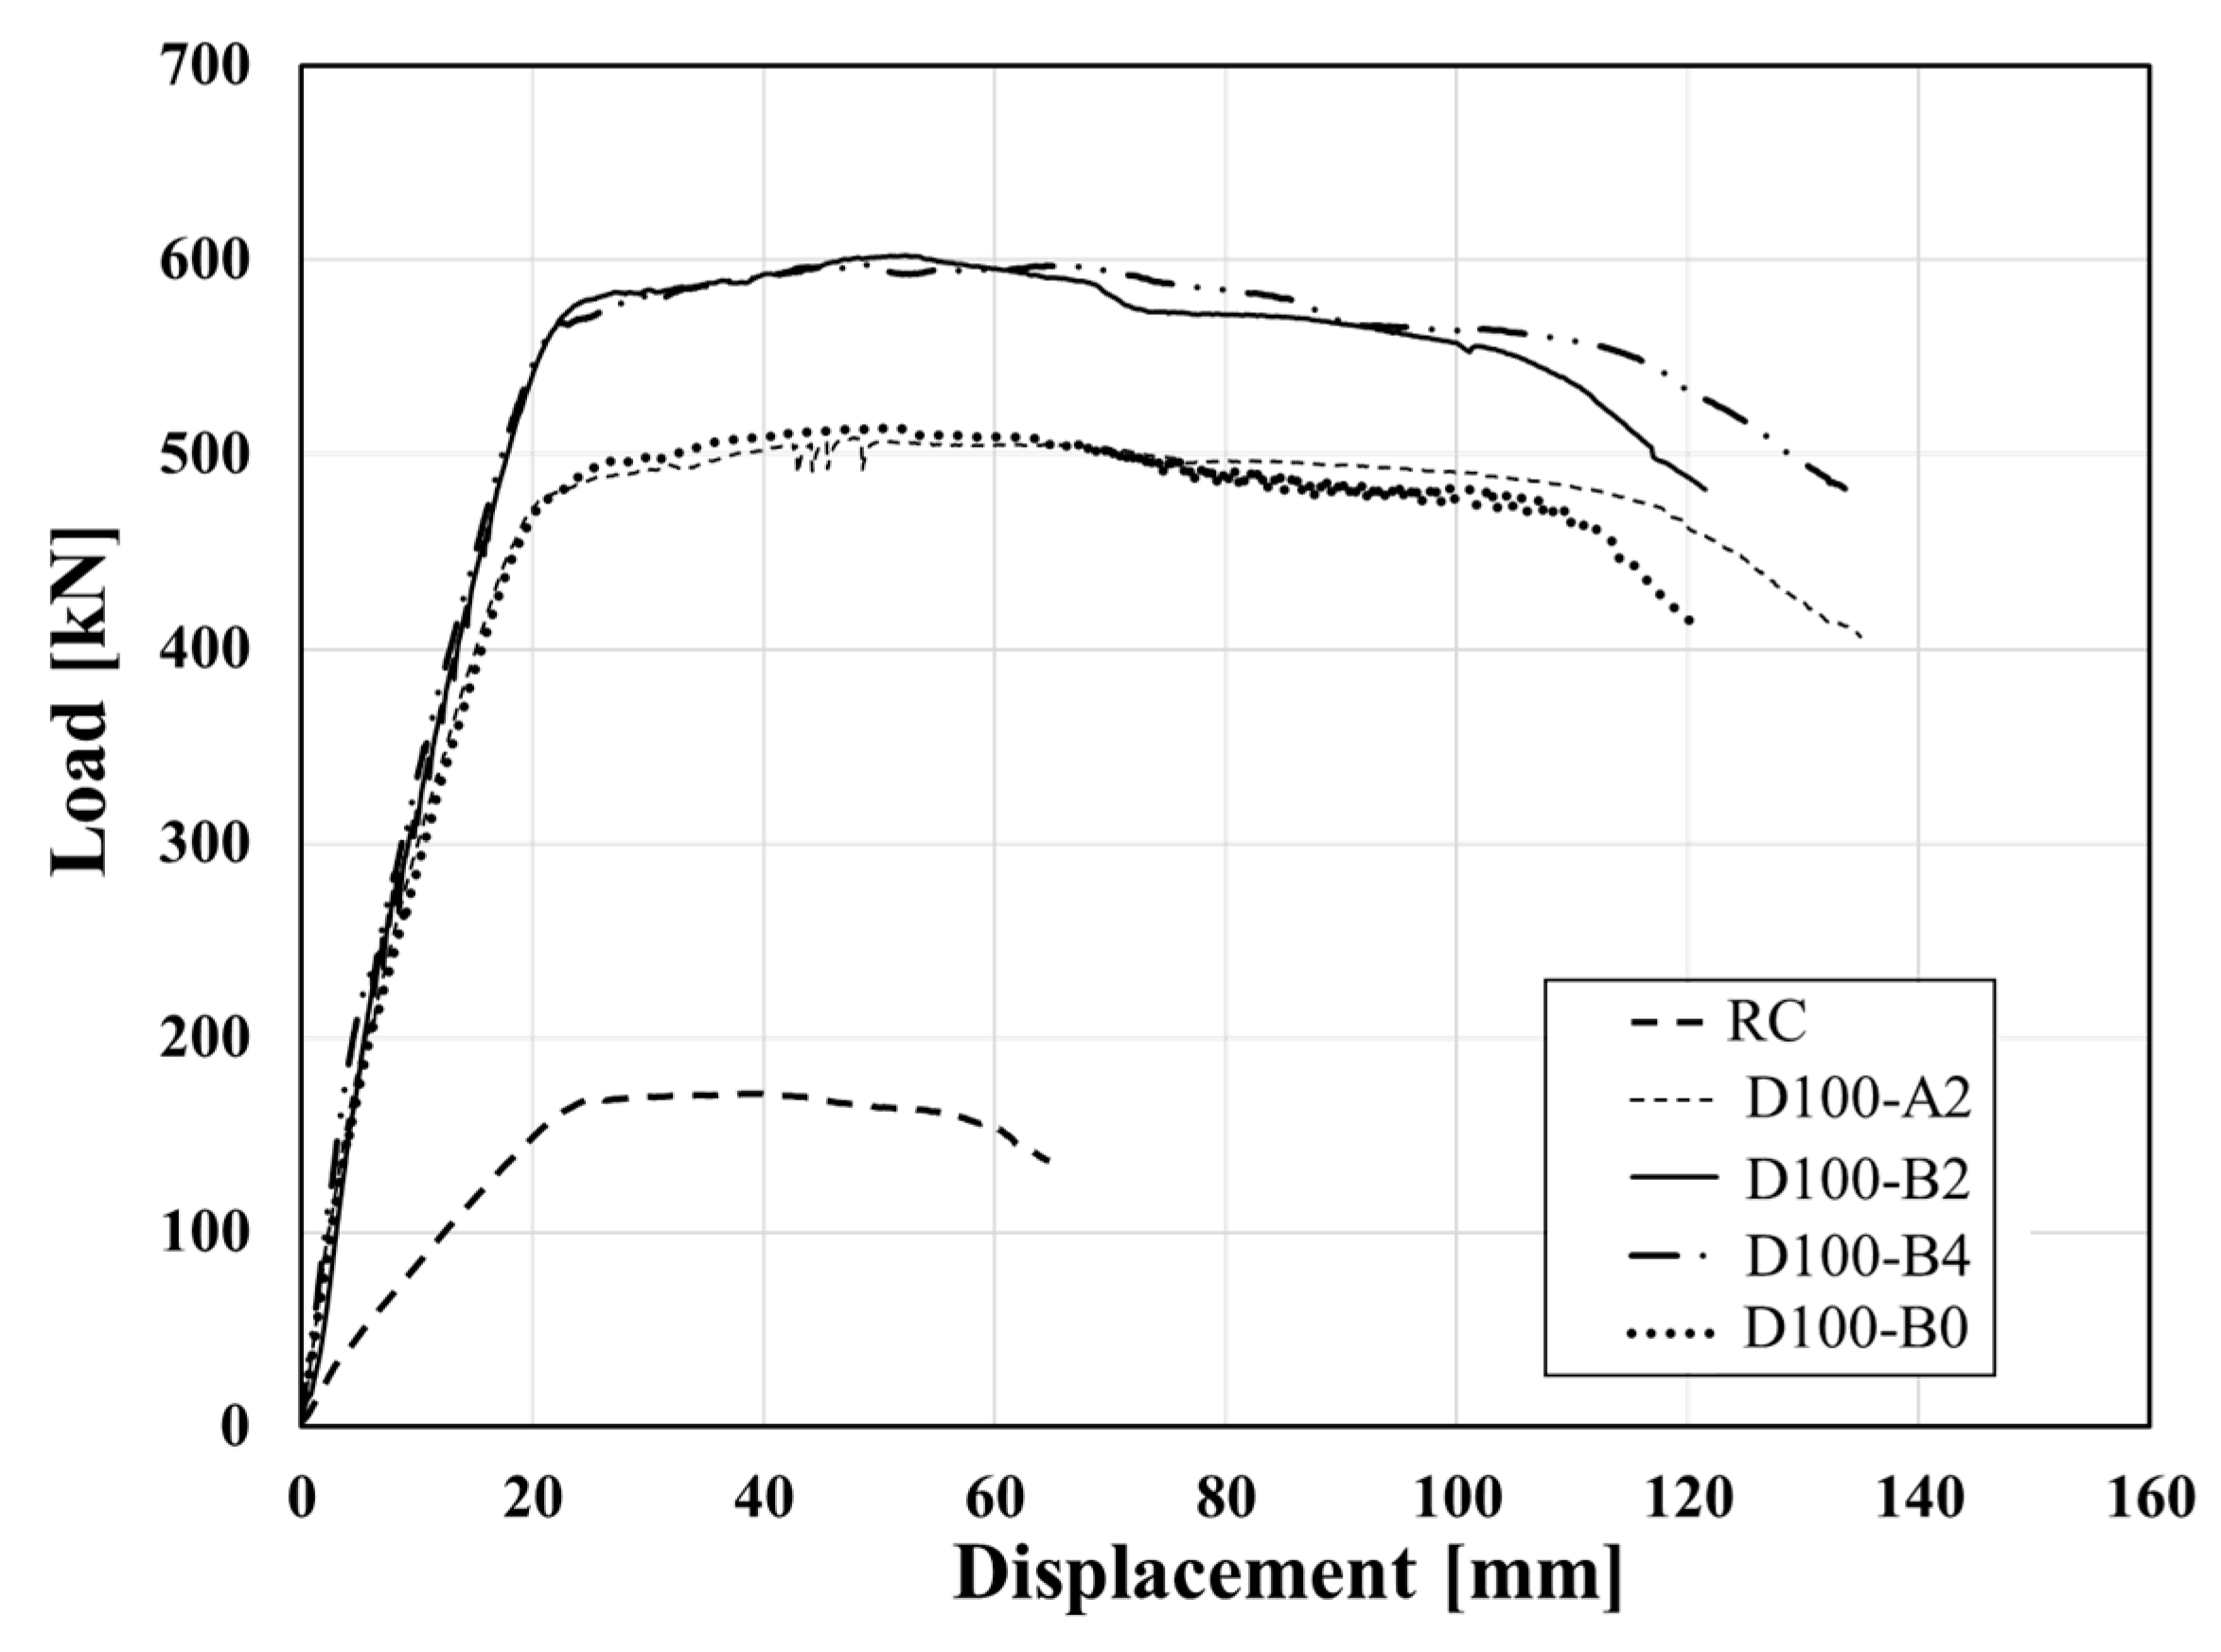
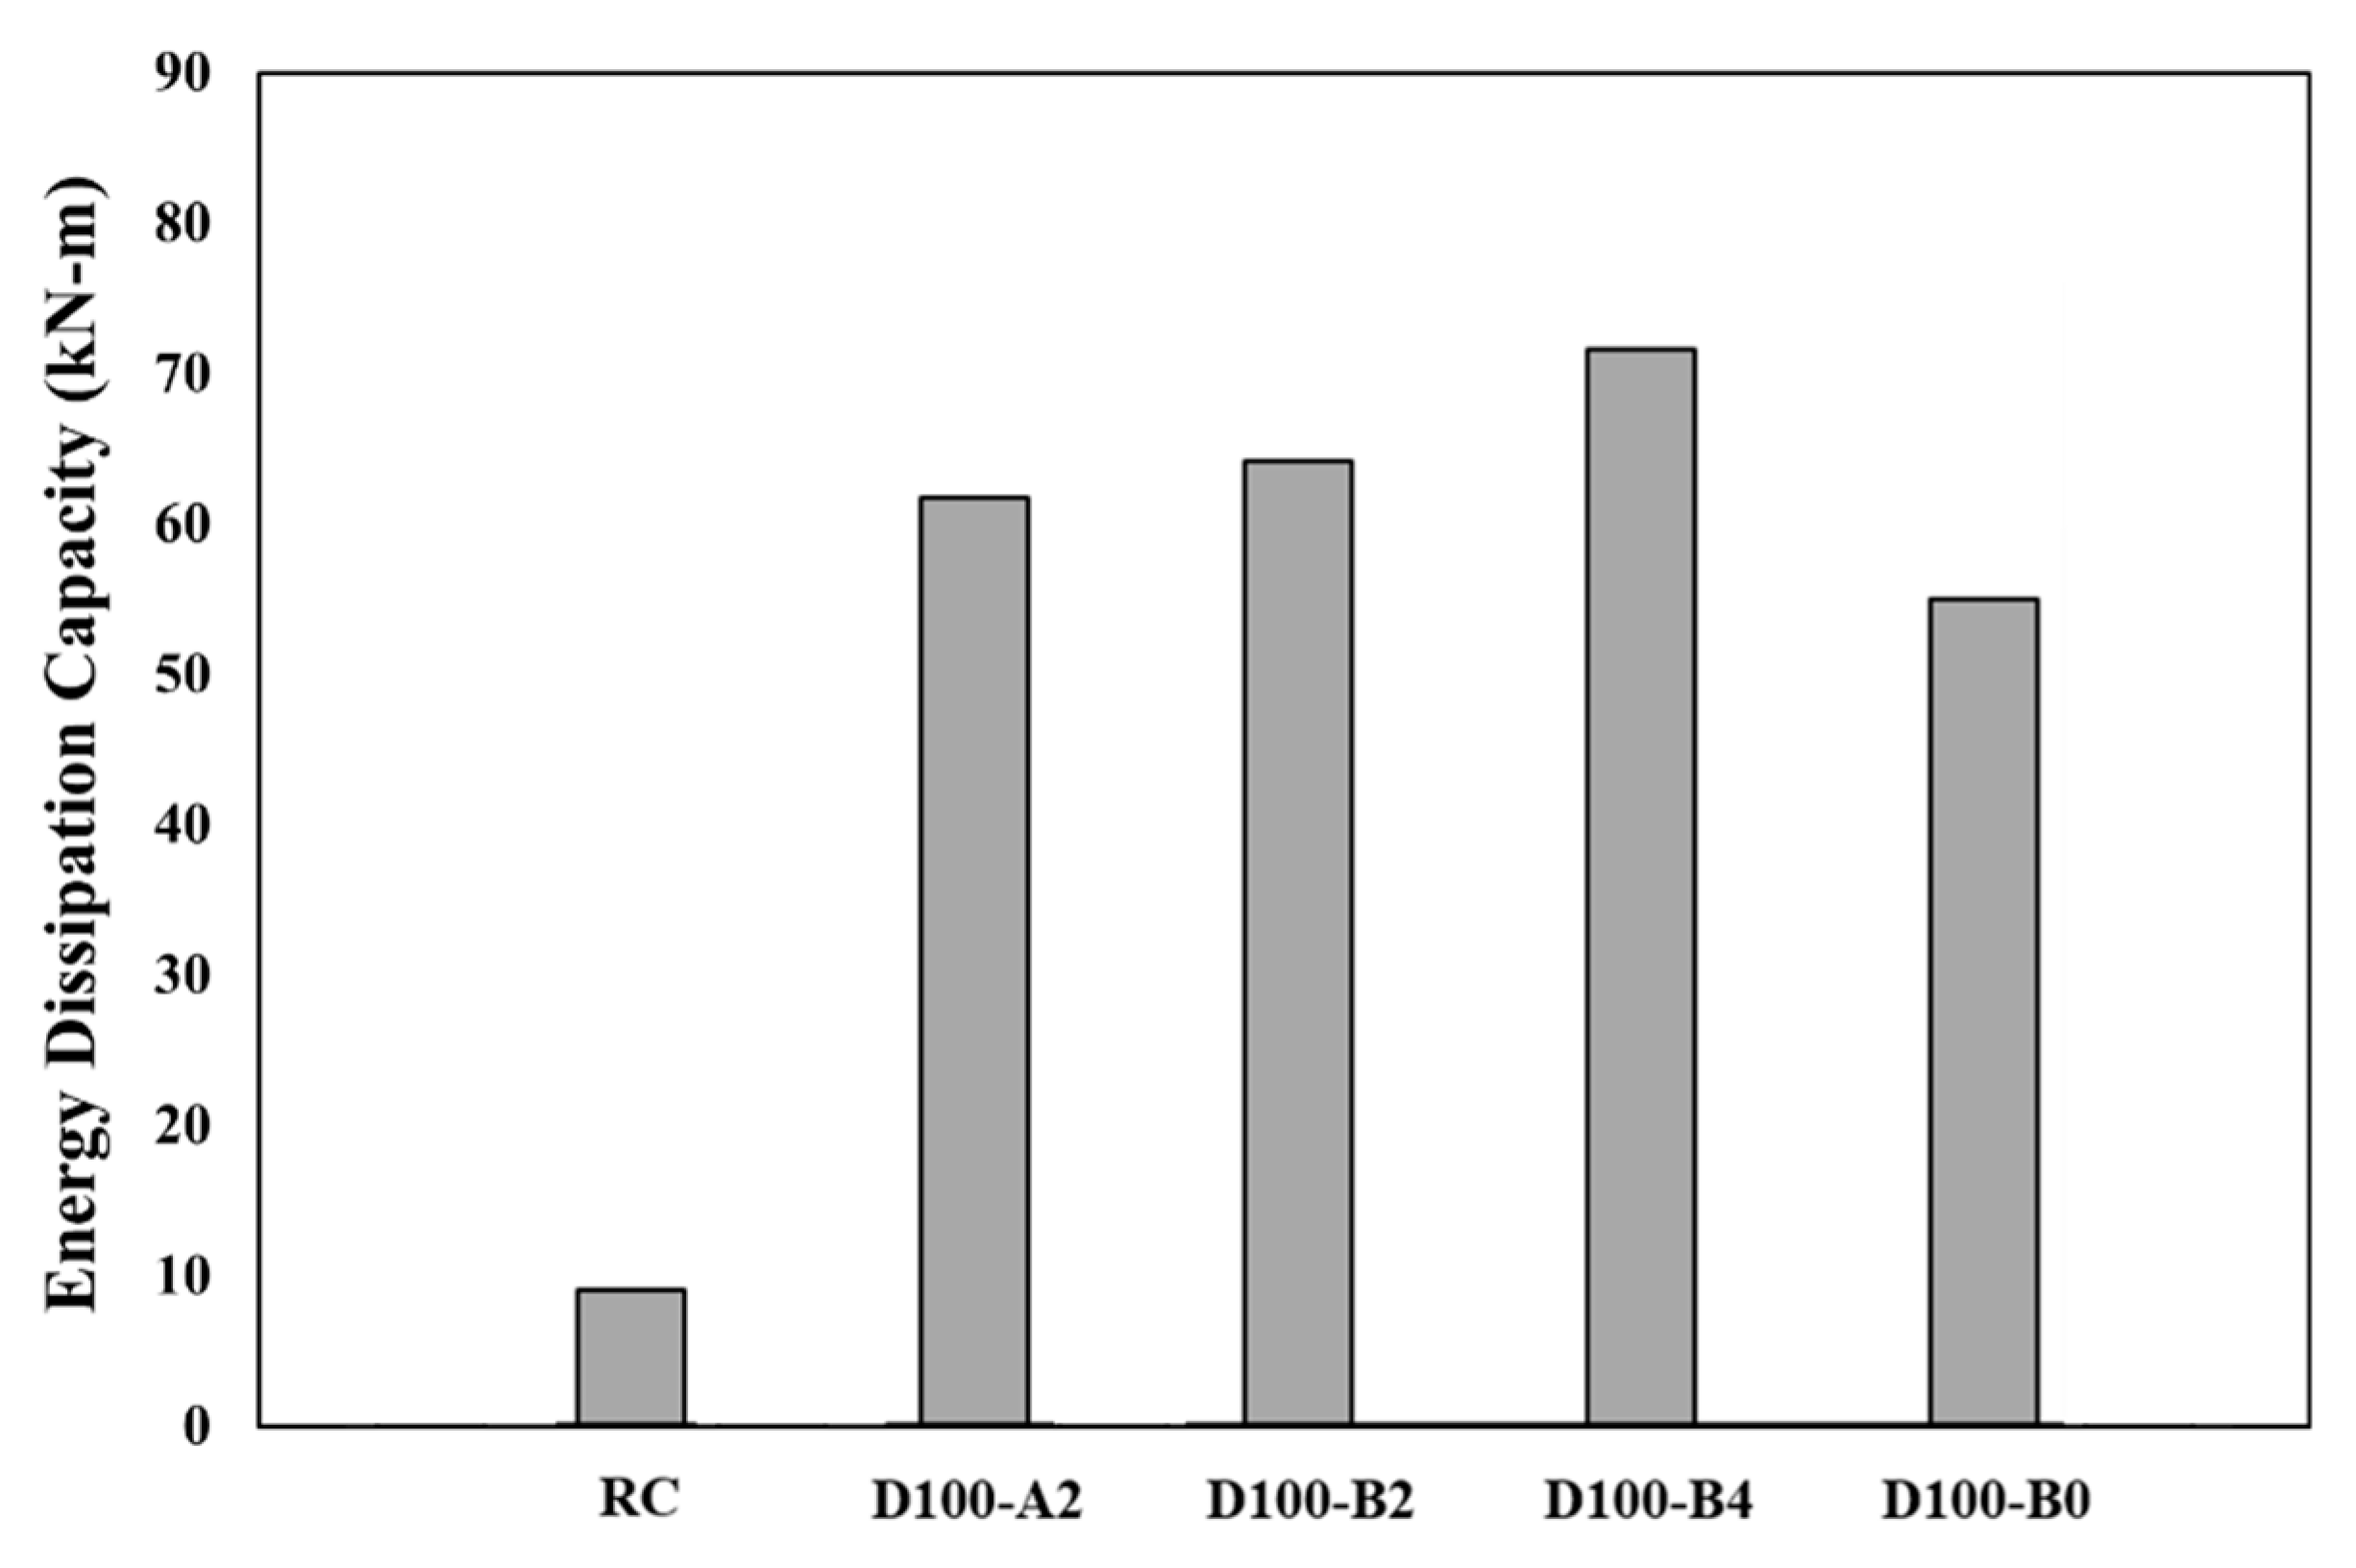
5. Test Results and Discussion
5.1. Cracking Behavior and Modes of Failure
5.2. Load-Strain Relationship
5.3. Ductility Capacity
5.4. Energy Dissipation Capacity
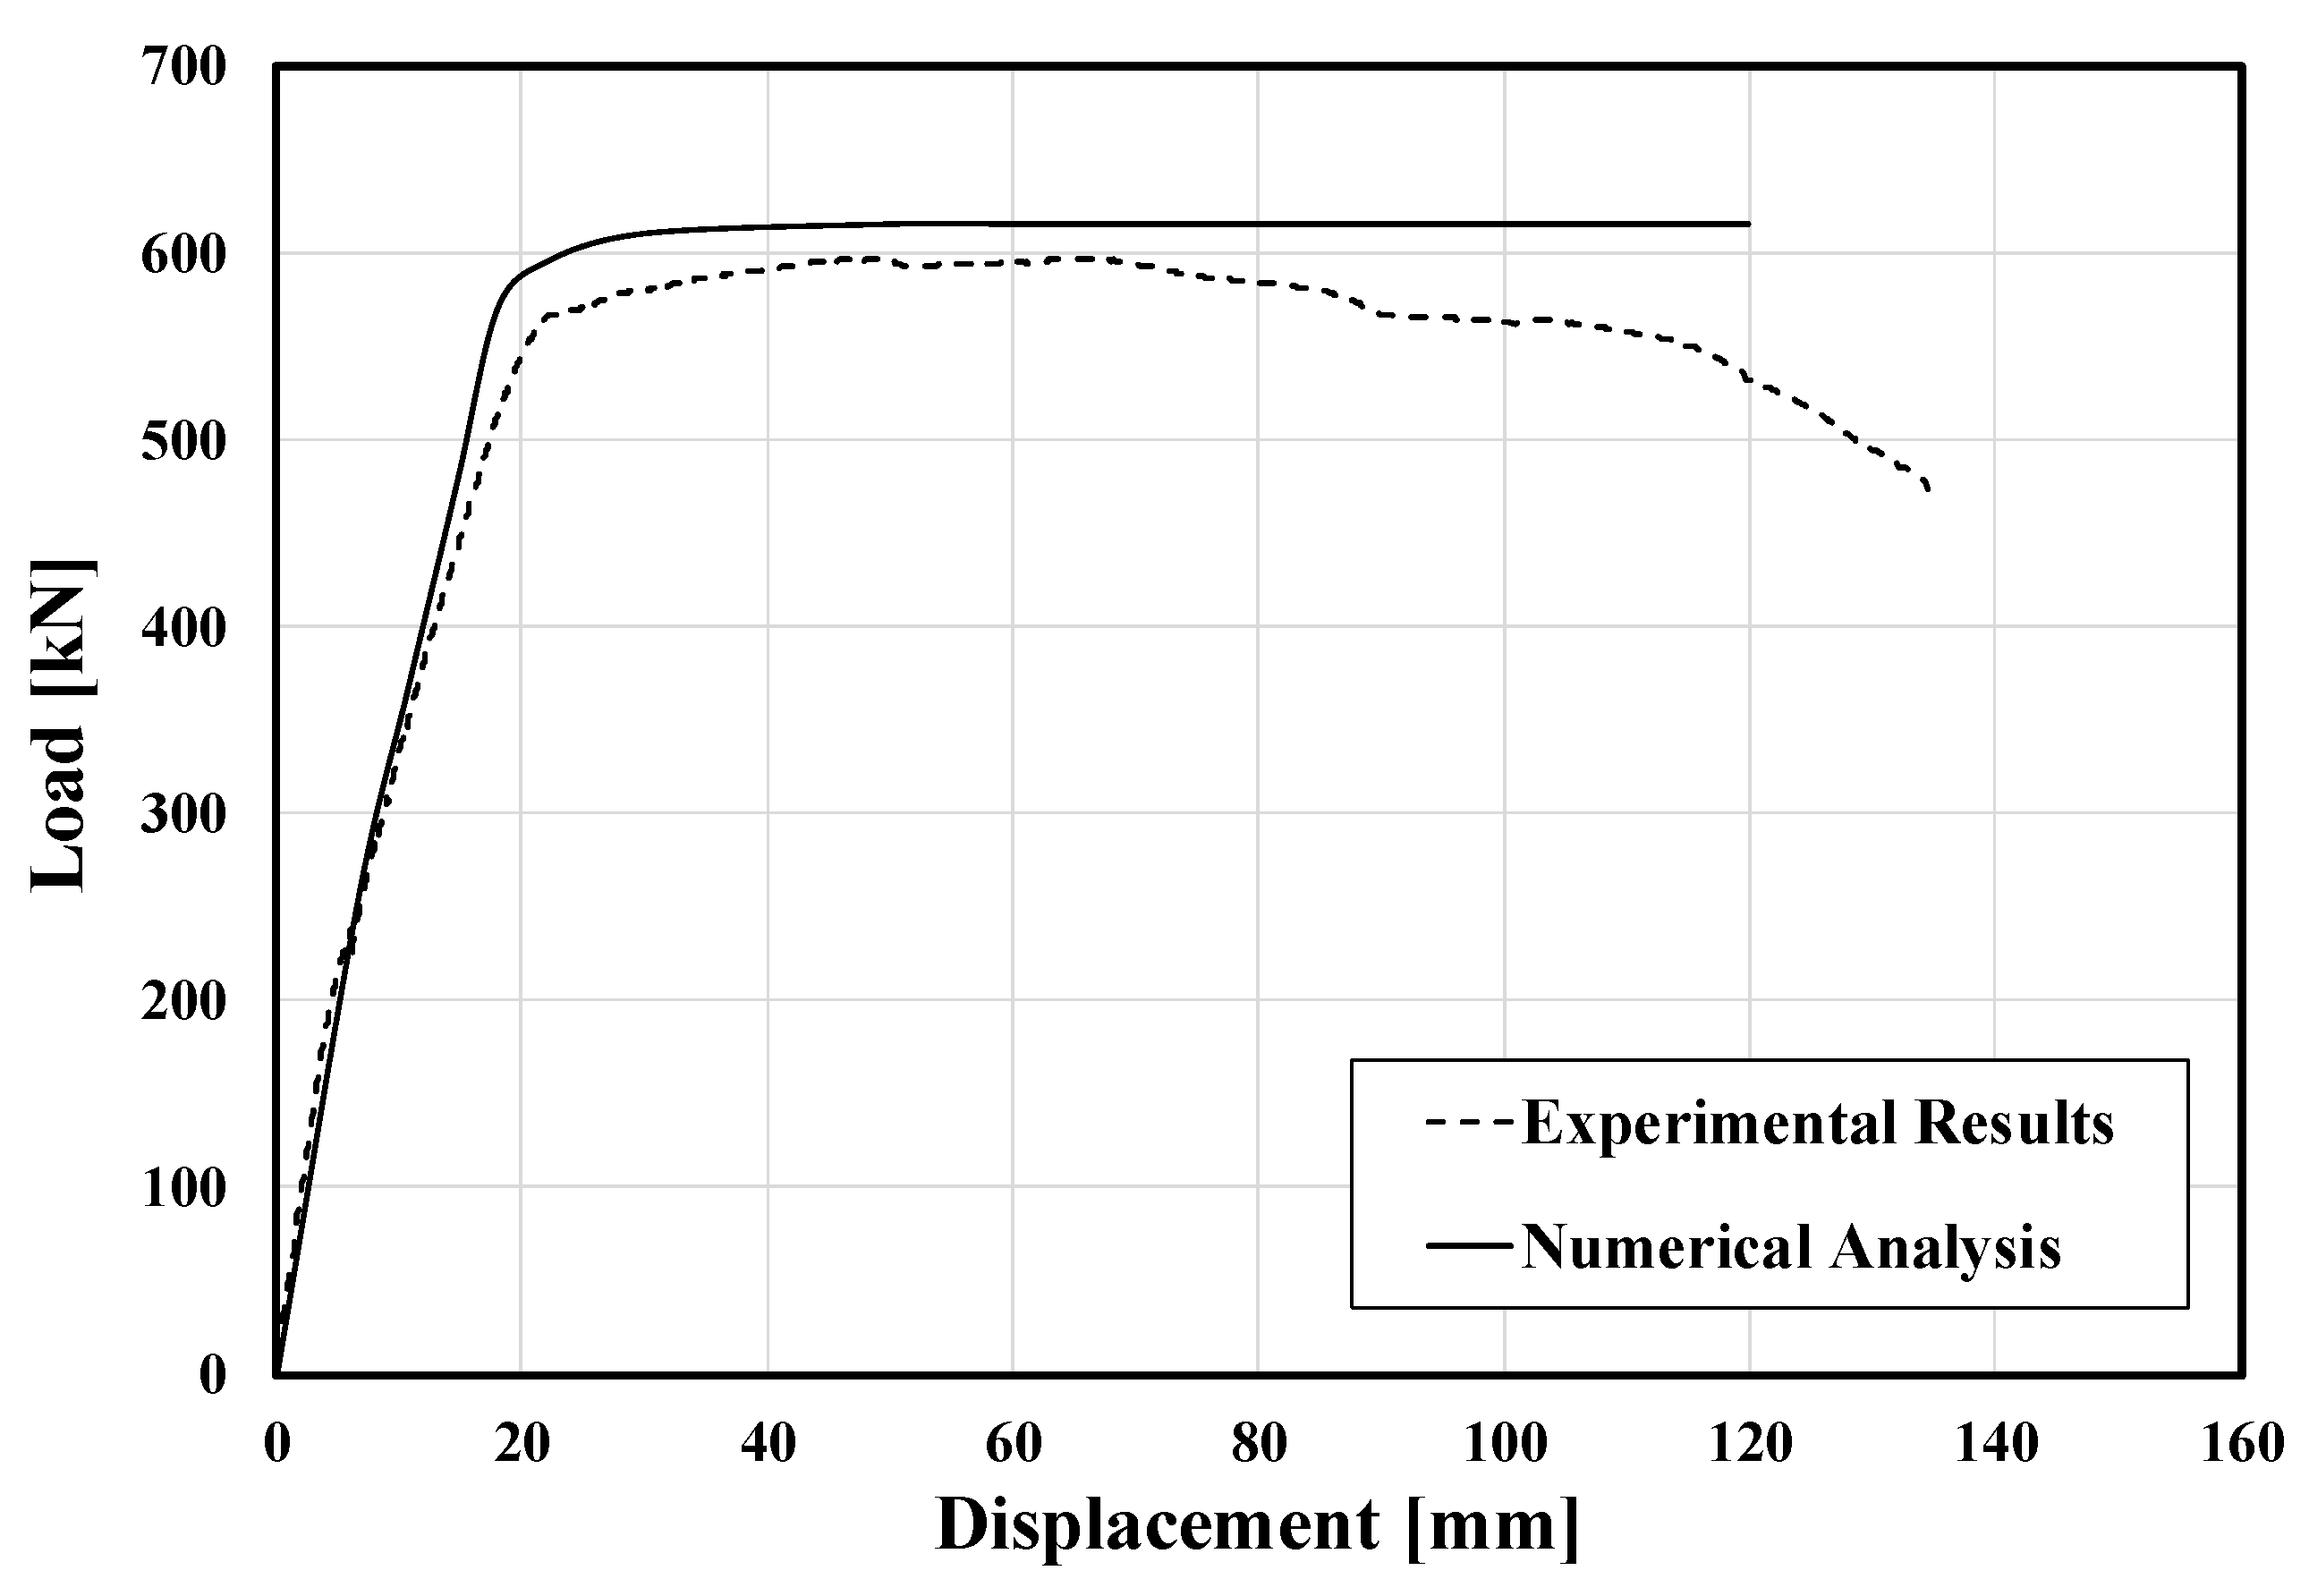
5.5. Model Validation and Discussion
6. Conclusions
- (1)
- In this study, the details and components of the modularized retrofitting method are proposed, with Z-shaped side plates, L-shaped lower plate, and bottom plate with vertical grid. Finite element analyses were carried out to investigate the effect of the bottom plate thickness, L-shaped lower plate thickness, Z-shaped side plate thickness, and the bolt spacing on the stress distribution. Details of the modularized steel plate retrofitting system were proposed based on the analysis results.
- (2)
- The maximum load increased as the thickness of the bottom plate increased, but it was found to be relatively lacking in ductility. Although the number of vertical grid did not significantly affect stiffness, the increase in that number improved the ductility. In addition, the flexural performance increased by about 1.17 times, depending on the presence of the vertical grid. The vertical grid attached to the bottom plate increased the confinement effect of the mortar and reduced spalling by acting as a flexural reinforcement.
- (3)
- The ductility and energy dissipation capabilities were compared and analyzed. Compared to non-retrofitted reinforced concrete beams, the ductility capacity increased by about 2.5 times, and the energy dissipation capacity increased by about seven times. This confirms that the application of the proposed retrofitting method can improve the structural performance of existing concrete members.
- (4)
- The experiment in this paper focused on the evaluation of the flexural capacity of retrofitted concrete beams. Further experimental research is needed on the shear behavior of concrete beams retrofitted with modularized steel plates. Moreover, a finite element model that can predict structural capacity is required for the design stage.
Author Contributions
Funding
Institutional Review Board Statement
Informed Consent Statement
Data Availability Statement
Conflicts of Interest
References
- Garzon-Roca, J.; Ruiz-Pinilla, J.; Adam, J.M. An experimental study on steel caged RC columns subjected to axial force and bending moment. Eng. Struct. 2011, 33, 580–590. [Google Scholar] [CrossRef]
- Adam, J.M.; Ivorra, S.; Pallares, F.J.; Gimenez, E.; Calderon, P.A. Axially loaded RC columns strengthened by steel caging. Finite element modeling. Constr. Build. Mater. 2009, 23, 2265–2276. [Google Scholar] [CrossRef]
- Wei, Y.; Wu, Y.F. Compression behavior of concrete columns confined by high strength steel wire. Constr. Build. Mater. 2014, 54, 443–453. [Google Scholar] [CrossRef]
- Tarabia, A.M.; Albakry, H.F. Strengthening of RC columns by steel angles and strips. Alex. Eng. J. 2014, 53, 615–626. [Google Scholar] [CrossRef] [Green Version]
- Alvarez, J.C.; Brena, S.F.; Arwade, S.R. Nonlinear backbone modeling of concrete columns retrofitted with fiber-reinforced polymer or steel jackets. Aci Struct. J. 2018, 115, 53–64. [Google Scholar] [CrossRef]
- Chrysanidis, T.; Tegos, I. Axial and transverse strengthening of R/C circular columns: Conventional and new type of steel and hybrid jackets using high-strength mortar. J. Build. Eng. 2020, 30, 101236. [Google Scholar] [CrossRef]
- EL Maaddawy, T. Strengthening of eccentrically loaded reinforced concrete columns with fiber-reinforced polymer wrapping system: Experimental investigation and analytical modeling. J. Compos. Constr. 2009, 13, 13–24. [Google Scholar] [CrossRef]
- Fu, B.; Teng, J.G.; Chen, J.F.; Chen, G.M.; Guo, Y.C. Concrete cover separation in FRP plated RC Beams mitigation using FRP U-Jackets. J. Compos. Constr. 2017, 21, 04016077. [Google Scholar] [CrossRef]
- Fu, B.; Chen, G.M.; Teng, J.G. Mitigation of intermediate crack debonding in FRP-plated RC beams using FRP U-jackets. Compos. Struct. 2017, 176, 883–897. [Google Scholar] [CrossRef]
- Mohammed, A.A.; Manalo, A.C.; Maranan, G.B.; Zhuge, Y.; Vijay, P.V.; Pettigrew, J. Behavior of damaged concrete columns repaired with novel FRP jacket. J. Compos. Constr. 2019, 23, 04019013. [Google Scholar] [CrossRef]
- Xu, C.X.; Peng, S.; Deng, J.; Wan, C. Study on seismic behavior of encased steel jacket-strengthened earthquake-damaged composite steel-concrete columns. J. Build. Eng. 2018, 17, 154–166. [Google Scholar] [CrossRef]
- Mohammed, A.A.; Manalo, A.C.; Ferdous, W.; Zhuge, Y.; Vijay, P.V.; Pettigrew, J. Experimental and numerical evaluations on the behaviour of structures repaired using prefabricated FRP composites jacket. Eng. Struct. 2020, 210, 110358. [Google Scholar] [CrossRef]
- Wang, J.; Lu, S.; Yang, J. Behavior of eccentrically loaded rectangular RC columns wrapped with CFRP jackets under different preloading levels. J. Build. Eng. 2021, 34, 101943. [Google Scholar] [CrossRef]
- Lam, D.; Dai, H.T.; Han, L.H.; Ren, Q.X.; Li, W. Behavior of inclined, tapered and STS square CFST stub columns subjected to axial load. Thin-Walled Struct. 2012, 54, 94–105. [Google Scholar] [CrossRef]
- AISC. Specification for Structural Steel Building; ANSI/AISC 360-10; AISC: Chicago, IL, USA, 2010. [Google Scholar]


| Compressive Strength (MPa) | Modulus of Elasticity (MPa) | Poisson’s Ratio | ||
| Concrete | 24 | 24,500 | 0.18 | |
| Yield strength (MPa) | Tensile strength (MPa) | Modulus of elasticity (MPa) | Poisson’s Ratio | |
| Steel plate | 250 | 460 | 200,000 | 0.3 |
| (1) Bottom Plate | |||||
| Thickness (mm) | 5 | 10 | 15 | 20 | 30 |
| Concrete (MPa) | 4.1 | 4.0 | 4.0 | 5.3 | 6.8 |
| Side plate (MPa) | 14.9 | 15.7 | 17.3 | 17.7 | 18.4 |
| Lower plate (MPa) | 1.7 | 1.8 | 2.1 | 2.1 | 2.8 |
| Bottom plate (MPa) | 5.1 | 2.8 | 2.9 | 2.4 | 2.2 |
| (2) L-shaped lower plate | |||||
| Thickness (mm) | 2.5 | 5 | 7.5 | 10 | |
| Concrete (MPa) | 4.1 | 4.1 | 4.1 | 4.0 | |
| Side plate (MPa) | 15.7 | 15.7 | 15.6 | 15.6 | |
| Lower plate (MPa) | 3.46 | 1.84 | 4.3 | 2.0 | |
| Bottom plate (MPa) | 2.05 | 2.03 | 2.03 | 2.02 | |
| (3) Z-shped side plate | |||||
| Thickness (mm) | 2.5 | 5 | 7.5 | 10 | |
| Concrete (MPa) | 3.0 | 4.1 | 4.4 | 5.1 | |
| Side plate (MPa) | 11.6 | 15.7 | 11.3 | 9.4 | |
| Lower plate (MPa) | 2.9 | 1.8 | 2.3 | 2.2 | |
| Bottom plate (MPa) | 1.7 | 2.0 | 2.0 | 2.1 | |
| (4) Bolt spacing | |||||
| Spacing (mm) | 150 | 200 | 250 | 300 | 400 |
| Concrete (MPa) | 4.1 | 4.1 | 4.0 | 3.4 | 2.8 |
| Side plate (MPa) | 15.7 | 15.3 | 16.7 | 16.8 | 20.7 |
| Lower plate (MPa) | 2.5 | 1.8 | 5.0 | 6.6 | 6.0 |
| Bottom plate (MPa) | 1.7 | 2.1 | 2.5 | 2.8 | 2.8 |
| No. | Name | Added Beam Depth (mm) | Bottom Plate Thickness (mm) | Vertical Grid (EA) |
|---|---|---|---|---|
| 1 | RC | - | - | - |
| 2 | D100-A 1 2 2 | 100 | 5 | 2 |
| 3 | D100-B2 | 100 | 10 | 2 |
| 4 | D100-B4 | 100 | 10 | 4 |
| 5 | D100-B0 | 100 | 10 | - |
| Material | Compressive Strength (MPa) | ||
| Concrete | 24 | ||
| Material | Diameter (mm) | Yield Strength (MPa) | Modulus of Elasticity (MPa) |
| Rebar | 19 | 400 | 200,000 |
| Stirrup | 10 | 400 | 200,000 |
| Material | Yield Strength (MPa) | Tensile Strength (MPa) | Modulus of Elasticity (MPa) |
| Steel plate | 275 | 410–550 | 205,000 |
| Name | Crack Propagation | Observed Damage | |
|---|---|---|---|
| Bottom plate thickness | D100-A2 | 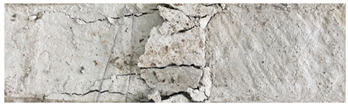 | -Concrete crushing at the top of the concrete -As the bottom plate thickness increases, cracks propagate widely |
| D100-B2 | 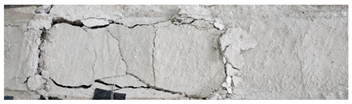 | ||
| The number of vertical grid | D100-B0 | 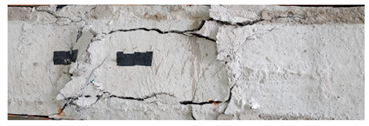 | -Concrete crushing at the top of the concrete -As the number of steel plates with openings increases, the concrete crushing occurs more locally. |
| D100-B2 | 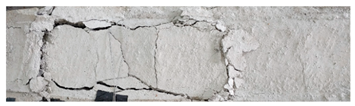 | ||
| D100-B4 |  | ||
| No. | Name | 1 (kN) | 2 (kN) | 3 (kN) | 4 (mm) | 5 (mm) | ||
|---|---|---|---|---|---|---|---|---|
| 1 | RC | 138.06 | 137.55 | 171.65 | 1.24 | 1.08 | 18.09 | 38.72 |
| 2 | D100-A2 | 535.19 | 370.86 | 508.48 | 0.95 | 1.11 | 13.48 | 47.89 |
| 3 | D100-B2 | 585.03 | 466.03 | 602.62 | 1.03 | 1.08 | 16.27 | 52.21 |
| 4 | D100-B4 | 585.03 | 423.40 | 597.55 | 1.02 | 1.07 | 13.90 | 49.25 |
| 5 | D100-B0 | 556.73 | 382.13 | 514.00 | 0.92 | 1.10 | 14.61 | 50.86 |
| No. | Name | |||
|---|---|---|---|---|
| 1 | RC | 64.78 | 18.09 | 3.58 |
| 2 | D100-A2 | 134.88 | 13.48 | 10.01 |
| 3 | D100-B2 | 121.52 | 16.27 | 7.47 |
| 4 | D100-B4 | 134.43 | 13.90 | 9.67 |
| 5 | D100-B0 | 120.75 | 14.61 | 8.26 |
Publisher’s Note: MDPI stays neutral with regard to jurisdictional claims in published maps and institutional affiliations. |
© 2021 by the authors. Licensee MDPI, Basel, Switzerland. This article is an open access article distributed under the terms and conditions of the Creative Commons Attribution (CC BY) license (http://creativecommons.org/licenses/by/4.0/).
Share and Cite
Kim, M.S.; Lee, Y.H. Flexural Behavior of Reinforced Concrete Beams Retrofitted with Modularized Steel Plates. Appl. Sci. 2021, 11, 2348. https://doi.org/10.3390/app11052348
Kim MS, Lee YH. Flexural Behavior of Reinforced Concrete Beams Retrofitted with Modularized Steel Plates. Applied Sciences. 2021; 11(5):2348. https://doi.org/10.3390/app11052348
Chicago/Turabian StyleKim, Min Sook, and Young Hak Lee. 2021. "Flexural Behavior of Reinforced Concrete Beams Retrofitted with Modularized Steel Plates" Applied Sciences 11, no. 5: 2348. https://doi.org/10.3390/app11052348