Featured Application
Underground pipeline monitoring.
Abstract
Big impacts from pressure transients are known to be major contributors to pipeline failures, and even small impacts have the potential to result in pipeline deterioration. The effects of these impacts on a pipeline are not disclosed in detail and are hard to evaluate completely by theoretical modeling or numerical simulation. The impacts excite cylindrical structures containing liquid, which results in the development of wave propagation along pipelines. In particular, quasi-longitudinal waves are known to be developed by fluid-structure interaction during propagation. However, impact signal detection needs great care because extreme noise may corrupt the signal. An enhanced wavelet-based approach is proposed to detect and localize the impact source. The method makes use of continuous wavelet transform and band summation within a band of interest along scales to enhance time-difference detectability. In addition, a noise reduction algorithm intended to remove burst noises, in practice, frequently contaminates the impact signals of interest. Experimental results from a water supply network under operation demonstrate that the proposed approach is able to suppress noise and successfully reveal the impact location. The proposed approach provides a more precise and robust way to localize impacts missed by the conventional cross-correlation algorithm.
1. Introduction
Water transmission mains are crucial parts of water utilities and important assets in the infrastructure of a country. Transmission mains are designed to move large quantities of water from the supply source and to provide water to the smaller distribution mains. The transmission mains are usually almost straight with few branches for long distances. The likelihood of a transmission main failure is actually lower than for other piping systems because they are typically more substantial in design. However, when they do occur, the consequences of failure for a transmission main are much greater than those for a smaller distribution main. There is a greater chance of flooding and infrastructure failure due to the larger volume of water that would be expected to escape from a leaking or ruptured main. Pipeline failure is typically attributed to aging infrastructure, severe environmental conditions, and third-party damage [1,2]. Pressure monitoring has served as one of the most popular management interventions [3], and recently, unsteady pressure patterns [4] have been examined to improve the detectability of pressure transients by vibration sensing. Some frequency contents of vibration have distinguishable features that are not within the range measured by conventional pressure sensors. The dynamic oscillation of structures tells much about their own structural integrity and status, non-destructively [5,6,7,8]. The dynamic response is generally induced by broad-band excitation, such as that which occurs from impacts. From water hammers (pressure transients) to unpredictable strikes, abrupt excitations often happen to pipelines: sudden body-to-body contacts of pipe structures, including valve-related issues, pipe bursts due to an abrupt crack opening, third-party damages, and so on. Such impacts generate structural resonance, and various waves propagate through the water and along the pipe from the excitation point.
Cylinders that are filled with liquid produce and develop particular waves that are different from those without liquid [9,10]. Water transmission mains have enough pressure inside the pipe to move large amounts of water, and this often completely fills the pipe with water. The interaction between water and the cylindrical shell makes a coupled motion in the cylindrical section, and one predominant axisymmetric wave propagates along the axial direction of the pipe. Such waves, also known as quasi-longitudinal waves, are predominantly fluid-based waves with some radial motion associated with the shell compliance [11]. The coupled waves can reach farther than elastic shear waves can because most of the energy of the coupled waves is in a lower frequency range than that for elastic waves [9,12]. This certainly allows for longer-range monitoring with vibration signals for water transmission mains.
When applying additional sensors to monitor the buried pipe structure, it might be highly desirable to use non-destructive sensing techniques [13,14]. The coupled waves are axisymmetric dilatational waves, predominately in the form of longitudinal waves in the pipe wall with some radial motion, thanks to Poisson coupling [15,16]. Vibration sensors are a kind of non-intrusive sensor that is able to detect the coupled behavior of a pipe structure with high sensitivity. The vibration sensors have a flat frequency response and are generally more sensitive than pressure sensors; therefore, noise easily contaminates vibration signals. The noise from many sources is transferred through the ground to a pipeline and is certainly measured by the vibration sensors. This may prevent us from observing signals of interest. Therefore, it is inevitable to remove or reduce noise to make a stable and reliable test and evaluation. Many researchers have long sought ways to manage noise to improve signal detectability in various fields. Wavelet analysis has been a promising way to reduce noise and extract singular features of signals [17]. There has also been much work on wavelets of water pipelines [18,19,20,21,22]. In particular, most of the work done to detect burst or leaks has been dedicated to pressure transients with intrusive pressure sensors [23]. However, the pressure sensors have low sensitivity and therefore do not easily detect impact signals, except for big ones, such as a water hammer or pipe rupture. To cope with catastrophic damage earlier on, it is necessary to pick up relatively small but indispensable impact or burst signals with high accuracy. In this study, signals from impacts to a pipeline or caused by exterior strikes, such as inattentive third-party digging, were taken into account. Considerably more often, damage is caused by people: accidental events from careless digging or those related to building or repair work in the proximity of the pipeline [24]. Compared to pressure transients, impact signals are small and hard to detect by pressure sensors due to their low sensitivity to structural vibration. It is noteworthy that detecting small impact signals is becoming more important for finding degradation in the forms of small leaks, structural degradation, cracks, and so on, for effective monitoring and protective management of assets. Dynamic wave modes of pipelines are able to provide fertile information for detecting events that could do more harm than good to the pipe structures.
It is also of particular importance to find where a failure is. Identifying the exact position of a pipe failure is vital to hasten pipeline repairs and maintenance [25]. Knowing the time difference of arrival (TDOA) between sensors must be known to localize an event along the pipelines. Large diameter pipelines, such as water transmission mains, are regarded as one-dimensional (1D) structures for low-frequency wave propagation, which means that source localization can be done adequately with just two sensors. Nevertheless, in practice, TDOA is hard to obtain precisely due to other general noises. Even though various methods have been proposed and developed to estimate TDOA in noisy (including reverberations in a space) environments [26,27,28,29], it is still challenging to estimate accurately time differences buried in noise.
These motivated us to develop a way to detect the coupled waves propagating through pipelines by reducing noise and also by localizing the impact sources that induce the waves. Thus, the first problem is associated with how to lessen noise effectively and then how to estimate a time difference accurately between a pair of sensors. To obtain a time difference embedded in noise, we have to know the distinctive characteristics of the noise and of the signal that contains the time difference. Noise can be assumed to be inherently random and uncorrelated (such as white noise) or to be part of a banded spectrum. The latter has decreasing energy because the frequency is contained within a band, such as pink noise, which is known to be ubiquitous in daily life [30], and traffic noise [31]. The waves we want to pick up generally have a specific band-limited characteristic in its own frequency range with respect to each piping system. Based on the distinguishable features, many methods have been proposed and developed. In particular, wavelet analysis has been widely adopted as an effective way to reduce noise and detect specific temporary features of target signals.
We propose a methodology that is able to detect fluid-pipe structure-coupled waves propagating through pipelines, using a wavelet-based algorithm in a noisy environment, and then localize where the impact sources are. Clearly, the objectives of this work were to (a) employ quasi-longitudinal waves, which propagate via coupling between liquid and the pipe structure, (b) propose wavelet-based signal processing for noise reduction and for improving signal detectability, and (c) estimate precisely the arrival times at each sensor and then quantitatively compare the results of the proposed approach to those achieved using the conventional cross-correlation algorithm.
2. Materials and Methods
In this study, quasi-longitudinal waves were employed as a promising candidate to look into the behavior of pipe structures affected by impacts in water transmission mains. In addition, a wavelet-based approach was also exploited to enhance signal detectability and to reduce noise. Quasi-longitudinal waves are axis-symmetric waves, generated and developed in a fluid interacting with axis-symmetric cylinders, such as pipes, which allow the waves to propagate farther than elastic waves would by themselves. Therefore, the approach proposed here is identified as having high potential for long-range monitoring with non-invasive sensors, thanks to the interaction of the fluid and structure. On the other hand, the vibration sensors are vulnerable to noise from surrounding environments. This means that it is inevitable that the wavelet analysis will be deployed together with an additional signal processing technique. To make the wavelet analysis effective, it is necessary to determine the feature of noises, and an approach appropriate to making clear any distinctive features should be applied.
2.1. Fluid-Cylindrical Structure Coupled Wave Propagation
The characteristics are not the same as those of waves propagating through fluidic media in a free field. The interaction between the cylindrical shell and liquid makes the propagation through pipe structures distinctive. The vibration mode of a cross-section is closely associated with propagation along an axial direction. In other words, the wavenumber characteristics of the cross-section is related to the wavenumber in the axial direction, and the wavenumbers of a cross-section inside the radiation circle can make a relevant wavenumber for the axial direction propagate well through the shell of a cylinder [11]. Some of these wavenumbers have been confirmed by wavenumber spectra obtained from pipe surface acceleration measurements [12]. Much work has been done on energy distribution among the various wave types and they suggest that, well below the pipe-ring frequency, four wave types are responsible for most of the energy transfer: three axisymmetric waves (n = 0) and a wave (n = 1) related to beam bending [9,12]. Of the n = 0 waves, the first (termed s = 1) is a predominantly fluid-borne wave [32] and involves motion of the shell and fluid. The first wave (s = 1) is explicitly appropriate for measuring an impact signal because it is fluid-based and has lower attenuation than the others.
The wave speed of the first wave is defined as shown below:
where is the longitudinal wave speed in free space, is the fluid bulk modulus, is the density of the fluid, is the mean radius, is Young’s modulus of the cylinder, is the thickness of the cylinder, is the material density of the cylinder, and stands for angular frequency. Equation (1) shows that the wave speed is less than the longitudinal wave of the liquid in free space. This is because of the interaction between an elastic material and an incompressible liquid.
Wave speeds for a steel pipe of three typical nominal diameters with respect to frequency are given in Figure 1. The material properties were chosen as the nominal values of steel and water and are listed in Table 1. The thicknesses were determined by including coating layers in and out of the cylinder. As the diameter increases, the maximum speed around zero frequency goes down, and the frequency that can propagate through the pipe also decreases. The maximum speed obtained for a pipe with 1200 mm nominal diameter at 0 Hz is about 1050 m/s. It is noteworthy that the wave that propagates in a larger pipeline has lower frequency components and is highly dispersive above a certain higher cut-off frequency. It is, therefore, absolutely necessary to make use of an appropriate non-dispersive frequency band to localize the impact source well, using the coupled wave. Moreover, as shown in Figure 1, the coupled wave is always less dispersive at a low frequency. Furthermore, the frequency characteristics of the piping system have to be taken into account to improve the detectability of the coupled wave because every system has its own frequency characteristics. These play the role of a filter that causes enhancement or reduction of the wave energy with respect to the frequency features.
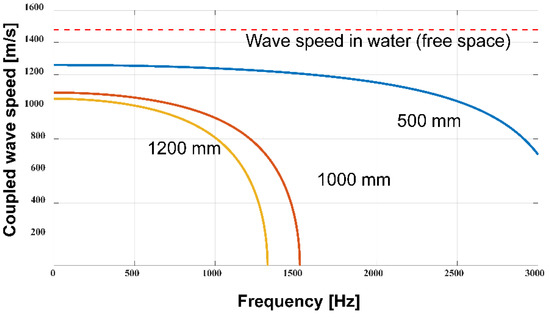
Figure 1.
Dispersion curve for water-pipe coupled wave speeds for steel pipes with different diameters.

Table 1.
Material properties and geometric dimensions for dispersion curve.
2.2. Continuous Wavelet Transform for a Coupled Wave
The wavelet transform is used for time-frequency (scale) analysis with high resolution on both domains. A wavelet transform is categorized as two transformations: one is the continuous wavelet transform (CWT) and the other is the discrete wavelet transform (DWT). CWT was first introduced as a mathematically initiated multi-resolution analysis [33]. DWT was just used to obtain transformation results at the scales sampled along the dyadic sequence. In this study, CWT was employed to detect coupled wave signals and to distinguish them from noise. CWT is formulated as follows:
where is a time signal, is a scale parameter, is a shifting parameter, and stands for wavelet. The wavelet is defined by scaling and shifting a scaling function, as chosen in the dilation equation below:
where is the scaling function, is the wavelet generated with respect to scale parameter and shifting parameter .
The performance of the wavelet transform largely depends on the mother wavelet, and therefore, the similarity between the mother wavelet and signals is of particular importance. Various wavelets have been theoretically taken into account and employed to detect damage in beams and plates [34,35,36] and propagating waves [37,38]. The coupled wave induced by an impact is a quasi-longitudinal wave, being continuous to its derivatives, and this means that wavelet modulus maxima appear in every vanishing moment [34]. Douka et al. [35] mentioned that wavelets with a higher number of vanishing moments give more stable performance, but the number of vanishing moments should be considered with the support size of the wavelets since wavelets with a higher number of vanishing moments have longer supports. The aim of CWT here is to estimate arrival time of the coupled wave with accelerometers; Sun and Tang [39] showed that one vanishing moment is enough to detect singularities in acceleration signals. Therefore, it must be useful to select a simple and basic mother wavelet to detect the arrival time of the fluid-pipe coupled wave, which has its own frequency band. The simplest and most basic wavelet could be the Haar wavelet, which has one vanishing moment and a unity support size. The wavelet function of the Haar wavelet is formulated as
and scaling function is also formulated as
Figure 2 shows the wavelet function and the scaling function. The abrupt change of the Haar wavelet is a good feature that can make peaks in CWT stretch straight along the scale as shown in Figure 3b. It is noteworthy that the localized property of the Haar wavelet is indispensable for estimating an accurate time. Moreover, the narrow and straight extension of peaks of the Haar wavelet in CWT is also essential for the time-delay-estimation algorithm proposed in Section 2.4. The Haar wavelet shows a more straight and narrower feature than other wavelets as shown in Appendix A.
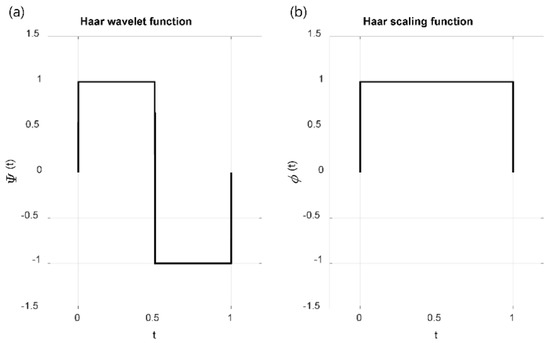
Figure 2.
Haar wavelet, wavelet function (a) and scaling function (b).
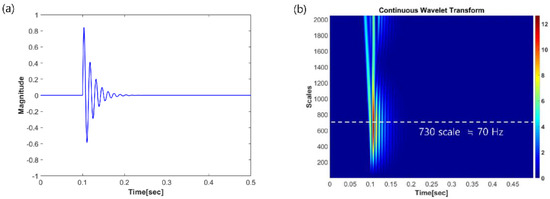
Figure 3.
An impact signal (a) and its continuous wavelet transform (CWT) (b).
Every pipeline shares some common parts (for example, the structural material, coating condition, etc.), but most conditions (such as boundary conditions and environments) are different. Being within the same area, they could share similar features in frequency domain. The frequency response is associated with dispersive characteristics and structural resonance, and the response should be clearly identified for each pipeline before monitoring. Therefore, it is worthwhile observing how the coupled wave could be described in CWT, using the pipe’s resonance. As a simple model, but without loss of generality, a single resonant frequency with damping can be formulated as follows:
where is the magnitude of the signal, is the damping coefficient, represents the resonant frequency of the system, and is the time delay. Suppose that we have a waveform (, , ) that has a 0.1 s time delay (see Figure 3a). The frequency was chosen as a frequency below 100 Hz, which can be regarded as an almost non-dispersive frequency range for the 1200 mm pipeline in Figure 1. In other words, sound speed changes less than 1% with respect to the speed at 0 Hz under 100 Hz. As shown in Figure 3b, the maximum peak in CWT is at 0.1 s in the time domain, and small peaks follow it, similar to a coupled wave signal. Along the y-axis, the maximum peak has a scale parameter of about 730, which corresponds to the resonant frequency, 70 Hz. The modulus of the waveform in CWT is sharply localized in the time domain, but the scale parameter value ranges from 300 to 1200, corresponding to about 60% of the signal energy. Moreover, it is also noteworthy that the maximum peak tends to extend to high scales by being continuously decreased.
2.3. Noise Features in the CWT
In practice, noise is inevitable when we take measures. The noises we frequently observe when we measure vibration signals could be grossly classified into three kinds: white Gaussian noise, banded noise, and burst noise. The power of white Gaussian noise and banded noise is distributed in a certain frequency range, in accord with their statistical properties. These kinds of noises are easily discriminated from signals that have resonant characteristics, such as the coupled wave. Figure 4a shows a typical example of a waveform buried by excessive white noise, of which the signal-to-noise ratio (SNR) is −30 dB. The blue line in Figure 4a is the same signal as in Figure 3a, and the black line is the signal added by white noise. As can be seen in Figure 4b, it is not hard to recognize the impact signal around 0.1 s in time and 730 in scale, in spite of the other peak lines at different times and scales. The banded noises have features similar to those of white noise, except for the band range. Therefore, it is not hard to tell the difference between a coupled wave signal and white noise.
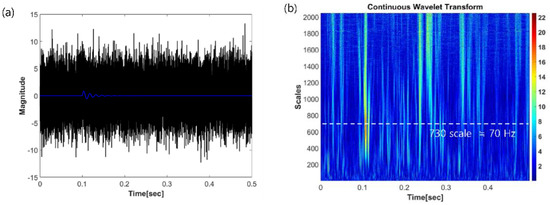
Figure 4.
An impact signal with white noise (SNR: −30 dB) (a) and its continuous wavelet transform (b); the blue line in (a) is the same signal as in Figure 3a.
Burst noise is also prevalently observed in a vibration signal with accompanying white and banded noises. Here, a transient refers to any abrupt change that briefly stays positive or negative. Figure 5a shows an example of a burst noise model following the coupled wave signal. Even though the shape looks quite extreme, substantial burst noise can be generated from minor pressure changes in conjunction with various anomalies, such as irregularity in the pipe and discontinuities. The burst noise has features similar in CWT to the waveform of the coupled wave. In other words, the burst noise has a sharp modulus and temporally local ridges across the scales, like the coupled wave signal in CWT [19]. However, this noise has an obviously distinguishable feature from the coupled wave signal that we are looking for. The abrupt change of burst noise gets larger as the scale increases, but the signal of a coupled wave has a maximum modulus with respect to a certain scale band of the corresponding system, as shown in Figure 5b. It is worth noting that the discrepancy between the signal of interest and burst noise in CWT makes it possible to detect the presence of anomalous impacts that generate waves propagating along the pipeline from lots of background operating noises.
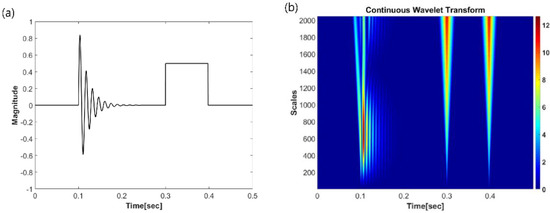
Figure 5.
An impact signal with a burst noise (a) and its CWT (b).
2.4. Time-Delay Estimation for Coupled-Wave Localization
To localize an impact source is, it is necessary not only to reduce noise but also to enhance the target signal. Based on observation of the characteristics of coupled-wave signals and the noises that we face in practice, CWT is able to effectively discriminate the signal and noises by selecting featured frequency bands different from those of white and colored noises. The burst noises are, however, not easy to distinguish in the time-scale domain because they possibly have localized peaks, like the signal, with comparable or even larger intensity.
In an effort to enhance the signal from the wavelet transform and also to remove burst noises, it is necessary to take more steps to find the time delay accurately. Suppose that we have a coupled wave signal that has a dominant scale band with lower limit of and upper limit of . As shown in Figure 3b, for instance, the signal contains most of the signal power in a specific scale band, and the maximum modulus is well localized throughout the scale at a specific time. The burst noise is also localized at a time, like the signal, but the noise has a larger value on a higher scale as shown in Figure 5b. This observation motivated us to propose the following noise removal and signal enhancement steps.
Step 1: At each time (), all wavelet transform coefficients are set to zero if the maximum coefficient outside the upper scale () is larger than the maximum value in the band (), that is
Step 2: At each time (), all wavelet transform coefficients are summed within the band of scale:
The first step ensures the removing of burst noises by comparing the maximum magnitude in the band of interest and that outside the band. This step reinforces the removing of noises further after the following reduction in band noises. The second step aims at improving signal detectability by summing all the signal power in the band.
2.5. Water Transmission Main and Experimental Setup
The experimental pipeline used is a part of a water transmission main in service in South Korea. The main does not have any branches between the monitoring section. The pipe is made of steel and is covered by coating layers both inside and outside the pipe, of which the diameter is 1200 mm and the thickness is 10 mm. The pipeline is buried underground, and its layout is shown in Figure 6a. There are six points accessible without digging and they were used for measuring the wave speed in the piping system, which is discussed further in Section 3.1.
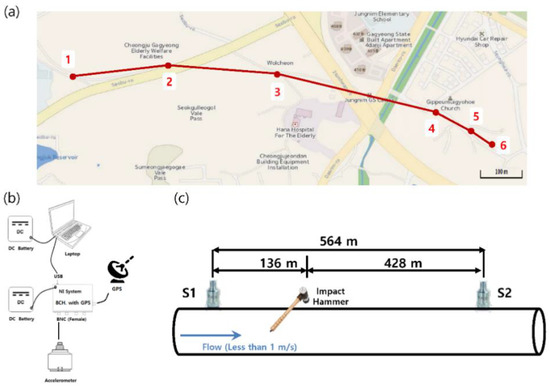
Figure 6.
Schematics for experiments; (a) pipeline layout on map, (b) measurement setup at each sensing point, (c) pipeline and locations of sensors and impact hammer (the sensors and hammer are exaggerated).
The propagated waves were measured by accelerometers (393B12, PCB) and recorded by a National Instruments data acquisition module (NI-9234). The sampling frequency was set to 51.2 kHz to observe the frequency response of the pipeline. The measured data were synchronized, using GPS modules. The schematic diagram for the experimental setup is given in Figure 6b. The impacts were induced using an impact hammer (086D20, PCB). The part of the water transmission main that was used for experimentation is delineated in Figure 6c. Three of the accessible places (3, 4, and 6) were used to mark the time of arrival (different for each sensor) to localize the impact source, of which the length was 564 m.
3. Results and Discussion
3.1. Data Preparation and System Characterization
The methodology proposed here was tested using real vibration data, which were measured by the data acquisition system shown in Figure 6b, and the data were filtered with a low-pass filter with a cut-off frequency of 300 Hz. This is because frequencies above 300 Hz are very dispersive, as we can see in the dispersion curves of the coupled waves in Figure 1.
An example of a vibration signal measured is shown in Figure 7a. The upper figure is the signal measured at S1, and the coupled wave can be identified around 0.16 s. The vibration signal measured at S2 is the lower one in Figure 7a. It also contains the wave that propagates through the pipe around 0.45 s, but the waveform looks quite different from that in the upper figure. It has a smaller magnitude and fewer oscillations than the above one. The latter parts of the signals after 0.5 s can be regarded as just background noise of the pipeline system. The frequency responses of the signals were obtained by taking a Fourier transform, as shown in Figure 7b, of which the magnitudes are in the vibration acceleration level (VAL, dB re 1 [μm/s2]) [40]. The frequency spectra of the signals are in black and the background noises of the system are in red. By comparing them, the characteristics of signals are clearly observable at each place. Specifically, the dominant frequency range of the signal at S1 is 70–120 Hz and 30–60 Hz for S2. As we can see in this figure, the two frequency responses are different, even if they are in the same transmission main. This might be because they have different transfer functions due to different boundary and environmental conditions. This led us first to identify the frequency characteristics of the system to be monitored before applying the proposed procedure.
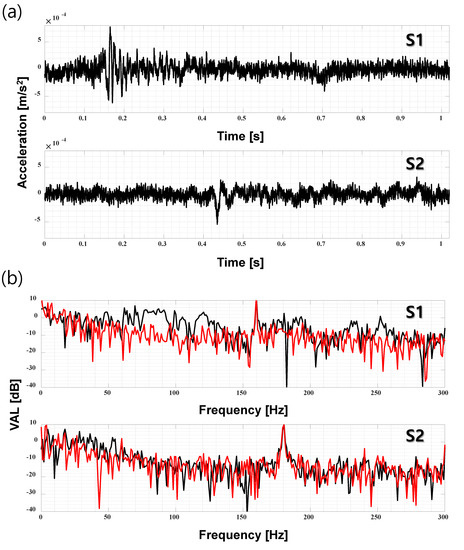
Figure 7.
Vibration signals measured at S1 and S2 and their frequency responses; (a) vibration accelerations, (b) frequency responses of the acceleration signals in black and background noises in red (VAL: Vibration Acceleration Level, dB re ).
To find out the location of the impact inducing the coupled waves, the wave speed should be identified a priori. The wave speeds in water pipes are highly dependent on the pipe wall and water properties, as indicated in Equation (1). The wave is dispersive with respect to frequency and also varies according to the pipe dimensions, as shown in Figure 1. The vibration induced by water-pipe coupled waves are predominantly low-frequency waves [32], and it is noteworthy that they are almost non-dispersive in the low-frequency range.
A separate experiment for estimating wave speed was performed in the pipe section. In this experiment, impact events were caused at one location, then measurements were done at the various locations available within this testbed (Figure 6a). Thirty impacts were caused to estimate the speed with a mean value and standard deviation. The results from the experiments are given in Figure 8, where we plotted the wave speed, estimated as a function of the distance of the measurement points from the impact location. The wave speed tends to gradually increase and saturate as the distance goes up, which well corresponds to the dispersion curve in Figure 1. Therefore, it may be tightly associated with the dispersive features regarding frequency. In other words, it is certainly possible to have faster wave speed over a longer distance because waves at low frequencies are apt to propagate further than waves at higher ones [41]. The statistical values of the wave speed, mean, and standard deviation, with respect to each distance, are listed in Table 2. We made use of the final mean value of the three estimations as the wave speed for the localization experiments.
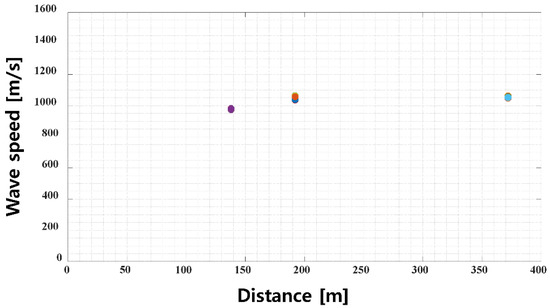
Figure 8.
Wave speed measured with respect to some distances from impact location.
Table 2.
Wave speed measured.
3.2. Features in the CWT
Figure 9 shows the features of the coupled waves in the CWT. The time signals for the transformation are the signals in Figure 7a. The time length for transformation is only 0.5 s because the wave signals emerge within that time. As shown in Figure 9a, the wave has the maximum peak around 0.142 s in time and 700 in scale, and the ridge of the peak does not extend to a high scale. There are also a couple of burst noises followed by the coupled signal, and the noises have larger value as the scale increases. It is noteworthy that the coupled wave propagating from an impact source has a band-limited feature in CWT, which is clearly distinguishable from the burst noise of which the ridge value increases along the scale parameter. On other hand, the CWT for the S2 signal has the maximum peak near the scale parameter of 1200, and its ridge line continues to the highest scale with less value than the peak.
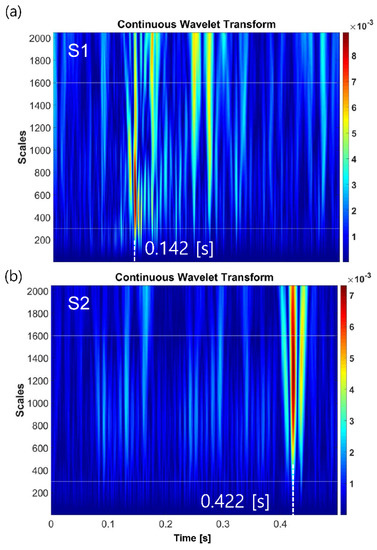
Figure 9.
Continuous wavelet transform of the signals measured at sensing points: S1 (a) and S2 (b).
The signals are from an impact severe enough to be detected by the vibration sensors. Therefore, the resonant features are clearly seen in the CWT. The maximum scale values at two places in Figure 9 are not the same, and the scales correspond fairly well to the frequency bands in Figure 7b. In addition, the pipeline has its own structural damping, proportional to a power law dependence on frequency [42]. This means that low-frequency components propagate longer than higher-frequency ones. Therefore, the frequency at S2 is lower than that at S1. This implies that the frequency responses of the coupled waves induced at different locations could have different frequency bands. This leads us to determine a scale band by which to effectively observe resonant features of the coupled waves. The band we set here for the piping system was from 300 to 1600, which corresponds to 30–170 Hz in the frequency domain. This comes from the observation based on the frequency characteristics of the system in Figure 7, and the high ambient background noise level at a low frequency (< 25 Hz). The maximum scale here was set to 2048 (= 211) to cover the low frequency (25 Hz), and to identify and remove the burst noises.
3.3. Time Delay Estimation and Localization
Following the procedure proposed here, wavelet-based impact localization can be obtained. Figure 10 shows the result of time-delay estimation of the signals in Figure 7 by adopting the proposed method from the CWTs in Figure 9. The maximum peak in each figure stands for the largest signal energy in the band we set, and this is certainly associated with the coupled waves propagated from an impact. Therefore, the time at the maximum peak indicates the time of arrival (TOA) to a sensing point from the impact position, and the difference between the TOAs finally provides the impact location. Let us denote the distance of impact location as from the midst point between S1 and S2. Then, the signals measured at each sensing point can be formulated by Fourier series as follows:
where stands for the number of frequencies in the band of interest and is corresponding amplitude and frequency, respectively. is time of arrival to each sensing point and can be written as follows:
where is distance between the sensing points, and is the wave speed. Then, the impact location can be obtained from time difference of TOA as follows:
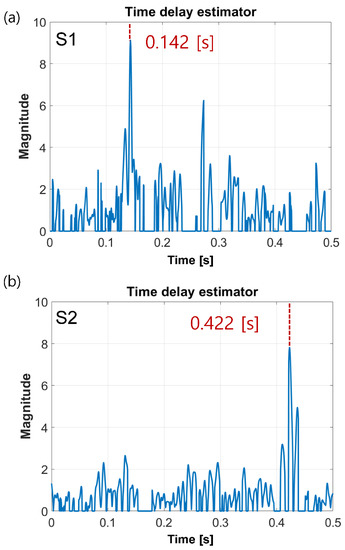
Figure 10.
Wavelet−based time delay estimation of the signals measured at sensing points S1 (a) and S2 (b).
Equation (11) shows that impact location is closer to S1 when the value is positive and closer to S2 when negative.
The results in Figure 10 well matches the peak times in Figure 9, and, moreover, the zero values set in Figure 10 correspond well to the time of the burst noises in Figure 9. In practice, there might be situations with higher and more frequent burst noises. Figure 11 shows a case with coupled wave signals in the time domain that are barely visible, and many higher ridges that reach to the end of the scale parameter rather than to the coupled wave peak are distributed in Figure 11c. It might not be easy to identify the signal of interest not only in the time domain but also in the time-scale distribution due to the low signal-to-noise ratio. However, the proposed method is able to provide a clear maximum peak by removing the larger burst noises. The performance of burst noise reduction can be seen clearly in Figure 11e. The black dotted line is only for band summation (except Step 1) in the methodology proposed, and therefore the maximum peak in black indicates a wrong time delay of a burst noise as indicated by the blue triangle in Figure 11e. This is because the burst noise has more energy than the coupled wave. In other words, just a simple summation could not exclude the higher burst noises. This is because the burst noises are also picked up by the wavelet transform, owing to their singularity. However, the peak in red precisely points out the correct time delay by agreeing with the wave speed and distance between the sensor and impact. By comparing the red and black lines, the burst noises with high magnitude are successfully removed, using the proposed method.
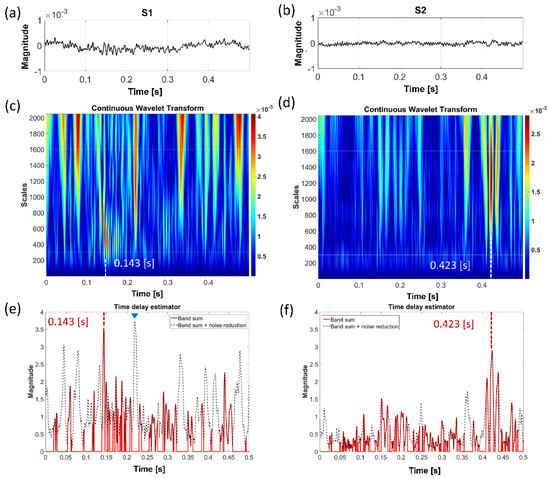
Figure 11.
Wavelet−based time delay estimation with high burst noises; (a) vibration acceleration signal measured at S1, (b) vibration acceleration signal measured at S2, (c) CWT at S1, (d) CWT at S2, (e) time delay estimation at S1, (f) time delay estimation at S2.
Furthermore, as a point of comparison to the existing approaches, we also implemented the cross-correlation method [43], which has been variously applied to pipelines [44,45,46]. It is noteworthy that the proposed method has less localization error (3.795 m) than the error of the conventional cross-correlation method as shown in Table 3. Moreover, the standard deviation of the error from the wavelet-based method is much narrower (within 1 m), and therefore, the proposed method gives more precise and robust localization results than the conventional method.
Table 3.
Impact event localization results.
4. Conclusions
We propose a wavelet-based impact source-locating approach for use in water mains by measuring water-pipe coupled waves with vibration accelerometers for structural health monitoring. As for a real-time monitoring scheme, wavelet analysis itself is not solely adequate due to the computational load. The algorithm we proposed is, therefore, a complementary monitoring algorithm, which provides more information than conventional rapid screening parameters, such as peak detection or RMS value over threshold.
The coupled wave approach is a good candidate to provide even longer-range monitoring than that provided by the conventional bending wave approach due to its non-dispersive propagation at low frequencies. In addition, this approach is also useful for detecting relatively low-magnitude impact sources, such as third-party damage and minor pressure transients with the vibration sensors. However, the vibration signal is always corrupted by various kinds of noise from the surroundings. The proposed approach, therefore, makes use of the wavelet de-noising performance and additional signal processing steps to improve noise reduction and signal detectability. In particular, the proposed procedure demonstrated that the burst noise that often contaminates signals with similar features in CWT was successfully removed.
The example experiments have shown that wavelet-based impact-source localization is able to estimate locations more precisely with lower error than the conventional cross-correlation algorithm. To improve this approach further, future research should be devoted to identifying detectability with respect to the signal-to-noise ratio and propagating distance.
Author Contributions
Conceptualization, C.-S.P. and D.-J.Y.; methodology, C.-S.P.; experimental design: S.-H.L.; writing—original draft preparation, C.-S.P.; writing—review and editing, S.-H.L. and D.-J.Y.; All authors have read and agreed to the published version of the manuscript.
Funding
This research was funded by Korea Ministry of Environment supported through Advanced Water Management Research Program (grant number 127587) and also partly supported through Project for Developing Innovative Drinking Water and Wastewater Technologies (grant number 2020002700016) by Korea Environment Industry & Technology Institute.
Institutional Review Board Statement
Not applicable.
Informed Consent Statement
Not applicable.
Acknowledgments
This work is supported by Korea Research Institute of Standards and Science under the project “Infrastructure safety measurement (KRISS-20011051)”.
Conflicts of Interest
The authors declare no conflict of interest.
Appendix A
Some basic wavelets are compared with the Haar wavelet. The wavelets are selected with regards to vanishing moments and support widths, and they show their own peak behavior and peak energy dispersion as the scale increases. Thus, eight wavelets, except Haar, are employed for comparison: Coiflet-1, Gauss-1, Daubechies-2 and 6, Symlet-2, Mexican hat, Meyer, and Morlet. The first row in Figure A1 is for the wavelets with one vanishing moment, the second row is for two vanishing moments, and the third is for more than two vanishing moments. Daubechies-6 has six moments, and Meyer and Morlet are indefinite. Coiflet-1, Daubechies-2, and Symlet-2 wavelets show almost similar CWTs to the Haar wavelet, but the others get broader as the scale increases. Even peaks of Meyer and Morlet wavelets are not coincident to the true time (white dotted line). Mexican hat and Daubechies-6 wavelets are well coincident to the true time, but the peak energy is more dispersive than the Haar wavelet. One vanishing moment is enough to detect singularities in the acceleration signal [38], and the Coiflet-1 wavelet has a longer support width of five than the unit support width of the Haar wavelet.

Figure A1.
Comparison with CWTs of wavelets; (a) Haar, (b) Coiflet 1, (c) Gauss 1, (d) Daubechies 2, (e) Symlet 2, (f) Mexican Hat, (g) Daubechies 6, (h) Meyer, (i) Morlet (white dotted line stands for the true time, and red dotted lines are peak tracking lines of each wavelet’s CWT).
Figure A1.
Comparison with CWTs of wavelets; (a) Haar, (b) Coiflet 1, (c) Gauss 1, (d) Daubechies 2, (e) Symlet 2, (f) Mexican Hat, (g) Daubechies 6, (h) Meyer, (i) Morlet (white dotted line stands for the true time, and red dotted lines are peak tracking lines of each wavelet’s CWT).

References
- Colombo, A.F.; Karney, B.W. Energy and costs of leaky pipes: Toward comprehensive picture. J. Water Res. Plan. Manag. 2002, 128, 441–450. [Google Scholar] [CrossRef]
- Kunlun, X.; Fei, L.; Tao, T.; Ningyin, X.; Zhaolong, Y. Water losses investigation and evaluation in water distribution system—The case of SA city in China. Urban Water J. 2015, 12, 430–439. [Google Scholar] [CrossRef]
- McKenzie, R.; Wegelin, W. Implementation of Pressure Management in Municipal Water Supply Systems. In Proceedings of the EYDAP Conference “Water: The Day after”, Greece, 2009. Available online: https://www.miya-water.com/fotos/artigos/03_implementation_of_pressure_management_in_municipal_water_supply_systems_3323280065a328bc009ead.pdf (accessed on 5 May 2021).
- Xing, L.; Sela, L. Unsteady pressure patterns discovery from high-frequency sensing in water distribution systems. Water Res. 2019, 158, 291–300. [Google Scholar] [CrossRef]
- Duong, B.P.; Kim, J.-Y.; Jeong, I.; Kim, C.H.; Kim, J.-M. Acoustic emission burst extraction for multi-level leakage detection in a pipeline. Appl. Sci. 2020, 10, 1933. [Google Scholar] [CrossRef]
- Trivedi, S.; Misra, S. Evaluating changes in fundamental cross-sectional mode of vibrations using a modified time domain for impact echo data. NDT&E Int 2012, 49, 10–17. [Google Scholar] [CrossRef]
- Yu, C.-P. Evaluation of pile lengths using impact-induced flexural vibrations—A frequency domain approach. NDT&E Int. 2019, 108, 102174. [Google Scholar] [CrossRef]
- Aliabadi, H.K.; Ahamdi, A.; Keramat, A. Frequency response of water hammer with fluid-structure interaction in a viscoelastic pipe. Mech. Syst. Signal Proc. 2020, 144, 106848. [Google Scholar] [CrossRef]
- Fuller, C.R.; Fahy, F.J. Characteristics of wave propagation and energy distributions in cylindrical elastic shells filled with fluid. J. Sound Vib. 1982, 81, 501–518. [Google Scholar] [CrossRef]
- Prek, M. Analysis of wave propagation in fluid-filled viscoelastic pipes. Mech. Syst. Signal Proc. 2007, 21, 1907–1916. [Google Scholar] [CrossRef]
- Muggleton, J.M.; Brennan, M.J.; Pinnington, R.J. Wavenumber prediction of waves in buried pipes for water leak detection. J. Sound Vib. 2002, 249, 939–954. [Google Scholar] [CrossRef]
- Fuller, C.R. The input mobility of an infinite circular cylindrical elastic shell filled with fluid. J. Sound Vib. 1983, 87, 409–427. [Google Scholar] [CrossRef]
- Lee, Y.-S.; Yoon, D.-J.; Lee, S.-S. Leak location identification of water pipes using elastic waves. Key Eng. Mater. 2004, 270–273, 965–970. [Google Scholar] [CrossRef]
- Lee, Y.-S.; Yoon, D.-J.; Kang, S.; Jun, K.; Choi, B. Leak locating experiment for actual underground water supply pipelines with a novel locating system. Mod. Phys. Lett. 2008, B22, 1013–1018. [Google Scholar] [CrossRef]
- Lee, P.J.; Duan, H.-F.; Tuck, J.; Ghidaoui, M. Numerical and experimental study on the effect of signal bandwidth on pipe assessment using fluid transients. J. Hydraul. Eng. 2015, 141, 04014074. [Google Scholar] [CrossRef]
- Finnveden, S. Simplified equations of motion for the radial-axial vibrations of fluid filled pipes. J. Sound Vib. 1997, 208, 685–703. [Google Scholar] [CrossRef]
- Mallat, S.; Hwang, W.L. Singularity detection and processing with wavelets. IEEE Trans. Inform. Theory 1992, 38, 617–643. [Google Scholar] [CrossRef]
- Ferrante, M.; Brunone, B. Leak detection in pressurized pipes by means of wavelet analysis. In Proceedings of the 4th International Conference on Water Pipelines Systems, Calgary, AB, Canada, 29 September–3 October 2002; BHR Group Limited: Cranfield, UK, 2001; pp. 243–256. [Google Scholar]
- Ferrante, M.; Brunone, B. Pipe system diagnosis and leak detection by unsteady-state tests: 2. Wavelet analysis. Adv. Water Resour. 2003, 26, 107–116. [Google Scholar] [CrossRef]
- Ferrante, M.; Brunone, B.; Meniconi, S. Wavelets for the analysis of transient pressure signals for leak detection. J. Hydraul. Eng. 2007, 133, 1274–1282. [Google Scholar] [CrossRef]
- Srirangarajan, S.; Allen, M.; Preis, A.; Iqbal, M.; Lim, H.B.; Whittle, A.J. Wavelet-based burst event detection and localization in water distribution systems. J. Signal Process. Syst. 2013, 72, 1–16. [Google Scholar] [CrossRef]
- Ting, L.L.; Tey, J.Y.; Tan, A.C.; King, Y.J.; Faidz, A.R. Improvement of acoustic water leak detection based on dual tree complex wavelet transform-correlation method. In IOP Conference Series: Earth and Environmental Science 268, International Conference on Sustainable Energy and Green Technology 2018, Kuala Lumpur, Malaysia, 11–14 December 2018; IOP Publishing: Bristol, UK, 2019; p. 012025. [Google Scholar] [CrossRef]
- Mondal, S. Pressure Transieints in Wellbores: Water Hammer Effects and Implications for Fracture Diagnostics. Master’s Thesis, University of Texas at Austin, Austin, TX, USA, 2010. [Google Scholar]
- Turkowski, M.; Bratek, A.; Stowikowski, M. Methods and systems of leak detection in long range pipelines. J. Automat. Mob. Robot Intell. Syst. 2007, 1, 39–46. [Google Scholar]
- Adedeji, K.B.; Hamam, Y.; Abe, B.T.; Abu-Mahfouz, A.M. Towards achieving a reliable leakage detection and localization algorithm for application in water piping networks: An overview. IEEE Access 2017, 5, 20272–20285. [Google Scholar] [CrossRef]
- Knapp, C.H.; Carter, G.C. The generalized correlation method for estimation of time delay. IEEE Trans. Acoust. Speech Signal Process. 1976, ASSP24, 320–327. [Google Scholar] [CrossRef]
- Segal, M.; Weinstein, E.; Musicus, B.R. Estimate-Maximize algorithms for multichannel time delay and signal estimation. IEEE Trans. Signal Process. 1991, 39, 2633–2636. [Google Scholar] [CrossRef]
- Wu, S.Q.; So, H.C.; Ching, P.C. Improvement of TDOA measurement using wavelet denoising with a novel thresholding technique. In Proceedings of the IEEE International Conference on Acoustics, Speech, Signal Processing, Munich, Germany, 21–24 April 1997; Volume I, pp. 539–542. [Google Scholar] [CrossRef]
- Park, C.-S.; Jeon, J.-H.; Kim, Y.-H. Localization of a sound source in a noisy environment by hyperbolic curves in quefrency domain. J. Sound Vib. 2014, 333, 5630–5640. [Google Scholar] [CrossRef]
- Bak, P.; Tang, C.; Wiesenfeld, K. Self-organized criticality: An explanation of 1/f noise. Phys. Rev. Lett. 1987, 59, 381–384. [Google Scholar] [CrossRef]
- Patange, K.B.; Khan, A.R.; Behere, S.H.; Shaikh, Y.H.; Arts, S. Traffic noise: 1/f Characteristics. Int. J. Artif. Life Res. 2011, 2, 1–11. [Google Scholar] [CrossRef]
- Pinnington, R.J.; Briscoe, A.R. Externally applied sensor for axisymmetric waves in a fluid filled pipe. J. Sound Vib. 1994, 173, 503–516. [Google Scholar] [CrossRef]
- Grossmann, A.; Morlet, J. Decomposition of hardy functions into square integrable wavelets of constant shape. SIAM J. Math. Anal. 1984, 15, 723–736. [Google Scholar] [CrossRef]
- Hong, J.-C.; Kim, Y.Y.; Lee, H.C.; Lee, Y.W. Damage detection using the Lipschitz exponent estimated by the wavelet transform: Applications to vibration modes of a beam. J. Sound Vib. 2002, 39, 1803–1816. [Google Scholar] [CrossRef]
- Douka, E.; Loutridis, S.; Trochidis, A. Crack identification in plates using wavelet analysis. J. Sound Vib. 2004, 270, 279–295. [Google Scholar] [CrossRef]
- Rucka, M.; Wilde, K. Application of continuous wavelet transform in vibration based damage detection method for beams and plates. J. Sound Vib. 2006, 297, 536–550. [Google Scholar] [CrossRef]
- Kim, I.K.; Kim, Y.Y. Damage size estimation by the continuous wavelet ridge analysis of dispersive bending waves in a beam. J. Sound Vib. 2005, 287, 707–722. [Google Scholar] [CrossRef]
- Bogiatzis, P.; Ishii, M. Continuous wavelet decomposition algorithms for automatic detection of compressional- and Shear-wave arrival times. B Seismol. Soc. Am. 2015, 105, 1628–1641. [Google Scholar] [CrossRef]
- Sun, Q.; Tang, Y. Singularity analysis using continuous wavelet transform for bearing fault diagnosis. Mech. Syst. Signal Proc. 2002, 16, 1025–1041. [Google Scholar] [CrossRef]
- Beranek, L.L.; Ver, I.L. Noise and Vibration Control Engineering: Principles and Applications; John Wiley & Sons Inc.: New York, NY, USA, 1992; pp. 18–22. [Google Scholar]
- Hunaidi, O.; Chu, W.T. Acoustical characteristics of leak signals in plastic water distribution pipes. Appl. Acoust. 1999, 58, 235–254. [Google Scholar] [CrossRef]
- Szabo, T.L. Time domain wave equations for lossy media obeying a frequency power law. J. Acoust. Soc. Am. 1994, 96, 491–500. [Google Scholar] [CrossRef]
- Newland, D.E. An Introduction to Random Vibrations, Spectral & Wavelet Analysis; Longman Scientific & Technical: Essex, UK, 1975; pp. 77–79. [Google Scholar]
- Hafezi, M.M.; Mirhosseini, M. Application of cross-correlation in pipe condition assessment and leak detection; using transient pressure and acoustic waves. Resour. Environ. 2015, 5, 159–166. [Google Scholar] [CrossRef]
- Gao, Y.; Brennan, M.J.; Liu, Y.F.; Almeida, C.L.; Joseph, P.F. Improving the shape of the cross-correlation function for leak detection in a plastic water distribution pipe using acoustic signals. Appl. Acoust. 2017, 127, 24–33. [Google Scholar] [CrossRef]
- Kousiopoulos, G.; Papastavrou, G.; Karagiorgos, N.; Nikolaidis, S.; Efstathiadis, T.; Kalfas, A. Pipeline leak localization techniques. In Proceedings of the 2019 Panhellenic Conference on electronics & Telecommunications (PACET), Volos, Greece, 8–9 November 2019; pp. 1–4. [Google Scholar]


Publisher’s Note: MDPI stays neutral with regard to jurisdictional claims in published maps and institutional affiliations. |
© 2021 by the authors. Licensee MDPI, Basel, Switzerland. This article is an open access article distributed under the terms and conditions of the Creative Commons Attribution (CC BY) license (https://creativecommons.org/licenses/by/4.0/).