Abstract
In the research on the influence of pore structure on the macroscopic mechanical properties of concrete, the experimental method cannot realize the accurate control of the pore structure parameters, and the research based on the numerical simulation method is insufficient in the scientific simulation and parameterization of the complex pore structure. A new numerical concrete modeling method is proposed, which introduces the total porosity, pore gradation, pore size, and sub-porosity of each gradation segment to realize the accurate simulation and parameterization of the pore structure. Based on the control variable method, 25 concrete mesoscopic models with the same aggregate structure and different pore structures are established, and uniaxial tensile experiments are performed. The pore structure accelerates the process of damage expansion from the periphery to the center of the specimen and makes the damage inside the cement mortar more localized. There are obvious exponential function relationships of three pairs: total porosity and elastic modulus, PSSA and elastic modulus, and tensile strength and total porosity. There is an obvious quadratic polynomial function relationship between tensile strength and specific surface area. For specimens with the same aggregate structure and total porosity, the elastic modulus increases with the increase of the macropore content, and the tensile strength and elastic modulus are basically not affected by the average pore radius. The effect of pore space distribution and sub-porosity on peak strain is greater than that of total porosity, but no obvious regularity is shown. For pores with a radius in the range of 0.15–0.8 mm, the smaller the pores, the greater the effect of their porosity on the elastic modulus and tensile strength, and the less effect on the peak strain.
1. Introduction
According to the Analytic Hierarchy Process, which is an important research method and way of thinking in modern science, the research scale of concrete can be divided into the macro level (3~4 times the maximum aggregate volume), the meso level (10−3~100 mm), and the micro level (10−6~10−3 mm) [1]. At the meso level, concrete is generally regarded as a four-phase composite material composed of coarse aggregates, cement mortar, interfacial transition zone (ITZ), pores, and initial defects [2]. The mechanical properties of concrete are controlled by its mesoscopic components. Studying the influence of mesoscopic components on its mechanical properties lays the foundation for scientifically revealing and accurately describing the mechanical properties of concrete and improving the mechanical properties of concrete, which has received extensive attention from scholars. In terms of the pore phase, earlier studies have mainly focused on the effect of total porosity on the mechanical properties of concrete [2,3,4,5]. Further studies [6,7,8] show that the macroscopic mechanical properties of concrete still vary greatly under the same total porosity, which makes researchers gradually pay attention to the influence of pore structure and have done significant work in this area. Many scholars adopt the experimental method, which is to test the pore structure parameters of concrete, such as porosity, pore size, and pore distribution, and then study the relationship between the pore structure parameters and macroscopic mechanical properties. For example, Gao Hui [6] and Du Plessis A [9] measured the area percentage of pores in different pore size ranges by optical microscope and established the relationship between compressive strength and graded porosity. B. Kondraivendhan [10] and Zhao Jing [11] studied the effects of pore distribution and pore size on the durability and strength of concrete by the mercury intrusion method. Liu Jianmin et al. [12] indirectly established the relationship between the pore structure and the macroscopic mechanical properties of concrete by adding air-entraining agents to concrete specimens. However, there is an obvious defect of the experimental method in establishing the relationship between pore structure parameters and concrete mechanical properties; that is, it is almost impossible to change the pore structure alone without changing the aggregate structure. This makes the change of concrete mechanical properties not only produced by the change of pore structure, but also by the change of aggregate structure. An effective way to solve this problem is to establish mesoscale finite element models of concrete and use numerical analysis method to conduct research in this area. There are two main approaches to generate mesoscale models of concrete: the image-based modeling method and the parametric modeling method. The former builds the model completely based on the images obtained from the test, which is its advantage; that is, it can accurately reflect the size, shape, and distribution of concrete mesoscopic components [13,14,15,16,17,18,19,20]. However, it has its disadvantage when it is applied to study the relationship between the pore structure parameters and the mechanical properties of concrete; like the experimental method, it is impossible to change the pore structure alone without changing the aggregate structure. The parametric modeling method can easily change the internal structure parameters while parameterizing the internal structure information to establish a numerical model, which provides the possibility to solve the above problems. As a typical representative of parametric modeling methods, the concrete random aggregate modeling method (CRAMM) has been widely used because it is clear and convenient in modeling. However, the existing CRAMMs have many shortcomings in the application to the study of the relationship between pore structure parameters and concrete mechanical properties. Most existing concrete random aggregate models (CRAMs) ignore pores [21,22,23,24,25,26] and treat concrete as either a two-phase (mortar and aggregates) or three-phase (mortar, aggregates, and ITZ) material. So far, only a few CRAMs contain the pore phase [2,3,4,27,28,29] and model the pore phase as a series of randomly distributed single-graded circular or elliptical pores, which is inconsistent with the real pore structure in concrete. Moreover, the above studies mainly focused on the effect of total porosity on the mechanical properties of concrete and ignored other pore structure parameters such as pore gradation, pore size, and pore distribution. For example, Wang Xiaofeng [2] and Chen Qingqing [3] simulated the pore structure as a series of randomly distributed circular or elliptical pores whose diameters were uniformly distributed in the range of 2 to 4 mm. According to the CRAMM, some scholars have also begun to explore the influence of pore structure on the mechanical properties of concrete. For example, Li Kungang [29] used a series of randomly distributed circular or elliptical pores with a certain fixed diameter to simulate the pore structure, established concrete models with different pore sizes and porosity, and studied the effects of porosity, pore size, and pore shape on the mechanical properties of concrete. However, the pore structure he established did not take into account the pore gradation and was too different from the actual pore structure in concrete. Zhu Liang [28] preliminarily explored the establishment of a complex pore structure based on fractal theory, and based on this modeling method, they studied the influence of total porosity on the mechanical properties of concrete. However, this pore structure modeling method can only control the total porosity, pore fractal dimension, and the maximum and minimum pore sizes, but cannot control the pore gradation and the sub-porosity and pore size of each gradation segment. Therefore, this method is defective in studying the effects of pore structure parameters on the mechanical properties of concrete. To sum up, there are still many deficiencies in the research on the influence of pore structure on the mechanical properties of concrete, especially in scientific simulation and parameterization of the complex pore structure and the accurate application of the control variable method (CVM).
This paper aims to accurately use the CVM to study the influence of the pore structure on the mechanical properties of concrete on the basis of accurately constructing the complex pore structure. Firstly, based on the existing modeling methods, a new CRAMM is proposed, which introduces the concepts of pore gradation and sub-porosity to establish a more reasonable and realistic pore structure and can realize the independent change of pore structure parameters such as total porosity, pore gradation, pore size, and sub-porosity of each grading segment. Based on the CVM, 25 CRAMs with the same aggregate structure and different pore structures are established. Secondly, zero-thickness cohesive interfacial elements (CIEs) governed by nonlinear normal and shear traction-separation laws are inserted within cement mortar and ITZ to simulate complex crack initiation and propagation. Finally, uniaxial tensile experiments are performed on these specimens. In this paper, the scientific simulation of complex pore structure and the accurate use of CVM are adopted for the first time to study the influence of total porosity, sub-porosity, pore specific surface area (PSSA), and average pore radius on the concrete damage failure process, elastic modulus, tensile strength, and peak strain. Some valuable conclusions are obtained, which qualitatively and quantitatively describe the effect of pore structure on the mechanical properties of concrete and help to understand and describe the mechanical behavior of concrete more scientifically.
2. Generation of Mesostructures and Numerical Models
2.1. Size Distribution of Aggregates
Concrete aggregate gradation, determined by the Fuller curve, can produce optimized structural density and strength [30]. According to the Varavan formula for 2D transformed from the Fuller curve [31], the probability of aggregates with diameters less than D0 and the area of the aggregates within a grading segment [Ds, Ds+1] are shown in Equations (1) and (2), respectively.
where Pk is the volume percentage of aggregates, usually 0.75, P (D < D0) is the probability of aggregates with diameters less than D0, D0 is the sieve diameter, D is the actual size of the aggregate, Dmax and Dmin are the maximum and minimum size of aggregates, respectively, Ragg is the area fraction of aggregates, Aagg is the area of aggregates within a grading segment [Ds, Ds+1], and Acon is the cross-sectional area of the concrete specimen.
Generally, the area of aggregates accounts for 60~80% of the area of concrete. Based on simplification ideas and previous research experience [2,32,33], only aggregates with diameters greater than 2.36 mm are considered in this study, and the smaller aggregates are assumed to mix with the cement to form a uniform mortar. Table 1 lists the aggregate gradations and the aggregate area of the corresponding gradation, which is the same as in [2].

Table 1.
Size distribution of aggregates.
2.2. Size Distribution of Pores
Concrete is a typical porous material with pore sizes spanning micro, meso, and macro scales [34]. Statistics show that the porosity of ordinary concrete is generally no less than 8%, in which the porosity of pores with diameters between 53 and 106 nm is about 1%, and the porosity of pores with diameters larger than 106 nm is about 2 to 5% [35]. Jin Nanguo [36] found that it is unscientific to use total porosity to characterize the complex pore structure in concrete, and the pore size distribution also has an important impact on the strength of concrete. Qin Qian [37] used CT scanning technology to observe the spatial distribution and morphological characteristics of pores in the concrete and found that the pores are randomly generated and obey uniform distribution. Gao Hui [6] used the optical microscopic image analysis method, based on quantitative stereology, to obtain some parameters of pore structure in concrete, such as the pore size, pore gradation, and pore spatial distribution, and measured the compressive strength of the specimens with different pore structures.
Based on the weakening degree of pores on the mechanical properties of concrete, Wu Zhongwei divided the pores into harmless pores, small hazardous pores, medium hazardous pores, and large hazardous pores according to the pore size [38]. It is generally believed that small pores (<10 μm) mainly affect the permeability and durability of concrete, while large pores (>200 μm) affect the compressive strength of concrete [39,40]. Based on a comprehensive evaluation of calculation cost and research purpose, only the pores with radii greater than 150 μm are simulated, and the smaller pores are assumed to mix with the cement to form a uniform mortar. To simulate the pore structure in concrete more realistically, it is comprehensively determined based on the real observed data [6,37,41]. Based on Gao Hui’s experimental research experience [6], the pore structure established in this paper includes four pore gradations. Concrete models with total porosity of 0%, 1%, 2%, 3%, and 4% were established. The specimens with the same total porosity are divided into three categories according to the different pore structure types, namely, S-type specimens with a relatively large proportion of small pores, L-type specimens with a relatively small proportion of small pores, and M-type specimens with a moderate proportion of small pores. The sub-porosity of each gradation segment of pores set in the paper is within the range of the actual measured sub-porosity of the corresponding gradation in the literature [41] to ensure the rationality of the sub-porosity values. To study the influence of the spatial distribution of pores on the mechanical properties of concrete, the specimens with the same aggregate structure, total porosity, pore gradation, pore size, and sub-porosity of each gradation segment of pores but different pore spatial distribution are established. All established concrete specimens and related parameters are shown in Table 2, in which the average pore radius and PSSA are important parameters to describe the pore structure [42,43].
Table 2.
Concrete specimens and pore structure parameters.
2.3. The Generation of Aggregate Structure and Pore Structure
Based on the generation method proposed by X.F. Wang et al. [2], a new generation program of aggregate structure and pore structure written in ANSYS APDL language is proposed, which realizes a more accurate simulation of pore structure and can change the pore structure separately without changing the aggregate structure. The pore structure is controlled by some parameters, such as the total porosity, pore gradation, pore size, and sub-porosity of each gradation segment. The details of the program are shown below.
- Input controlling parameters:
The controlling parameters contain four categories. The first category is related to the size of the concrete specimen, including the length, width (2D), and height (3D) of the specimen. The second category is aggregate-related parameters, including the Fuller curve, the aggregate area/volume fraction, and the aggregate type and shape. The size distribution of aggregates shown in Section 2.1 is used in this paper. The third category is pore-related parameters, including the pore shape, total porosity, pore gradation, pore size, and sub-porosity of each gradation segment of pores, etc. The size distribution of pores described in Section 2.2 is used in this paper. The fourth category is the structural parameters of concrete, including the minimum distance, , between the pore and the specimen boundary and the minimum thickness, , of the mortar layer, which surrounds the aggregate, etc. In CRAMs, aggregates are generally simulated as circles, ellipses, or polygons. X.F. Wang [2] found that the shape of aggregates has a certain influence on the mechanical properties of concrete, but it is not significant. Therefore, it is feasible to simulate the aggregates as circles, ellipses, or polygons. Zhu Liang [28] found that most of the pores in concrete are spherical, so the aggregates and pores in this paper are both simulated as circles.
- 2.
- Generate and place the aggregate:
Firstly, generate an aggregate, which starts with the grading segment containing the largest aggregates. In each grading segment [Di, Di+1], the aggregate size is uniformly distributed. Secondly, place the aggregate. Three random numbers for the two-dimensional specimen or four random numbers for the three-dimensional specimen are generated to determine the position and radius of the aggregate. Before that, three conditions are checked: (1) all aggregates should be inside the specimen, and the distance between the aggregate boundary and the specimen boundary is greater than ; (2) there is no overlapping/intersection between this aggregate and any other existing aggregates; (3) the distance between any two aggregates should be greater than . If any of three conditions is not met, the three random numbers (2D)/four random numbers (3D) should be ignored, and a new set of random numbers will be generated to place the aggregate in a new position. If these conditions are all met, the aggregate is generated and placed successfully, and the three random numbers (2D)/four random numbers (3D) are stored in an array, Aagg, which has n rows, and n is equal to the number of aggregates.
- 3.
- Generate and place all aggregates to form an aggregate structure:
Repeat step 2 until the remaining aggregate area in this gradation segment is less than , which is transferred to the next smaller gradation segment. Repeat steps 2 and 3 in all other gradation segments, and then the array Aagg containing all aggregate information will be generated, through which the aggregate structure can be established.
- 4.
- Generate and place the pore:
Firstly, set an array, Kpor, which has (n + m) rows and three columns for 2D specimens or four columns for 3D specimens, where n is the number of aggregates and m is the number of pores. The first n rows of array Kpor are the same as array Aagg. Secondly, generate a pore, which starts with the grading segment containing the largest pores. In each grading segment, [ei, ei+1], the pore size is uniformly distributed. Before that, three conditions are checked: (1) all pores should be inside the specimen, and the distance between the pore boundary and the specimen boundary should be greater than ; (2) there is no overlapping/intersection between this pore and any existing aggregates and other pores; (3) the distance between the pore boundary and the boundary of any aggregate is greater than . If any of these three conditions is not met, the three random numbers (2D)/four random numbers (3D) should be ignored, and a new set of random numbers will be generated to place the pore in a new position. If these conditions are all met, the pore is generated and placed successfully, and the three random numbers (2D)/four random numbers (3D) are stored in the array, Kpor, starting from the (n + 1)th row.
- 5.
- Generate and place all pores to form a pore structure:
Repeat step 4 until the remaining pore area in this gradation segment is less than , which is transferred to the next smaller gradation segment. Repeat steps 4 and 5 in all other gradation segments, and then the array, Kpor, containing all aggregate and pore information will be generated, through which the aggregate structure and pore structure in concrete can be established.
Using the above generation and placement algorithm, CRAMs that can accurately simulate aggregate and pore structures can be easily established. Change the pore structure parameters in step 1, keep the array, Aagg, in step 3 unchanged, perform steps 4 and 5, and then CRAMs with the same aggregate structure but different pore structures controlled by the pore structure parameters can be established.
According to the CVM, 25 concrete specimens with the same aggregate structure and different pore structures were established, and the relevant parameters are shown in Table 2. The size of the concrete specimens established in this paper are all 50 mm × 50 mm, and the structural parameters are . Figure 1 shows some concrete specimens with the same aggregate structure and total porosity of 1%, 2%, 3%, and 4% (aggregate area ratio is 45%). Figure 2 shows some concrete specimens with the same aggregate structure and total porosity but different pore structures as the specimens in Figure 1.
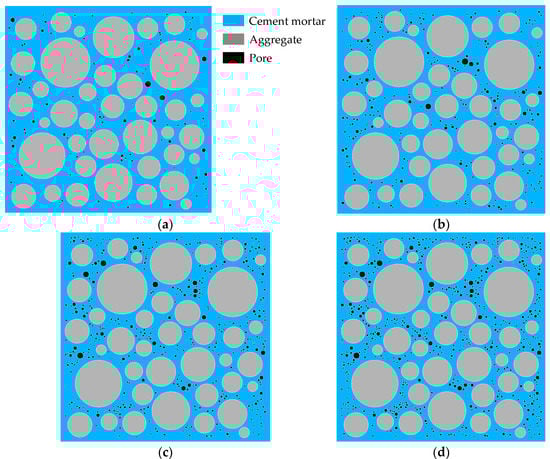
Figure 1.
Some specimens with the same aggregate structure and total porosity of 1%, 2%, 3%, and 4%. (a) 1-1-X (total porosity = 1%); (b) 2-1-X (total porosity = 2%); (c) 3-1-X (total porosity = 3%); (d) 4-1-X (total porosity = 4%).
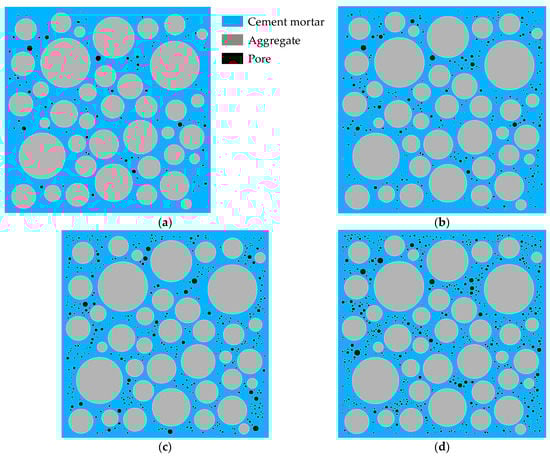
Figure 2.
Some specimens with the same aggregate structure and total porosity but different pore structure as the specimens shown in Figure 1. (a) 1-2-X (total porosity = 1%); (b) 2-2-X (total porosity = 2%); (c) 3-2-X (total porosity = 3%); (d) 4-2-X (total porosity = 4%).
It can be seen from Table 2 that the pore structure in concrete has the following characteristics. (1) As the total porosity increases, the sub-porosity of each gradation segment of pores increases. (2) As the total porosity increases, the average pore radius decreases, which indicates a large increase in the number of pores. For specimens with the same total porosity, the average pore radius of the L-type specimen is greater than that of the M-type specimen, which is greater than that of the S-type specimen. This indicates that the average pore radius of the specimens with the same total porosity is proportional to the content of large pores. (3) As the total porosity increases, the PSSA increases. For the specimens with the same total porosity, the PSSA of the L-type specimen is smaller than that of the M-type specimen, which is smaller than that of the S-type specimen. This indicates that the PSSA of the specimens with the same total porosity is proportional to the content of small pores.
2.4. Numerical Model
2.4.1. Finite Element Mesh Generation and CIE Insertion
The pre-processing functionality in ANSYS is used to establish and mesh the concrete meso-geometric model obtained through the above process. The cement mortar phase is generated by applying the “overlapping” and “subtraction” Boolean operations. To make the cracking path more real and smooth, the aggregate phase and the mortar phase mesh with triangular solid finite elements. After referring to the relevant literature [2,24,43] and trial calculation, the basic size of the element is set to 1 mm. Zero-thickness CIEs are inserted into cement mortar and ITZ to explicitly simulate the initiation and expansion of cracks. The research object of this paper is ordinary concrete, where the strength of aggregate is greater than that of cement mortar, that is, when the concrete is damaged, the aggregates will not crack or damage, so no CIE is inserted into the aggregates.
The zero-thickness CIEs insertion scheme was developed in tandem with ABAQUS and python code. In ABAQUS, the planar element CPE3 is used to simulate aggregate and cement mortar, and the two-dimensional CIE is the COH2D4 element provided by ABAQUS. The key process of CIEs insertion can be divided into three steps, as shown in Figure 3. Firstly, the node and element information of the initial mesh topology in ABAQUS must be read (Figure 3a). The second step is to copy and re-number the nodes between each pair of the solid elements, except aggregate elements, to obtain the nodes needed to generate CIEs in the identical positions of every two neighboring elements (Figure 3b). It should be noted that in Figure 3, to facilitate the display of the insertion position of the CIEs and the division of the model, the gap is set between the elements. There is no gap between solid elements in the real finite element model. The third step is to search for the common corner nodes of each two adjacent elements. For the 2D triangular elements, there are four common corner nodes between every two adjacent elements, and an appropriate CIE can be generated with these nodes. As shown in Figure 3c, all solid elements except aggregate elements are connected to adjacent elements by CIEs. CIEs are divided into two types. One type is located inside the cement mortar and is denoted as coh_mor (the red four-node elements in Figure 3c). The other is located on the ITZ and is denoted as coh_ITZ (the blue four-node elements in Figure 3c). Finally, a finite element mesh with zero-thickness CIEs is established in ABAQUS.
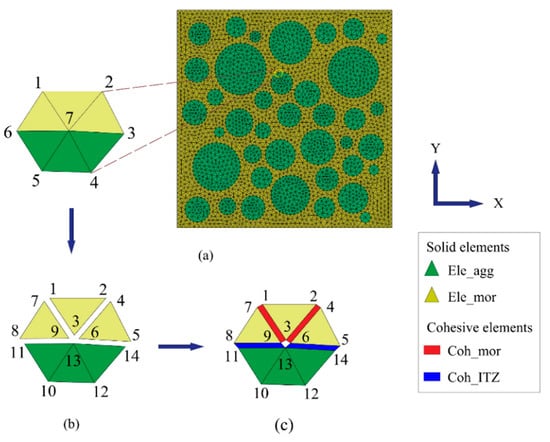
Figure 3.
The key process of the CIEs insertion. (a) Read the node and element information of the initial mesh topology; (b) Copy and re-number the nodes; (c) Generate the CIEs. Note: The numbers represent the node numbers.
2.4.2. Constitutive Response of the CIEs
Because the cohesive crack model can simulate the softening and plastic behavior of the material in the crack tip, it can accurately simulate the damage and fracture process of the material. The constitutive response of CIE is defined in terms of stress (traction) versus displacement (separation) of adjacent virtual surfaces. Normal traction, tn, and tangential traction, tt, act on adjacent virtual surfaces, and their corresponding separations are crack opening displacement, δn, and crack sliding displacement, δt. In this paper, the control equations of the bilinear traction separation law, which are widely used in finite element software, are defined as:
where and are the maximum normal traction and the maximum tangential traction, respectively, and are normal separation and tangential separation when the normal stress and tangential stress are at their maximum, respectively, and and are the normal and shear separations when debonding is completed, respectively.
Under stretching, shearing, or their combined action, the CIE will be damaged. The quadratic nominal stress law is adopted as the basis for judging the damage initiation in this paper, as follows:
where is the Macaulay bracket and
When the CIE develops into the softening state, the damage evolution is characterized by the scalar damage index, D, which is a function of the effective relative separation, δm, combining the effects of δn and δt:
The damage variable, D, of the linear softening law, which monotonically increases from 0 to 1 under further loading after the initiation of damage, is calculated as:
where and are the effective separations at the damage initiation and complete failure, respectively, and is the maximum effective relative separation during the entire loading process.
Once the damage variable, D, is determined, the tractions can be calculated as:
where and are the tractions in the normal and the tangential direction calculated by multiplying the initial stiffness and the current separations. The initial stiffness should be large enough to represent the uncracked material, but a too large initial stiffness tends to cause numerical ill-conditions.
When a CIE is completely destroyed (D = 1), it will be removed. The automatic general contact algorithm of ABAQUS in which the penalty contact scheme is adopted is used to handle the contact behavior after the removal of the CIEs.
2.5. Numerical Validation
To verify the effectiveness of the method for establishing the mesoscopic concrete model with the pore structure proposed in this paper and the accuracy of the established numerical mesoscopic model of concrete, a quasi-static tensile test was carried out and compared with related research [2,44].
The boundary conditions of the tensile experiment are that the lower boundary is fixed in the Y direction, the lower-left node is fixed in the X and Y directions, and the upper boundary is loaded with displacement control, and the loading speed is 9 mm/s, as shown in Figure 4. The relevant parameters of the concrete FE model are determined by referring to relevant literature [2,24,25,43,45,46] and trial calculations, which are shown in Table 3.
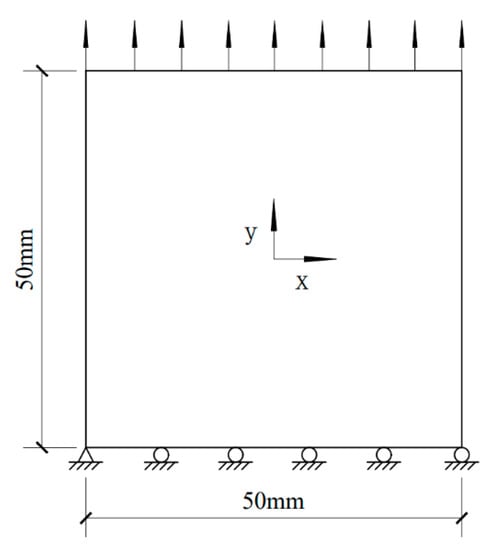
Figure 4.
Loads and boundary conditions for uniaxial tensile tests.
Table 3.
Material properties of the concrete mesoscopic FE model.
Figure 5 shows the stress–strain curve under uniaxial tensile loading obtained in this paper, the simulation results obtained by Wang et al. [2], and the experiments results obtained by Hordijk [44]. It can be seen that the stress–strain curves obtained in this paper are in good agreement with the experimental results [44] and simulation results [2] in the ascending section, softening section, and descending section. It should be noted that the differences between the results in this paper and those in the Ref. [44] and Ref. [2] are due to the different sizes, mesostructures, and material properties of the test specimens. The comparison indicates that the proposed method and the mesoscale concrete numerical models established in this paper are reasonable and can effectively characterize the mechanical behavior of concrete.
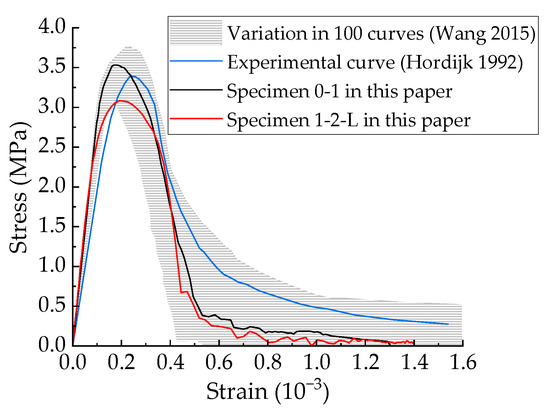
Figure 5.
Comparison of stress-strain curves in uniaxial tension [2,44].
3. Numerical Experimentation and Analysis
Twenty-five CRAMs established according to the CVM were subjected to uniaxial tensile experiments to study the effects of total porosity, sub-porosity, average pore radius, and PSSA on the failure process, tensile strength, tensile elastic modulus, and peak strain of concrete.
3.1. Failure Process Analysis
The failure of concrete is a process in which micro-cracks continue to germinate, expand, and penetrate to form macro-cracks [47]. Under different load levels, the cracking characteristics are significantly different. According to the previous research experience [48,49] and the visual cracking process obtained in this paper, the failure process of concrete is divided into three stages: the relatively stable stage of micro-cracks, the stable development stage of cracks, and the unstable development stage of cracks.
3.1.1. The Failure Process of Concrete Specimen without Pores
- 1.
- The relatively stable stage of micro-cracks (σ/σmax < 0.3~0.5);
The damage degree of coh_mor and coh_CIE characterizes that of cement mortar and ITZ to some extent. At this stage, the internal stress of the concrete is small, and the visual cracking process shows that the damage of concrete first appears in the periphery of the specimen. Later in this stage, most of the damage variables of coh_mor are less than 0.45, and all of them are distributed in the periphery of the specimen. Figure 6a shows the distribution of CIEs with damage variable D = 0.12 when σ/σmax ≈ 0.36, where the black line segments represent CIEs, the green circle represents aggregate, and the yellow area represents the mortar. The damage variables of coh_ITZ are mainly distributed in the range of 0.46~0.59, and they are also mainly distributed in the periphery of the specimen. Figure 6b shows the distribution of CIEs with damage variable D = 0.52 when σ/σmax ≈ 0.36. This indicates that the damage degree of ITZ is greater than that of cement mortar at this stage, possible because the material strength of ITZ is only about 1/3 that of cement mortar, and the stress concentration at ITZ is stronger. At this stage, the damage of ITZ and cement mortar is mainly distributed in the periphery of the specimen and has not extended to the center of the specimen.
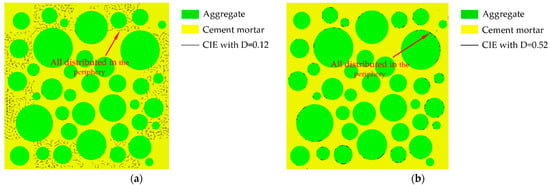
Figure 6.
The distribution of the CIEs with D = 0.12 and D = 0.52 when σ/σmax ≈ 0.36. (a) D = 0.12; (b) D = 0.52.
- 2.
- The stable development stage of cracks (0.3~0.5 < σ/σmax < 0.75~0.9);
Figure 7a,b respectively, show the distribution of CIEs with damage variable D = 0.34 and D = 0.7 when σ/σmax ≈ 0.74, which show that, at this stage, with the increase of stress, the damage of the cement mortar and ITZ develops and extends to the center of the specimen. The damage degree of ITZ is still larger than that of cement mortar, as shown in Figure 7b.
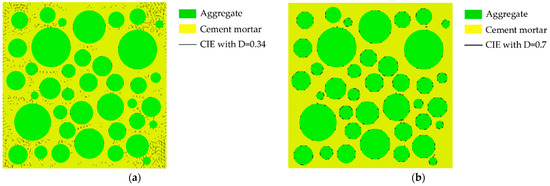
Figure 7.
The distribution of CIEs with D = 0.34 and D = 0.7 when σ/σmax ≈ 0.74. (a) D = 0.34; (b) D = 0.7.
- 3.
- The unstable development stage of cracks (0.75~0.9 < σ/σmax).
Figure 8a,b, respectively, show the distribution of CIEs with damage variable D = 0.7 and D = 0.96 when σ/σmax ≈ 0.98 (ε < peak strain εp). Comparing Figure 7b and Figure 8a, it is found that under the action of high-level stress, the micro-cracks in the cement mortar develop rapidly. Before the peak stress, σp, the damage variables of coh_ITZ mainly distributes in the range of 0.75~0.985, and the damage degree of ITZ is still larger than that of cement mortar, as shown in Figure 8b.
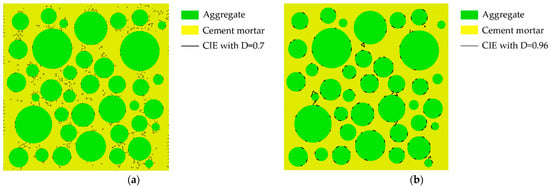
Figure 8.
The distribution of CIEs with D = 0.7 and D = 0.96 when σ/σmax ≈ 0.98, ε < εp. (a) D = 0.7; (b) D = 0.96.
After reaching the peak stress, σp, the strain, ε, continues to increase, and the micro-cracks in ITZ and cement mortar continue to develop, and the damage degree of cement mortar reaches the same level as that of ITZ, as shown in Figure 9, which shows the distribution of the CIEs with D = 0.98 when σ/σmax ≈ 0.77 (ε > εp). With a further increase of strain, the micro-cracks in the cement mortar and ITZ are interconnected and penetrated to form macro-cracks, as shown in Figure 10, which shows a macroscopic penetrating crack when the specimen finally fails.
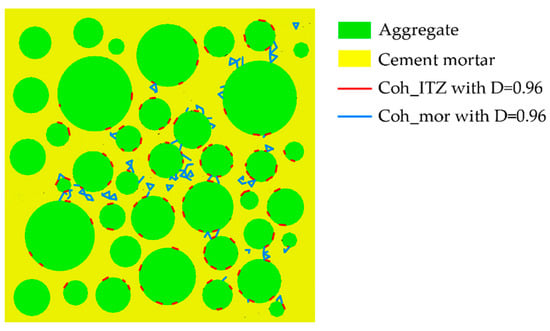
Figure 9.
The distribution of the CIEs with D = 0.98 when σ/σmax ≈ 0.77 (ε > εp).
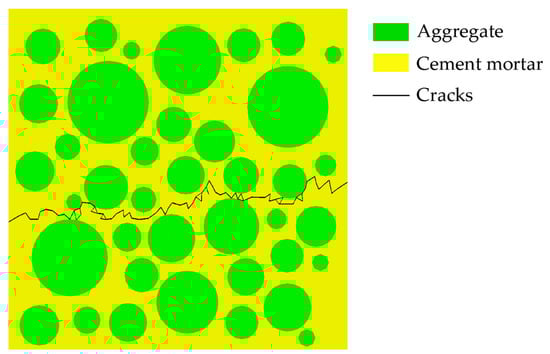
Figure 10.
The macroscopic penetrating crack.
3.1.2. The Failure Process of Concrete Specimen with Pore Structure
The failure process of concrete specimens with pore structure is similar to that of concrete specimens without pores, which is also divided into three stages in the same way. This conclusion is consistent with Wriggers’ findings [29]. However, the existence of pores makes the cracking process of concrete present different characteristics, which are described below.
- 1.
- The relatively stable stage of micro-cracks (σ/σmax < 0.3~0.5)
Figure 11a,b, respectively, show the distribution of the CIEs with damage variables D = 0.25 and D = 0.45 when σ/σmax ≈ 0.36, where black circles represent pores. It can be seen from Figure 11a that in the later stage of this stage, the damage in the cement mortar is mainly concentrated in some pore concentration areas around the specimen, because the stress concentration in the pore concentration areas is more intense. It can be seen from Figure 11b that the damage in the ITZ has expanded from the periphery to the center of the specimen at the later stage of this stage, indicating that the presence of pores accelerates the expansion of the damage.
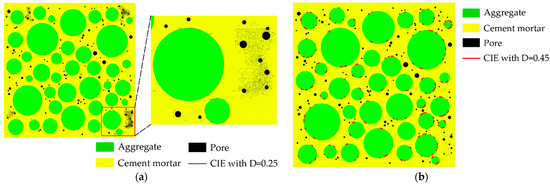
Figure 11.
The distribution of CIEs with D = 0.25 and D = 0.45 when σ/σmax ≈ 0.36 in the 1-1-S specimen. (a) D = 0.25; (b) D = 0.45.
- 2.
- The stable development stage of cracks (0.3~0.5 < σ/σmax < 0.75~0.9)
Figure 12a,b, respectively, show the distribution of the CIEs with damage variables D = 0.35 and D = 0.7 when σ/σmax ≈ 0.72. As shown in Figure 12a, the damage in the cement mortar extends to the center of the specimen at this stage. From the comparison of Figure 12a and Figure 7a, it can be seen that the presence of pores makes the damage in the cement mortar show stronger localization. Even with the existence of pores, the most severely damaged part of the concrete is the ITZ, as shown in Figure 12b.
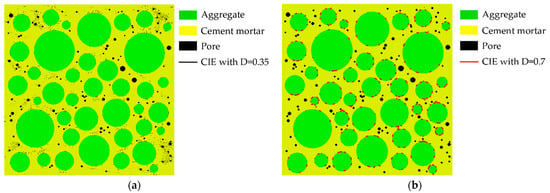
Figure 12.
The distribution of CIEs with D = 0.35 and D = 0.7 when σ/σmax ≈ 0.7 in the 1-1-S specimen. (a) D = 0.35; (b) D = 0.7.
- 3.
- The unstable development stage of cracks (0.75~0.9 < σ/σmax)
Figure 13 shows the distribution of the CIEs with damage variable D = 0.8 when σ/σmax ≈ 0.94(ε < εp). It can be seen that the most severely damaged areas in the cement mortar are not the pore-concentrated areas but are distributed around the aggregates, which may be caused by the propagation of cracks in the ITZ to the cement mortar. Figure 14 shows the distribution of macro cracks in some specimens with the same aggregate structure but different pore structures. It can be seen that the pore structure has an important influence on the initiation position and propagation direction of macroscopic cracks, and the macro cracks must pass through pores and ITZ.
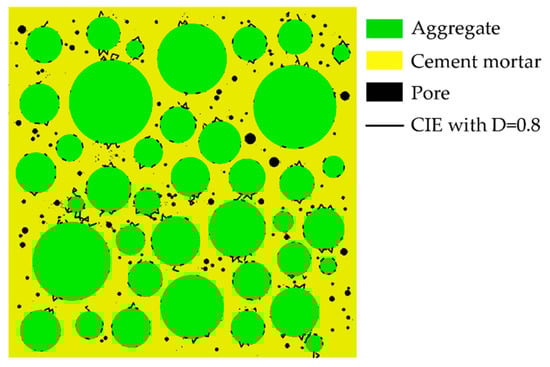
Figure 13.
The distribution of the CIEs with D = 0.8 when σ/σmax ≈ 0.94 (ε > εp).
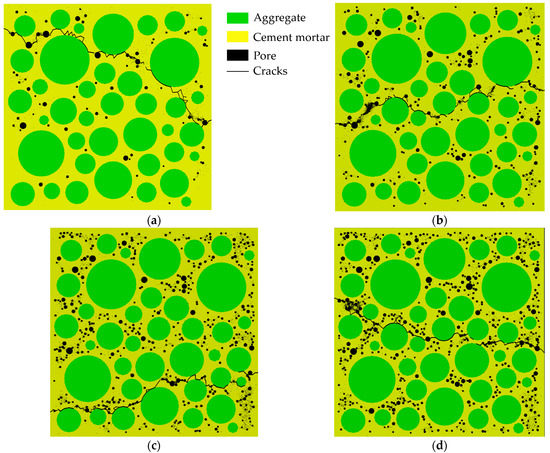
Figure 14.
Distribution of macroscopic penetrating cracks. (a) 1-1-L (total porosity = 1%); (b) 2-1-L (total porosity = 2%); (c) 3-1-S (total porosity = 3%); (d) 4-1-L (total porosity = 4%).
3.2. The Influence of Pore Structure on the Stiffness of Concrete
The 25 uniaxial tensile stress–strain curves obtained in this paper are shown in Figure 15. According to the suggestion of the famous scholar Guo Zhenhai [48], the secant modulus at 50% of the peak stress in the ascending section is taken as the tensile elastic modulus of the concrete specimen. The macroscopic mechanical properties of the concrete specimens are shown in Table 4. The laws between the pore structure and the mechanical properties of concrete analyzed and discussed in the paper are limited to the range of parameter values in this paper, such that the range of the total porosity is 0~4%, which is hereby explained, and no special explanation will be given later.
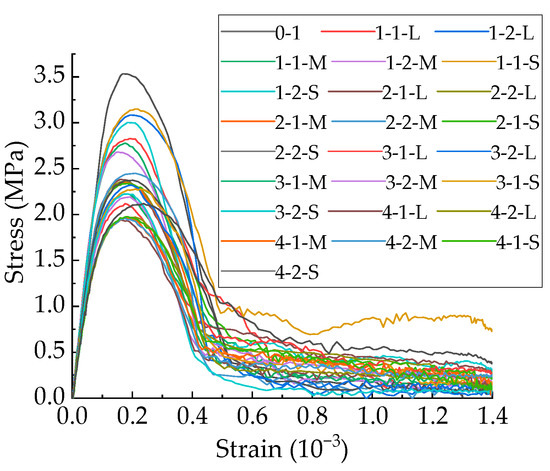
Figure 15.
The stress−strain curves.
Table 4.
Mechanical properties of concrete specimens.
In a previous experimental study [50] and in numerical simulation experimental studies [29,51], scholars used mainly linear and exponential relationships to describe the relationship between elastic modulus and total porosity, but these experiments have shortcomings in simulating the complex pore structure and applying the CVM accurately. The relationship between total porosity and the elastic modulus obtained in this paper is shown in Figure 16a. It can be seen that both the linear relationship and the exponential relationship can well reflect the relationship between the total porosity and the elastic modulus, but the exponential relationship is better than the linear relationship. Therefore, the change of aggregate structure has little effect on the functional relationship between total porosity and elastic modulus.
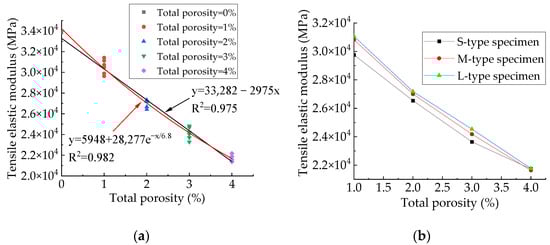
Figure 16.
Relationship between total porosity and elastic modulus. (a) Tensile elastic modulus of all specimens; (b) Tensile elastic modulus of three types of specimens.
The maximum fluctuation amplitude of the elastic modulus of the concrete specimens with the same aggregate structure and total porosity but different sub-porosities is 1746 MPa, which occurs in specimens with a total porosity of 1%, accounting for about 5.7% of its elastic modulus. The maximum fluctuation amplitude of the elastic modulus of the specimens with the same aggregate structure, total porosity, and sub-porosities but different pore space distribution is 968 MPa, which occurs between specimen 3-1-M and specimen 3-2-M, accounting for about 4% of its elastic modulus. Figure 16b shows the elastic moduli of the three types of specimens established in this paper, from which it can be seen that, for the specimens with the same total porosity, the greater the content of macropores, the greater the elastic modulus. The reason for this may be that, for specimens with the same total porosity, the larger the content of macropores, the less the number of pores. While the number of pores decreases, the elastic modulus of concrete increases.
Figure 17 and Figure 18, respectively, show the relationship between the average pore radius and the elastic modulus and the relationship between the PSSA and the elastic modulus. It can be seen from Figure 17 that, for specimens with the same aggregate structure and total porosity, the elastic modulus is basically not affected by the size of the average pore radius. This finding is consistent with the conclusions of Ref. [29]. It can be seen from Figure 18 that the linear relationship and exponential relationship can well reflect the functional relationship that the elastic modulus decreases with the increase of PSSA, and the exponential relationship is better. For specimens with the same aggregate structure and total porosity, the elastic modulus has a tendency to decrease with the increasing PSSA.
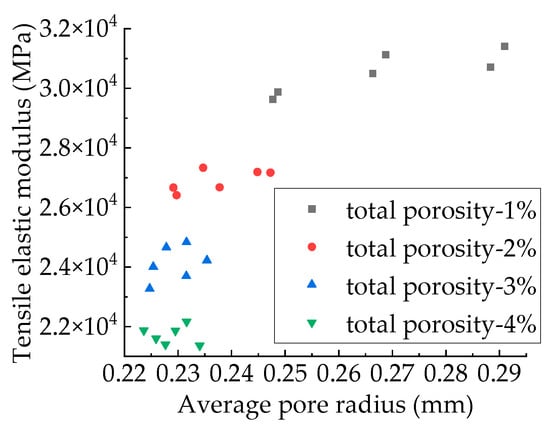
Figure 17.
Relationship between average pore radius and elastic modulus.
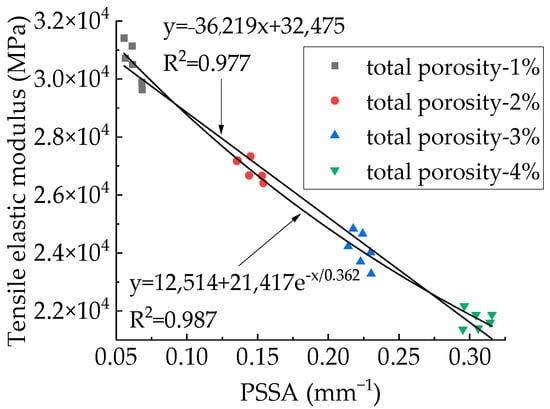
Figure 18.
Relationship between PSSA and elastic modulus.
3.3. The Influence of Pore Structure on the Tensile Strength of Concrete
In previous studies, scholars often used linear relationship [6,40], exponential relationship [29,50], and power function relationship [34,52] to describe the relationship between total porosity and concrete strength. The relationship between the total porosity and the tensile strength obtained in this paper is shown in Figure 19, which is fitted with linear, exponential, and power functions, respectively. From the fitting results in Table 5, it can be seen that the exponential function fits the best. Xin Fang et al. [53] obtained the two-dimensional pore structure photos of concrete specimens through deep-learning-based image segmentation, and measured the relationship between the total porosity and tensile strength of concrete with the same aggregate gradation. The relationship exhibits an obvious exponential relationship, as shown in Figure 20, which is consistent with the conclusions of this paper.
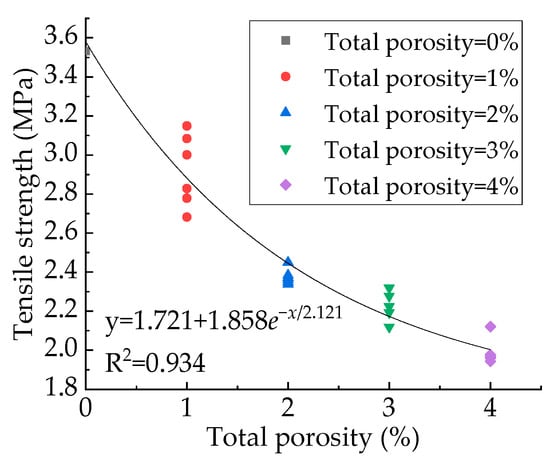
Figure 19.
Relationship between the total porosity and the tensile strength.
Table 5.
Fitting results of the relationship between total porosity and tensile strength.
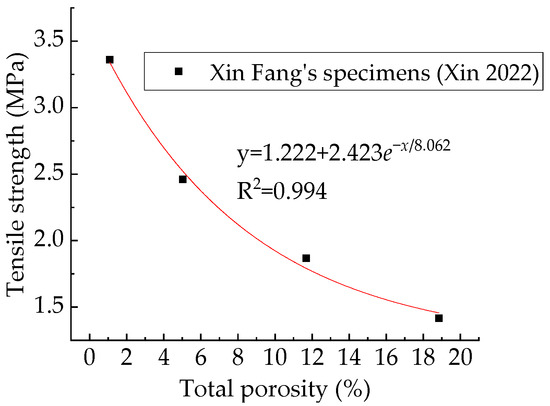
Figure 20.
Relationship between the total porosity and the tensile strength of specimens in Ref. [53].
The maximum fluctuation amplitude of the tensile strength of the concrete specimens with the same aggregate structure and total porosity but different sub-porosities is 0.447 MPa, which occurs in specimens with total porosity of 1%, accounting for about 14.8% of its tensile strength. The maximum fluctuation amplitude of the tensile strength of the specimens with the same aggregate structure, total porosity, and sub-porosities but different pore distribution is 0.256 MPa, which occurs between specimen 1-1-L and specimen 1-2-L, accounting for about 8.66% of its tensile strength. Figure 21 shows the tensile strength of three types of concrete specimens. For specimens with the same total porosity, the larger the content of macropores, the smaller the number of pores. Large pores tend to reduce the strength of the specimen, and the decrease in the number of pores tends to increase the strength of the specimen. These two factors work together on the strength of the concrete, and neither one dominates, as shown in Figure 21.
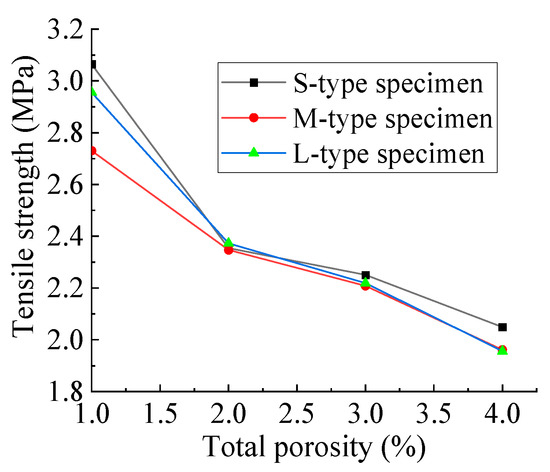
Figure 21.
Tensile strength of three types of specimens.
Figure 22 shows the relationship between the average pore radius and the tensile strength, while Figure 23 shows the relationship between the PSSA and the tensile strength. It can be seen from Figure 22 that for the specimens with the same total porosity, the average pore radius has little effect on the tensile strength of concrete, which is consistent with the research results of Du Xiuli [52].
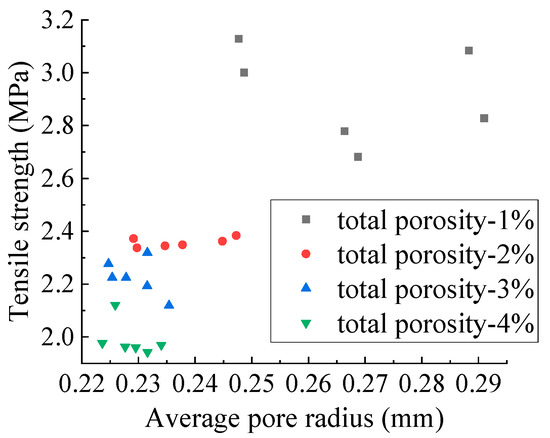
Figure 22.
Relationship between average pore size and tensile strength.
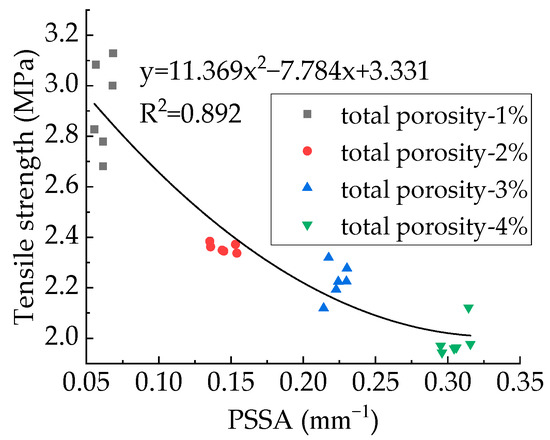
Figure 23.
Relationship between PSSA and tensile strength.
Polynomial function, exponential function, and power function are used to fit the relationship between tensile strength and PSSA. The fitting results are shown in Table 6, from which it can be seen that the quadratic polynomial function fits the best. It can be seen from Figure 23 that, for the specimens with the same total porosity, PSSA has no regular effect on the tensile strength.
Table 6.
Fitting results of the relationship between PSSA and tensile strength.
3.4. The Influence of Pore Structure on the Peak Strain of Concrete
Figure 24 shows the relationship between total porosity and peak strain. The numbers in the legend represent total porosity and the letters represent specimen type. Specimens with the same total porosity and specimen type include multiple specimens, and the average value is used as a representative value. The peak strain has an increasing trend with the increase of the total porosity, which is consistent with the Chang Xiya’ findings [54]. With a 1% increase in total porosity, the maximum change in peak strain is 0.0181 × 10⁻³, which occurs between 0% and 1%, and the minimum change is 0.0019 × 10⁻³, which occurs between 3% and 4%. Among the specimens established in this paper with the same aggregate structure and total porosity but different sub-porosity, the maximum difference in peak strain is 0.0774 × 10⁻³. For specimens with the same aggregate structure, total porosity, and sub-porosity, but different pore distributions, the maximum difference in peak strain is 0.053 × 10⁻³. Therefore, peak strain is more sensitively affected by pore space distribution and sub-porosity than total porosity.
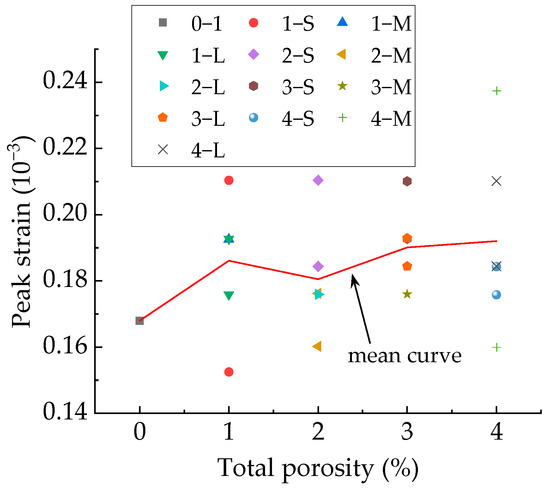
Figure 24.
Relationship between the total porosity and the peak strain.
Figure 25 shows the relationship between the PSSA and the peak strain, while Figure 26 shows the relationship between the average pore radius and the peak strain. It can be seen that the effects of PSSA and average pore radius on peak strain do not show obvious regularity.
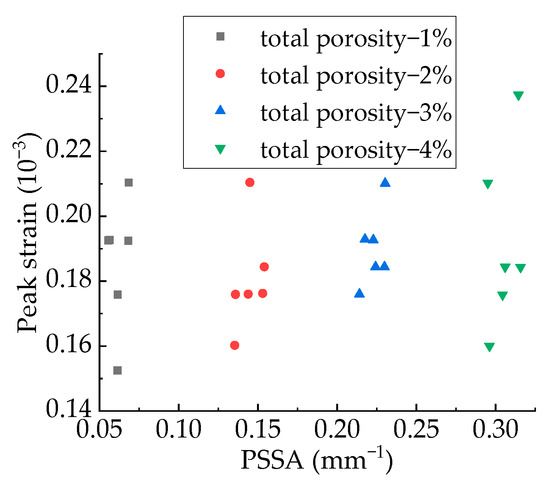
Figure 25.
Relationship between the PSSA and the peak strain.
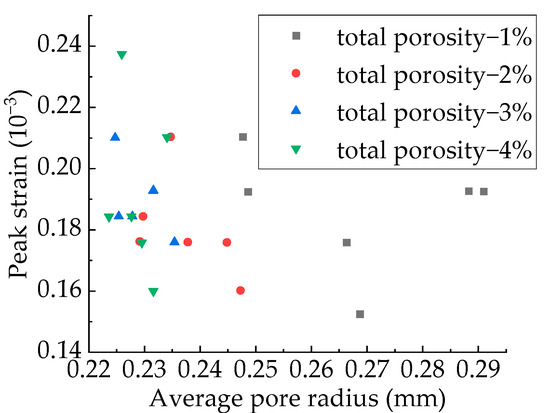
Figure 26.
Relationship between the average pore radius and the peak strain.
3.5. Grey Relational Analysis (GRA) of Concrete Mechanical Properties and Pore Structure Parameters
When the volume of the sub-sample is not large enough to reflect all the information of the parent body, we say that the sub-sample has a certain gray scale. GRA is an effective analysis method for the analysis of the relationship among objects with incomplete run mechanism, scare behavior data, and unclear, inherent connotations, which was proposed by Deng Julong [55] and can be regarded as an overall comparison with a reference system. The specific calculation of relational grade is shown below.
- 1.
- The evaluation index system is determine according to the evaluation purpose and collect evaluation data:
Assuming that there are n data columns, the following original data matrix is formed.
where m is the number of indicators, .
- 2.
- Determine the reference data column :
The reference column should be an ideal comparison standard, which can be constituted by the optimal value of each index or other reference values selected based on the evaluation purpose, denoted as . Other data columns are comparison data columns.
- 3.
- Dimensionless processing of index data columns:
The commonly-used dimensionless methods are the mean method, as shown in Equation (10) and the initial value method as shown in Equation (11):
where i = 0, 1, …, n; k = 1, 2, …, m.
The following matrix (X0, X1, …, Xn) is formed after dimensionless processing.
- 4.
- The absolute difference between the corresponding elements of the reference column and the comparison column is solved by:
- 5.
- The relational coefficient, , is solved by:
- 6.
- Calculate the relational grade.
Equation (15) is used to calculate the relational grade of each evaluation object to reflect its relationship with the reference column. The greater the relational grade, the greater the relationship between the comparison column and the reference column, and vice versa.
To study the influence of pore structure parameters on the macroscopic mechanical properties of concrete, the sub-porosity of each gradation segment of pores, total porosity, average pore radius, and PSSA are taken as the comparison columns for the GRA. Elastic modulus, tensile strength, and peak strain are taken as the reference columns for the GRA, respectively. Using the mean dimensionless method, the calculated relational grades are shown in Table 7.
Table 7.
Relational grades.
It can be seen from Table 7 that the descending order of the relational grades between elastic modulus and pore structure parameters is: total porosity > Pp [e1, e2] > Pp [e2, e3] > Pp [e3, e4] > Pp [e4, e5] > average pore size > PSSA. In the range of pore size studied in this paper, the smaller the pore size, the greater the influence of its content on the elastic modulus, and the total porosity has the greatest influence. The order of effects of pore structure parameters listed in this paper on the elastic modulus and tensile strength of concrete is very close. Dong [56] used nuclear magnetic resonance technology to measure the porosity of different pore sizes in concrete and used GRA to study the correlation between porosity and concrete strength. The results showed that the smaller the pore size, the greater the effect on concrete strength, which is consistent with the research results in this paper. The difference is that the most important factor for elastic modulus is total porosity and the second most important factor is Pp [e1, e2], while the most important factor for tensile strength is Pp [e1, e2] and the second most important factor is total porosity. The effect of pore structure parameters on peak strain is quite different from that of elastic modulus and tensile strength, and the order of the effect is: average pore radius > Pp [e4, e5] > PSSA > Pp [e3, e4] > Pp [e2, e3] > Pp [e1, e2] > total porosity. The sub-porosity of the pores with larger pore size has a greater influence on the peak strain. Total porosity is the primary factor affecting the elastic modulus and tensile strength, but is only the secondary factor affecting the peak strain.
3.6. The Influence of Pore Shape on the Mechanical Properties of Concrete
Many scholars [3,29] have studied the influence of pore shape on mechanical properties, but the existing research ignores the influencing factors of aggregate structure; that is, it does not change the pore shape alone without changing the aggregate structure. In order to study the effect of pore shape on the mechanical properties of concrete, an elliptical pore specimen with a total porosity of 1%, a pore gradation similar to that of the specimen 1-2-S, a ratio of the short axis to the long axis of 0.5, and the same aggregate structure as Specimen 1-2-S was established in this paper. The stress–strain curves for elliptical pore specimen 1-ellipse and specimen 1-2-S are shown in Figure 27, and the mechanical properties are shown in Table 8. It can be seen that the strength of specimen 1-ellipse is 0.261 MPa smaller than that of specimen 1-2-S, and the peak strain is 0.0082 × 10⁻³ smaller than that of specimen 1-2-S, and the elastic modulus is 761 MPa smaller than that of specimen 1-2-S. The shape of pores changes from circular to oval, which weakens the mechanical properties of concrete to a certain extent but has the greatest impact on tensile strength and the least impact on elastic modulus. These conclusions are largely consistent with Li’s findings [29]. It is worth noting that, under the same pore size and porosity, the number of elliptical pores is much larger than that of circular pores, especially for small pores. Therefore, the above-mentioned changes in the mechanical properties of concrete are not only caused by changes in the shape of pores, but also by changes in the number of pores.
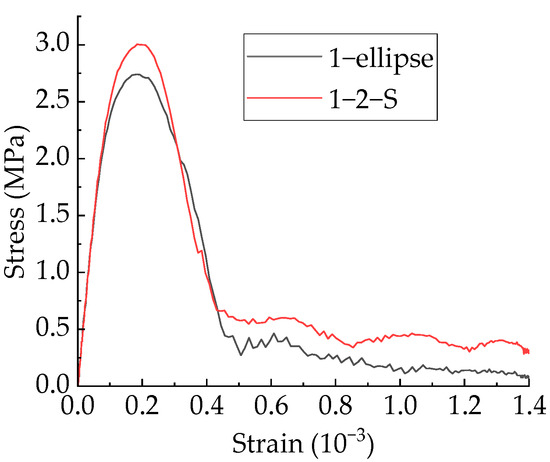
Figure 27.
Stress−strain curves of elliptical pore specimen 1-ellipse and specimen 1-2-S.
Table 8.
The mechanical properties of Specimen 1-ellipse and Specimen 1-2-S.
4. Conclusions
A new CRAMM is proposed, which can accurately model the pore structure in concrete by setting the total porosity, pore gradation, pore size, and sub-porosity of each gradation segment. According to the CVM, 25 mesoscopic concrete specimens with the same aggregate structure and different pore structures are established, and the effects of total porosity, sub-porosity of each pore gradation segment, average pore radius and PSSA on the concrete failure process, elastic modulus, tensile strength, and peak strain are studied. The following conclusions can be drawn.
The failure process of concrete specimens with and without pores under uniaxial tensile loading is very similar, but the pore structure demonstrates different characteristics, especially that the damage inside the cement mortar is more localized. The damage first germinates from the periphery of the specimen and then expands to the center of the specimen, and the existence of pores accelerates the expansion process. The existence of pores does not change the phenomenon that the most severely damaged area in concrete is ITZ before the internal stress reaches the ultimate stress. The pore structure has an important influence on the initiation and propagation direction of macroscopic cracks, which must pass through pores and ITZ.
Both linear and exponential functions can fit well the relationship between elastic modulus and PSSA and the relationship between elastic modulus and total porosity, but the exponential function fits better. For specimens with the same aggregate structure and total porosity, the elastic modulus increases with the increase of the macropore content and is basically not affected by the average pore radius.
The exponential function can fit well the relationship between total porosity and tensile strength, and the quadratic polynomial function can fit well the relationship between PSSA and tensile strength. For specimens with the same aggregate structure and total porosity, there is no clear functional relationship between the tensile strength and the sub-porosity of different gradation segments, and the tensile strength is basically not affected by the average pore radius.
The peak strain has an increasing trend with the increasing total porosity, which is more sensitive to pore space distribution and secondary porosity than total porosity. Peak strain is more sensitively affected by pore space distribution and sub-porosity. The effect of average pore radius and PSSA on peak strain has no obvious regularity.
Based on the GRA, the effects of the pore structure parameters listed in this paper on the elastic modulus and tensile strength of concrete are very close in sequence. For pores with a radius in the range of 0.15–0.8 mm, the smaller the pores, the greater the effect of their porosity on the elastic modulus and tensile strength, and the less effect on the peak strain. Total porosity is the primary factor affecting elastic modulus and tensile strength, but is only a secondary factor affecting peak strain.
The research has drawn some valuable conclusions, although some further work is needed. Firstly, this study adopts a 2D assumption to save computational cost, but due to the 3D random anisotropic distribution of aggregates and pores, the effect of the three dimension on pore structure and mechanical properties should be considered by extending the established model to 3D conditions. Secondly, the influence of pore structure on the mechanical properties of concrete under complex loads such as dynamic and temperature should be studied. Therefore, further work in this area is needed in the future.
Author Contributions
Conceptualization, H.Y., E.Z. and L.L.; Data curation, H.Y. and E.Z.; Funding acquisition, E.Z.; Methodology, H.Y., E.Z. and L.L.; Supervision, E.Z. and L.L.; Validation, H.Y. and E.Z.; Writing—original draft, H.Y.; Writing—review & editing, E.Z. All authors have read and agreed to the published version of the manuscript.
Funding
This research was funded by Fundamental Research Funds for the Central Universities (No. 2021JBM426).
Institutional Review Board Statement
Not applicable.
Informed Consent Statement
Not applicable.
Data Availability Statement
Not applicable.
Conflicts of Interest
The authors declare no conflict of interest.
References
- Wittmann, F.H.; Roelfstra, P.E.; Ad Ouki, H.S. Simulation and analysis of composite structures. Mater. Sci. Eng. 1985, 68, 239–248. [Google Scholar] [CrossRef]
- Wang, X.F.; Yang, Z.J.; Yates, J.R.; Jivkov, A.P.; Zhang, C. Monte Carlo simulations of mesoscale fracture modelling of concrete with random aggregates and pores. Constr. Build. Mater. 2015, 75, 35–45. [Google Scholar] [CrossRef]
- Chen, Q.; Zhang, Y.; Zhang, J.; Wang, Z.; Wang, Z. Research on two-dimensional meso-modeling method of porous concrete. Appl. Math. Mech. 2020, 41, 182–194. [Google Scholar]
- Yao, T.; Du, C.; Sun, L. Numerical simulation of the meso-damage and failure process of concrete with defects. J. Hohai Univ. (Nat. Sci.) 2011, 39, 66–72. [Google Scholar]
- Yao, T.; Du, C.; Sun, G. Predication of elastic modulus of concrete with defects. Adv. Sci. Technol. Water Resour. 2010, 30, 33–38. [Google Scholar]
- Gao, H.; Zhang, X.; Zhang, Y. Effect of air void structure on strength and interfacial transition zone of concrete. J. Tongji Univ. (Nat. Sci.) 2014, 42, 751–756. [Google Scholar]
- Dai, H. Analysis of the Relationship between Concrete Pore Structure and Macro Performance Based on Grey Correlation. Ph.D. Thesis, Dalian Jiaotong University, Dalian, China, 2013. [Google Scholar]
- Jin, X.; Shen, Y.; Li, Z. Experimental study on early age characteristics of high-strength concrete. China Concr. Cem. Prod. 2003, 5, 5–7. [Google Scholar]
- Du Plessis, A.; Olawuyi, B.J.; Boshoff, W.P.; Le Roux, S.G. Simple and fast porosity analysis of concrete using X-ray computed tomography. Mater. Struct. 2016, 49, 553–562. [Google Scholar] [CrossRef]
- Kondraivendhan, B.; Divsholi, B.S.; Teng, S. Estimation of strength, permeability and hydraulic diffusivity of pozzolana blended concrete through pore size distribution. J. Adv. Concr. Technol. 2013, 11, 230–237. [Google Scholar] [CrossRef][Green Version]
- Zhao, J.; Xu, T. Study on the characteristics of concrete pore structure using mercury intrusion. Low Temp. Archit. Technol. 2013, 35, 3–4. [Google Scholar]
- Liu, J. Influence of Air Content on the Properties of Self-Compacting Concrete. Master’s Thesis, Qingdao University of Technology, Qingdao, China, 2011. [Google Scholar]
- Yue, Z.; Chen, S.; Zhen, H.; Tan, G. Digital image proceeding based on finite element method for geomaterials. Chin. J. Rock Mech. Eng. 2004, 23, 889–897. [Google Scholar]
- Ding, W.; Wu, Y.; Pu, Y.; Cui, Z.; Cao, G. History and present situation of X-ray computerized tomography (CT) of rocks. Seismol. Geol. 2003, 25, 467–476. [Google Scholar]
- Ríos, J.D.; Cifuentes, H.; Leiva, C.; Seitl, S. Analysis of the mechanical and fracture behavior of heated ultra-high-performance fiber-reinforced concrete by X-ray computed tomography. Cem. Concr. Res. 2019, 119, 77. [Google Scholar] [CrossRef]
- Liu, H. Study on Meso-Structure and Damage Mechanical Characterics of Frozen Rock Based on CT Image Processing. Ph.D. Thesis, Xi’an University of Science and Technology, Xi’an, China, 2013. [Google Scholar]
- Hao, S.; Dang, F.; Chen, H.; Liang, X. Three dimension reconstruction of concrete meso-structure based on CT images by ANSYS. Concrete 2009, 3, 13–15. [Google Scholar]
- Tian, W.; Dang, F.; Chen, H. CT experimental study on failure characteristics of concrete under dynamic loading. J. Earthq. Eng. Vib. 2011, 31, 30–34. [Google Scholar]
- Tian, W.; Dang, F.; Chen, H. Research on three-dimension reconstruction technology of concrete based on CT images. J. Sichuan Univ. (Nat. Sci. Ed.) 2010, 42, 12–16. [Google Scholar]
- Li, S. Three Dimensional Simulation of Drying Shrinkage Micro-Cracking in Numerical Concrete Reconstructed from CT Images. Ph.D. Thesis, Tsinghua University, Beijing, China, 2010. [Google Scholar]
- Stock, A.F.; Hannant, D.J.; Williams, R.; Hobbs, D.W.; Akman, M.S.; Barto, P. The effect of aggregate concentration upon the strength and modulus of elasticity of concrete. Mag. Concr. Res. 1980, 32, 246–250. [Google Scholar] [CrossRef]
- Yin, A.; Yang, X.; Yang, Z. 2D and 3D fracture modeling of asphalt mixture with randomly distributed aggregates and embedded cohesive cracks. Procedia IUTAM 2013, 6, 114–122. [Google Scholar] [CrossRef]
- Wang, H.; Wang, J.; Chen, J. Micromechanical analysis of asphalt mixture fracture with adhesive and cohesive failure. Eng. Fract. Mech. 2014, 132, 104–119. [Google Scholar]
- Wu, Z.; Cui, W.; Fan, L.; Liu, Q. Mesomechanism of the dynamic tensile fracture and fragmentation behaviour of concrete with heterogeneous mesostructure. Constr. Build. Mater. 2019, 217, 573–591. [Google Scholar] [CrossRef]
- López, C.M.; Carol, I.; Aguado, A. Meso-structural study of concrete fracture using interface elements. I: Numerical model and tensile behavior. Mater. Struct. 2008, 41, 583–599. [Google Scholar] [CrossRef]
- López, C.M.; Carol, I.; Aguado, A. Meso-structural study of concrete fracture using interface elements. II: Compression, biaxial and Brazilian test. Mater. Struct. 2008, 41, 601–620. [Google Scholar] [CrossRef]
- Wang, Z. Numerical simulation of strain softening and location for concrete materials. J. Basic Sci. Eng. 2000, 2, 187–194. [Google Scholar]
- Zhu, L. Study on the Effect of Void on the Macro-Mechanical Properties of Concrete. Ph.D. Thesis, Dalian University of Technology, Dalian, China, 2016. [Google Scholar]
- Li, K. Study on Meso-Scale Tensile Mechanical Properties of Concrete Based on Cohesive Zone Model. Ph.D. Thesis, Dalian University of Technology, Dalian, China, 2019. [Google Scholar]
- Wriggers, P.; Moftah, S.O. Mesoscale models for concrete: Homogenisation and damage behaviour. Finite Elem. Anal. Des. 2006, 42, 623–636. [Google Scholar] [CrossRef]
- Fuller, W.B.; Thompson, S.E. The laws of proportioning concrete. Trans. Am. Soc. Civ. Eng. 1907, 59, 67–143. [Google Scholar] [CrossRef]
- Dougill, J.W. Modulus of elasticity of concrete affected by elastic moduli of cement paste matrix and aggregate. Am. Concr. Inst. ACI Spec. Publ. 1962, 59, 427–452. [Google Scholar]
- Su, X.T.; Yang, Z.J.; Liu, G.H. Monte Carlo simulation of complex cohesive fracture in random heterogeneous quasi-brittle materials: A 3D study. Int. J. Solids Struct. 2010, 47, 2336–2345. [Google Scholar] [CrossRef]
- Du, X.; Liu, J. Research on effective mechanical properties of concrete composite material with pores. Eng. Mech. 2012, 29, 70–77. [Google Scholar]
- Kumar, R.; Bhattacharjee, B. Porosity, pore size distribution and in situ strength of concrete. Cem. Concr. Res. 2003, 33, 155–164. [Google Scholar] [CrossRef]
- Jin, N.; Jin, X.; Guo, J. Relationship modeling of pore structure and strength of concrete. J. Zhejiang Univ. (Eng. Sci.) 2005, 39, 1680–1684. [Google Scholar]
- Qin, X.; Xu, Q. Statistics of the initial defects within concrete based on CT image. J. Hydraul. Eng. 2016, 47, 959–966. [Google Scholar]
- Wu, Z. Discussion on the recent development direction of concrete science and technology. J. Chin. Ceram. Soc. 1979, 3, 262–270. [Google Scholar]
- Zhang, J.; Fujiwara, T. Resistance to frost damage of concrete with various mix proportions under salty condition. In International RILEM Workshop on Frost Resistance of Concrete; RILEM: Paris, France, 2002; pp. 367–374. [Google Scholar]
- Zhu, H.; Yan, M.; Li, C.; Cheng, Y.; Wu, K. Analysis of the influence of porosity of macroscopic pore on concrete strength by image method. J. Build. Mater. 2015, 18, 275–280. [Google Scholar]
- Tian, W.; Han, N. Pore characteristics (>0.1 mm) of non-air entrained concrete destroyed by freeze-thaw cycles based on CT scanning and 3D printing. Cold Reg. Sci. Technol. 2018, 151, 314–322. [Google Scholar] [CrossRef]
- Liu, H. Fundamentals of Research on Phases of Building Materials; Tsinghua University Press: Beijing, China, 1996. [Google Scholar]
- Wang, J.; Jivkov, A.P.; Li, Q.M.; Engelberg, D.L. Experimental and numerical investigation of mortar and ITZ parameters in meso-scale models of concrete. Theor. Appl. Fract. Mec. 2020, 109, 102722. [Google Scholar] [CrossRef]
- Hordijk, D.A. Tensile and tensile fatigue behaviour of concrete: Experiments, modelling and analyses. Heron 1992, 37, 1–79. [Google Scholar]
- Kollmann, J.; Liu, P.; Lu, G.; Wang, D.; Oeser, M.; Leischner, S. Investigation of the microstructural fracture behaviour of asphalt mixtures using the finite element method. Constr. Build. Mater. 2019, 227, 117078. [Google Scholar] [CrossRef]
- Rodrigues, E.A.; Manzoli, O.L.; Bitencourt, L.A.G., Jr.; Bittencourt, T.N. 2D mesoscale model for concrete based on the use of interface element with a high aspect ratio. Int. J. Solids Struct. 2016, 94–95, 112–124. [Google Scholar] [CrossRef]
- Yu, X.; Jv, X. The strength and destruction of concrete. J. Hydraul. Eng. 1983, 2, 22–36. [Google Scholar]
- Guo, Z. Principles of Reinforced Concrete; Tsinghua University Press: Beijing, China, 2013; p. 433. [Google Scholar]
- Liu, Y. Study on the Mechanics Behavior of the Concrete through the CT Technique. Ph.D. Thesis, Xi’an University of Technology, Xi’an, China, 2007. [Google Scholar]
- Wang, S.; Ding, Z.; Wang, W.; Zhang, W.; Shen, W. Experimental study on mechanical properties of lining concrete with hole defects under reciprocating loads. Bull. Chin. Ceram. Soc. 2022, 41, 1–11. [Google Scholar]
- Xiao, S.; Zhu, L. Study on effects of voids on macro-mechanical properties of concrete. J. Shenyang Jianzhu Univ. (Nat. Sci.) 2016, 32, 608–618. [Google Scholar]
- Du, X.; Liu, J. Research on the influence of pores and micro-cracks on the macro-mechanical properties of concrete. Eng. Mech. 2012, 29, 101–107. [Google Scholar]
- Fang, X.; Wang, C.; Li, H.; Wang, X.; Zhang, S.; Luo, X.; Jia, H. Influence of mesoscopic pore characteristics on the splitting-tensile strength of cellular concrete through deep-learning based image segmentation. Constr. Build. Mater. 2022, 315, 125335. [Google Scholar] [CrossRef]
- Chang, X.; Lu, A.; Hu, S.; Wang, Y.; Zhang, J.; Jiang, R.; Zhao, Z. Influence of porosity on mechanical properties and energy dissipation of concrete. New Build. Mater. 2019, 46, 12–15. [Google Scholar]
- Deng, J. Gray Control System, 2nd ed.; Huazhong University of Science and Technology Press: Wuhan, China, 1985. [Google Scholar]
- Deng, R.; Shen, X.; Liu, Q.; Wei, L.; Zhang, C. Influence mechanism of pore characteristics of aeolian sand concrete on its strength. Bull. Chin. Ceram. Soc. 2019, 38, 1901–1907. [Google Scholar]


Publisher’s Note: MDPI stays neutral with regard to jurisdictional claims in published maps and institutional affiliations. |
© 2022 by the authors. Licensee MDPI, Basel, Switzerland. This article is an open access article distributed under the terms and conditions of the Creative Commons Attribution (CC BY) license (https://creativecommons.org/licenses/by/4.0/).