Article

Dynamic Response of a Heavy-Haul Railway Tunnel’s Bottom Structures in Hard Rock

1
Geological Survey of Jiangxi Province, Nanchang 330001, China
2
School of Civil and Architectural Engineering, East China University of Technology, Nanchang 330013, China
3
School of Civil Engineering, Central South University, Changsha 410075, China
4
School of Road and Bridge engineering, Jiangxi Transportation Vocational and Technical College, Nanchang 330013, China
5
Jiangxi Institute of Survey and Design, Nanchang 330224, China
*
Author to whom correspondence should be addressed.
Appl. Sci. 2022, 12(11), 5721; https://doi.org/10.3390/app12115721
Submission received: 9 April 2022 / Revised: 29 May 2022 / Accepted: 30 May 2022 / Published: 4 June 2022
(This article belongs to the Special Issue Slope Stability and Earth Retaining Structures)

Abstract

:
A train–tunnel–surrounding rock numerical model was established by using ABAQUS to analyze the dynamic response of a heavy-haul railway tunnel in hard rock, quantify the influence of the train axle load on the tunnel dynamic response and determine its potential vulnerable position. The results suggested that: Under the 30 t train load and surrounding rock pressure coupling, the maximum principal stress caused by rock pressure was 1.27 MPa, located at the bottom of the structure below the side drain; the maximum dynamic response of the tunnel structure and base rock was located directly below the rail. The lower part of the side drain and rail was the vulnerable position in the tunnel bottom structure, and the probability of base disease under the rail may be higher than that in soft-rock tunnels, for it has a greater dynamic response and thinner structure compared to a soft-rock tunnel. The maximum principal stress amplitude of the tunnel structure and base rock were 129.3 kPa and 43.0 kPa, respectively. When the axle load increased by 1 t, the dynamic amplitude of the structure’s maximum principal stress increased by about 4.14 kPa, and the base rock’s maximum principal stress increased by about 1.33 kPa. The rock pressure was not negligible in the dynamic analysis of the railway tunnel, and the dynamic response of the tunnel bottom structure and base rock will decrease, obviously, when the rock pressure is ignored.

1. Introduction

A heavy-haul railway has the remarkable advantages of large traffic volume, low cost and high efficiency; thus, countries all over the world are competing to increase the axle load of freight railways [1,2]. However, the tunnel bottom structure is no longer capable of dealing with the long term impact of heavy-haul trains, as base diseases increase with the increase in axle load [3]. High traffic density, short maintenance intervals and limited working space are the distinguishing features of heavy-haul railway tunnels in China. After decades of operation, tunnel-base diseases are increasing over time in the Daqin heavy-haul railway (445 million tons in 2013 [2]), such as structure cracks, subsidence and soil pumping. Serious foundation subsidence and base rock voids have also been found in the Shuohuang [4] and Wari [5] heavy-haul railways, two other famous heavy-haul railways in China. Most base deterioration is appearing on the side of the full-load track [6], which aggravates the rail irregularity and threatens the safety of the train operations [7,8].
Thus, the study of the dynamic response of the tunnel structure under the heavy-haul train load is essential, especially the heavy-haul railway tunnel with a heavy axle load, high train density and thin and vulnerable base structure [9]. In general, the thickness and strength of the tunnel structure are dominated by the surrounding rock. The better the surrounding rock, the smaller the surrounding rock pressure, and the corresponding structural thickness of the tunnel will be designed thinner [10,11]. Generally, scholars believe that the worse the surrounding rock conditions are, the higher the possibility of basement diseases in the tunnel [12]. However, according to the survey results after decades of operation, base diseases occur not only in soft rock areas [13], but also in hard rock [14].
Compared with the seismic response [15,16,17], the dynamic response of tunnel structures caused by trains is much smaller [18,19,20]. Although, due to the constraint of the surrounding rock, the seismic performance of the tunnel structure is better than that of the ground structure in seismic areas [21,22,23], the seismic response will still cause immediate and significant damage or deformation to the tunnel structure [24,25]. In addition, the vibration of the tunnel structure caused by the train is often small and frequent; thus, the degradation of the tunnel bottom structure is gradual rather than immediate [19,26]. Nevertheless, progressive degradation of the base is emerging in more and more heavy-haul railway tunnels as the axle load of the trains increases [27,28,29]. The field measurement of the Sanjiacun Tunnel in the Shuohuang railway system shows that, under the 21 t axle-load train, the vertical dynamic stress on the bottom surface is 61.6 kPa, and the maximum value of dynamic response is directly below the rail, on the side close to the center line of the tunnel [4]. Not only do the axle load and surrounding rock conditions have a significant impact on the dynamic response of the tunnel basement structure [30,31], but the influence of the base support conditions also cannot be ignored. Through numerical simulations and tests, Liu C et al. [32] indicate that the cavity in the base rock performs multiple adverse effects on the mechanical performance of the substructure. Xue [33] found that the loose base rock will cause the maximum principal stress of a tunnel’s inverted arch to increase sharply. Zhang et al. [34] stated that the base void increased the tunnel bottom structure’s dynamic response significantly. Dong J. et al. [35] studied the dynamic response of crossing tunnels under a heavy-haul train load, and the results revealed that the vibration of the intersection is more significant than the vibration of the common section because of the presence of the lower tunnel (like a void).
The research on the dynamic response of tunnels is mainly focused on tunnel bottom structures with poor surrounding rock [13,31,36]. Although base defects occur more and more frequently in hard-rock tunnels, the dynamic and degradation analysis of hard-rock tunnels is still lacking. In addition, the influence of the surrounding rock pressure and train load on the mechanical characteristics of the tunnel bottom needs to be further distinguished. With base diseases emerging, it is necessary to analyze the dynamic response characteristics of tunnels under the heavy-haul train load and surrounding rock pressure coupling, and to quantify the influence of the train axle load on the tunnel dynamic response and determine its potential vulnerable position to reduce the probability of tunnel-base diseases and provide an important reference for lifting the axle load of heavy-haul railways.

2. Mechanical Characteristics of the Heavy-Haul Railway Tunnel Base

2.1. Engineering Background

Daqin Railway is the most famous heavy-haul railway in China, as it is the world champion with a freight volume average of 440 million tons each year from 2013 to 2019, and a total volume of 572 million tons each year when including the train volume [2]. The common axle load in Daqin Railway is 27 t, with a maximum axle load of 30 t.
The tunnel, by reference, is in grade III surrounding rock (351 ≤ BQ ≤ 450, Grade I is the best, grade VI is the worst); its typical section diagram is shown in Figure 1. The tunnel is 900 cm high and 1030 cm wide, and it is a single-layer concrete lining structure with a vertical wall and baseboard (bottom structure). The vault and side wall are C15 plain concrete structures that are 50~70 cm thick; the tunnel bottom is C10 plain concrete, 10 cm thick.

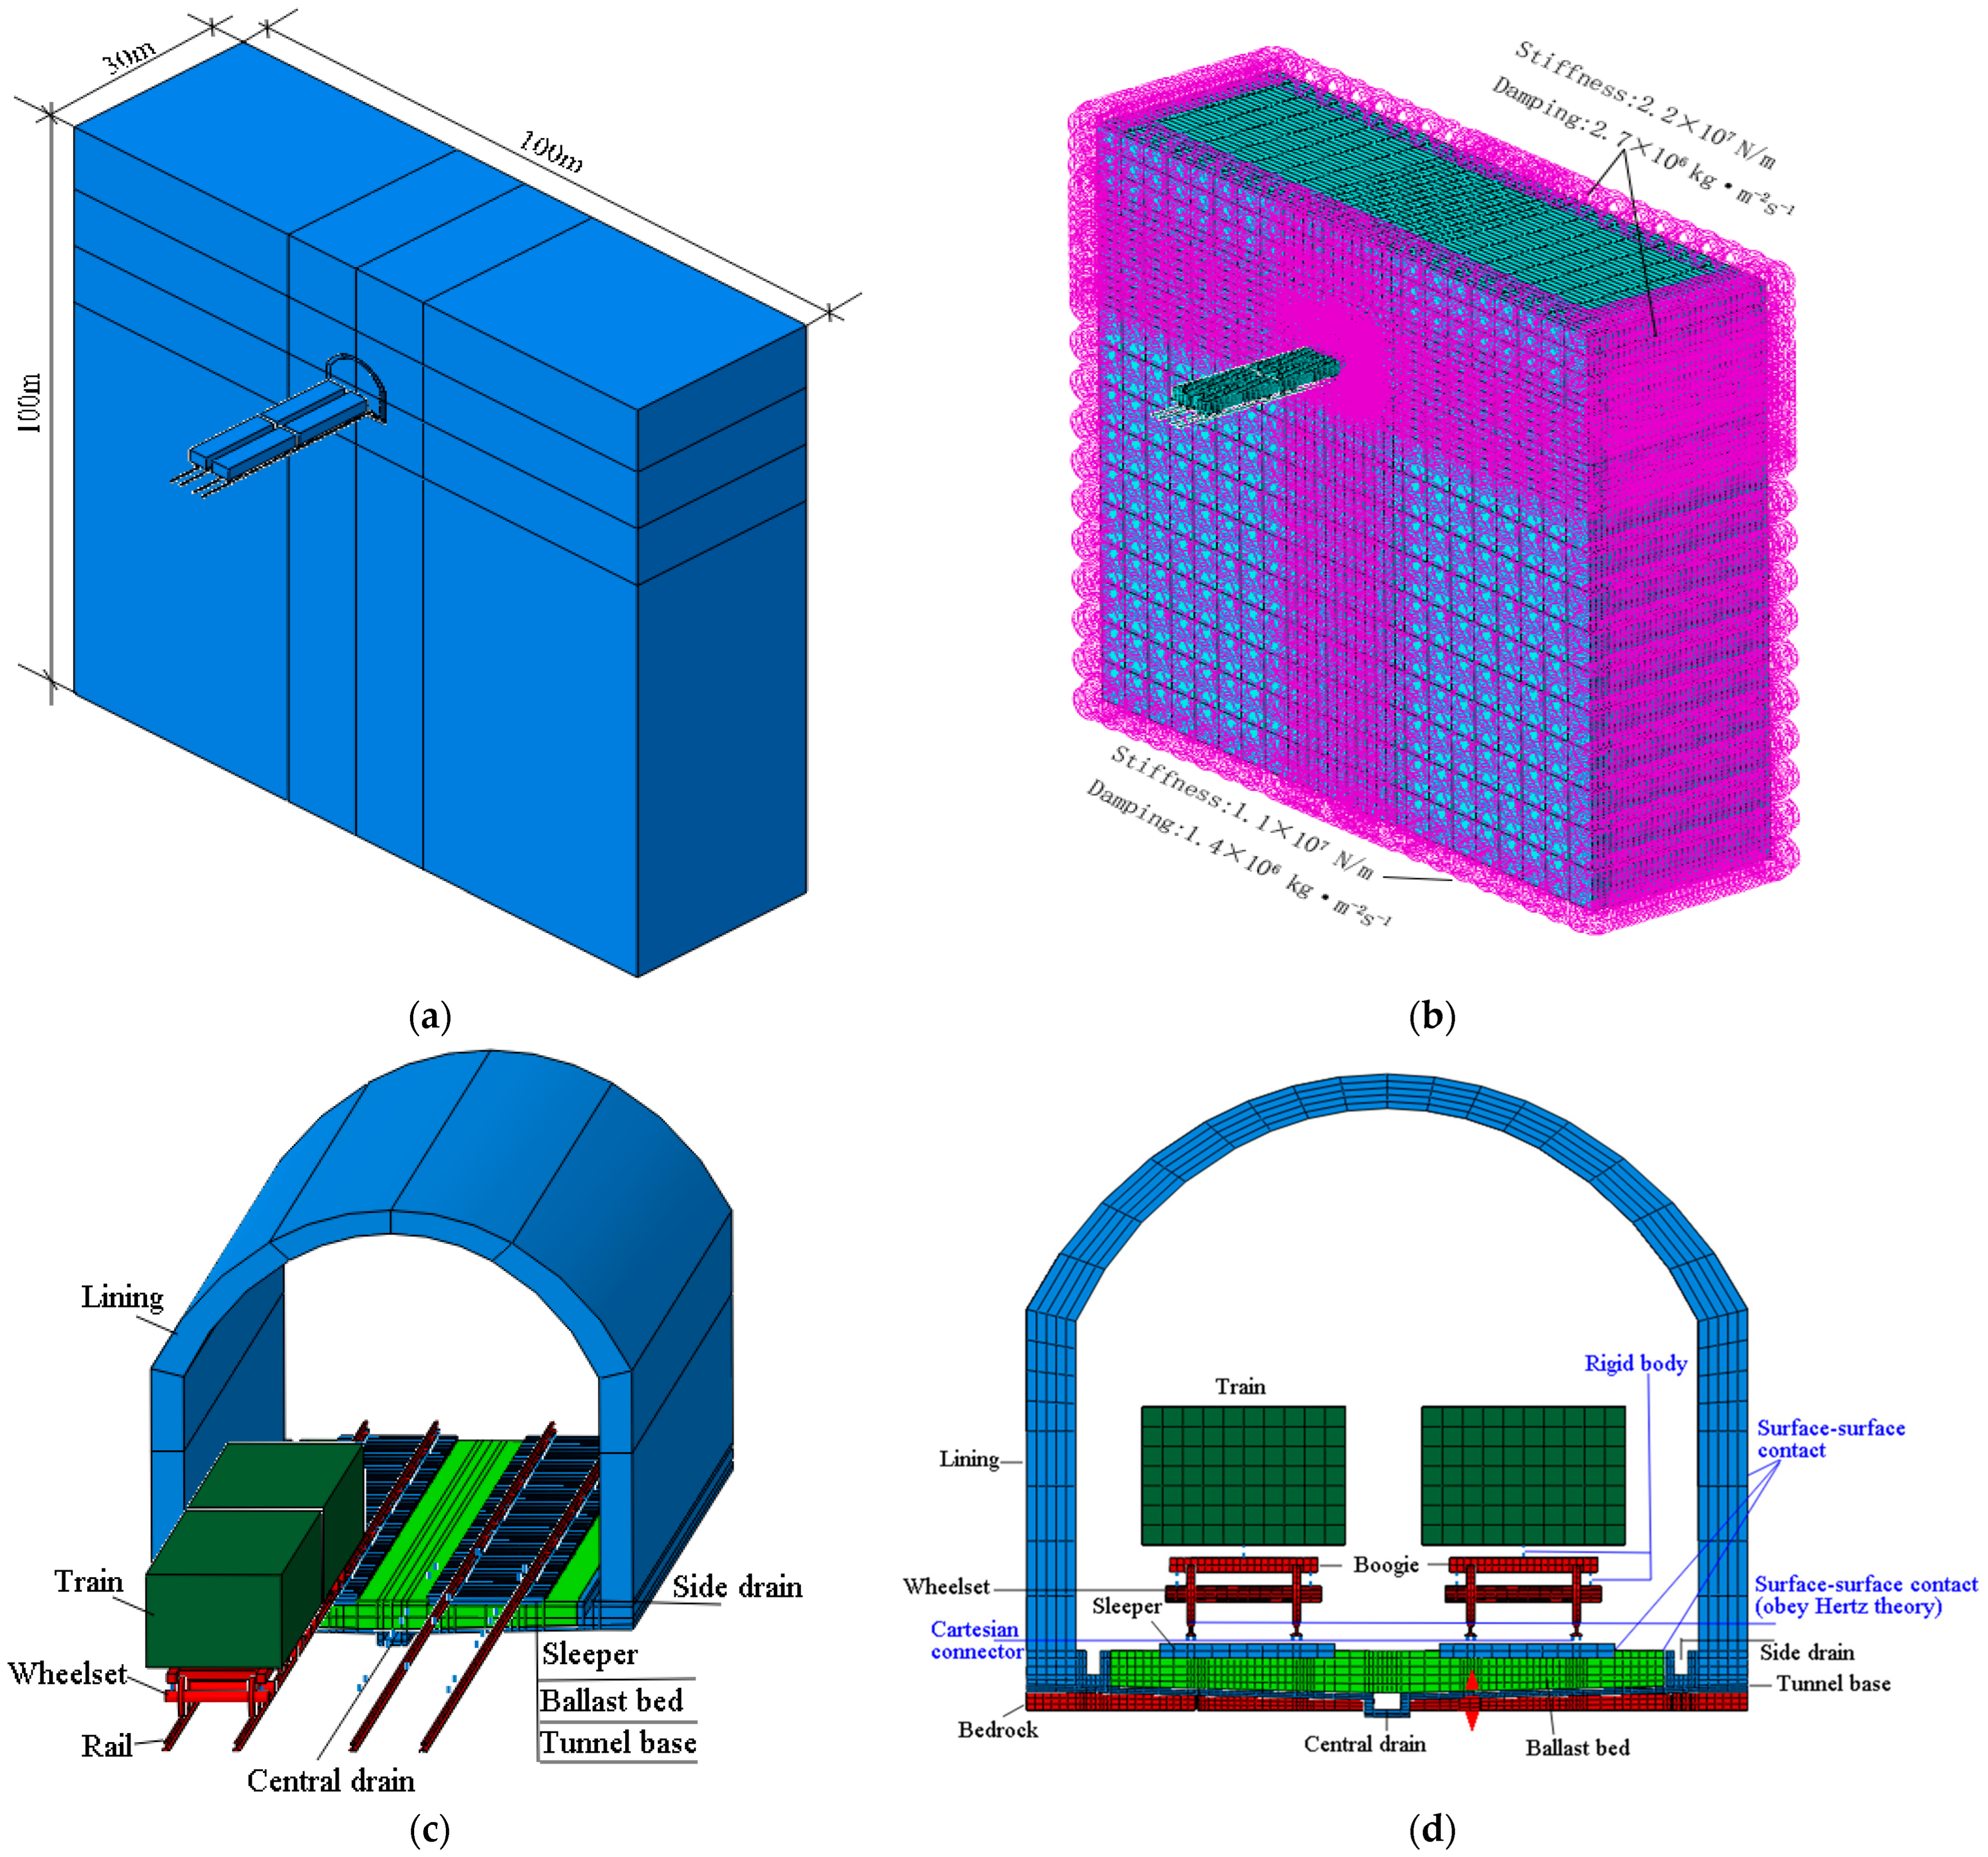
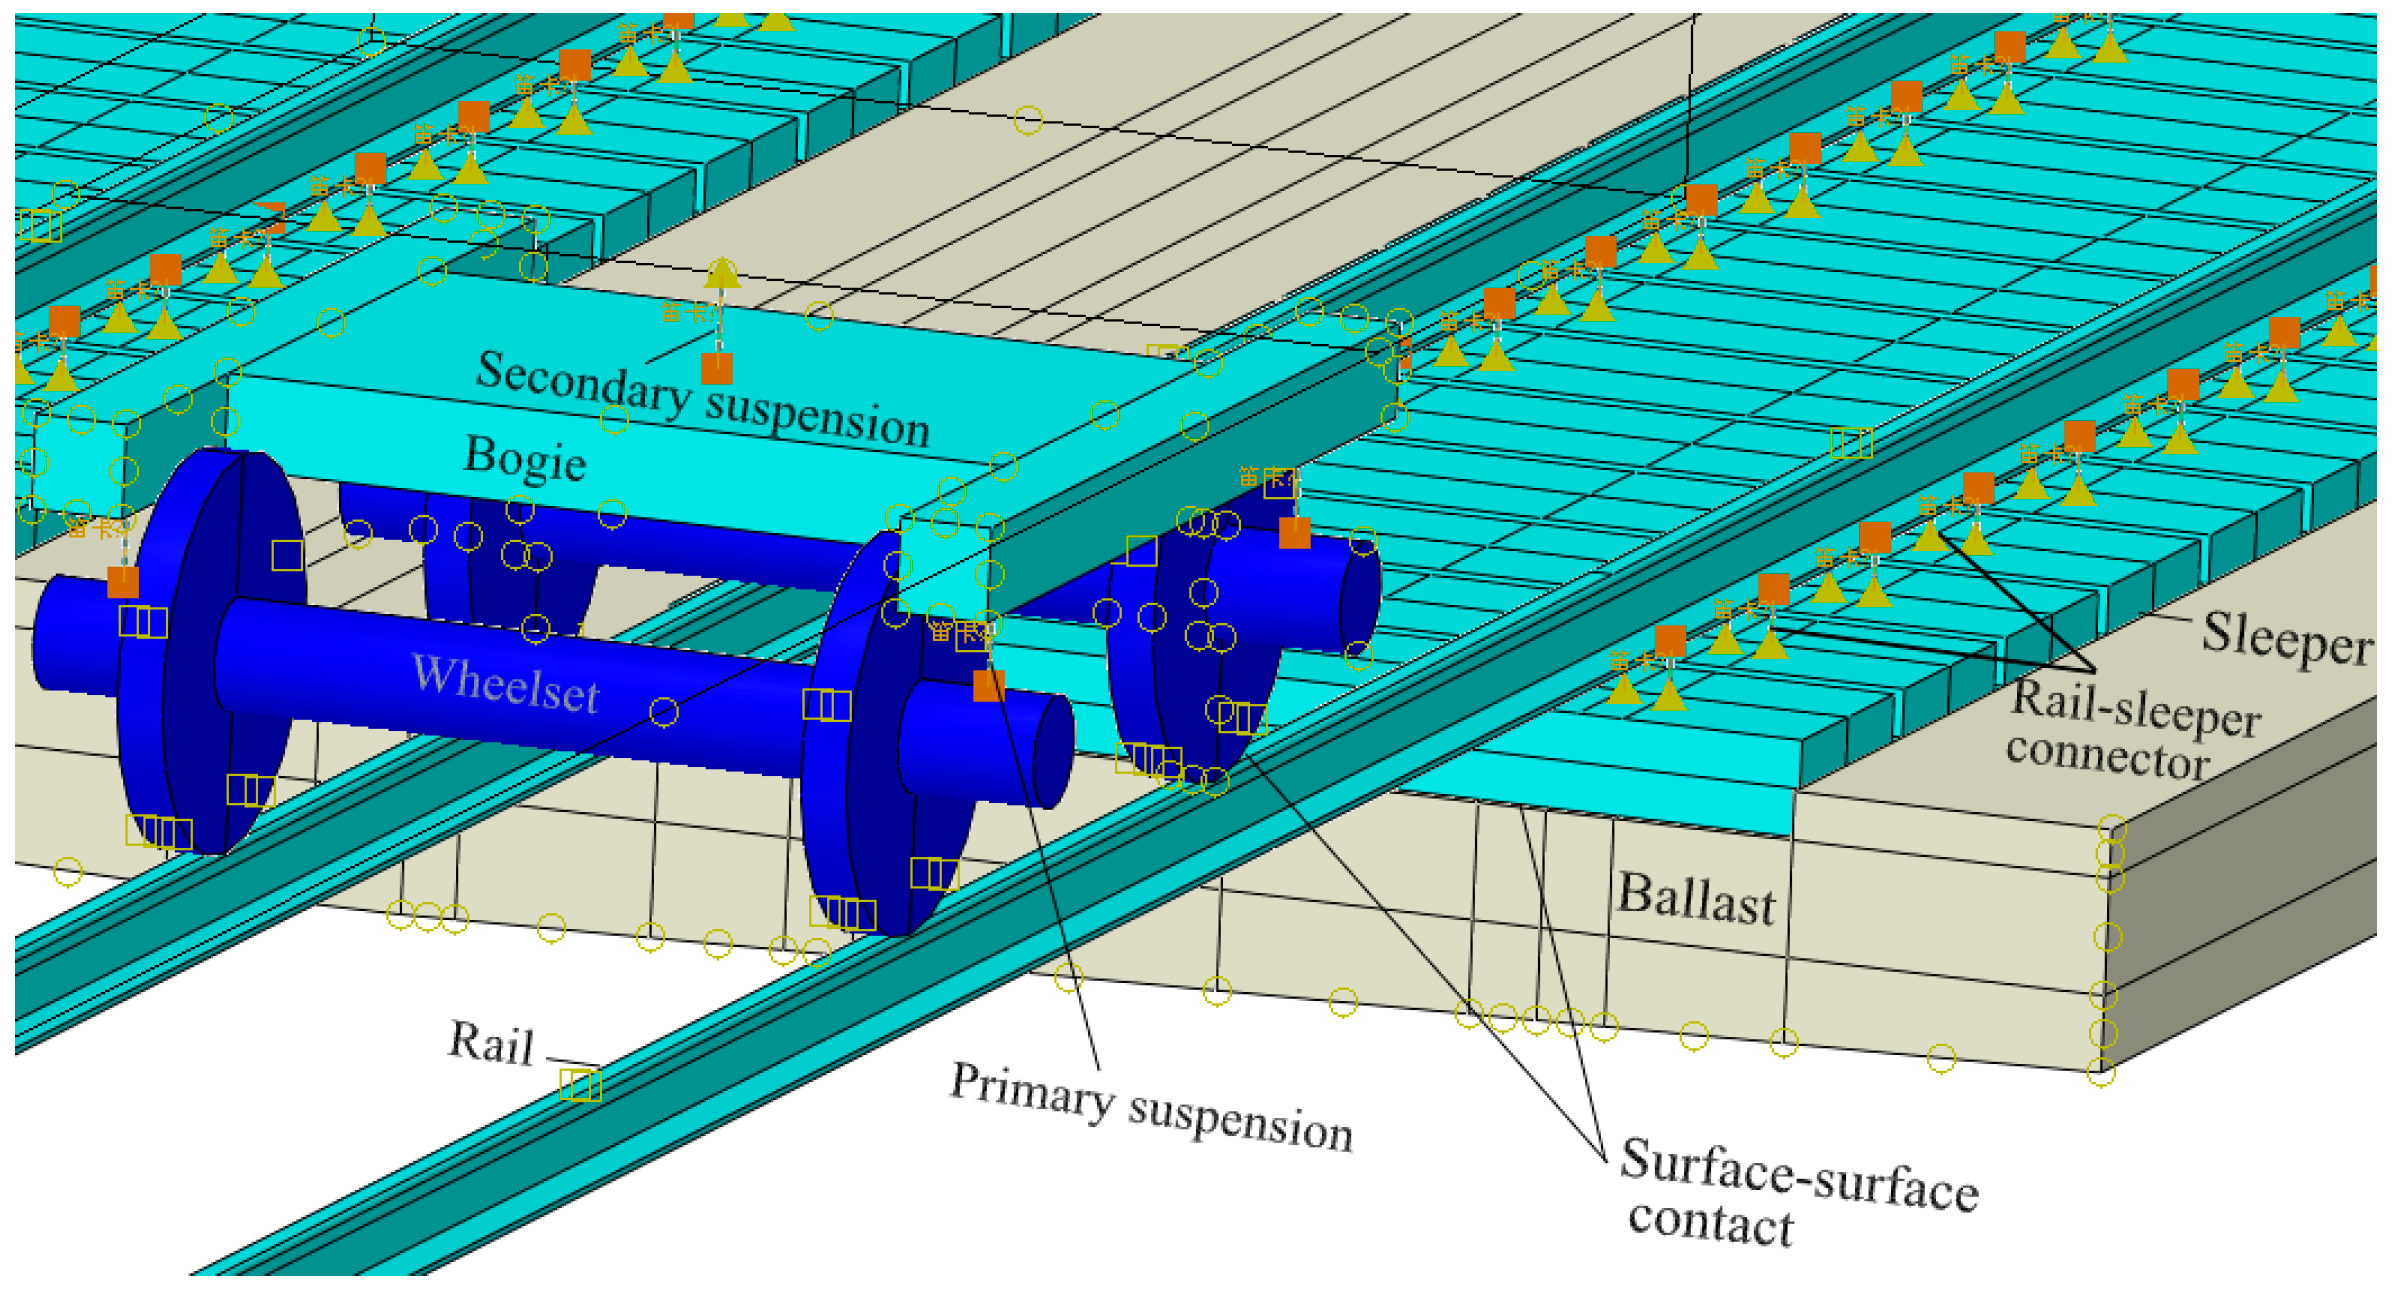
2.2. Numerical Model

Based on Figure 1, a traintunnel–surrounding rock model was established by using the finite element modeling (FEM) software ABAQUS (Dassault Simulia, Providence, RI, USA). The model size was 100 m × 100 m × 30 m (width × height × thickness). The shallow buried tunnels are more difficult to form a ground arch in than deep buried tunnels [37,38,39]; thus, the depth between the tunnel vault and ground surface was set to 15 m [36]. The system anchor bolt was ignored according to the design.
The elastic material was adopted to simulate the tunnel lining, sleeper, rail and the whole train. In addition, the surrounding rock and ballast were a Mohr–Coulomb elastoplastic material [19,35]; these parts were simulated using C3D8R solid elements in the numerical model. The train–tunnel–surrounding rock model and its mesh are presented in Figure 2; there are 239,490 elements for this mesh.
The viscoelastic boundary was adopted to eliminate the boundary effect [40,41,42,43]. The normal stiffness of the bottom boundary was 2.2 × 10⁷ N/m and normal damping was 2.7 × 10⁶ kg∙m−2∙s−1. The normal stiffness of both side boundaries was 1.1 × 10⁷ N/m and the shear damping was 1.4 × 10⁶ kg∙m−2∙s−1.
The relationships between the soil–tunnel, tunnel–ballast bed and sleeper–ballast bed were all simulated by surface–surface contact, and the friction coefficients were 0.5, 0.4 and 0.33, respectively. The rigid constraints were adopted to define the relationship between the wagon-bogie and bogie-wheel.
The train speed was 72 km/h, and the train ran in the tunnel for 400 increments, 0.00375 s per increment, 1.5 s in total.

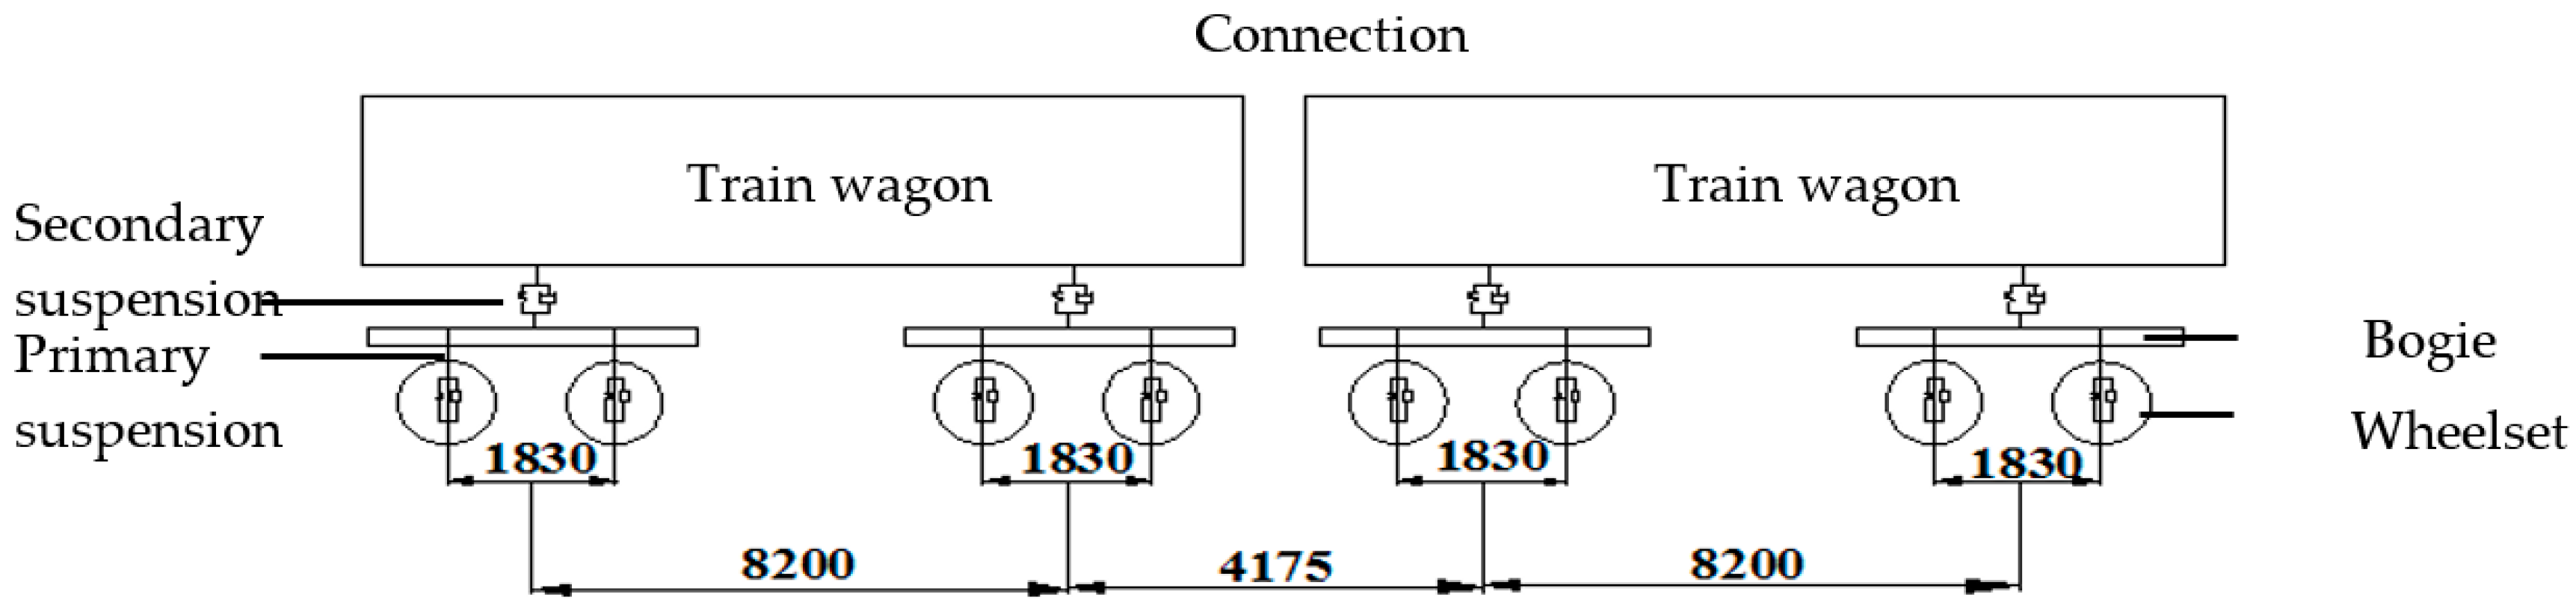
2.3. Train Parameters

The train axle load was 30 t, the total weight of the full-load train was 118.56 t, the center distance of the bogie in the same wagon was 8.2 m and the center distance of the bogie between the two adjacent wagons was 4.175 m, as shown in Figure 3.
The train is composed of a carriage and a bogie and wheel set, as shown in Figure 4.
The total weights of the 25 t, 27 t, 33 t and 35 t axle-load trains were 99 t, 108 t, 132 t and 140 t, respectively, and their train size was selected with reference to the 30 t axle-load train, as shown in Figure 3.
Surface-to-surface contact was adopted to simulate the relationship between wheel and rail. The master surface of the wheel–rail contact was located at the bottom of the wheel, and its slave surface was located at the top of the rail, as shown in Figure 5.
When the train wheels are running on the track, the weight of the wagon will cause the vertical deformation of the rail, and the different weight (axle load) of the wagon will produce a different vertical deformation. According to the Hertz nonlinear elastic contact theory [44,45], the normal force between the wheel and the track can be obtained as shown in Equation (1):
P N ( t ) = 1 G δ N ( t ) 3 / 2
where P N ( t ) is the wheel/rail normal force (N), δ N ( t ) is the normal elastic compression of the wheel/rail contact point, t is the running time of the model, G is the constant for the wheel/rail contact, LM is the wear type tread G = 3.86 R−0.115 × 10⁻⁸ (m/N2/3) and R is the wheel rolling radius (m); in this paper it was 0.4575 m.
The parameters of the primary suspension located between the bogie and wheelset, the secondary suspension located between the bogie and wagon and the contact of the suspension and rail–sleeper [31,46], as shown in Figure 6, are provided in Table 1.

2.4. Mechanical Parameters

Referring to the Chinese standard [47], the model parameters are listed in Table 2.

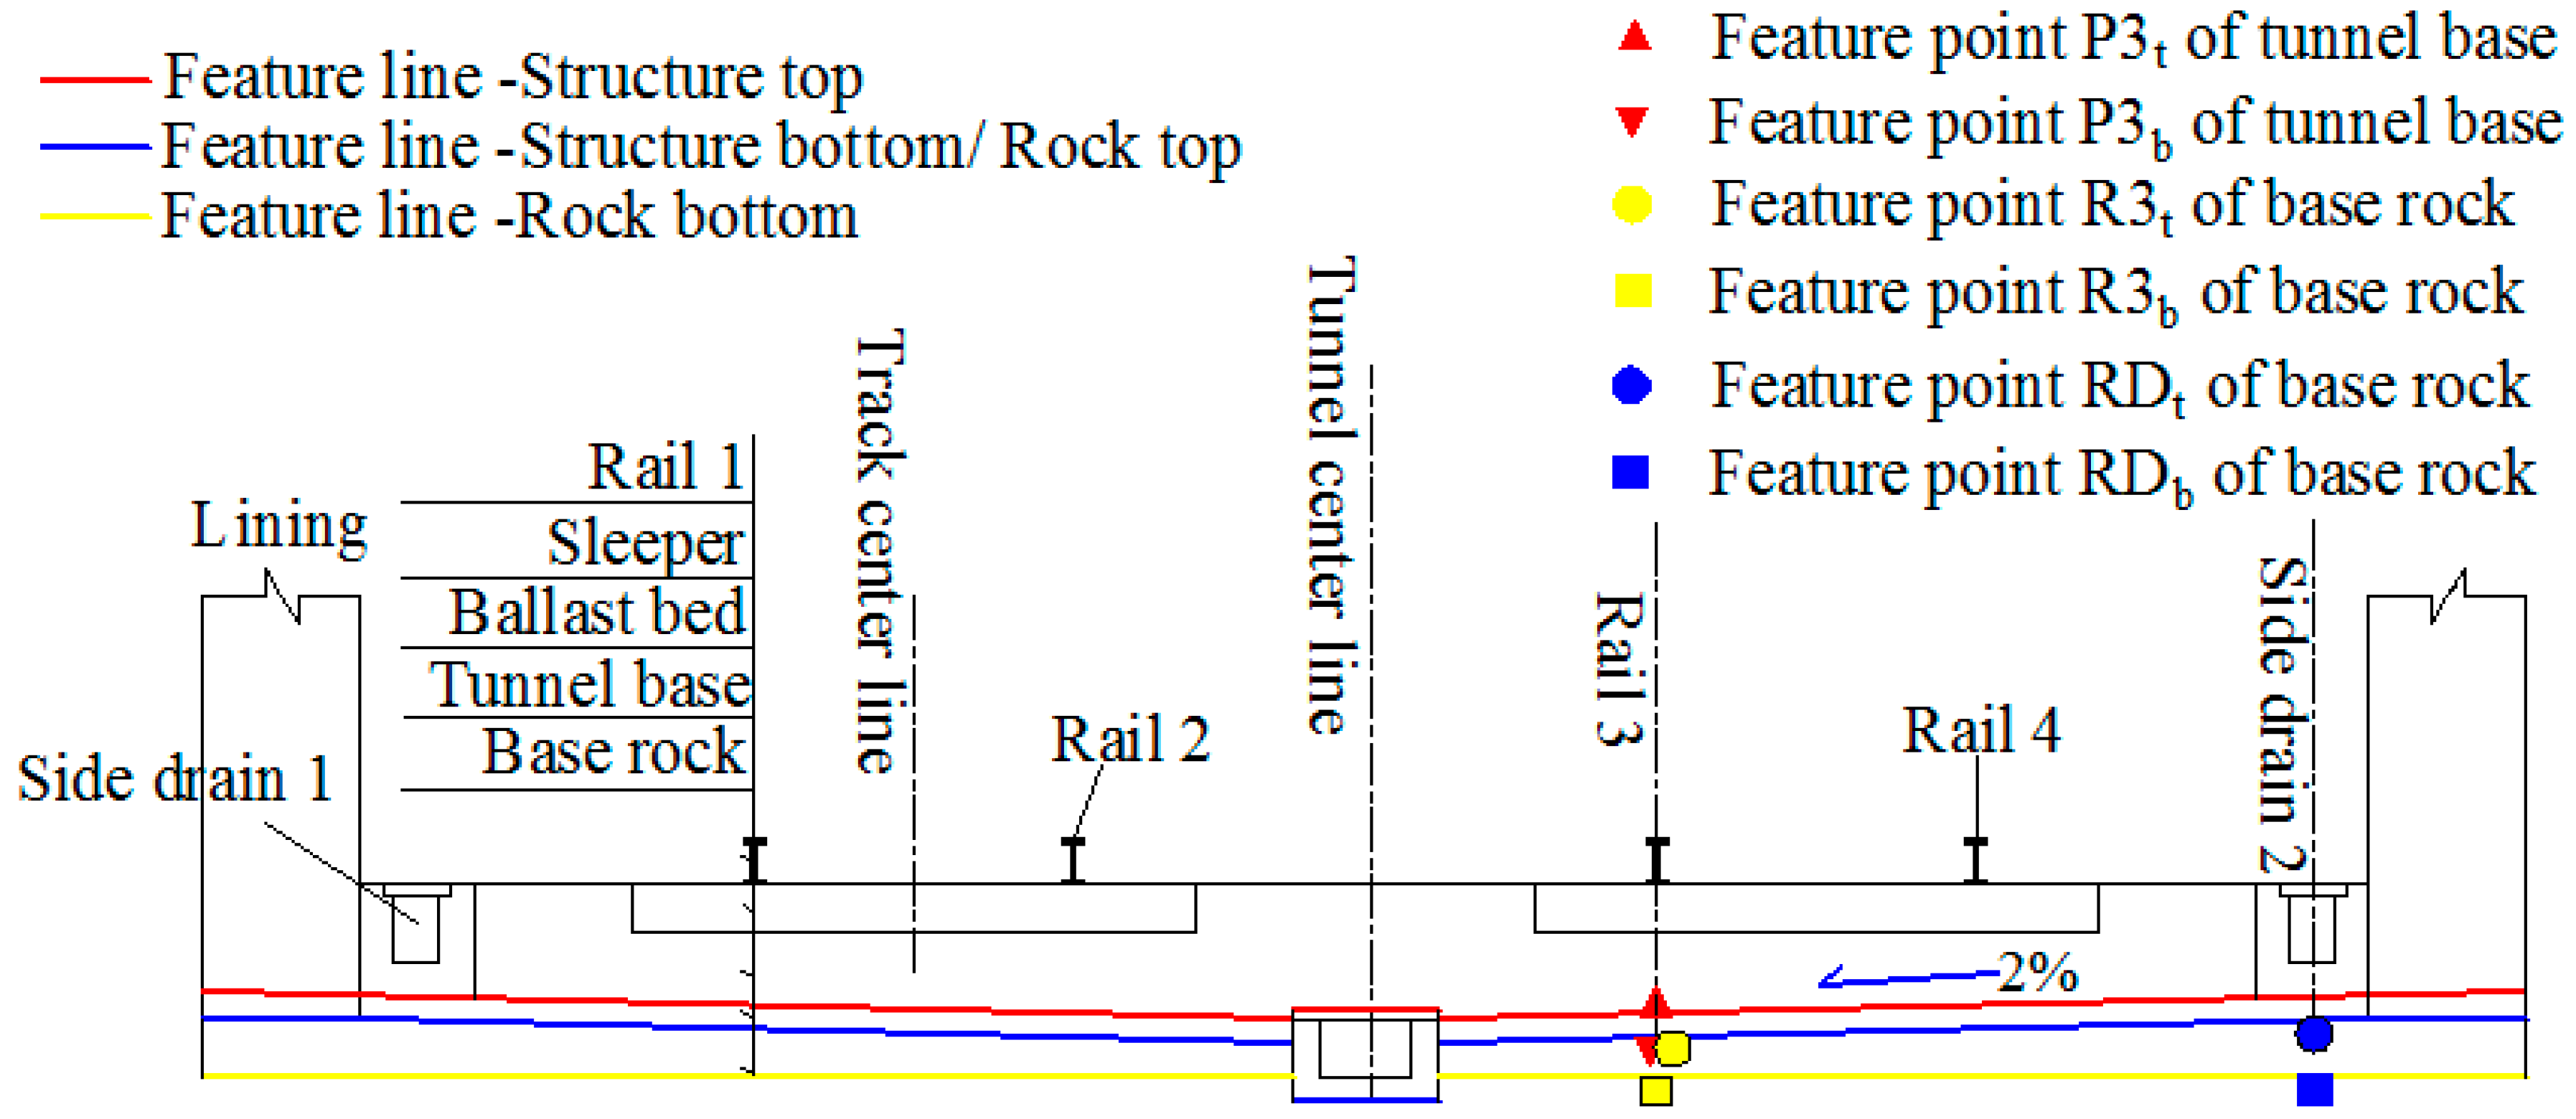
2.5. Feature Points and Feature Lines

In Figure 7, four feature lines were arranged to obtain the dynamic–response distribution of the bottom structure and rock, which was located 3 m away from the tunnel portal. The feature line of the rock bottom was 20 cm lower than the feature line of the rock top. The feature point was located at a specific point on the feature line and four feature points were arranged under rail 3 (which means the 3rd rail from the left), because the maximum dynamic response appears directly below the rail [48]. P3t means the feature point was right below rail 3, and located at the feature line that was at the top of the tunnel bottom structure (shortened to structure top). R3b means the feature point was right below rail 3, and located at the bottom of the base rock (shortened to rock bottom). Two feature points were arranged under side drain 2.

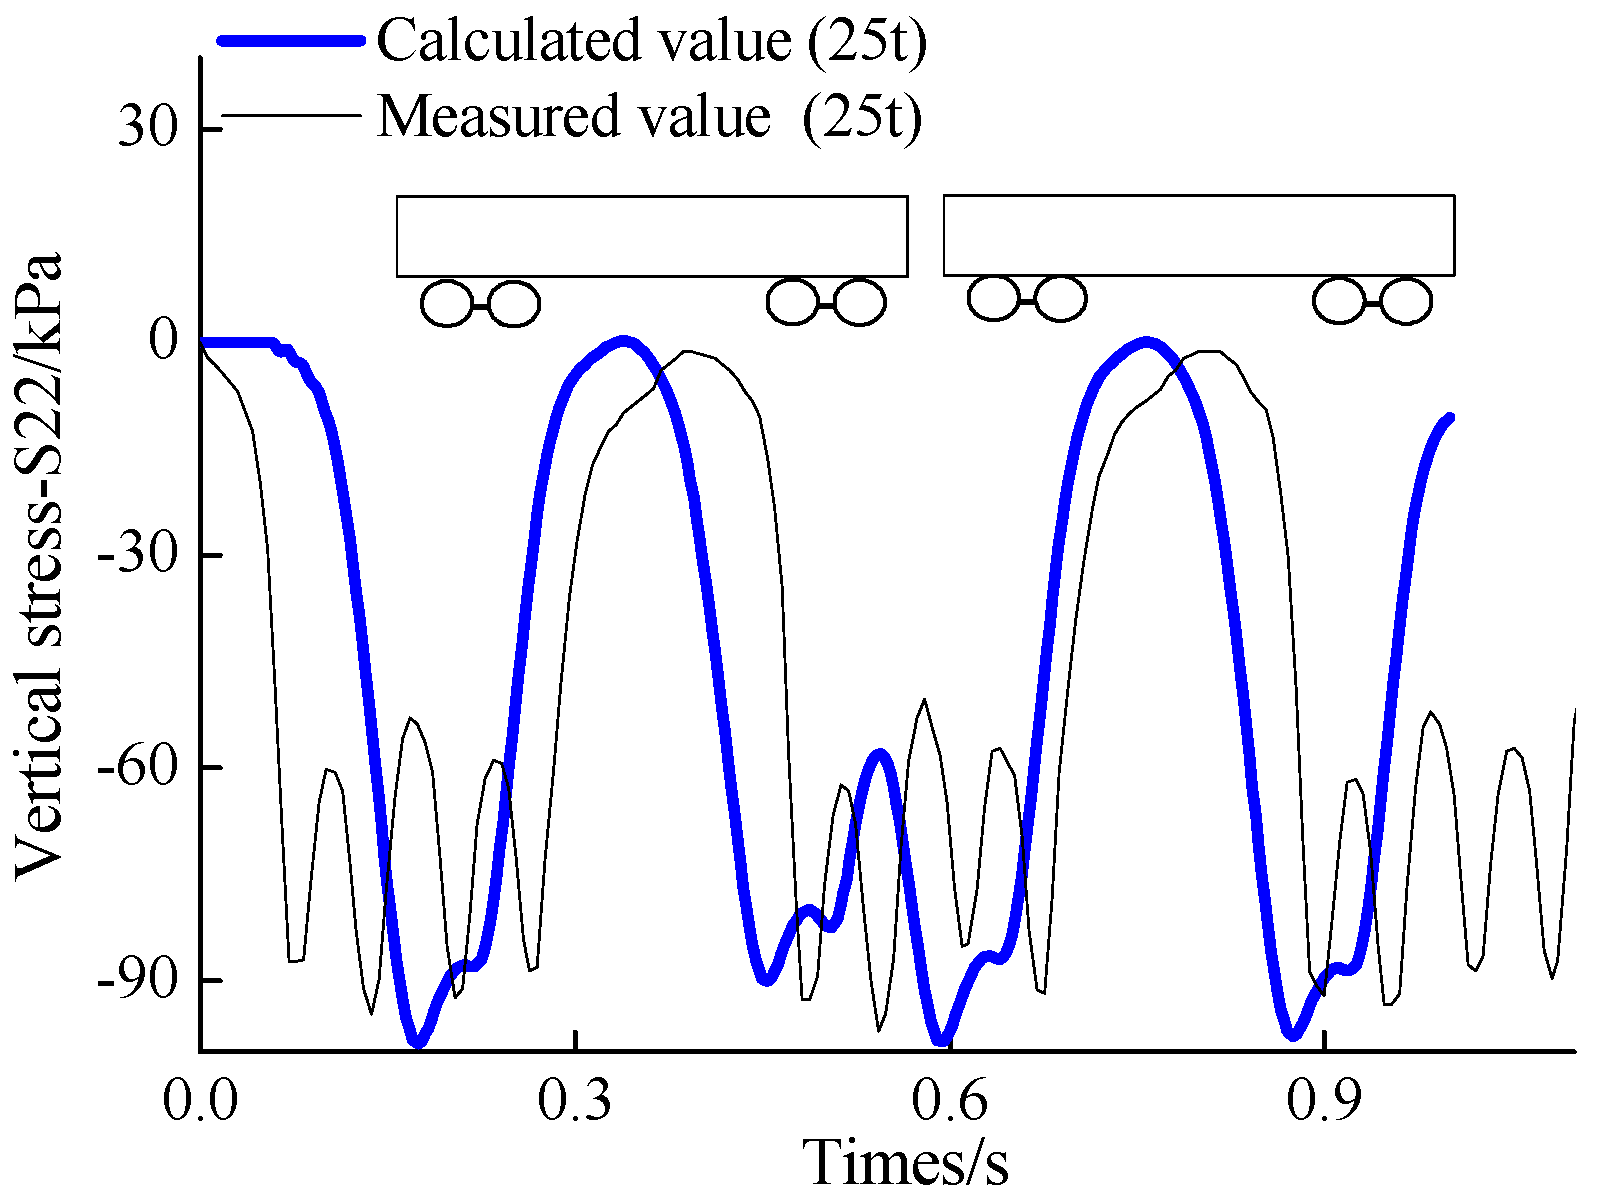
2.6. Model Verification

To verify the accuracy of the numerical simulation model, the field–measured dynamic response was selected to compare with the numerical results. The measured value came from the Sanjiacun Tunnel of the Shuohuang heavy-haul railway [7]. The data measured the vertical dynamic stress of the tunnel basement structure in grade III surrounding rock, under the action of a 25 t axle–load train. Therefore, the vertical dynamic response of the numerical simulation model was selected for comparison under the same conditions: a 25 t axle load and grade III surrounding rock, as shown in Figure 8.
The maximum simulated and measured vertical dynamic stresses of the train were 99.83 kPa and 97.17 kPa, respectively, which were located below rail 3. The simulated value was very close to the measured value, and the deviation was 2.7%, indicating that the numerical model and parameters selected were reasonable.

3. Dynamic Response under Train Load Only

Compared with the stress caused by the surrounding rock, the dynamic response caused by the train is much smaller. Therefore, it is necessary to ignore the surrounding rock pressure to reveal the dynamic response distribution characteristics of the tunnel bottom structure and surrounding rock caused by the train load alone.
The concrete and surrounding rock are all brittle materials in this paper; the failure of brittle materials can be judged by the maximum principal stress and the minimum principal stress. Thus, in the numerical simulation, the principal stress was selected to analyze the dynamic response of tunnel bottom structures and the base rock.
The vertical dynamic stress can be obtained directly by testing, as it is usually adopted to express the dynamic response of the bottom structure. The vertical dynamic stress is less than the amplitude of the minimum principal stress.

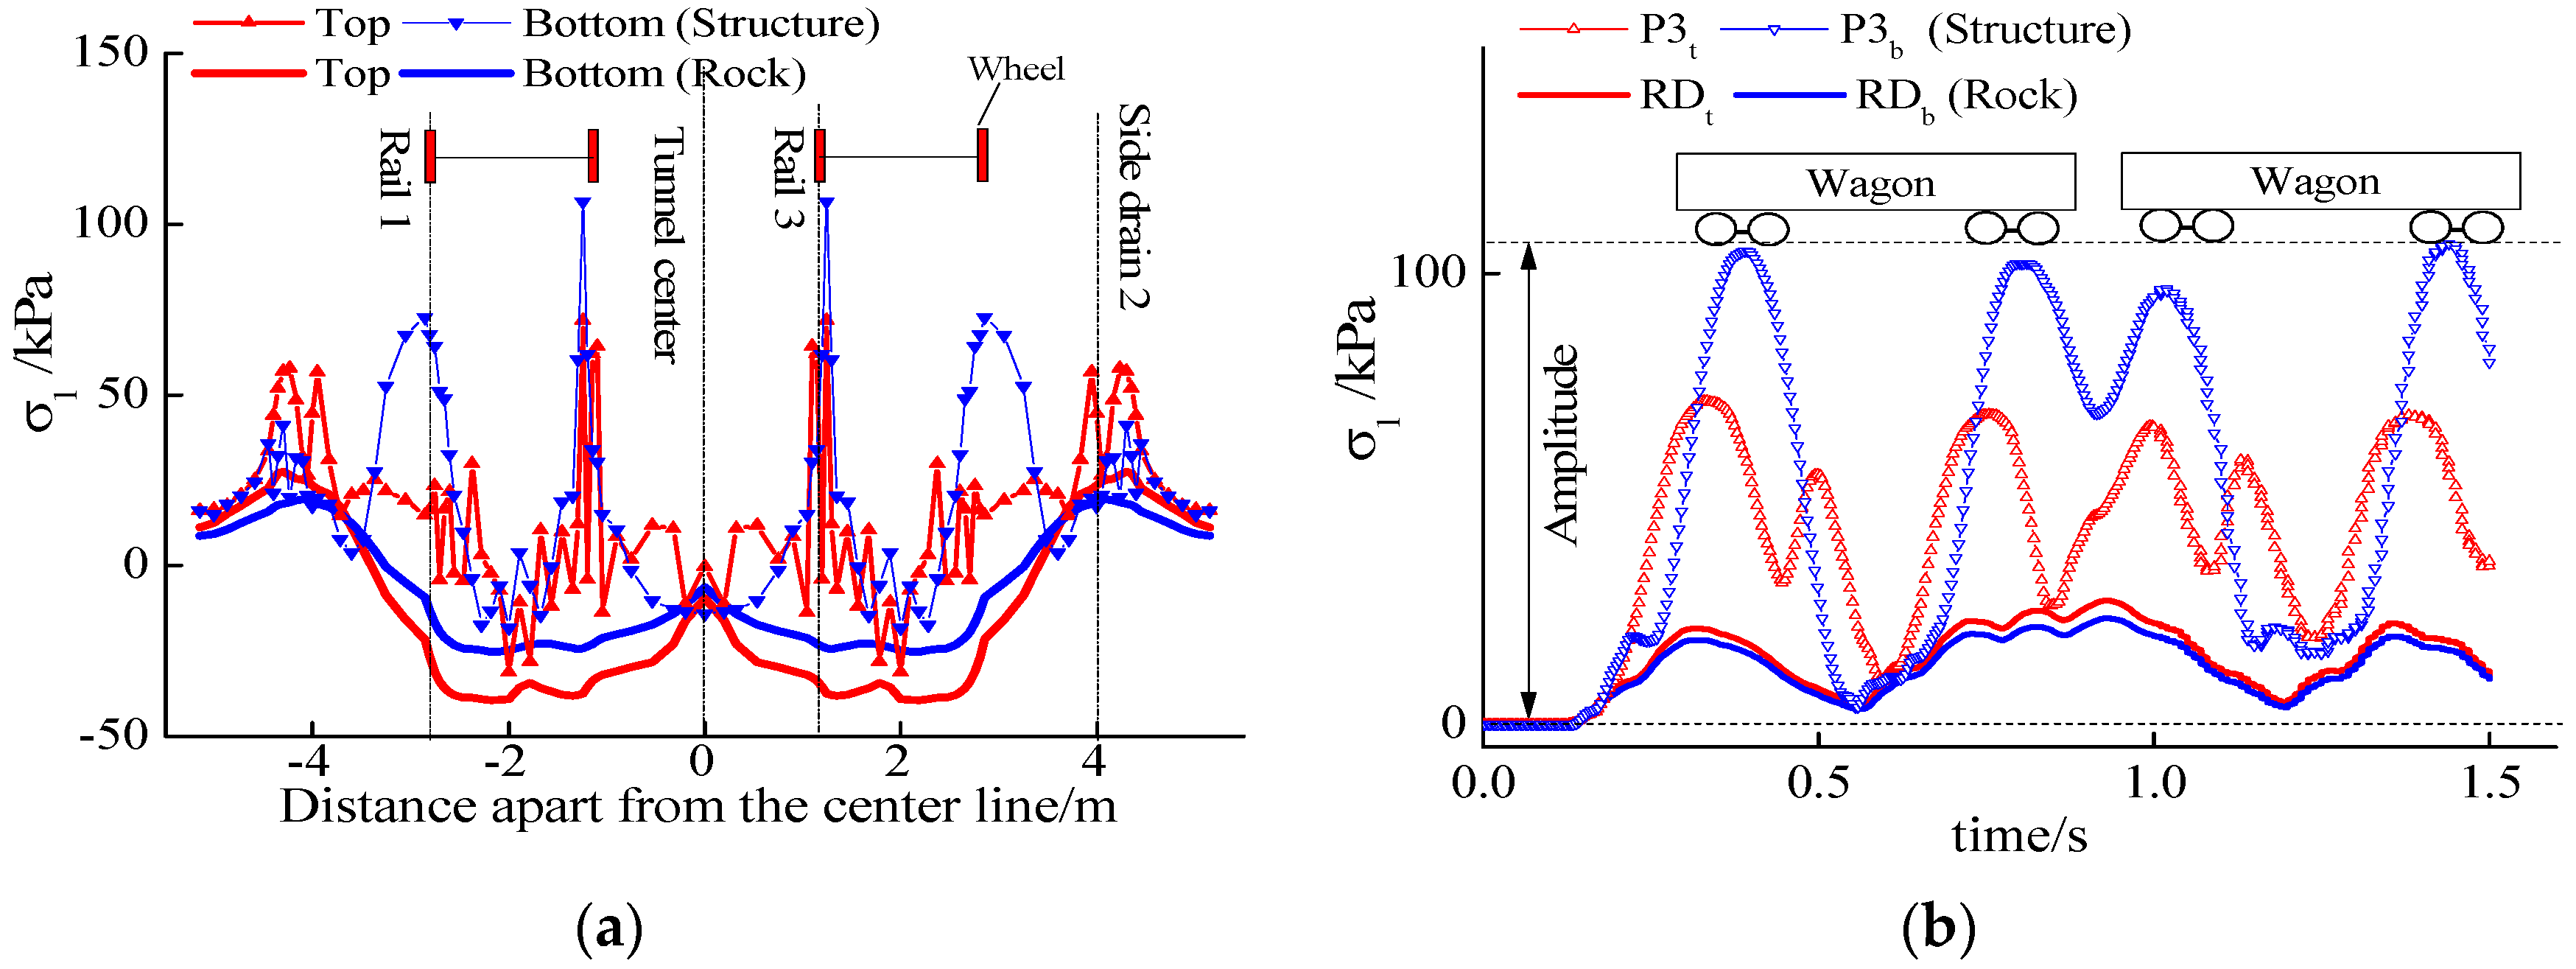
3.1. Maximum Principal Stress

When the 30 t axle–load train passed (at 4.5 s), as the maximum principal stress distribution of the tunnel bottom structures and base rock shows in Figure 9, four groups of wheel marks appears in the tunnel bottom structure and surrounding rock. The maximum value of the principal stress in the bottom structure was located directly below rail 2 and rail 3, and the maximum value of principal stress in the base rock appeared at the side drain.
When the pair of train wheels passed above the four feature lines, the horizontal distribution of the maximum principal stress is shown in Figure 10a. The maximum value of the principal stress was located directly below rail 2 and rail 3, the structure’s maximum value appeared at its bottom surface (feature point P3b) and the rock’s maximum value appeared at its top surface.
In Figure 10b, the time–history curve reveals that when a train passed through the tunnel, two types of dynamic impacts occurred: the first and last wheel sets of the train were separate wheel−set impacts, whereas all carriages in the middle were impacted by bogies (two sets of adjacent wheel sets). In the tunnel structure, point P3b had the largest amplitude of maximum principal stress, with a value of 106.5 kPa. In the base rock, point RDt had the largest amplitude of maximum principal stress, with a value of 27.5 kPa.

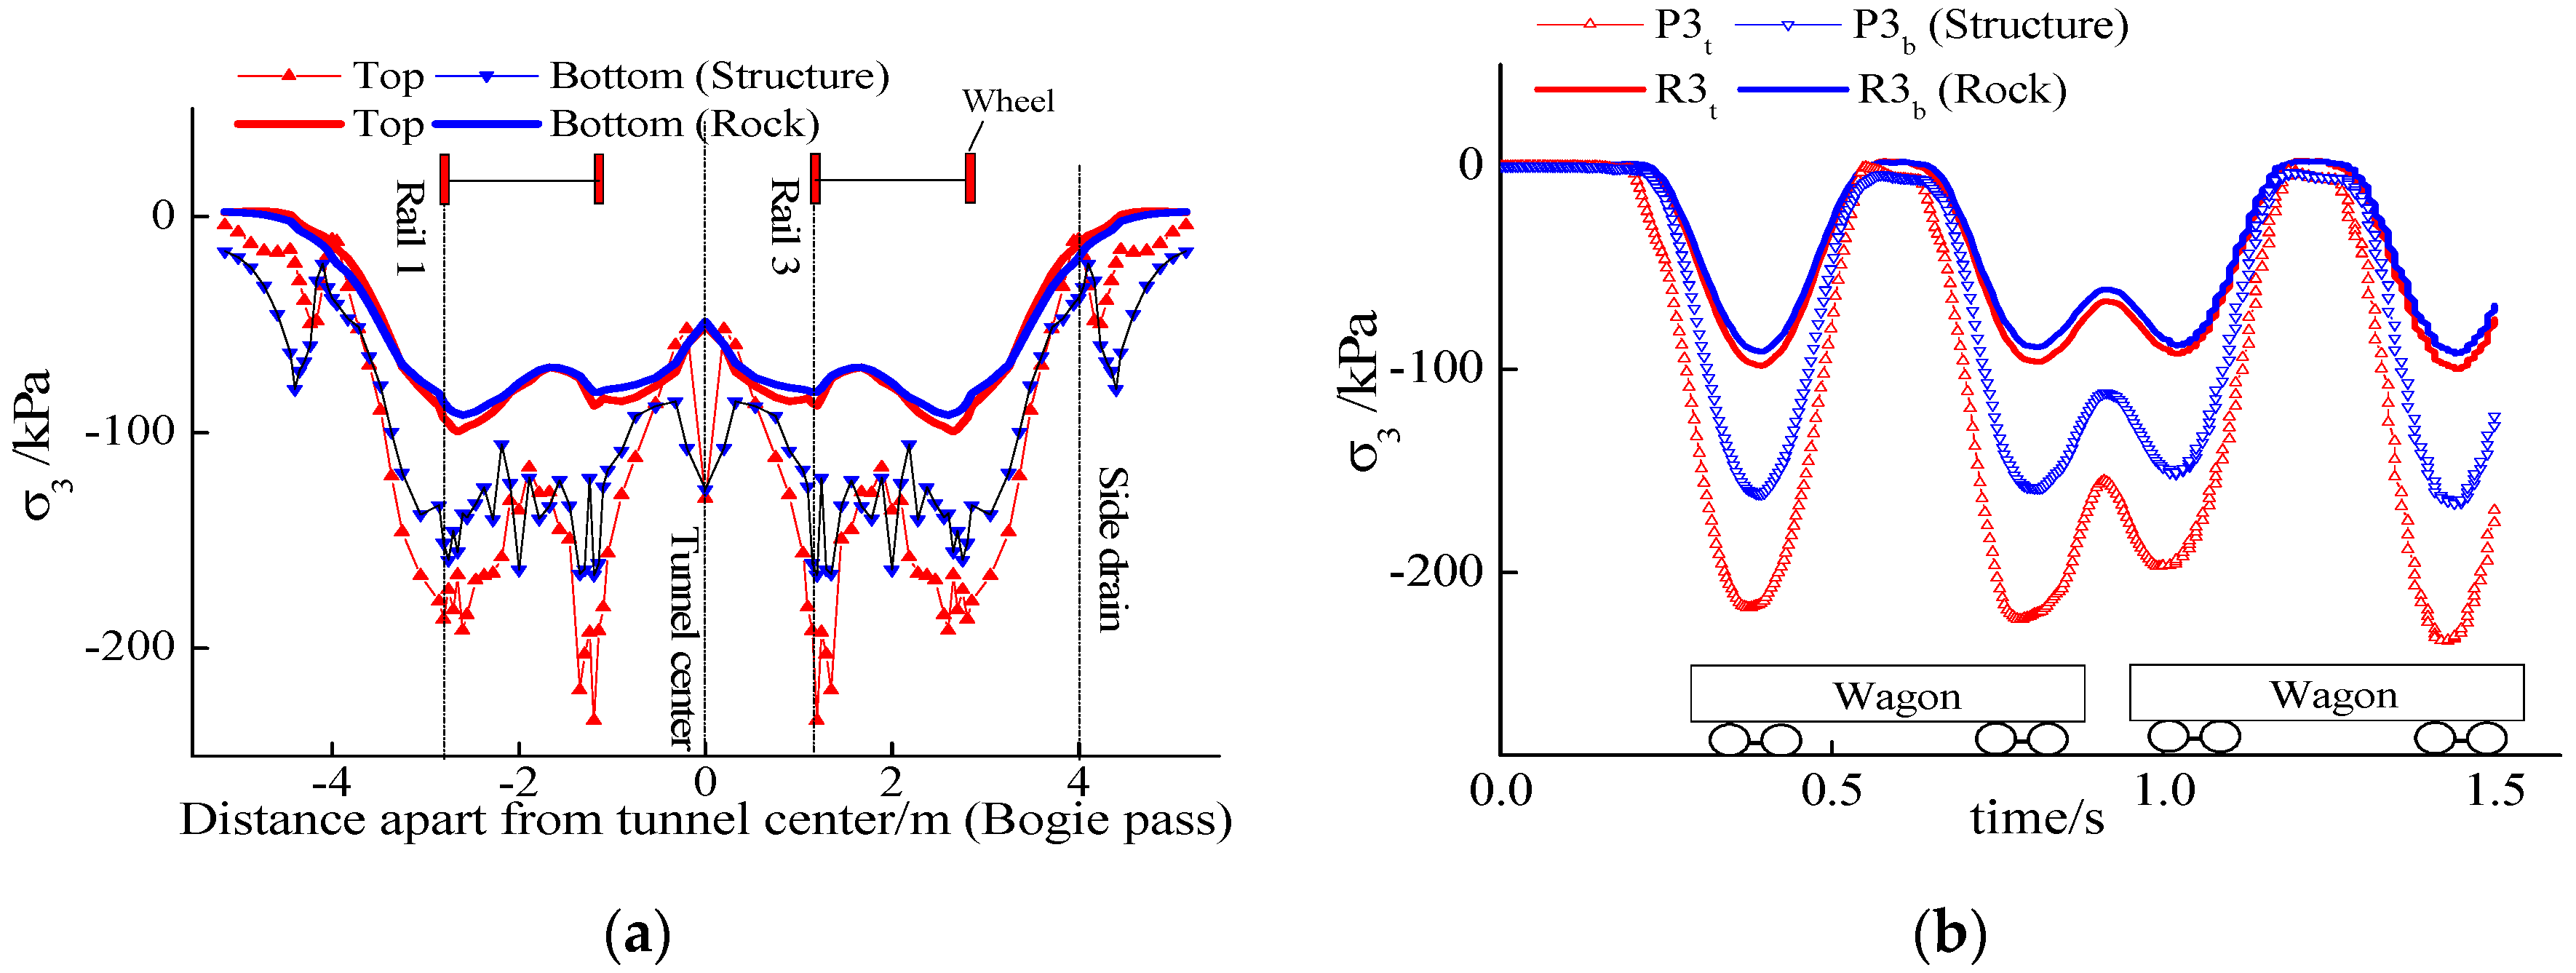
3.2. Minimum Principal Stress

When the 30 t axle−load train passed (at 4.5 s), four groups of wheel marks appeared in the minimum principal stress contour of the tunnel bottom structure and surrounding rock, as shown in Figure 11.
The minimum value of the principal stress in the bottom structure was located directly below the rail. The four feature lines were selected to reflect the characteristics of the minimum principal stress, as shown in Figure 12. The structure’s minimum value of principal stress appeared at its top surface (feature point P3b), located directly below rail 2 and rail 3. The rock’s minimum value of principal stress appeared at its top surface, located directly below rail 1 and rail 4.
In Figure 12b, point P3t had the largest amplitude of minimum principal stress, with an amplitude of 233.7 kPa. In the base rock, point R3t ‘s minimum value of principal stress was −99.6 kPa.

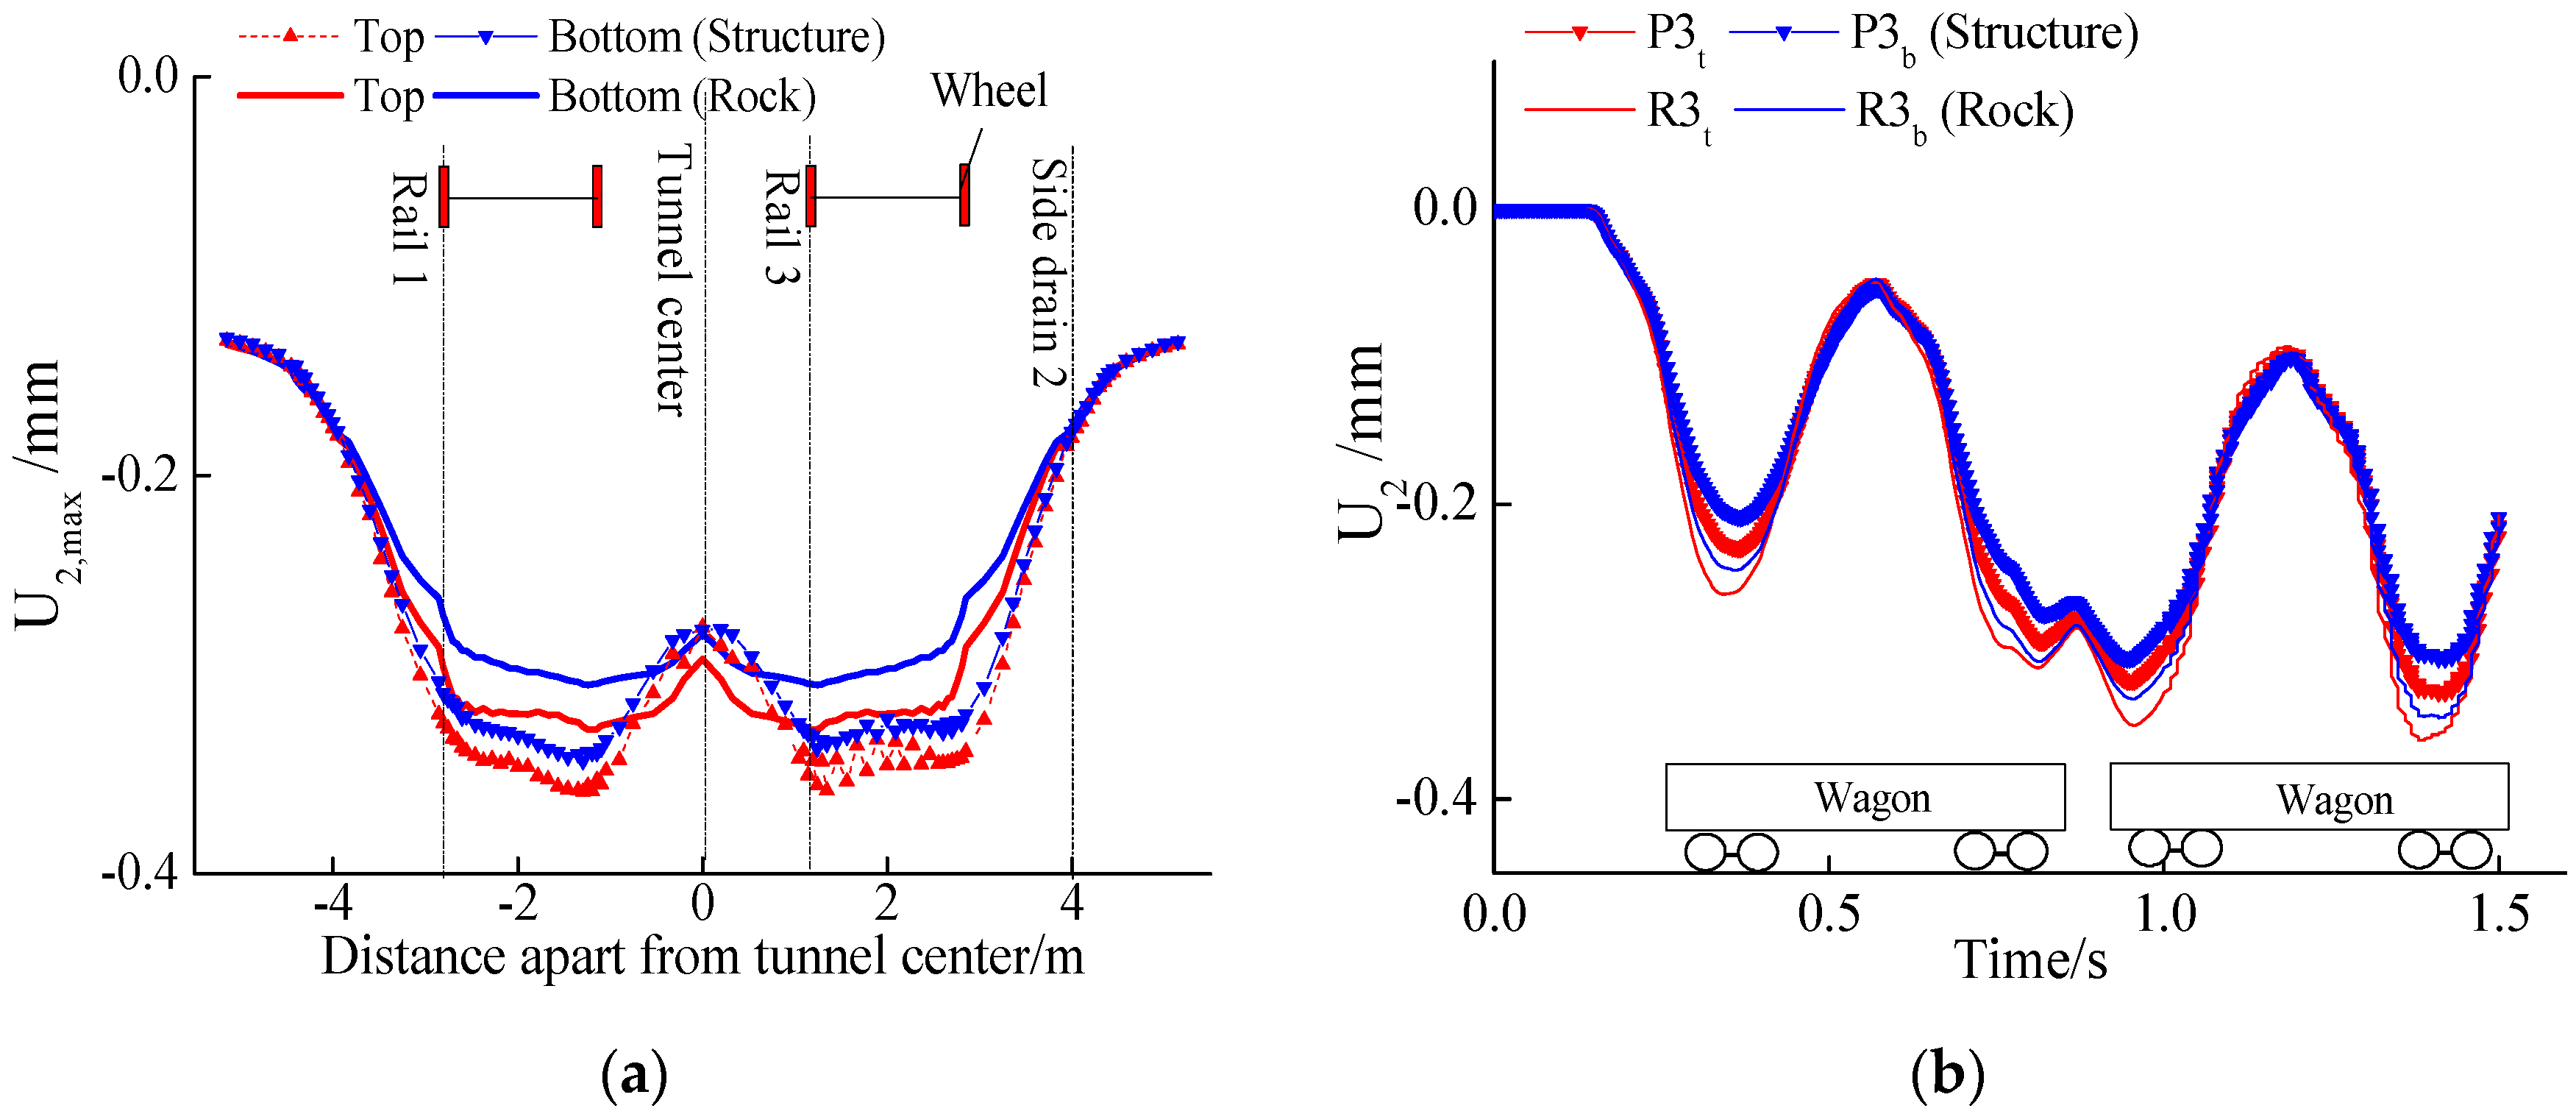
3.3. Vertical Displacement

Under the action of the 30 t axle load train, the vertical displacement contours of the tunnel bottom structure and surrounding rock are shown in Figure 13.
The maximum vertical displacement appeared right below the wheel. At the interface between the tunnel bottom and surrounding rock, the vertical-displacement distribution characteristics of the two were similar, and the vertical displacement was also very close. The vertical displacement of the top was higher than the bottom, both in the tunnel bottom structure and base rock, shown in Figure 14a.
In Figure 14b, point P3t had the largest amplitude of vertical displacement, with an amplitude of 0.33 mm. In the base rock, point R3t ’s maximum value of vertical displacement was 0.36 mm.

4. Dynamic Response under Surrounding Rock Pressure and Train Load

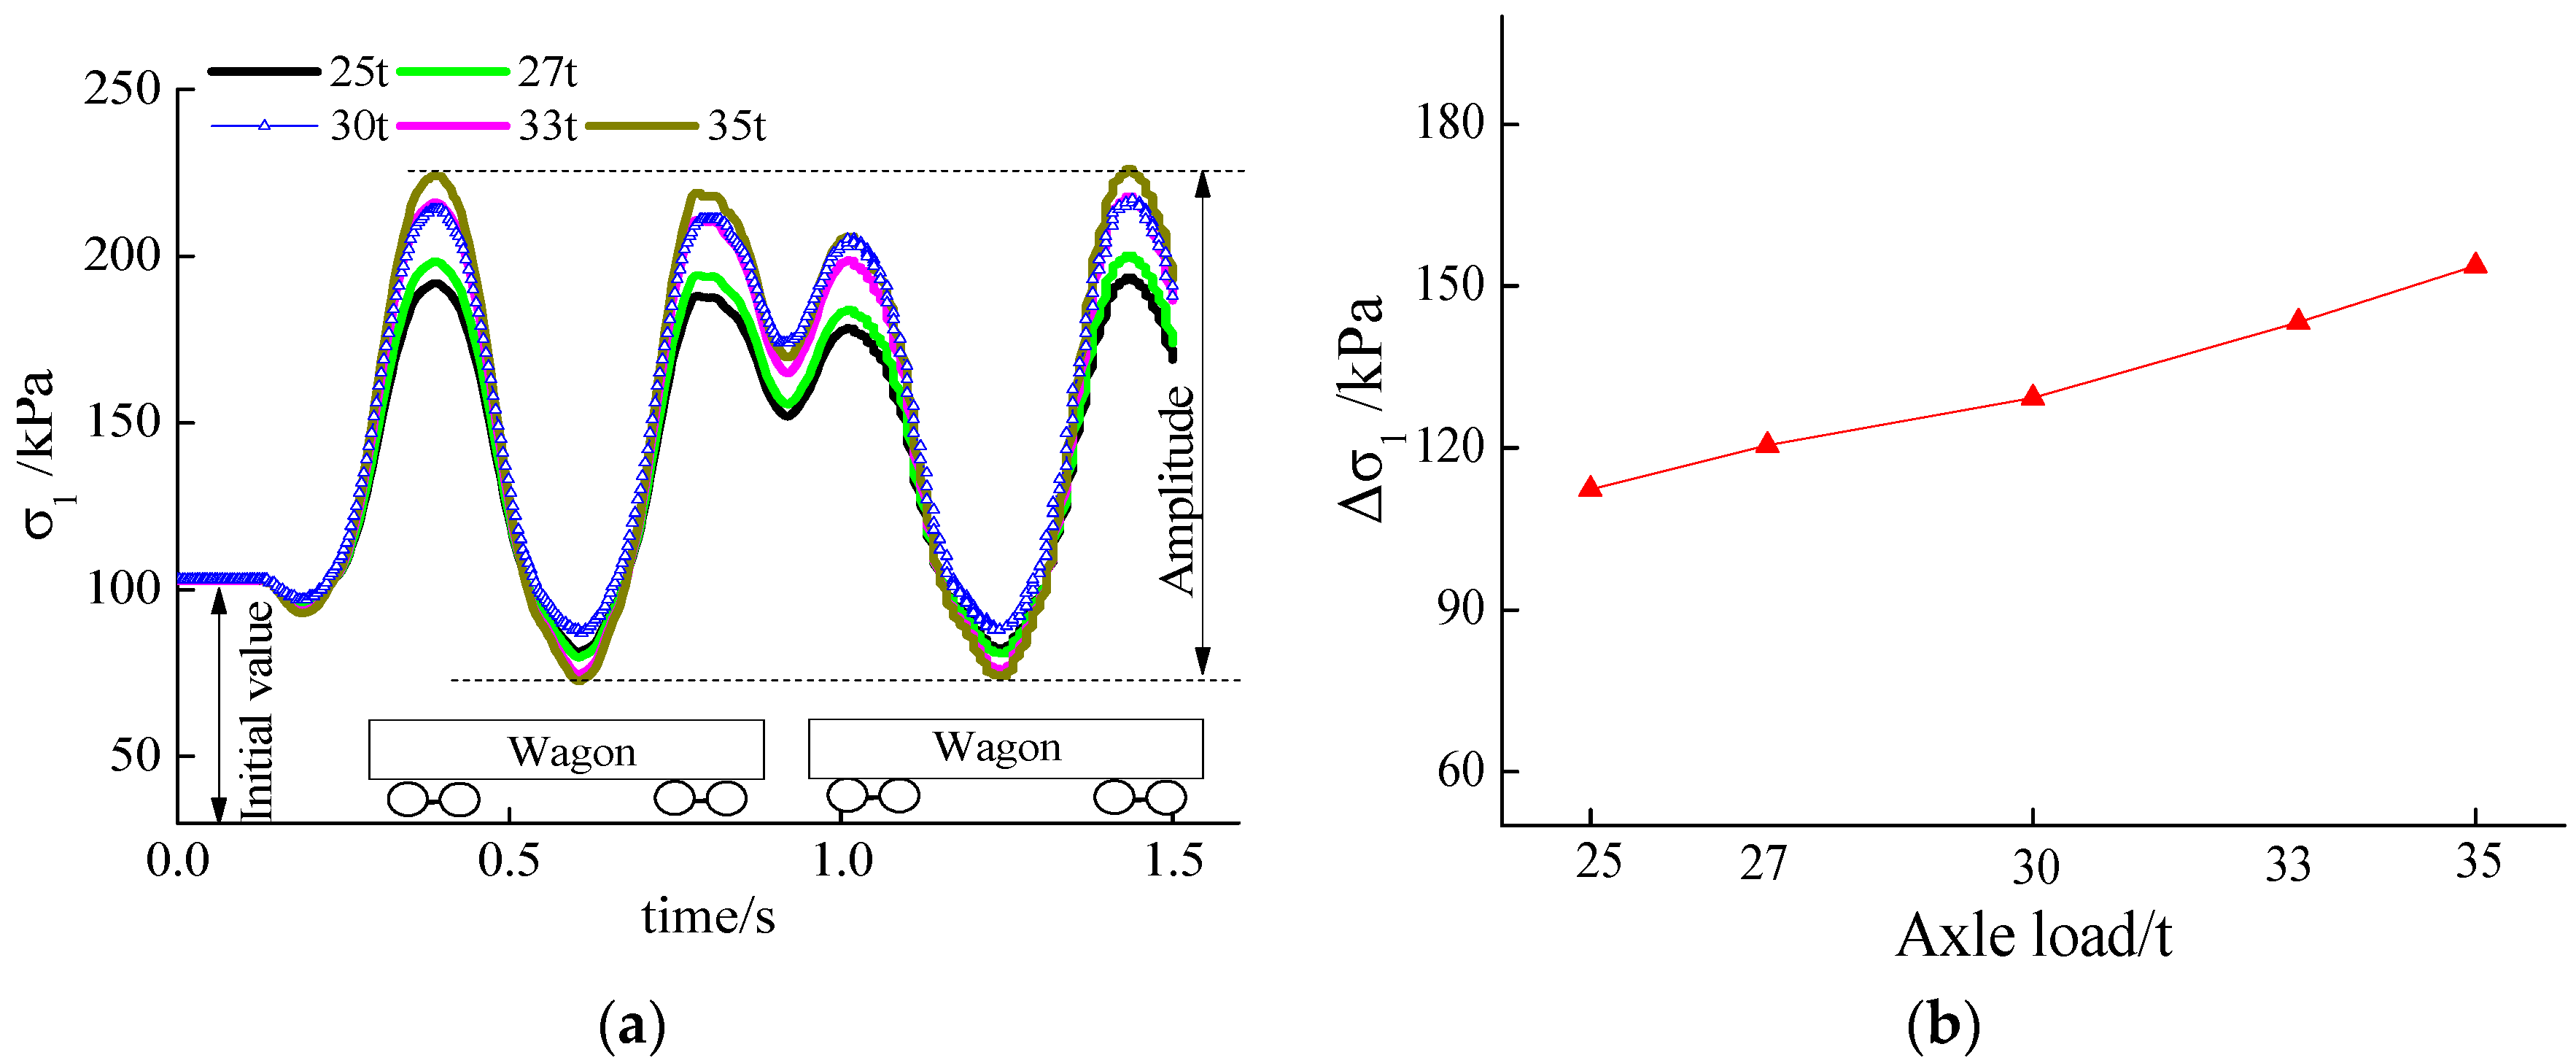
4.1. Maximum Principal Stress of Tunnel Structure

Under the action of the surrounding rock pressure and train-load coupling, there were no wheel marks in the tunnel’s maximum principal stress contour because the static stress caused by rock pressure was much higher than the dynamic response caused by train load, as shown in Figure 15.
The tunnel structure was in a high-static and low-dynamic stress state with a maximum value of principal stress on the tunnel’ feature lines of 1.27 MPa, located at the bottom surface of the structure, below the side drain.
The results in Section 3.1 reveal that the maximum dynamic response appeared at the point P3b. Under the action of different axle loads, the time–history curve of the maximum principal stress at point P3b is shown in Figure 16. The initial value of the time–history curve was caused by a static load, only related to the surrounding rock pressure, and the amplitude of the time–history curve was caused by a dynamic train load, which increases as the axle load enlarges.
Under the action of the surrounding rock pressure and 30 t axle train-load coupling, the maximum amplitude position of the dynamic response was consistent with that under the action of an individual train load; the maximum principal stress amplitude was 129.3 kPa. When the axle load increased by 1 t, the dynamic amplitude of the maximum principal stress increased by about 4.14 kPa.

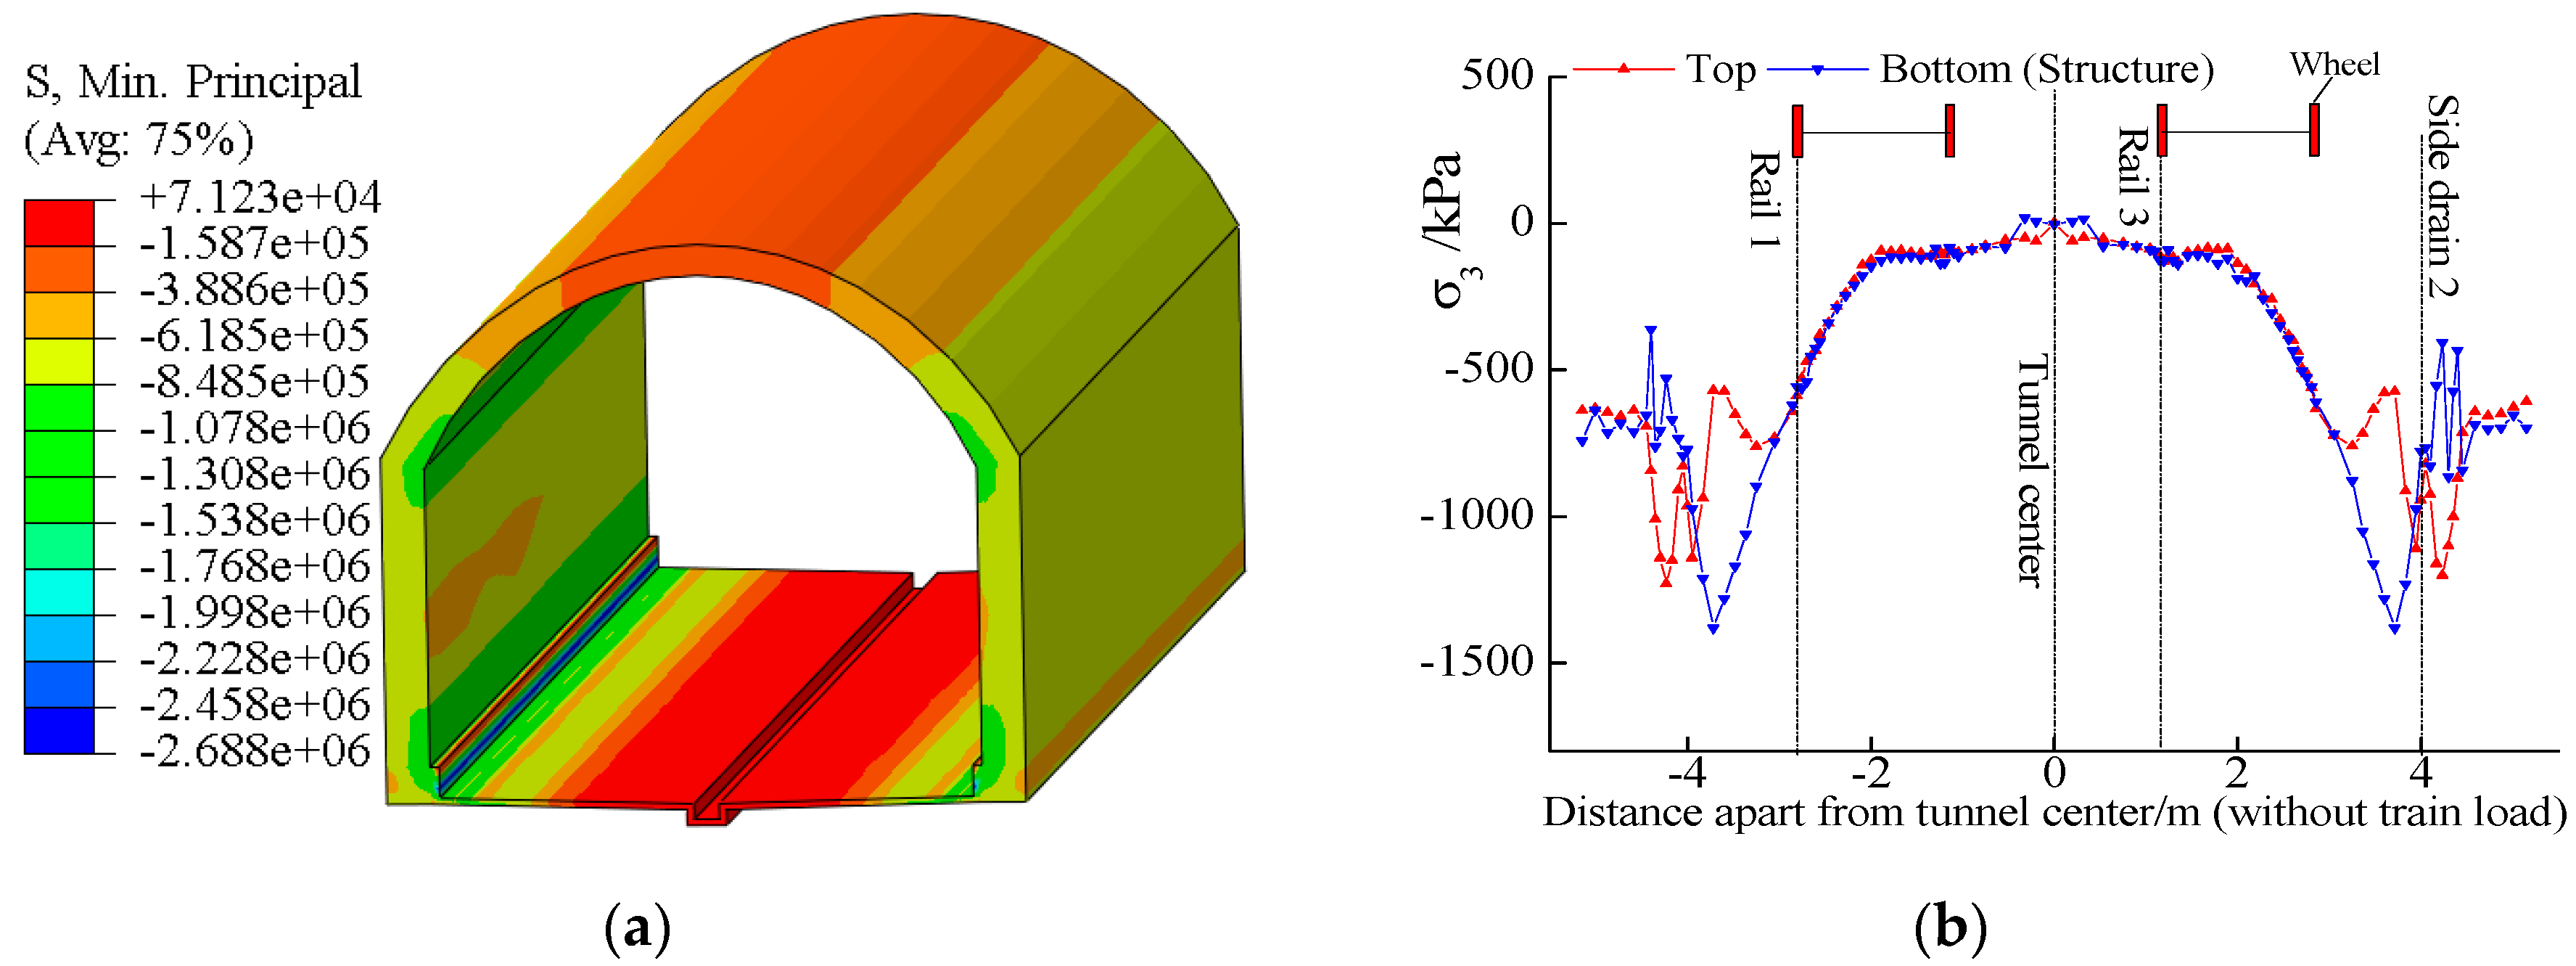
4.2. Minimum Principal Stress of Tunnel Structure

Because the static stress caused by rock pressure was much higher than the dynamic response caused by train load, there were no wheel marks in the tunnel’s minimum principal stress contour, as shown in Figure 17.
In Figure 17a, the minimum value of the principal stress was −2.69 MPa and located at the tunnel side drain, which was not included in the feature lines and feature points. The minimum principal stress distribution on the feature lines is presented in Figure 17b, with the minimum value of 1.38 MPa located at the bottom surface near the side drain.
Under the action of the surrounding rock pressure and 30 t axle train−load coupling, the maximum dynamic response still appeared at the point P3t and the minimum principal stress amplitude was 242.6 kPa. The influence of the train axle load on the structure’s minimum principal stress is shown in Figure 18. Under a different axle load, the initial value of the minimum principal stress remained unchanged. When the axle load increased by 1 t, the dynamic amplitude of the structure’s minimum principal stress increased by about 7.50 kPa.
The amplitude of the minimum principal stress was usually greater than the measured data, because the measured data often used the vertical dynamic stress to express the dynamic response of the structure.
In the literature [22], in grade V surrounding rock under the action of a 30 t axle−load train, the measured vertical dynamic stress of the filling layer’s top surface ranged from 80.80 to 115.44 kPa [22]. In the literature [41], in grade III surrounding rock under the action of a 30 t axle-load train, the measured vertical stress was 162.13 kPa. The amplitude of the minimum principal stress of P3b was 242.6 kPa and the vertical dynamic stress was 193.60 kPa in this paper.

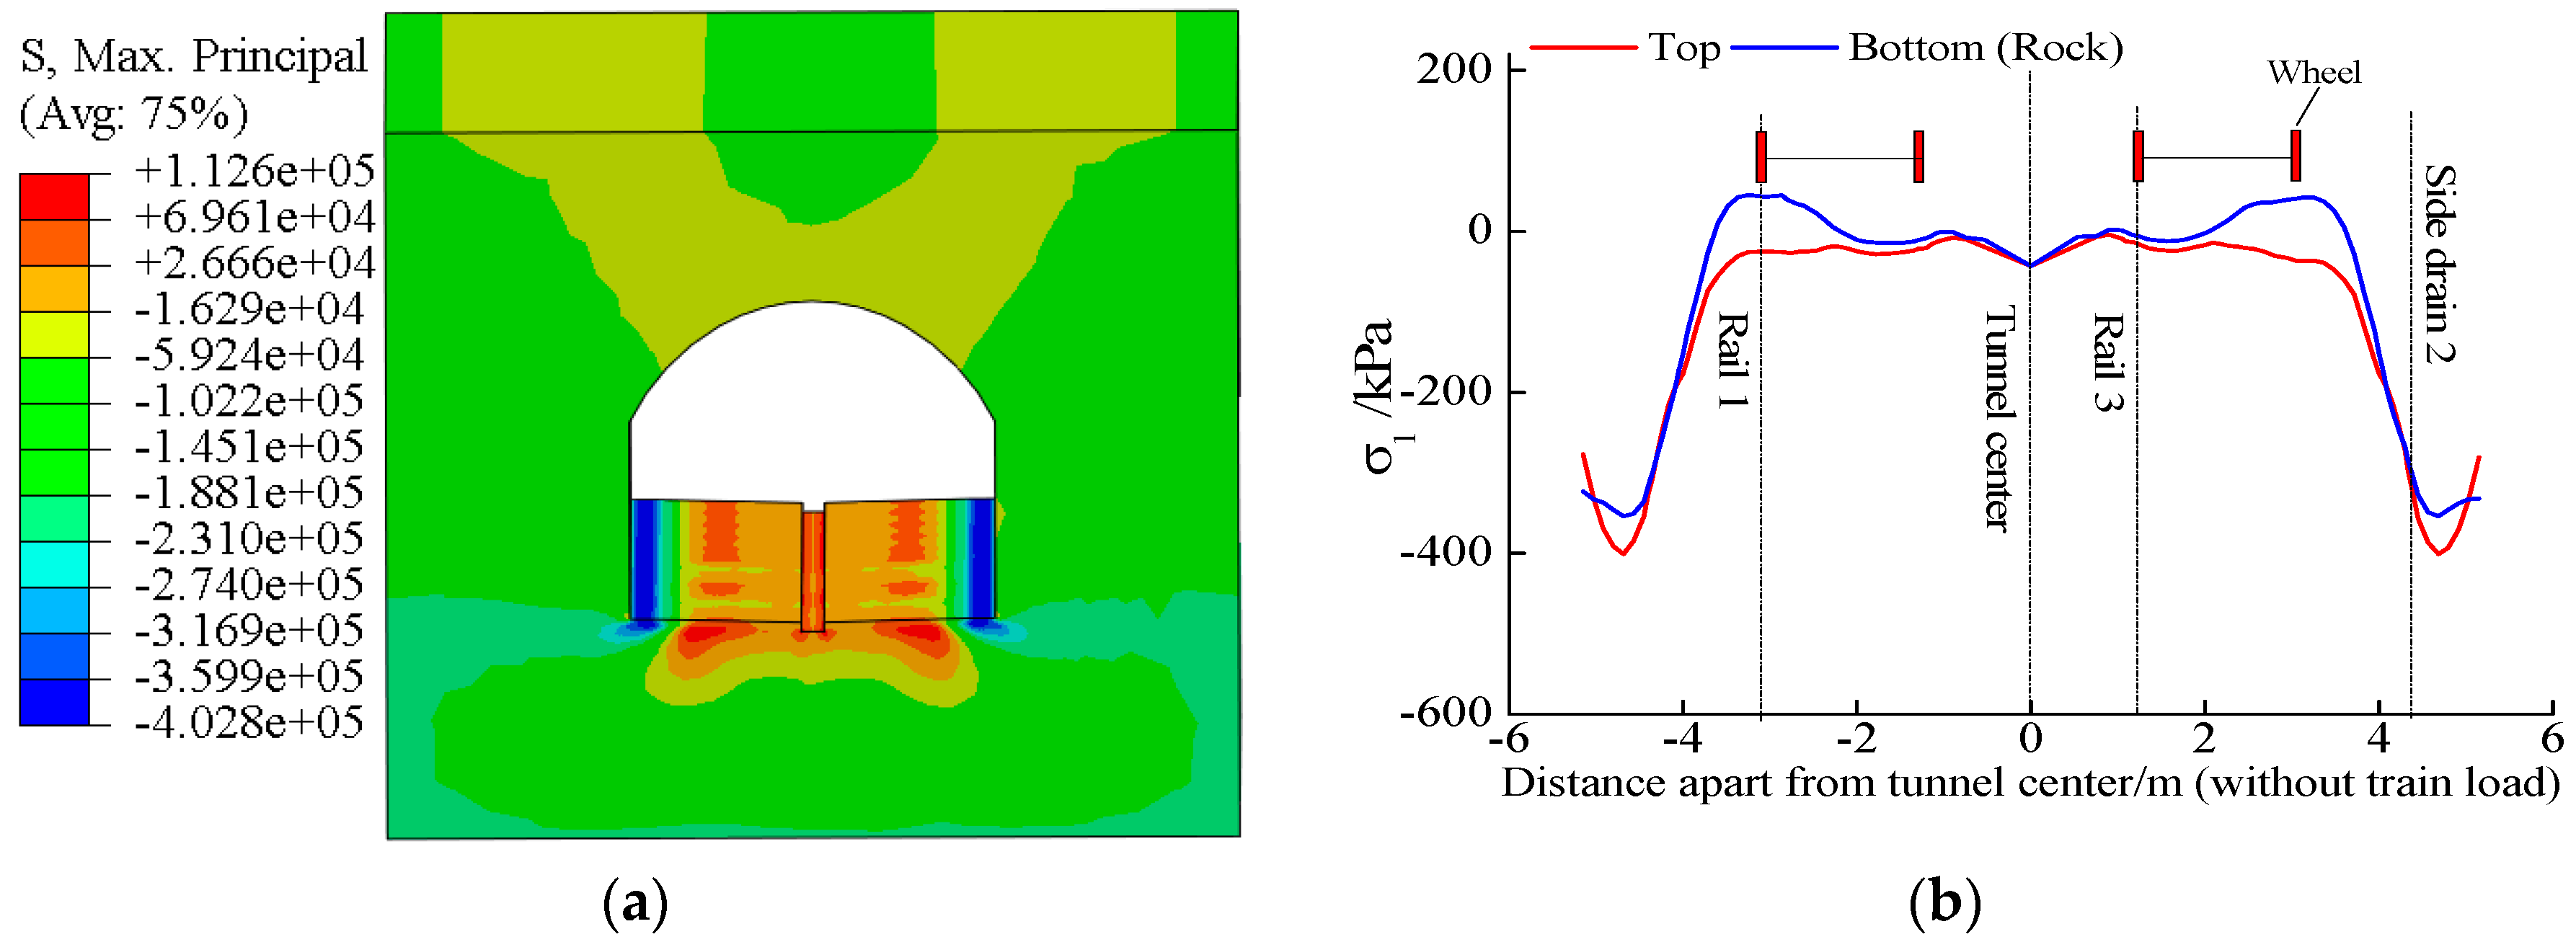
4.3. Maximum Principal Stress of Base Rock

Under the action of the surrounding rock pressure and train−load coupling, the maximum value of the principal stress was located below rail 1 and rail 4, as shown in Figure 19a. The maximum principal stress distribution on the feature lines is presented in Figure 19b, where the maximum value was 45.3 kPa.
Under the action of the 30 t axle−load train and surrounding rock pressure coupling, the maximum amplitude position of the dynamic response was consistent with that under the action of an individual train load, as the maximum principal stress amplitude of the base rock was 43.0 kPa.
The influence of the train axle load on the base rock’s maximum principal stress is shown in Figure 20. Under a different axle load, the initial value of the maximum principal stress remained unchanged. When the axle load increased by 1 t, the dynamic amplitude of the base rock’s maximum principal stress increased by about 1.33 kPa.

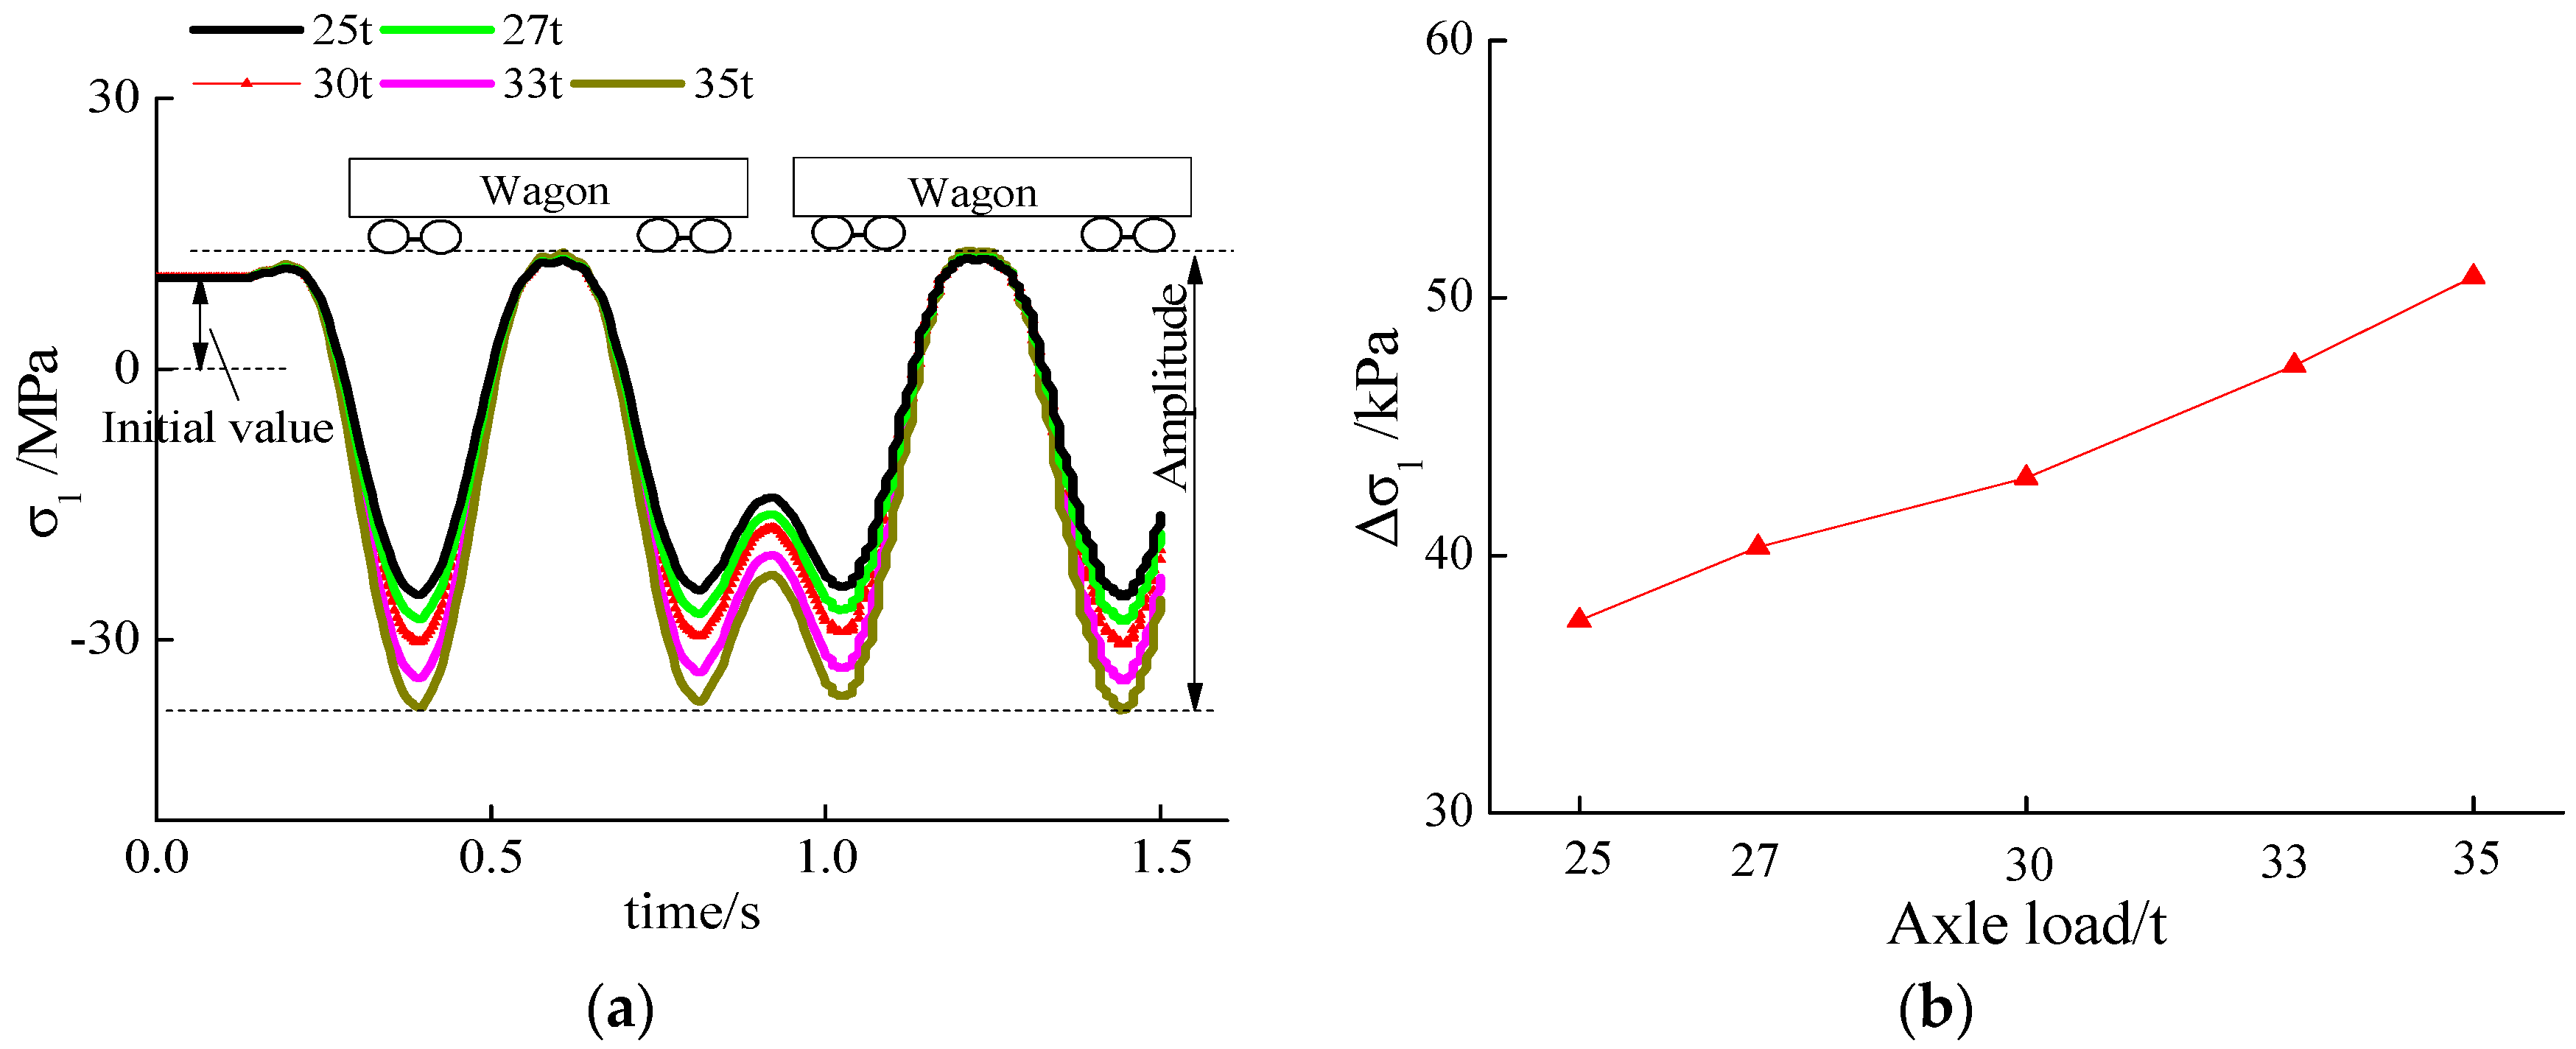
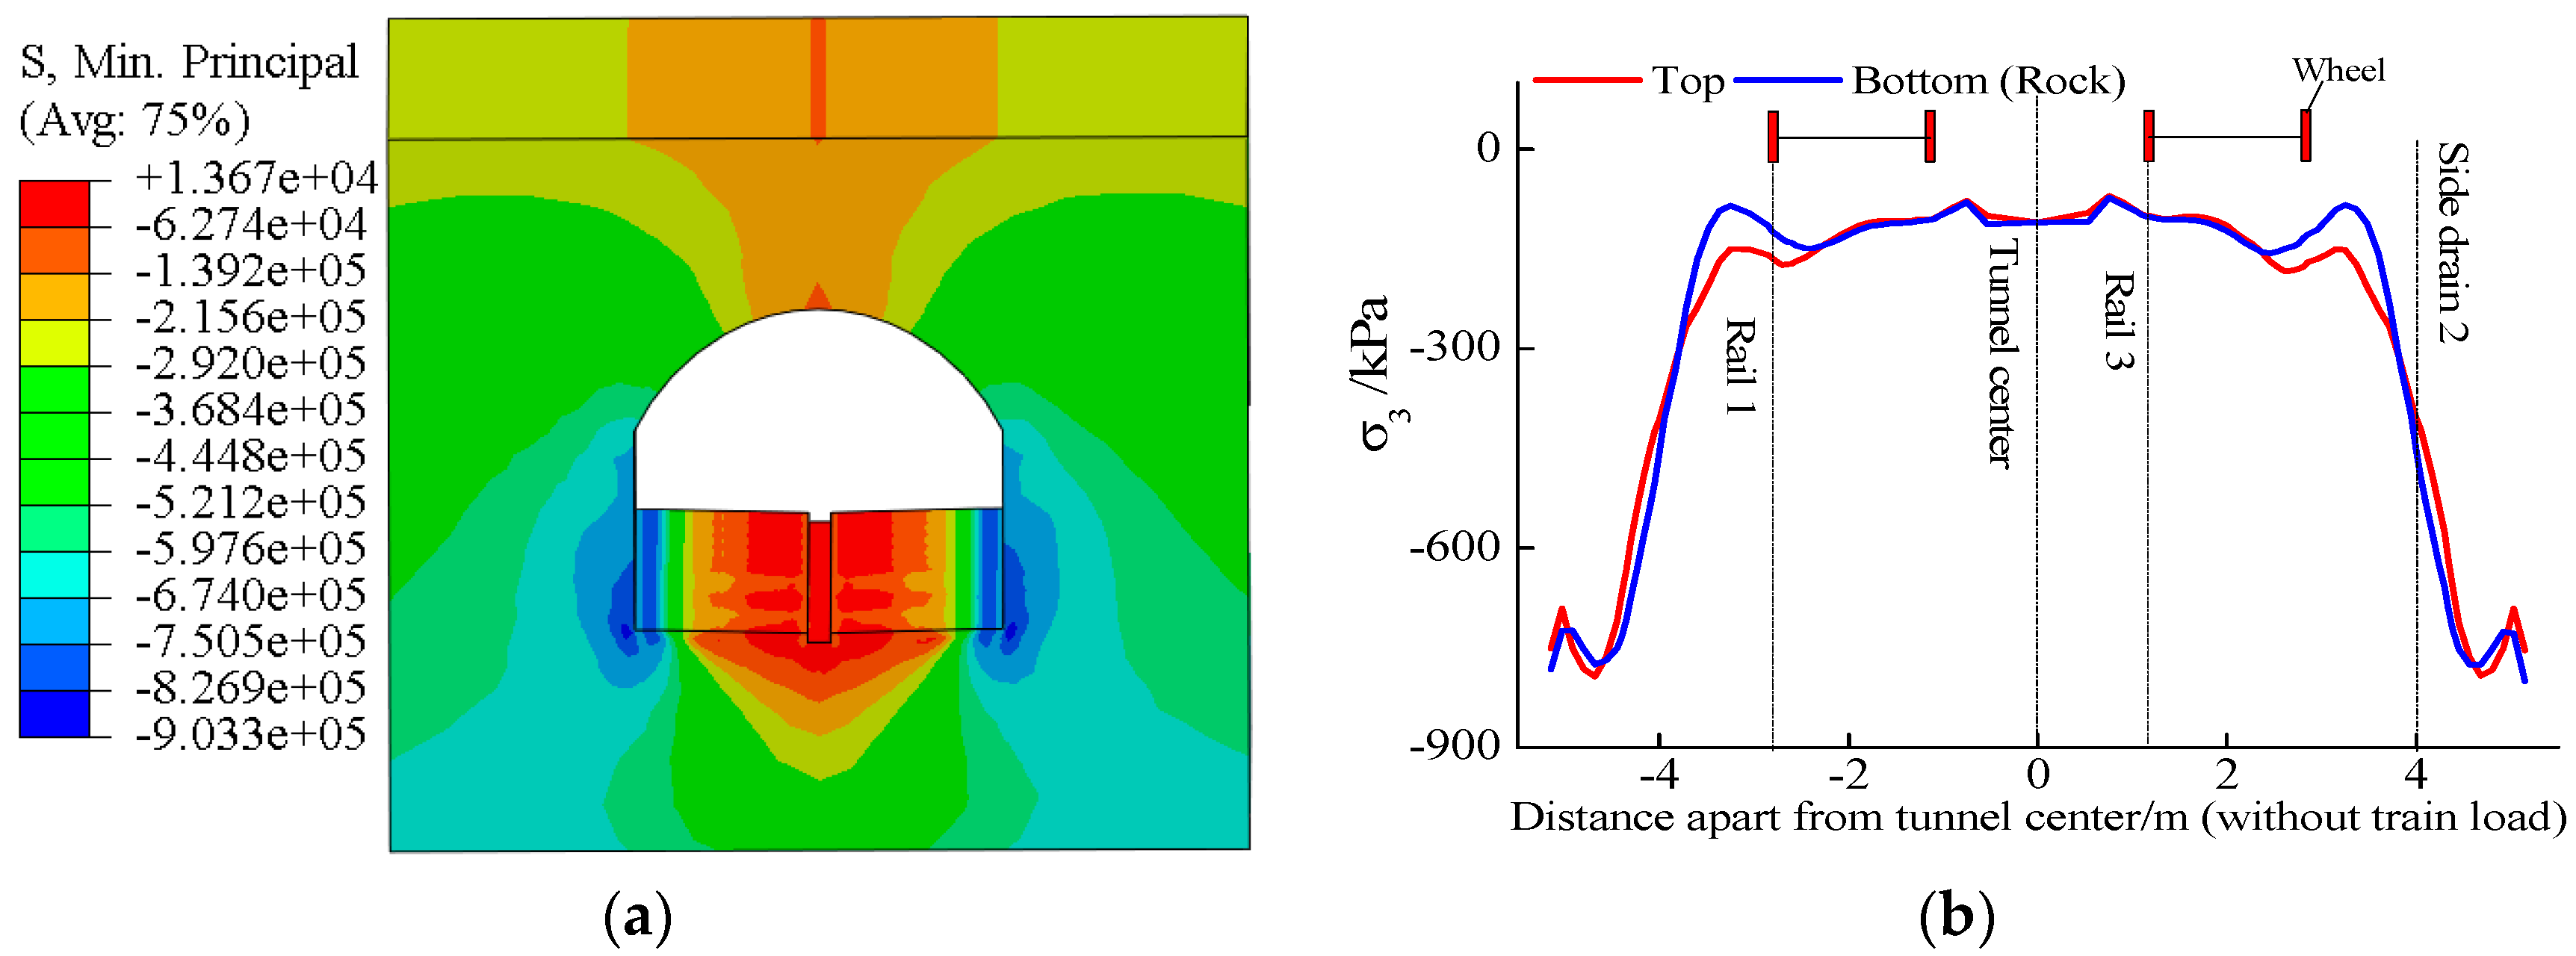
4.4. Minimum Principal Stress of Base Rock

Under the action of the surrounding rock pressure and train-load coupling, the minimum value of principal stress was located at the side wall, as shown in Figure 21a. The minimum principal stress distribution on the feature lines is presented in Figure 21b, where the minimum value was −801.0 kPa.
Under the action of the 30 t axle-load train and surrounding rock pressure coupling, the minimum principal stress amplitude of the base rock was 115.9 kPa.
Under the action of different axle loads, the time–history curve of the minimum principal stress at point R3t is shown in Figure 22. The initial value of the minimum principal stress remained unchanged under a different axle load. When the axle load increased by 1 t, the dynamic amplitude of the minimum principal stress increased by about 3.61 kPa.

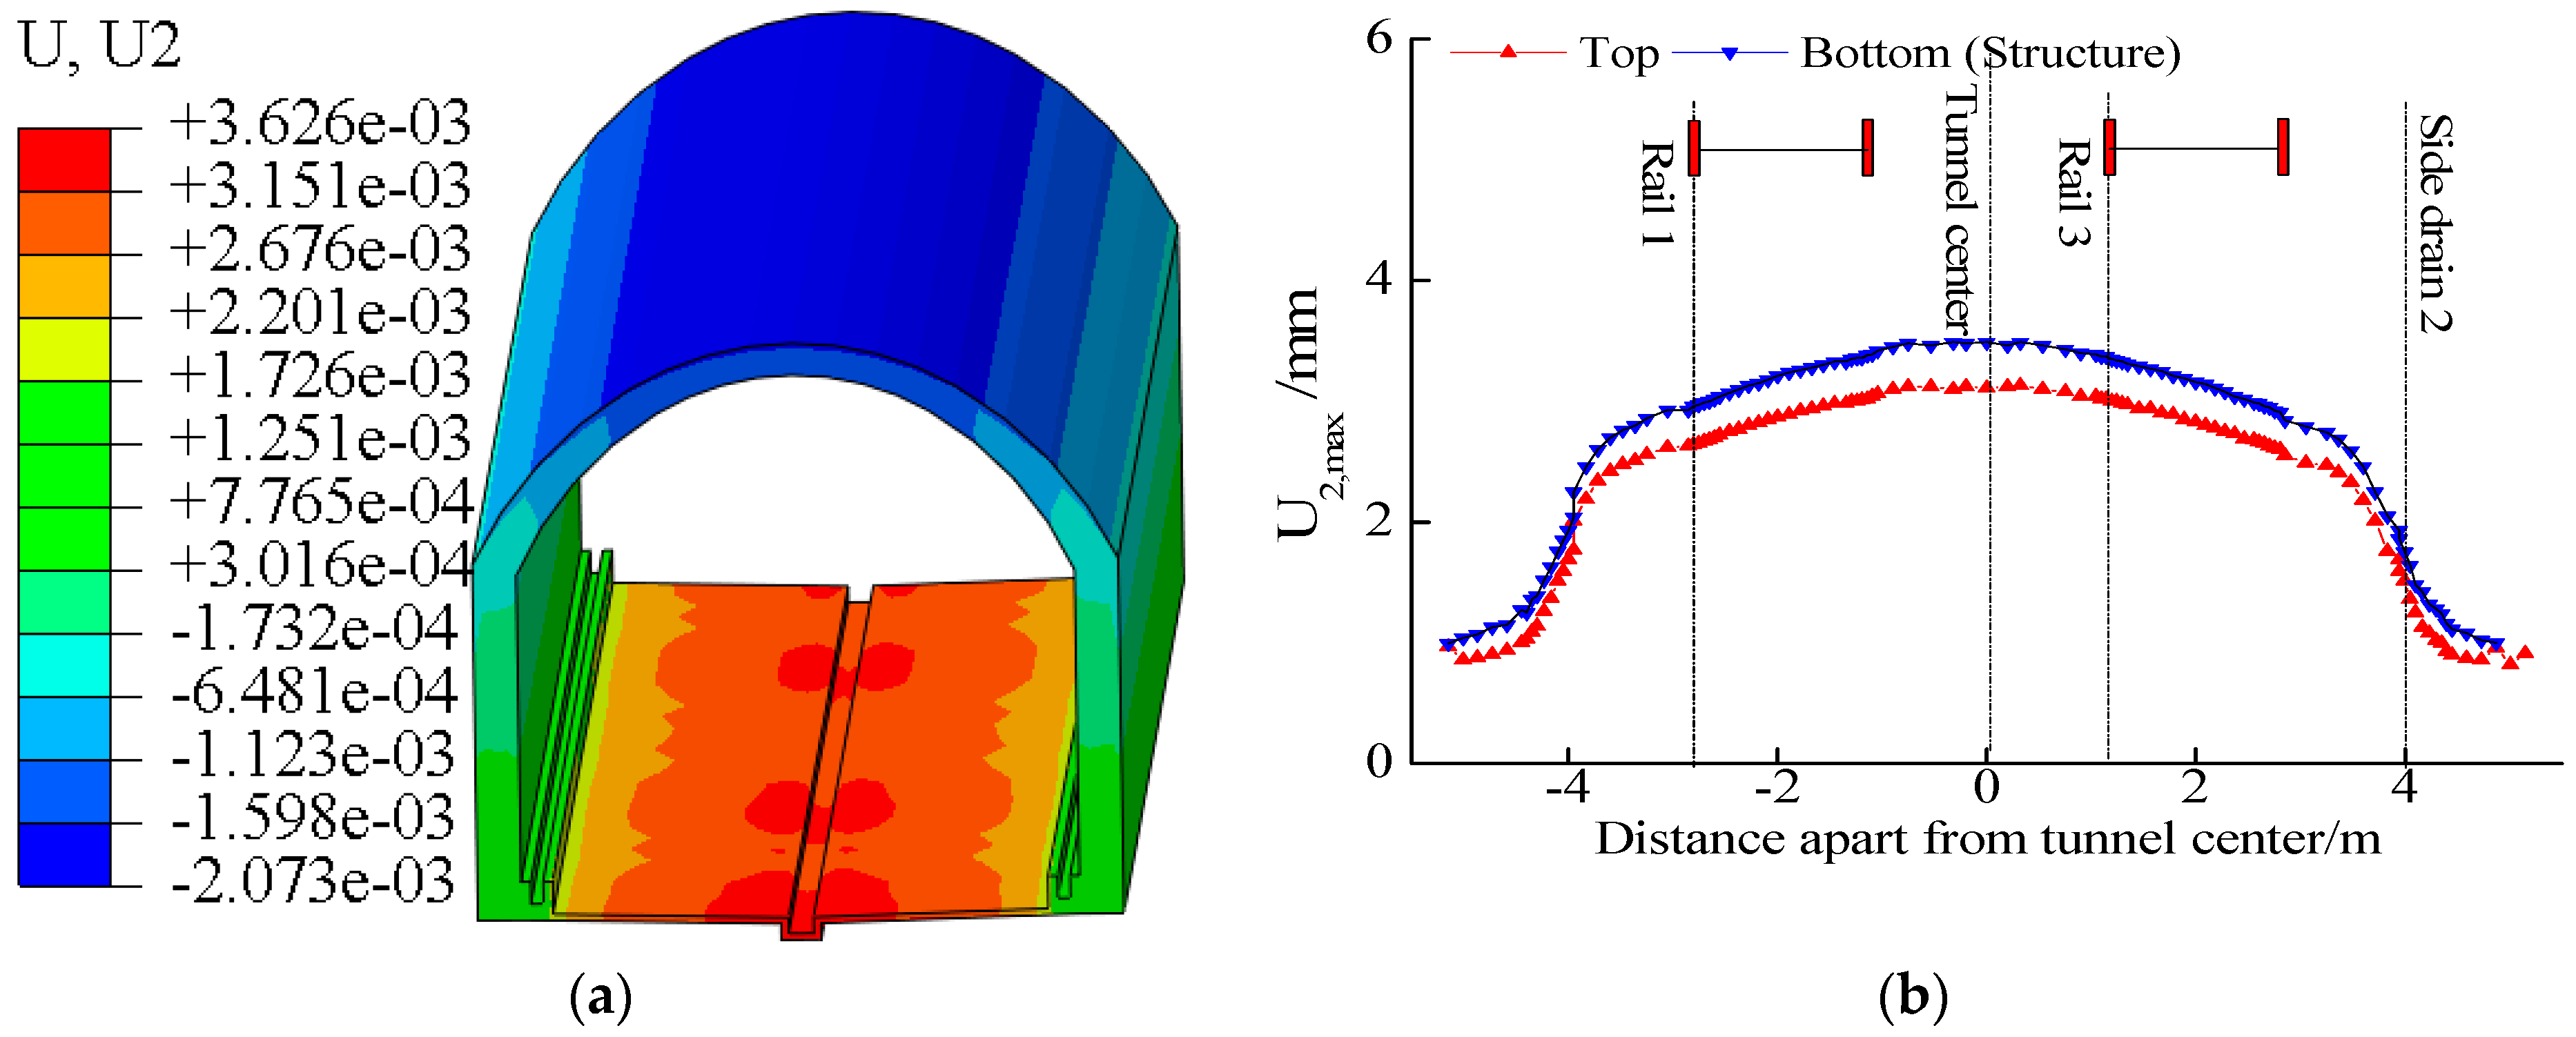
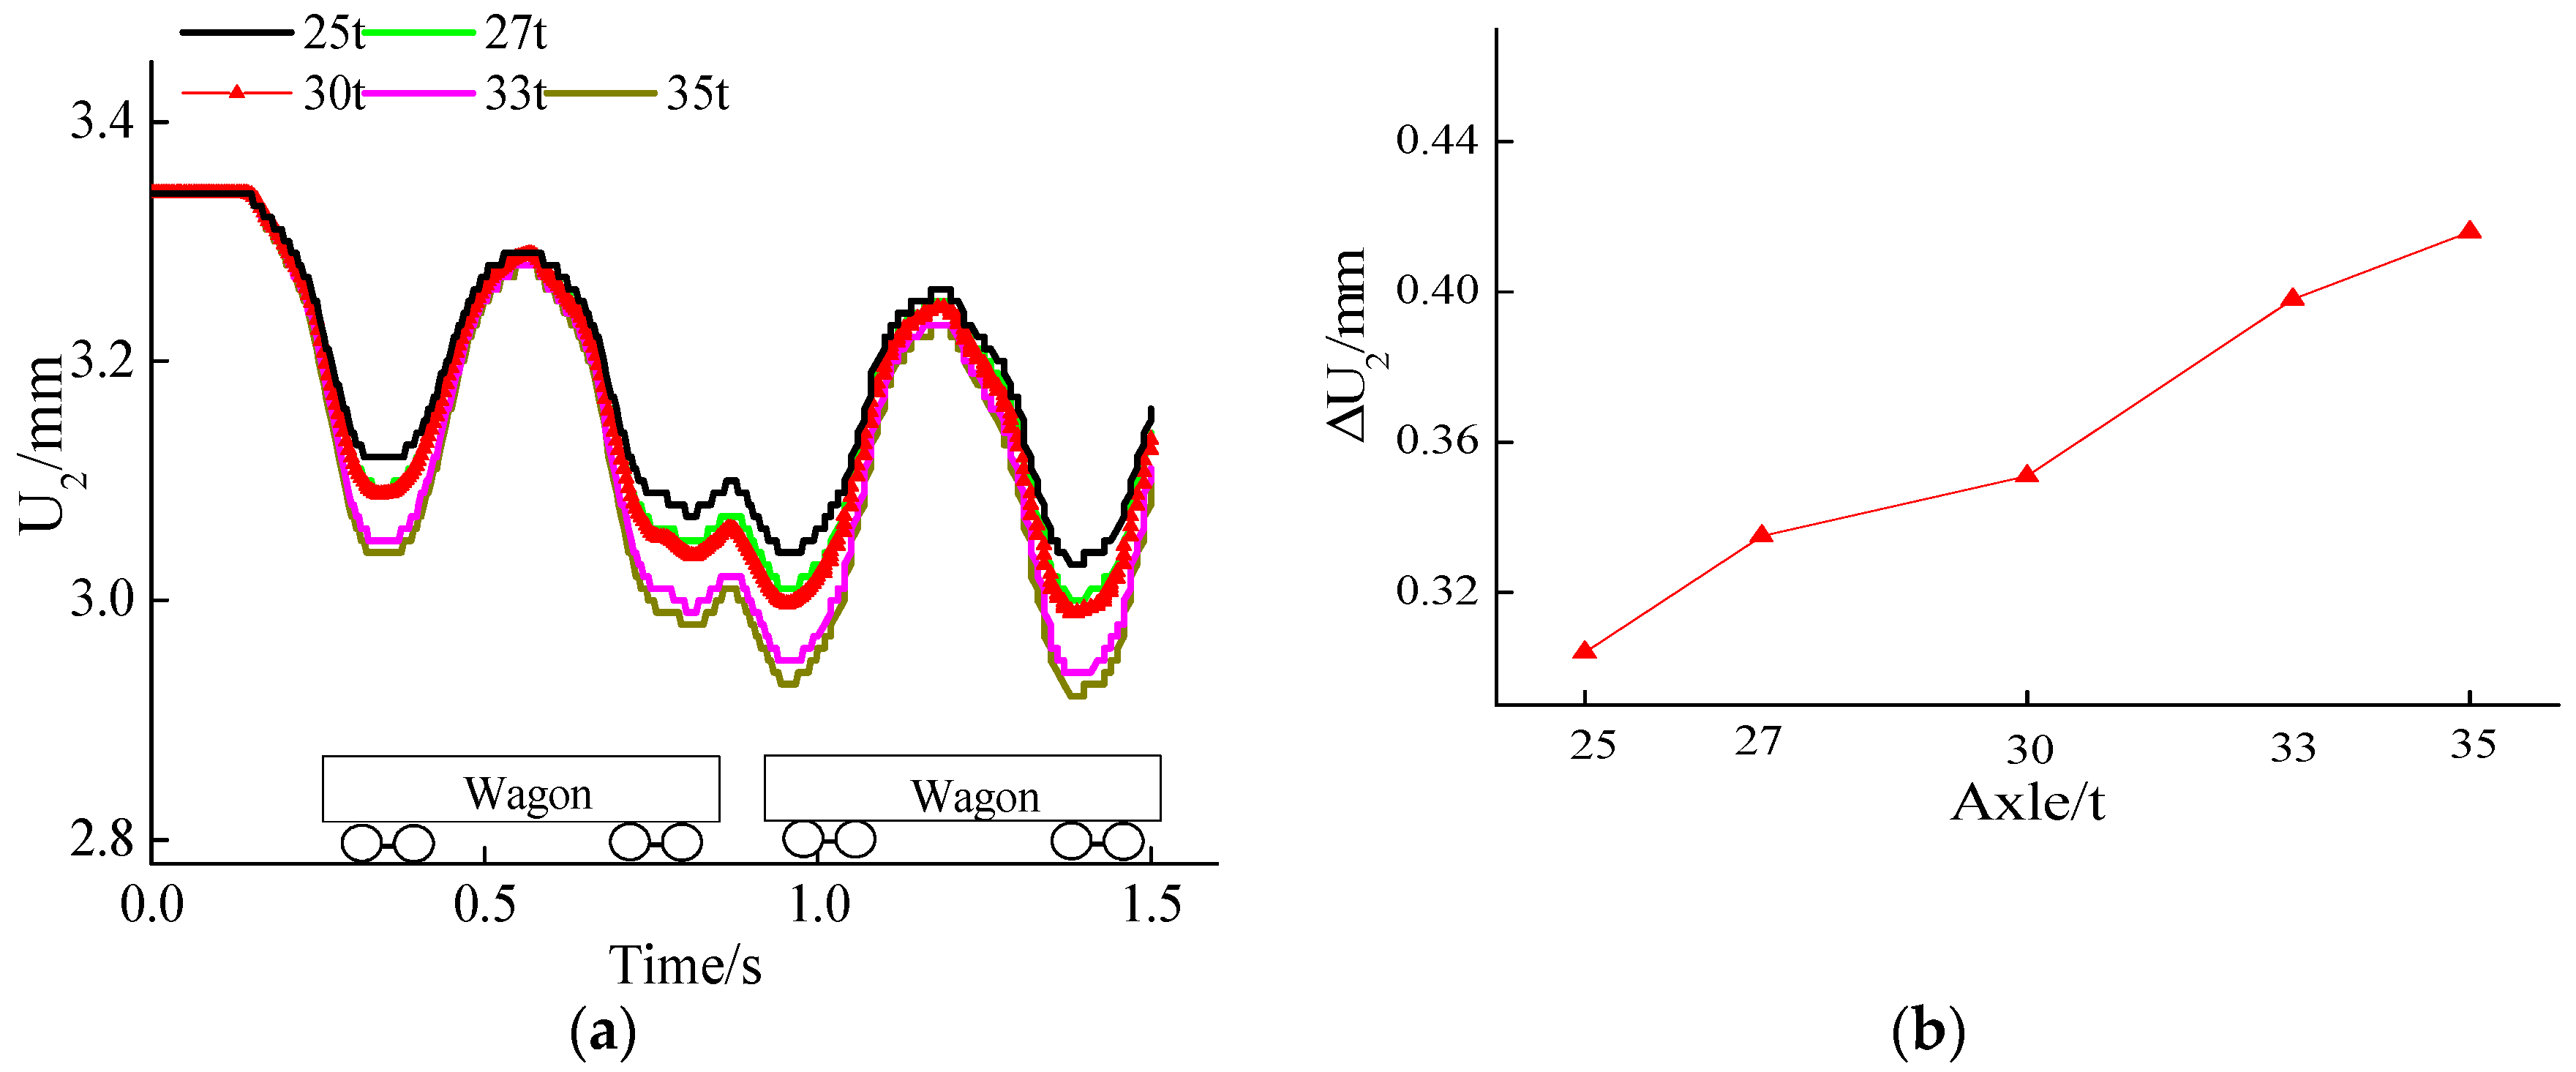
4.5. Vertical Displacement

At the interface, the vertical–displacement distribution characteristics of the tunnel and rock were similar; thus, the vertical displacement of the tunnel bottom structure was selected for analysis, which can be used as a reference for the displacement of base rock.
Under the action of the surrounding rock pressure and train-load coupling, the maximum vertical displacement was located at the center of the tunnel, as shown in Figure 23a. The vertical-displacement distribution on the feature lines is presented in Figure 23b, where the maximum value was 3.49 mm.
Under the action of the 30 t axle–load train and surrounding rock pressure coupling, the maximum vertical displacement amplitude of the tunnel bottom was 0.35 mm.
Under the action of different axle loads, the time–history curve of the vertical displacement at point R3t is shown in Figure 24. The initial value of the vertical displacement remained unchanged under a different axle load. When the axle load increased by 1 t, the dynamic amplitude of the maximum vertical displacement increased by about 0.0112 mm.

5. Discussion

In the research on the dynamic response of railway tunnels, the research mainly focuses on the tunnel bottom structure in poor surrounding rock, whereas the dynamic response analysis of rock mass at the bottom of the tunnel is very limited.
Compared to the literature [27,31,35,49], the numerical results suggested that the dynamic response of a hard-rock tunnel is obviously greater than that of a soft-rock tunnel, as the static stress caused by the surrounding rock pressure in hard rock is significantly smaller than that in the soft-rock tunnel.
This paper mainly studied the dynamic response of the hard-rock tunnel bottom structure and basement rock. The dynamic-response distribution characteristics and time-history characteristics of the bottom structure and surrounding rock were obtained, and the coupling effects of the surrounding rock and train dynamic load and axle load were considered. When considering the rock pressure and train-load coupling, the dynamic responses of the tunnel bottom structure and base rock were all greater than that without considering the rock pressure. The maximum principal stress amplitudes of the tunnel structure and base rock increased by 28.4% and 56.4%, respectively. It is suggested that the rock pressure is not negligible in the dynamic analysis of a railway tunnel [50,51,52,53].
Furthermore, it is important to consider that the hard-rock tunnel structure is much thinner and vulnerable compared to the soft-rock tunnel structure; thus, in hard-rock tunnels, the probability of basement diseases under the rail may be higher than that in soft-rock tunnels. The research results can provide a useful reference for the research on the mechanism and prevention of basement diseases in hard-rock tunnels.
Through numerical simulation, this paper studied the dynamic response characteristics of the tunnel under a heavy-haul train load. There are still some deficiencies that need further investigation.
  • The elastic–plastic damage model of the surrounding rock and concrete structure can be introduced into a later numerical analysis to study.
  • The infinite element boundary can be used to completely eliminate the boundary effect.
  • Defects and irregularities on the rail surface should be considered in a further study.
  • Combined with the numerical simulation results, the progressive damage of the tunnel bottom structure and surrounding rock should be further studied through a fatigue test.

6. Conclusions

In this study, to examine the coupling effect of the static rock pressure and dynamic heavy-haul train load, a train–tunnel–surrounding rock numerical model was established. Then, the dynamic distribution and axle-load influence of the hard-rock tunnel were obtained. We drew the following conclusions:
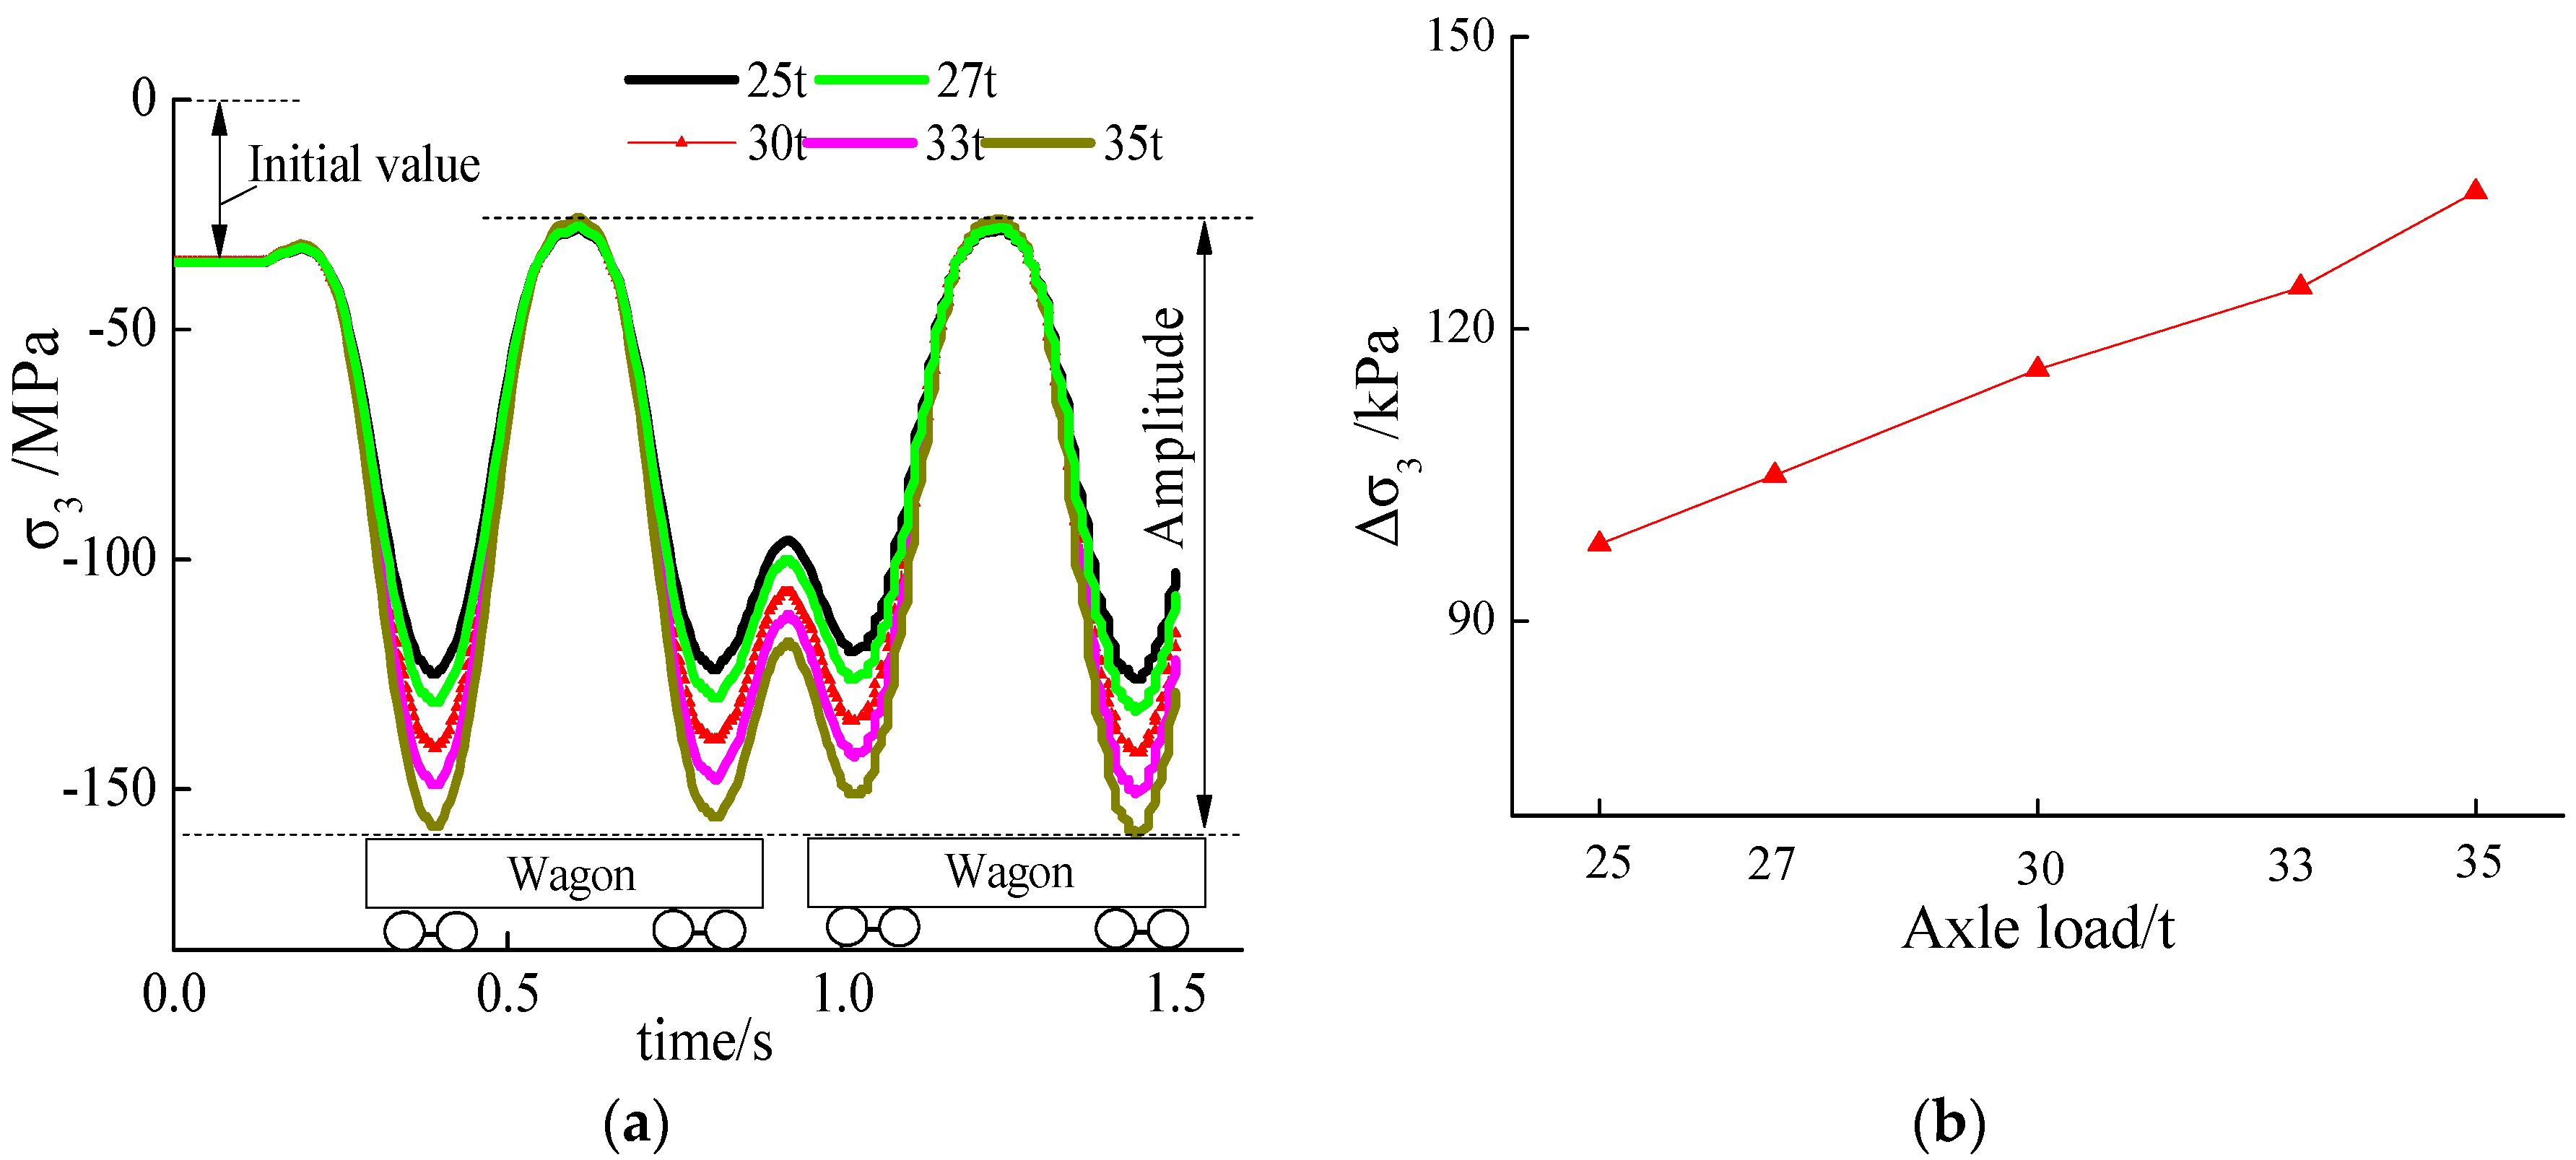
  • Like soft-rock tunnels, the bottom structure below the rail and side drain are the two main vulnerable positions of the hard-rock tunnel. The maximum principal stress caused by the static rock pressure was 1.27 MPa, which emerged in the lower part of the side drain. The maximum principal stress amplitude caused by the dynamic train load was 129.3 kPa, which emerged right below the rail.
  • Under the 30 t train load and surrounding rock pressure coupling, the maximum principal stress amplitudes of the tunnel structure and base rock were 129.3 kPa and43.0 kPa, respectively, which were obviously greater than that of soft rock [27,31,36,49].
  • In hard-rock tunnels, the probability of basement disease under the rail may be higher than that in soft-rock tunnels due to its greater dynamic response and thinner structure as compared to a soft-rock tunnel.
  • When the axle load increased by 1 t, the dynamic amplitude of the structure’s maximum and minimum principal stresses increased by about 4.14 kPa and 7.50 kPa, and the base rock’s maximum and minimum principal stresses increased by about 1.33 kPa and 3.61 kPa.
  • When considering the rock pressure, the dynamic response of the tunnel bottom structure and base rock were all greater than that without considering the rock pressure. The maximum principal stress amplitudes of the tunnel structure and base rock increased by 28.4% and 56.4%, respectively.

Author Contributions

Conceptualization, C.L.; methodology, C.L.; formal analysis, C.L. and Q.T.; writing—original draft preparation, C.L.; writing—review and editing, C.L., Q.T., B.W., Q.W., and Y.Y.; supervision, B.W.; funding acquisition, Q.T. and B.W. All authors have read and agreed to the published version of the manuscript.

Funding

This research was funded by the Science and Technology Research Project of Jiangxi Provincial Department of Education (GJJ204611), Science and Technology Project of Jiangxi Transportation Department (2022H0031), National Science of China (52168055), Natural Science Foundation of Jiangxi Province (20212ACB204001) and “Double Thousand Plan” Innovation Leading Talent Project of Jiangxi Province (jxsq2020101001), Startup funding for doctoral research of East China University of Technology (DHBK2021010).

Institutional Review Board Statement

Not applicable.

Informed Consent Statement

Not applicable.

Data Availability Statement

Data is contained within the article.

Conflicts of Interest

The authors declare no conflict of interest.

References

  1. Tian, B. Operation and development of railway heavy haul transport technology in the world. Roll. Stock 2015, 12, 10–19. [Google Scholar]
  2. Hu, Y. Current status and development trend of technology system for railway heavy haul transport in China. Chin. Railw. Sci. 2015, 36, 1–10. (In Chinese) [Google Scholar]
  3. Tian, Y. The Base Treatment Process with Grouting Resin in Datong-Qinhuangdao Railway Tunnels. In Paper Collection of Heavy Haul Railway Transportation Technical Exchange; China Railway Society: Beijing, China, 2014; pp. 363–367. (In Chinese) [Google Scholar]
  4. Yin, C.; Fu, B.; Ma, W. Analysis on dynamic stress of tunnel structure under heavy haul train. China Railw. Sci. 2013, 34, 47–52. [Google Scholar]
  5. Li, Z.; Chen, K.; Li, Z.; Huang, W.; Wang, X. Deterioration and cavity of surrounding rocks at the bottom of tunnel under the combined action of heavy-haul load and groundwater: An experimental study. Front. Earth. Sci. 2021, 9, 779578. [Google Scholar] [CrossRef]
  6. Niu, Y. The Heavy Haul Railway Tunnel Diseases Mechanism and Remediation Technology Research. Master’s Thesis, China Academy of Railway Sciences, Beijing, China, 2013. (In Chinese). [Google Scholar]
  7. Lazorenko, G.; Kasprzhitskii, A.; Khakiev, Z.; Yavna, V. Dynamic behavior and stability of soil foundation in heavy haul railway tracks: A review. Constr. Build. Mater. 2019, 205, 111–136. [Google Scholar] [CrossRef]
  8. Cai, X.; Zhong, Y.; Hao, X.; Zhang, Y.; Cui, R.X. Dynamic behavior of a polyurethane foam solidified ballasted track in a heavy haul railway tunnel. Adv. Struct. Eng. 2019, 22, 751–764. [Google Scholar] [CrossRef]
  9. Liu, C.; Wu, B.; Li, R.; Wang, F.; Tang, Q. Fatigue test on heavy haul railway tunnel bottom structure with base cavity. Front. Earth. Sci. 2022, 10, 870710. [Google Scholar] [CrossRef]
  10. Bickel, J.; Kuesel, T.; King, E. Tunnel Engineering Handbook; Springer US: New York, NY, USA, 1996. [Google Scholar]
  11. Peng, L.; Shi, C. Tunnel Engineering; Central South University Press: Changsha, China, 2017. [Google Scholar]
  12. Feng, J.; Qiu, W.; Wang, Y.; Wang, H. Study of defect distribution regularity in existing tunnels and the classification of tunnel environments. Mod. Tunn. Technol. 2013, 50, 35–41. [Google Scholar]
  13. Shi, P.; Li, P. Mechanism of soft ground tunnel defect generation and functional degradation. Tunn. Undergr. Space Technol. 2015, 50, 334–344. [Google Scholar] [CrossRef] [Green Version]
  14. Zheng, B.; Zhang, J.; Xue, J.; Ji, H. Technology Research of Disease Treatment about Solid Track Bed and Foundation Base of Enriched Water Tunnel. J. Railw. Eng. Soc. 2015, 32, 110–114. [Google Scholar]
  15. Bao, X.; Xia, Z.; Ye, G.; Fu, Y.; Su, D. Numerical analysis on the seismic behavior of a large metro subway tunnel in liquefiable ground. Tunn. Undergr. Space Technol. 2017, 66, 91–106. [Google Scholar] [CrossRef]
  16. Hamrouni, A.; Sbartai, B.; Dias, D. Ultimate dynamic bearing capacity of shallow strip foundations—Reliability analysis using the response surface methodology. Soil Dyn. Earthq. Eng. 2021, 144, 106690. [Google Scholar] [CrossRef]
  17. Maleska, T.; Beben, D.; Nowacka, J. Seismic vulnerability of a soil-steel composite tunnel—Norway Tolpinrud Railway Tunnel Case Study. Tunn. Undergr. Space Technol. 2021, 110, 103808. [Google Scholar] [CrossRef]
  18. Chai, J. Research on dynamic response characteristics for basement structure of heavy haul railway tunnel with defects. Mathematics 2021, 9, 2893. [Google Scholar] [CrossRef]
  19. Wang, A.; Shi, C.; Zhao, C.; Deng, E.; Yang, W.; He, H. Response Characteristics of Cross Tunnel Lining under Dynamic Train Load. Appl. Sci. 2020, 10, 4406. [Google Scholar] [CrossRef]
  20. Edirisinghe, T.; Talbot, J. A parametric study of the train-induced vibration of a single pile near an underground railway tunnel. Soil Dyn. Earthq. Eng. 2022, 158, 107274. [Google Scholar] [CrossRef]
  21. Maleska, T.; Nowacka, J.; Beben, D. Application of EPS Geofoam to a Soil–Steel Bridge to Reduce Seismic Excitations. Geosciences 2019, 9, 9400448. [Google Scholar] [CrossRef] [Green Version]
  22. Mahgoub, A.; El Naggar, H. Seismic design of metal arch culverts: Design codes vs. full dynamic analysis. J. Earthq. Eng. 2019, 25, 2231–2268. [Google Scholar] [CrossRef]
  23. Osama, A.; El Naggar, H.; Newson, T. Seismic soil-culvert interaction. Can. Geotech. J. 2015, 52, 1649–1667. [Google Scholar]
  24. Do, N.A.; Dias, D.; Oreste, P.; Djeran-Maigre, I. Behaviour of segmental tunnel linings under seismic loads studied with the hyperstatic reaction method. Soil Dyn. Earthq. Eng. 2015, 79, 108–117. [Google Scholar] [CrossRef]
  25. Peng, L.; Qin, C.; Shi, C.; Huang, L. Field test study on the disease treatment of foundation base in railway tunnel. China Railw. Sci. 2005, 2, 42–46. [Google Scholar]
  26. Ma, W.; Chai, J.; Zhu, Z.; Han, Z.; Ma, C.; Li, Y.; Zhu, Z.; Liu, Z.; Niu, Y.; Ma, Z.; et al. Research on Vibration Law of Railway Tunnel Substructure under Different Axle Loads and Health Conditions. Shock Vib. 2021, 2021, 9954098. [Google Scholar] [CrossRef]
  27. Li, Z.; Wang, M.; Yu, L.; Zhao, Y. Study of the basement structure load under the dynamic loading of heavy-haul railway tunnel. Int. J. Pavement Eng. 2018, 21, 1362–1373. [Google Scholar] [CrossRef]
  28. Li, Z.; Li, Z.; Cai, R.; Hua, Y.; Wang, L.; Gu, D. Refined model analysis of basement rock degradation mechanism of heavy-haul railway tunnel. Undergr. Space 2020, 6, 342–352. [Google Scholar] [CrossRef]
  29. Kim, N.; Park, D.; Jung, H.; Kim, M. Deformation characteristics of tunnel bottom after construction under geological conditions of long-term deformation. Geomech. Eng. 2020, 21, 171–178. [Google Scholar]
  30. Liu, N.; Peng, L.; Shi, C.; Lei, M. Experimental and model study on dynamic behaviour and fatigue damage of tunnel invert. Constr. Build. Mater. 2016, 126, 777–784. [Google Scholar] [CrossRef]
  31. Liu, C.; Peng, L.; Lei, M.; Shi, C.; Liu, N. Fatigue Performance of Tunnel Invert in Newly Designed Heavy Haul Railway Tunnel. Appl. Sci. 2019, 9, 5514. [Google Scholar] [CrossRef] [Green Version]
  32. Liu, C.; Lei, M.-F.; Peng, L.-M.; Shi, C.-H. Cavity influence on fatigue performance of heavy haul railway Tunnel’s bottom structure. Constr. Build. Mater. 2020, 251, 118886. [Google Scholar] [CrossRef]
  33. Xue, J. Analysis of the influence of tunnel bottom compactness on structure stress and strengthening measures under 30 t axle load train. China Railw. Sci. 2015, 36, 90–95. (In Chinese) [Google Scholar]
  34. Zhang, Z.; Zeng, B.; Dai, C.; He, W. Study on Structural Service Performance of Heavy-Haul Railway Tunnel with Voided Base. Adv. Civ. Eng. 2018, 2018, 3510979. [Google Scholar] [CrossRef]
  35. Dong, J.; Zhong, S.; Wang, H.; Wu, Z.H. Dynamic Response Characteristics of Crossing Tunnels under Heavy-Haul Train Loads. Geomech. Eng. 2020, 20, 103–112. [Google Scholar]
  36. Hernandez, Y.; Farfan, A.; De Assis, A. Three-dimensional analysis of excavation face stability of shallow tunnels. Tunn. Undergr. Space Technol. 2019, 92, 103062. [Google Scholar] [CrossRef]
  37. Chappell, B. Deformational response in discontinua. Int. J. Rock Mech. Sci. Geomech. 1979, 4, 377–390. [Google Scholar] [CrossRef]
  38. Yang, X.; Huang, F. Collapse mechanism of shallow tunnel based on nonlinear Hoek-Brown failure criterion. Tunn. Undergr. Space Technol. 2011, 26, 686–691. [Google Scholar] [CrossRef]
  39. Yang, X.; Wang, J. Ground movement prediction for tunnels using simplified procedure. Tunn. Undergr. Space Technol. 2011, 26, 462–471. [Google Scholar] [CrossRef]
  40. Anato, N.; Assogba, O.; Tang, A.; Youssouf, D. Numerical investigation of seismic isolation layer performance for tunnel lining in shanghai soft ground. Arab. J. Sci Eng. 2021, 46, 11355–11372. [Google Scholar] [CrossRef]
  41. Liu, C.; Peng, L.; Lei, M.; Li, Y. Research on crossing tunnels’ seismic response characteristics. KSCE. J. Civ. Eng. 2019, 23, 4910–4920. [Google Scholar] [CrossRef]
  42. Abate, G.; Massimino, M. Parametric analysis of the seismic response of coupled tunnel–soil–aboveground building systems by numerical modelling. Bull. Earthq. Eng. 2016, 15, 443–467. [Google Scholar] [CrossRef]
  43. Abate, G.; Grasso, S.; Massimino, M. The role of shear wave velocity and non-linearity of soil in the seismic response of a coupled tunnel-soil-above ground building system. Geosciences 2019, 9, 473. [Google Scholar] [CrossRef] [Green Version]
  44. Knothe, K.; Grassie, S. Modelling of railway track and vehicle/track interaction at high frequencies. Veh. Syst. Dyn. 1993, 22, 209–262. [Google Scholar] [CrossRef]
  45. Zhai, W.; Xia, H. Train-Track-Bridge of Train Track Bridge Dynamic Interaction: Theory and Engineering Application; Science Press: Beijing, China, 2011. [Google Scholar]
  46. Ghangale, D.; Arcos, R.; Clot, A.; Cayero, J.; Romeu, J. A methodology based on 2.5D FEM-BEM for the evaluation of the vibration energy flow radiated by underground railway infrastructures. Tunn. Undergr. Space Technol. 2020, 101, 103392. [Google Scholar] [CrossRef]
  47. TB 10003-2016; Code for Design of Railway Tunnel. China Railway Publishing House: Beijing, China, 2016. (In Chinese)
  48. Liu, C.; Peng, L.M.; Lei, M.F.; Shi, C.H. Adaptability and strengthening research of 30 t axle heavy haul railway tunnel in the new loess area. J. Railw. Sci. Eng. 2016, 13, 730–739. (In Chinese) [Google Scholar]
  49. Ma, W.B.; Chai, J.F.; Han, Z.L.; Ma, Z.G.; Guo, X.X.; Zou, W.H.; Li, T.F.; Niu, Y.B. Research on Design Parameters and Fatigue Life of Tunnel Bottom Structure of Single-Track Ballasted Heavy-Haul Railway Tunnel with 40-Ton Axle Load. Math. Probl. Eng. 2020, 2020, 3181480. [Google Scholar] [CrossRef]
  50. Faherty, R.; Acikgoz, S.; Wong, E.; Hewitt, P.; Viggiani, G. Tunnel-soil-structure interaction mechanisms in a metallic arch bridge. Tunn. Undergr. Space Technol. 2022, 123, 104429. [Google Scholar] [CrossRef]
  51. Yu, J.; Wang, Z. The dynamic interaction of the soil-tunnel-building system under seismic waves. Soil Dyn. Earthq. Eng. 2021, 144, 106686. [Google Scholar] [CrossRef]
  52. Hua, N.; Tessari, A.; Khorasani, N. The effect of geologic conditions on the fire behavior of tunnels considering soil-structure interaction. Tunn. Undergr. Space Technol. 2022, 122, 104380. [Google Scholar] [CrossRef]
  53. Wu, H.; Shen, S.; Yang, J.; Zhou, A. Soil-tunnel interaction modelling for shield tunnels considering shearing dislocation in longitudinal joints. Tunn. Undergr. Space Technol. 2018, 78, 168–177. [Google Scholar] [CrossRef]
Figure 1. Section structure of the heavy-haul railway tunnel in grade III surrounding rock (cm).
Applsci 12 05721 g001
Figure 2. Numerical model of train–track–tunnel coupling system: (a) model size; (b) boundary conditions; (c) structure of the model; and (d) mesh of numerical model.
Applsci 12 05721 g002
Figure 3. Parameters of 30 t axle-load train.
Applsci 12 05721 g003
Figure 4. Parameters of 30 t axle-load train. (a) Train composition; (b) Train mesh.
Applsci 12 05721 g004
Figure 5. Wheel–rail contact.
Applsci 12 05721 g005
Figure 6. Suspension and rail–sleeper contact.
Applsci 12 05721 g006
Figure 7. Layout of feature points and lines.
Applsci 12 05721 g007
Figure 8. Comparison between calculated value and measured value.
Applsci 12 05721 g008
Figure 9. Maximum principal stress contour: (a) tunnel bottom structures; (b) base rock.
Applsci 12 05721 g009
Figure 10. Maximum principal stress characteristics: (a) horizontal distribution; (b) time–history curve.
Applsci 12 05721 g010
Figure 11. Minimum principal stress contour: (a) tunnel bottom structures; (b) base rock.
Applsci 12 05721 g011
Figure 12. Minimum principal stress characteristics: (a) horizontal distribution; (b) time–history curve.
Applsci 12 05721 g012
Figure 13. Vertical displacement contour: (a) tunnel bottom structures; (b) base rock.
Applsci 12 05721 g013
Figure 14. Vertical displacement characteristics: (a) horizontal distribution; (b) time–history curve.
Applsci 12 05721 g014
Figure 15. Maximum principal stress characteristics: (a) contour; (b) horizontal distribution.
Applsci 12 05721 g015
Figure 16. Influence of train axle load on maximum principal stress: (a) time–history curve (P3b); (b) Δσ1-axle load.
Applsci 12 05721 g016
Figure 17. Maximum principal stress characteristics: (a) contour; (b) horizontal distribution.
Applsci 12 05721 g017
Figure 18. Influence of train axle load on minimum principal stress: (a) time–history curve of P3t; (b) Δσ1−axle load.
Applsci 12 05721 g018
Figure 19. Maximum principal stress characteristics: (a) contour; (b) horizontal distribution.
Applsci 12 05721 g019
Figure 20. Influence of train axle load on maximum principal stress: (a) time–history curve of R3t; (b) Δσ1−axle load.
Applsci 12 05721 g020
Figure 21. Minimum principal stress characteristics: (a) contour; (b) horizontal distribution.
Applsci 12 05721 g021
Figure 22. Influence of train axle load on minimum principal stress: (a) time–history curve; (b) Δσ3−axle load.
Applsci 12 05721 g022
Figure 23. Vertical displacement characteristics: (a) contour; (b) horizontal distribution.
Applsci 12 05721 g023
Figure 24. Influence of train axle load on vertical displacement: (a) time–history curve; (b) ΔU2-axle load.
Applsci 12 05721 g024
Table 1. Spring stiffness and damping parameters of the 30 t axle–load train.
PositionStiffness Coefficient (MN/m)Damping (kN·s/m)
kxkykzcz
Primary suspension6.010.035.05.0
Secondary suspension5.35.36.65.0
Rail–Sleeper30.0100.030.035.0
Table 2. Mechanical parameters.
MaterialDensity (ρ/kg/m3)Elastic Modulus
E (GPa)
Poisson Ratio μTensile Strength
ft (MPa)
Compressive Strength
fc (MPa)
Lining (C15)263.50.21.2710.0
Tunnel base (C10)243.150.21.026.70
Sleeper (C50)27.533.50.21.7816.7
Rail and train782100.3210210
MaterialDensity (ρ/kg/m3)Elastic Modulus
E (GPa)
Poisson Ratio μCohesion
c (kPa)
Internal Friction Angle
𝜑 (°)
Surrounding rock21.01.50.2920030
Ballast bed200.180.351518
Publisher’s Note: MDPI stays neutral with regard to jurisdictional claims in published maps and institutional affiliations.

