Article

Investigation of Wind-Loads Acting on Low-Aspect-Ratio Cylindrical Structures Based on a Wind Tunnel Test

1
School of Civil Engineering, Beijing Jiaotong University, Beijing 100044, China
2
Beijing’s Key Laboratory of Structural Wind Engineering and Urban Wind Environment, Beijing 100044, China
3
China Electric Power Research Institute, Beijing 100192, China
*
Author to whom correspondence should be addressed.
Appl. Sci. 2022, 12(12), 5891; https://doi.org/10.3390/app12125891
Submission received: 25 May 2022 / Revised: 2 June 2022 / Accepted: 6 June 2022 / Published: 9 June 2022
(This article belongs to the Section Civil Engineering)

Abstract

:
The low-aspect-ratio cylindrical structures represented by oil tanks is a kind of wind sensitive structure, which is prone to buckling under wind-loads. A wind tunnel test was conducted to investigate the properties of wind-loads acting on smooth cylinders with an aspect ratio AR = 0.323 and 0.875, respectively. Some parameters, such as Reynolds number (Re) and turbulence intensity, were taken into account. The results reveal that low-aspect-ratio cylinders have a Re effect, and the effect rises with AR. AR is the main factor affecting the value of the base pressure coefficient and positive pressure range, and the former increases with AR, while the latter decreases with AR. Moreover, due to the influence of the free end and turbulence, which may suppress vortex shedding, the power spectrum of the lift coefficient essentially shows broad spectral peaks with Re and turbulence. Increasing the incoming turbulence made the flow round cylinders at a higher Re state, that is, the supercritical regime is reached at a smaller Re. When turbulence is greater than 4.0%, turbulence and Re have little effect on the mean base force coefficient of low-aspect-ratio cylinders.

1. Introduction

The flow around a bluff body has attracted widespread attention due to its various engineering applications [1,2,3]. Initially, the investigation of flow characteristics began with a two-dimensional bluff body or an infinite cylinder. The seemingly simple model contains a variety of complex phenomena, including flow separation, vortex shedding, wake instability, etc., resulting in changes in the pressure coefficient, Strouhal number, and force coefficient. The research methods usually consist of general experimental study [4,5,6,7,8], numerical study [9,10,11,12,13,14], or 3D flow [15,16]. Among all bluff bodies, the circular cylinder is one of the most representative due to its unique flow characteristics, which are substantially influenced by Reynolds numbers (Re). In practical engineering, circular structures have a finite height, and are immersed in the boundary layers, such as chimney stacks, cooling towers, lamp posts, oil tanks, etc. These structures are generally free at one end, and fixed on the ground at the other. Therefore, many different mechanism vortices exist in the flow around a finite circular cylinder. The interaction of these vortices makes the flow three-dimensional, and changes the mechanism of wind-loads simultaneously [1].
Apart from the Re, aspect ratio AR = H/D (where H and D are the height and diameter of the cylinder, respectively) is also a key factor affecting the wind-load characteristics of a finite circular cylinder. The majority of previous research has focused on the analysis of finite cylinders with AR > 1 [17,18,19,20,21,22]. Sakamoto and Oiwake [23] conducted a wind tunnel test in the Re = 2.82 × 10⁴–1.69 × 10⁵ range with cylinder AR ranging from 1 to 6. As a result of the study, it was observed that the mean drag coefficient increases with AR, and the rate of increase remains fairly large for AR < 1.5, while the fluctuating drag and lift coefficient reaches their maximum value at AR ≈ 1.5, and then rapidly decreases with AR. Sumner et al. [24] also observed similar results in their experiments; for AR = 3, the mean drag coefficient is lower than that of AR = 5, 7 and 9, and the vortex shedding peaks are mostly absent or broad-banded along with the cylinder height. Among the results obtained, there is a critical aspect ratio ARcr, and when AR ≤ ARcr, the downwash from the tip extending to the ground plane may have a mechanism for the suppression of Kármán vortex shedding. In subsequent research, Beitel et al. [25] investigated the behavior of mean aerodynamic forces and vortex shedding in cylinders with AR ranging from 0.5 to 11, and proved that ARcr is related to boundary layer thickness, and also provided a more exact range of ARcr. Moreover, the research also confirmed and expanded upon the existence of a second change in behavior of wind-loading and vortex shedding at higher aspect ratios. As for numerical simulation studies, Afgan et al. [26] used LES (large-eddy simulation) to study the flow and force characteristics of cylinders with AR = 6 and 10 at Re = 2 × 10⁴. Regular vortex shedding was found in the wake of the higher AR cylinder, along with a strong downwash originating from the free end, while irregular and intermittent vortex shedding occurred in the lower AR cylinder. This phenomenon resulted in differences in the wind pressure, force, and St of the two cylinders. Palau-Salvador et al. [27] also used LES for cylinders with AR = 2.5 and 5 at Re = 4.3 × 10⁴ and 2.2 × 10⁴, respectively. By comparing results with experiments, detailed information of the complex flow near the free end and flow structure in the wake of two cylinders was described.
Considering finite circular cylinders with lower aspect ratio (AR ≤ 1), the flow and wind-load characteristics may be similar to those of ARARcr. Sabransky [28] and Portela [29,30] studied the wind pressure distribution and wind-induced buckling effect of low-aspect-ratio structures with conical roofs, and presented the influence of the aspect ratio, number of structures, and arrangement of structures on wind-loads. Tsutsui et al. [31,32,33] carried out wind tunnel investigations on low-aspect-ratio cylinders with AR = 0.125–1 in the Re = 1.1 × 10⁴–1.1 × 10⁵ range, elucidating the relationships between drag, lift, AR, and turbulent boundary layer thickness. Gonçalves et al. [34] studied low-aspect-ratio cylinders with AR = 0.1–2 at Re = 1 × 10⁴–5 × 10⁴ in a recirculating water channel. They found that the flow around low-aspect-ratio cylinders was dominated by free end effects, and CD and St decreased with the decrease of AR. Even without von Karman street on either side, the alternating forces were still created by the surrounding vortex when 0.2 ≤ AR ≤ 0.5, but no alternating forces were observed when AR ≤ 0.2. Cunningham [35] and Rinoshika [36] also conducted LES and experimental studies, respectively, to analyze the flow characteristics of low-aspect-ratio cylindrical structures with open-top chambers or horizontal holes.
Currently, the references about low-aspect-ratio cylinders are quite limited. The wind-load characteristics of low-aspect-ratio cylinders from sub-criticality to super-criticality are still not clear, especially concerning fluctuating features. Meanwhile, the effect of turbulence intensity on low-aspect-ratio cylinders also needs to be further studied.
In order to fill the gap of the above references, smooth low-aspect-ratio cylinders with AR = 0.323, 0.875 were taken as the research object. Wind-load characteristics of the cylinders were studied under various Re and four wind fields by conducting a wind tunnel test. The present paper describes the mean and fluctuating features of low-aspect-ratio cylinders in great detail, and the conclusions may provide references for general use in engineering fields. The paper is structured as follows: Section 2 provides a brief description of the experiment setup and test models, the experimental simulation method of wind fields, and the processing method of the experimental data. Section 3 provides a detailed comparison and discussion of the test results for two cylinders, including wind pressure coefficient, positive pressure range, local and base force coefficient, etc. In Section 4, the main conclusions based on the result of findings are presented.

2. Wind Tunnel Test

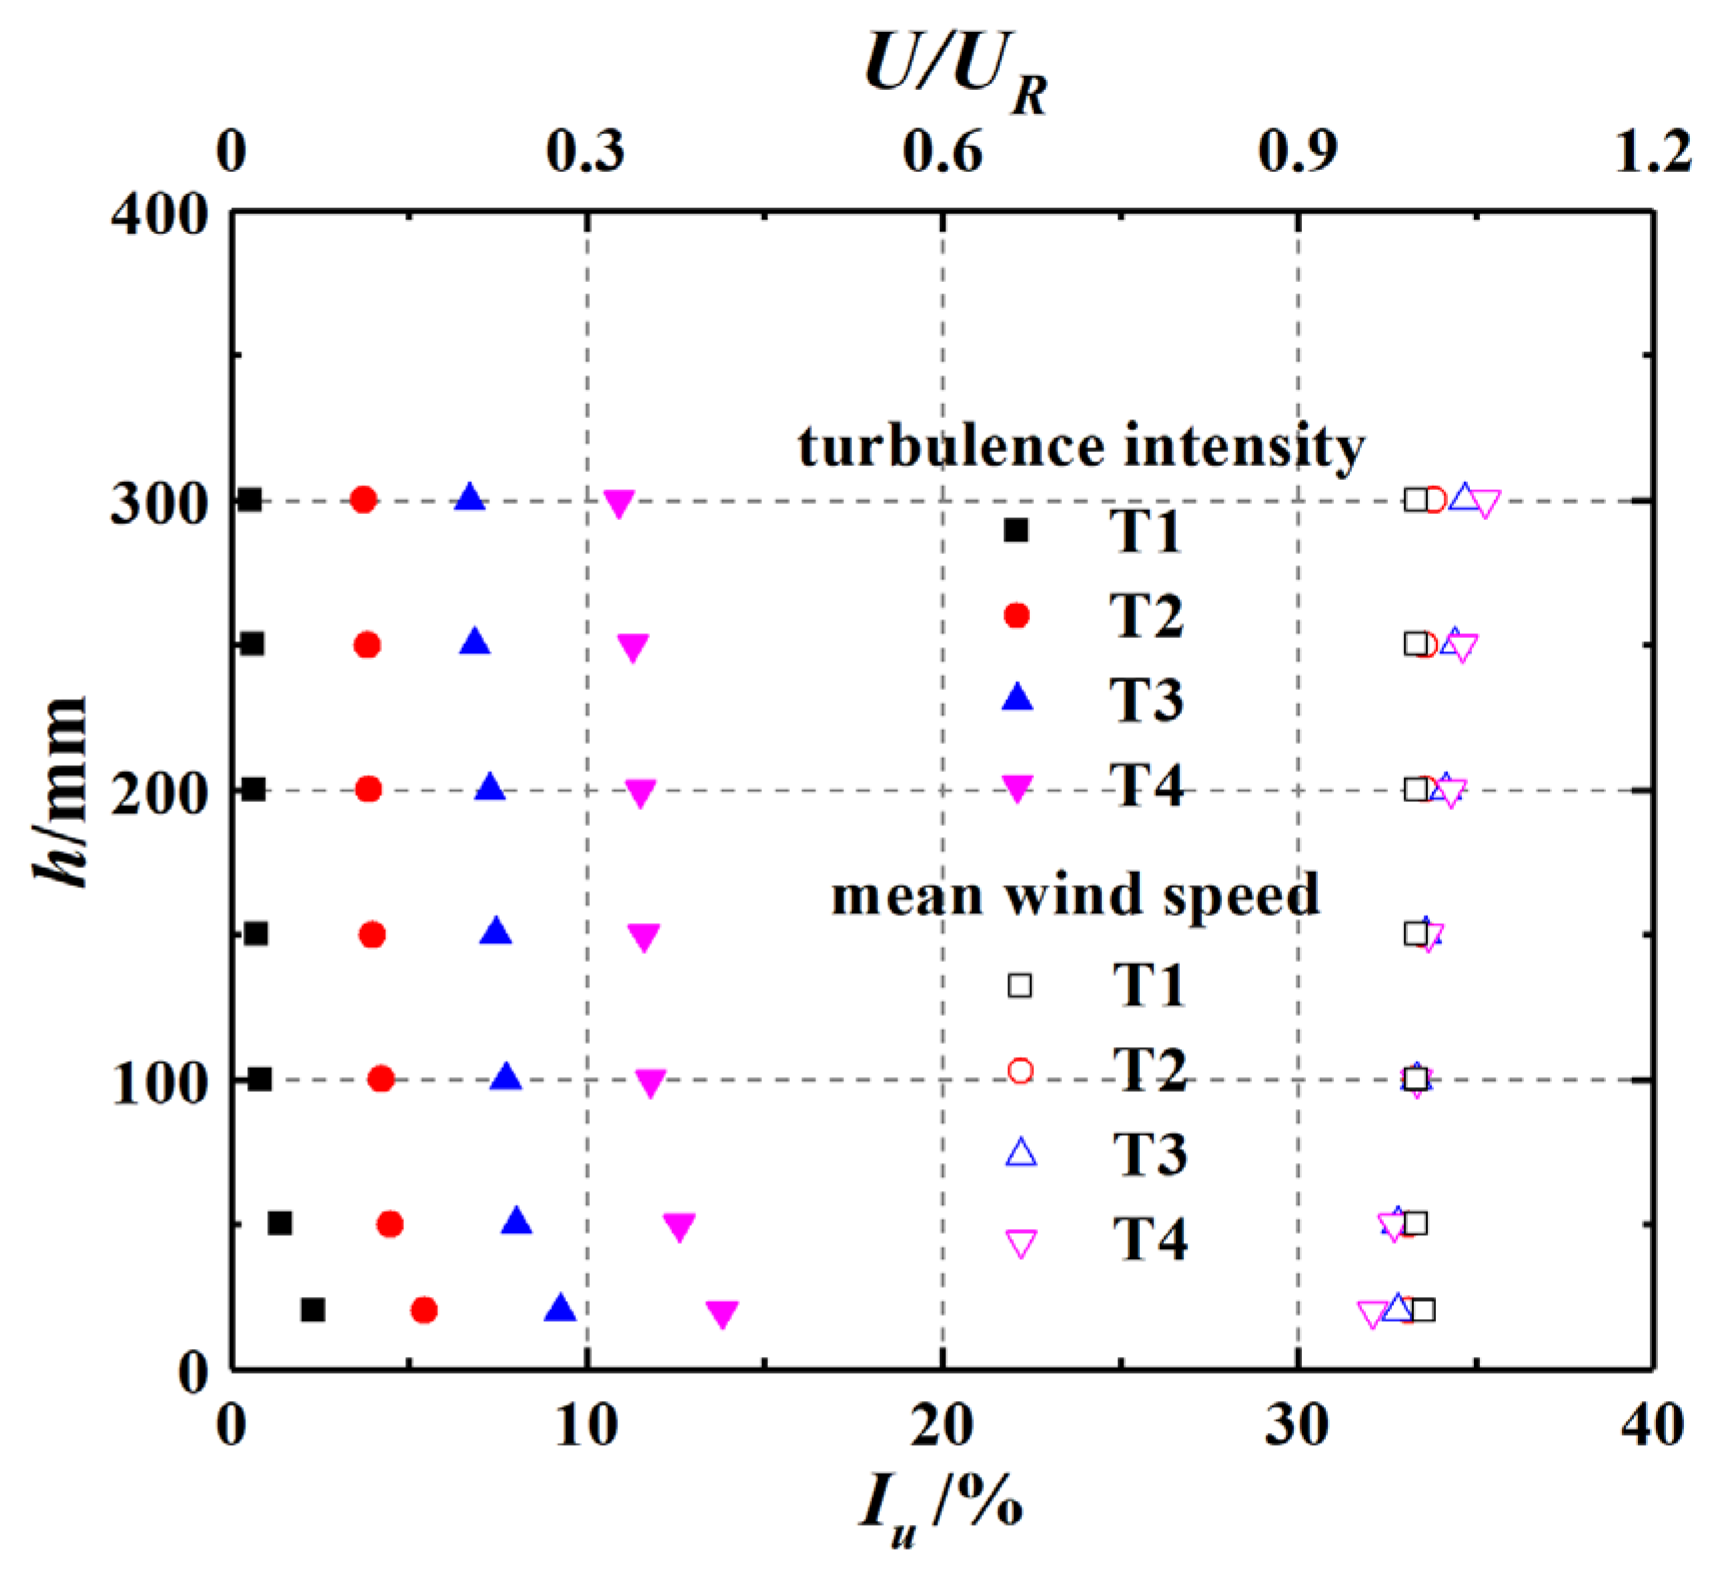
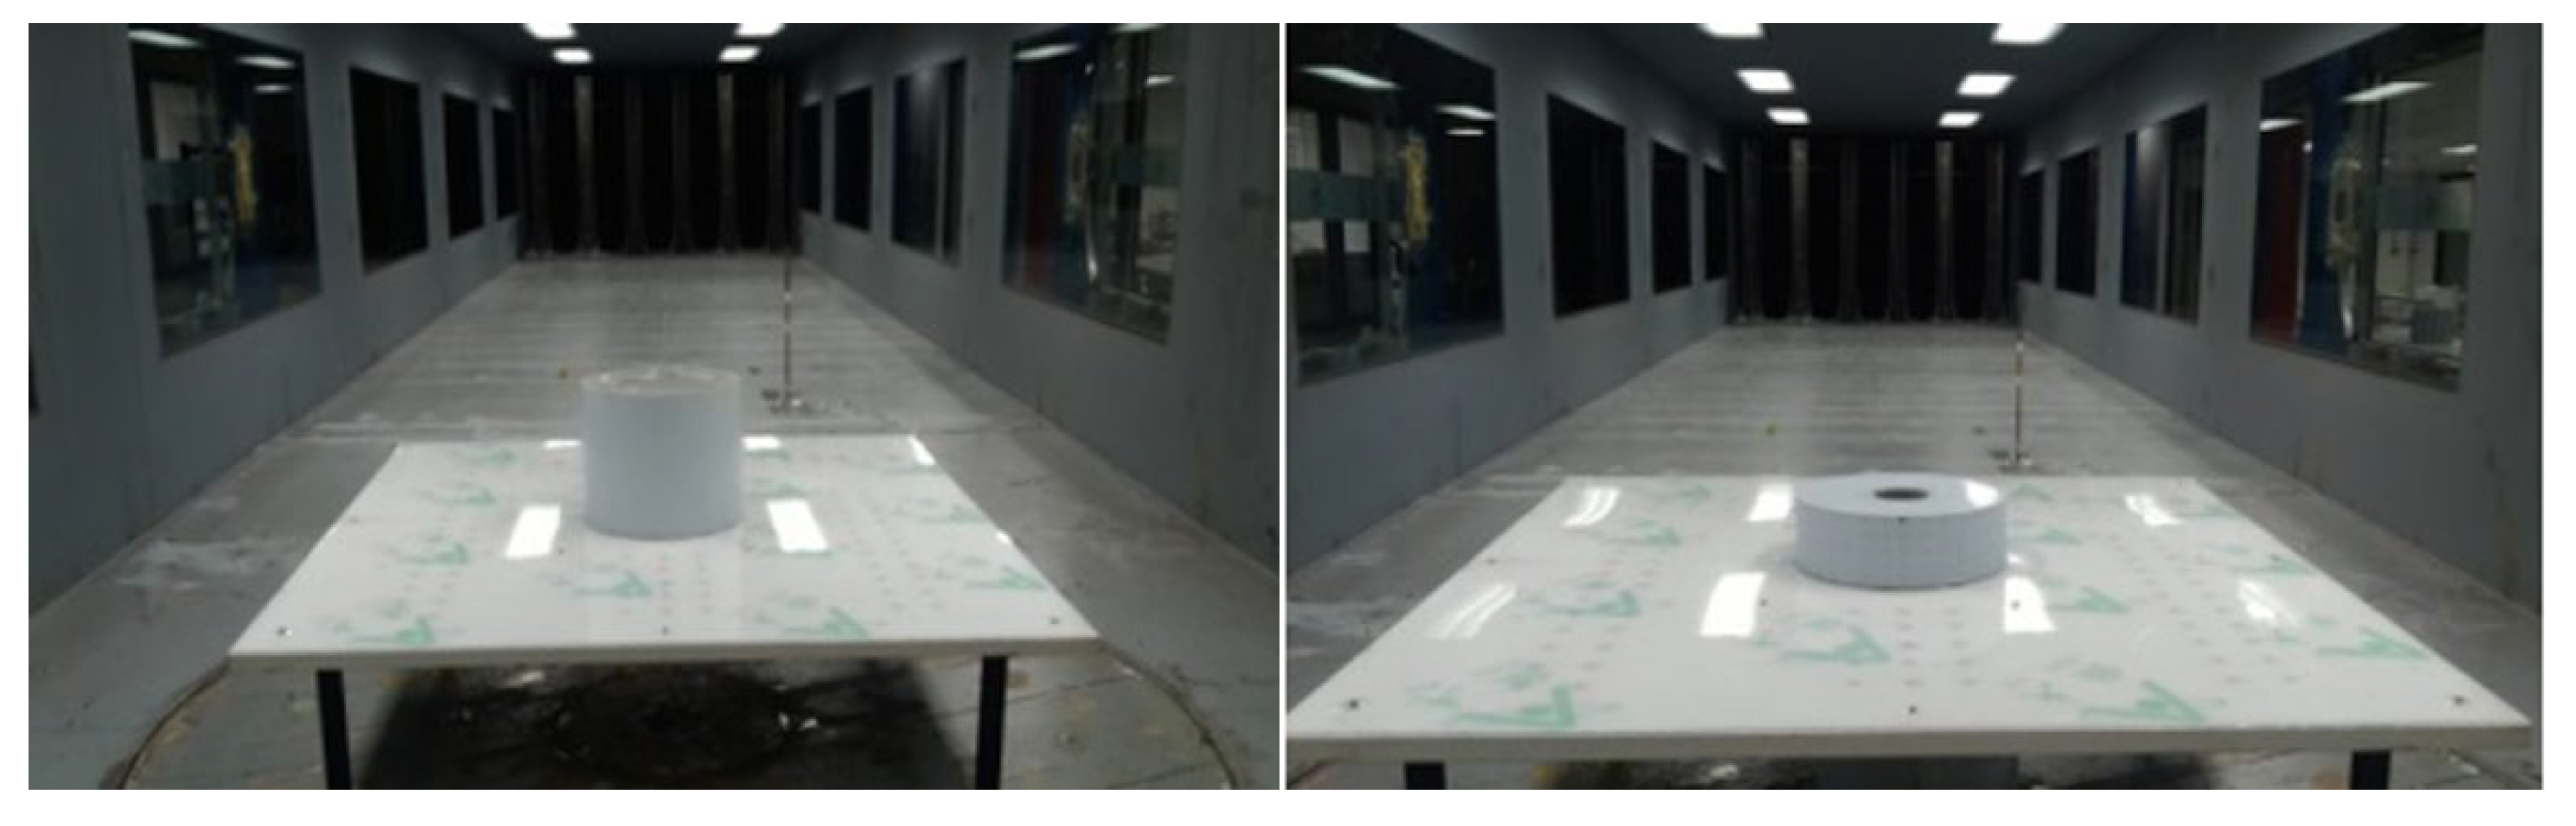
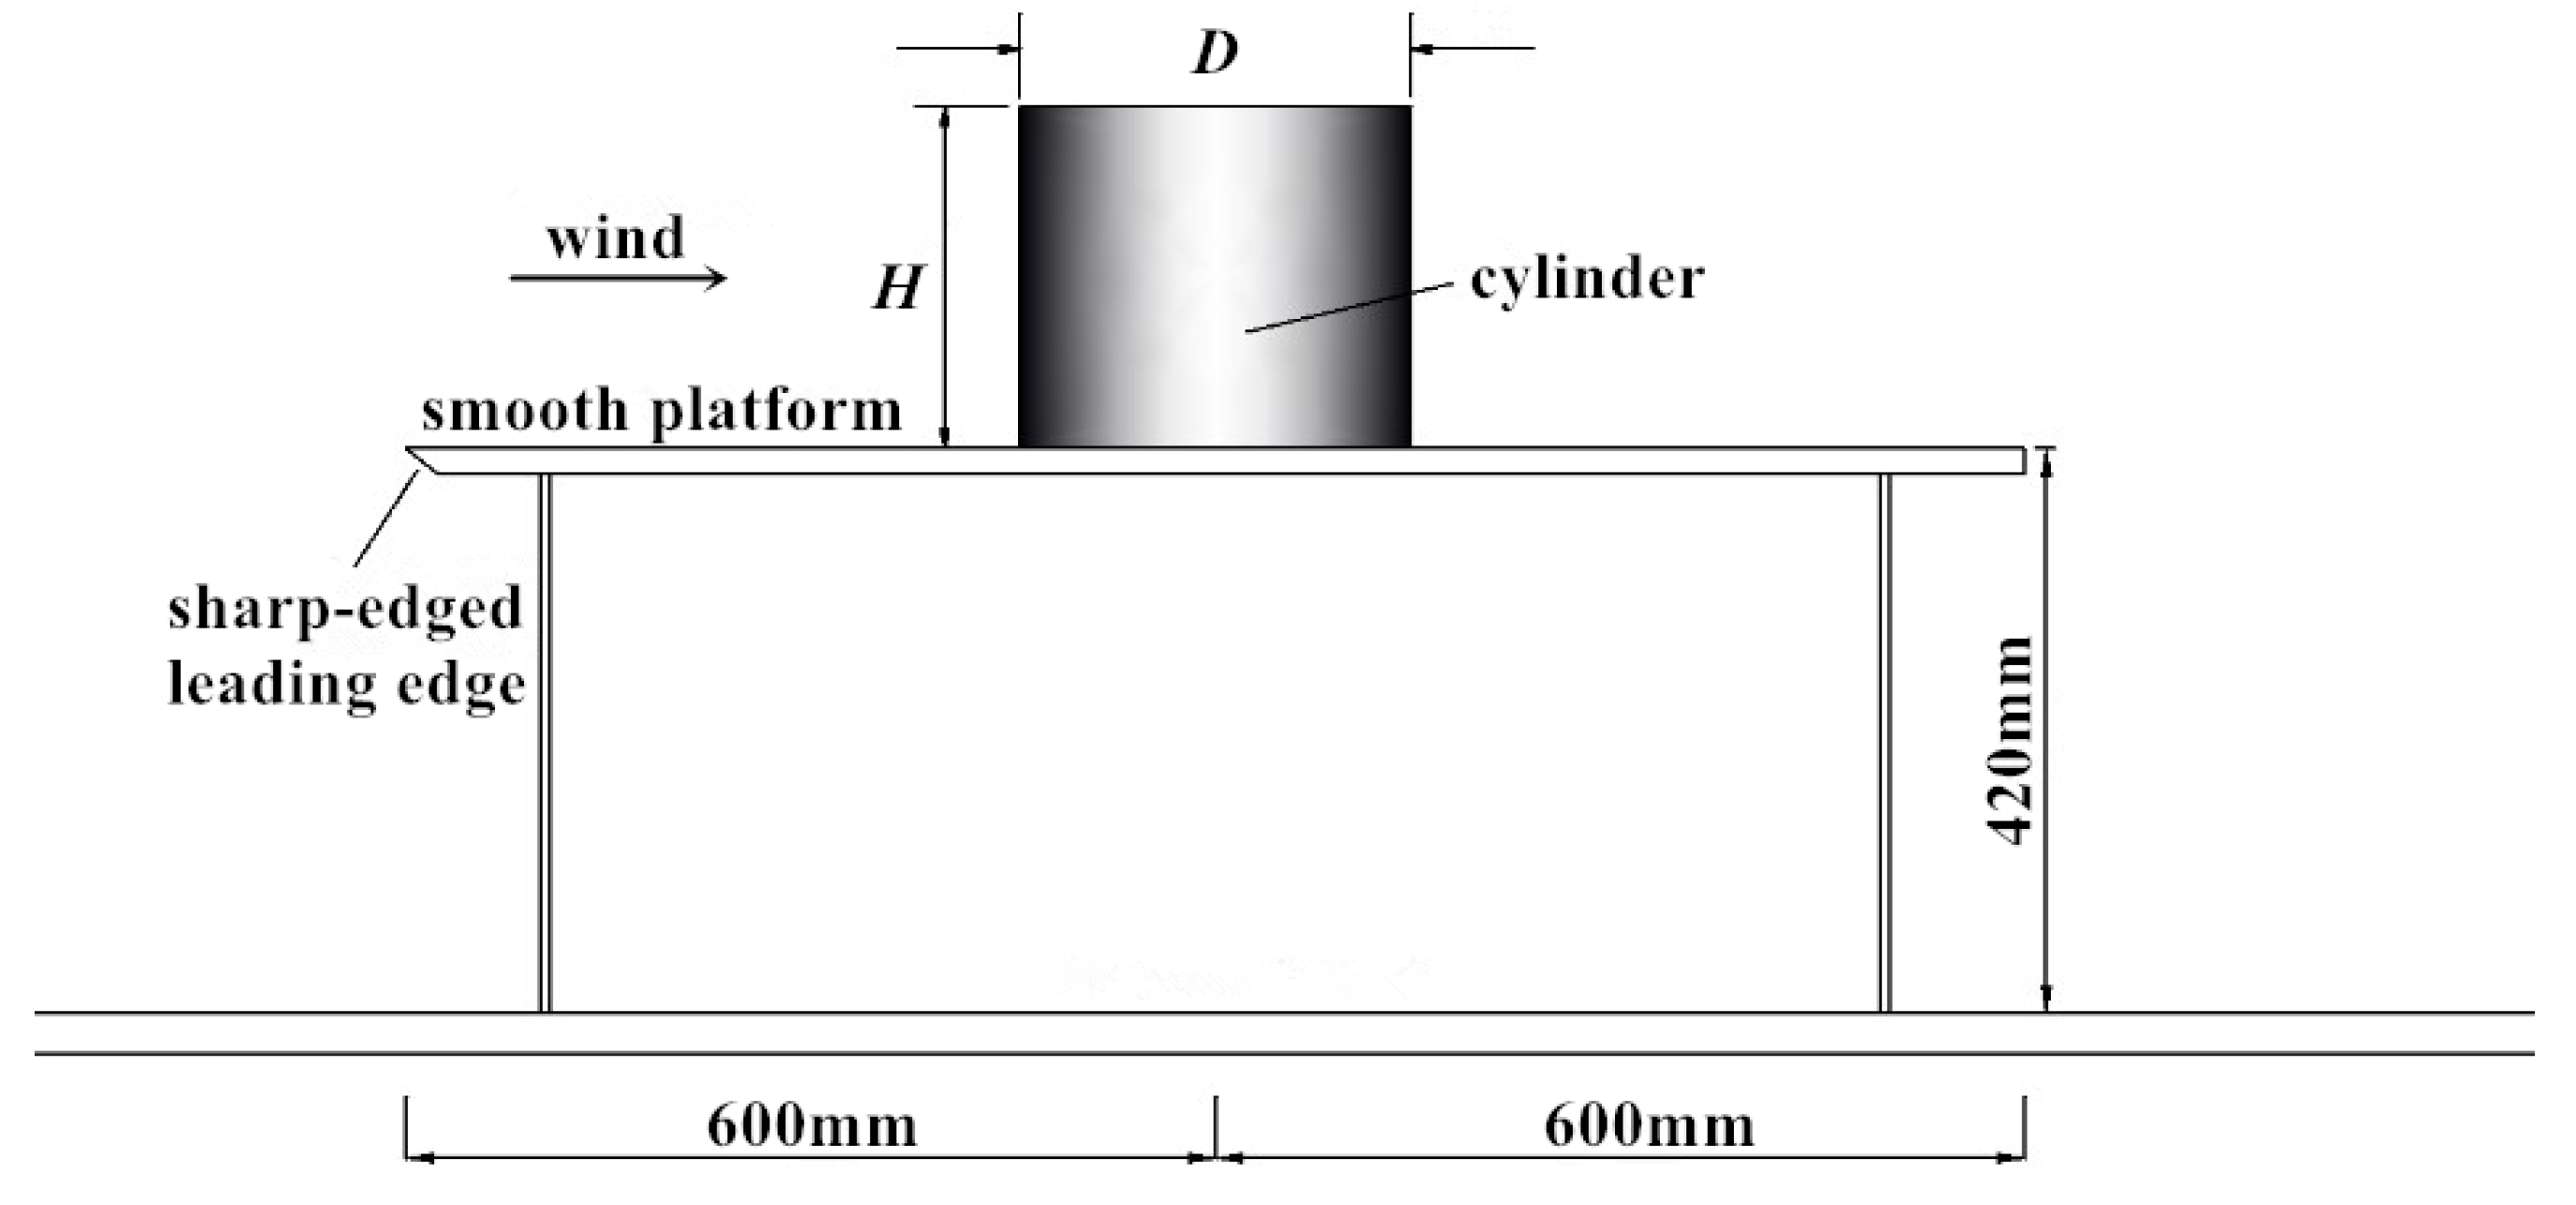
2.1. Experiment Setup

The test was conducted in the high-speed section of the BJ-1 wind tunnel at Beijing Jiaotong University. The dimensions of the test section were 2.0 m × 3.0 m × 15.0 m (height × width × length). In the test section, the mean wind velocity non-uniformity outside of the wall boundary layers was less than 0.5%, and the longitudinal freestream turbulence intensity was less than 1% [37].
Before the test, the Cobra Probe (TFI Series 100), which is a dynamic multi-hole pressure probe, was used to measure mean and fluctuating velocities above the ground in the wind tunnel. At each measurement height (h = 25 mm, 50 mm, 100 mm, 150 mm, 200 mm, 250 mm, and 300 mm), 45,000 velocity data were obtained with a sampling frequency 1.5 kHz. The uncertainty was estimated to be around ±4% and ±8% for mean and fluctuating velocities, respectively. Meanwhile, spires fixed in front of the air outlet were used to adjust the turbulence intensity. Ultimately, one smooth flow and three homogeneous turbulence flows, namely T1, T2, T3, and T4, were simulated in the wind tunnel with turbulence intensity Iu = 0.8%, 4%, 8%, 12%, respectively, as shown in Figure 1, where h is the height above the wind tunnel ground, UR is the mean wind speed at the height of 100 mm (the reference height), and U is the mean wind speed. It can be clearly seen from the figure that the turbulence intensity and wind speed essentially remain unchanged above 100 mm of the ground.
In order to eliminate the influence of boundary layer of the wind tunnel, test models were installed vertically in the center of a 1200 mm × 1200 mm × 420 mm (length × width × height) smooth platform, with a sharp-edged leading edge at an angle of 30° [24,38] as shown in Figure 2.

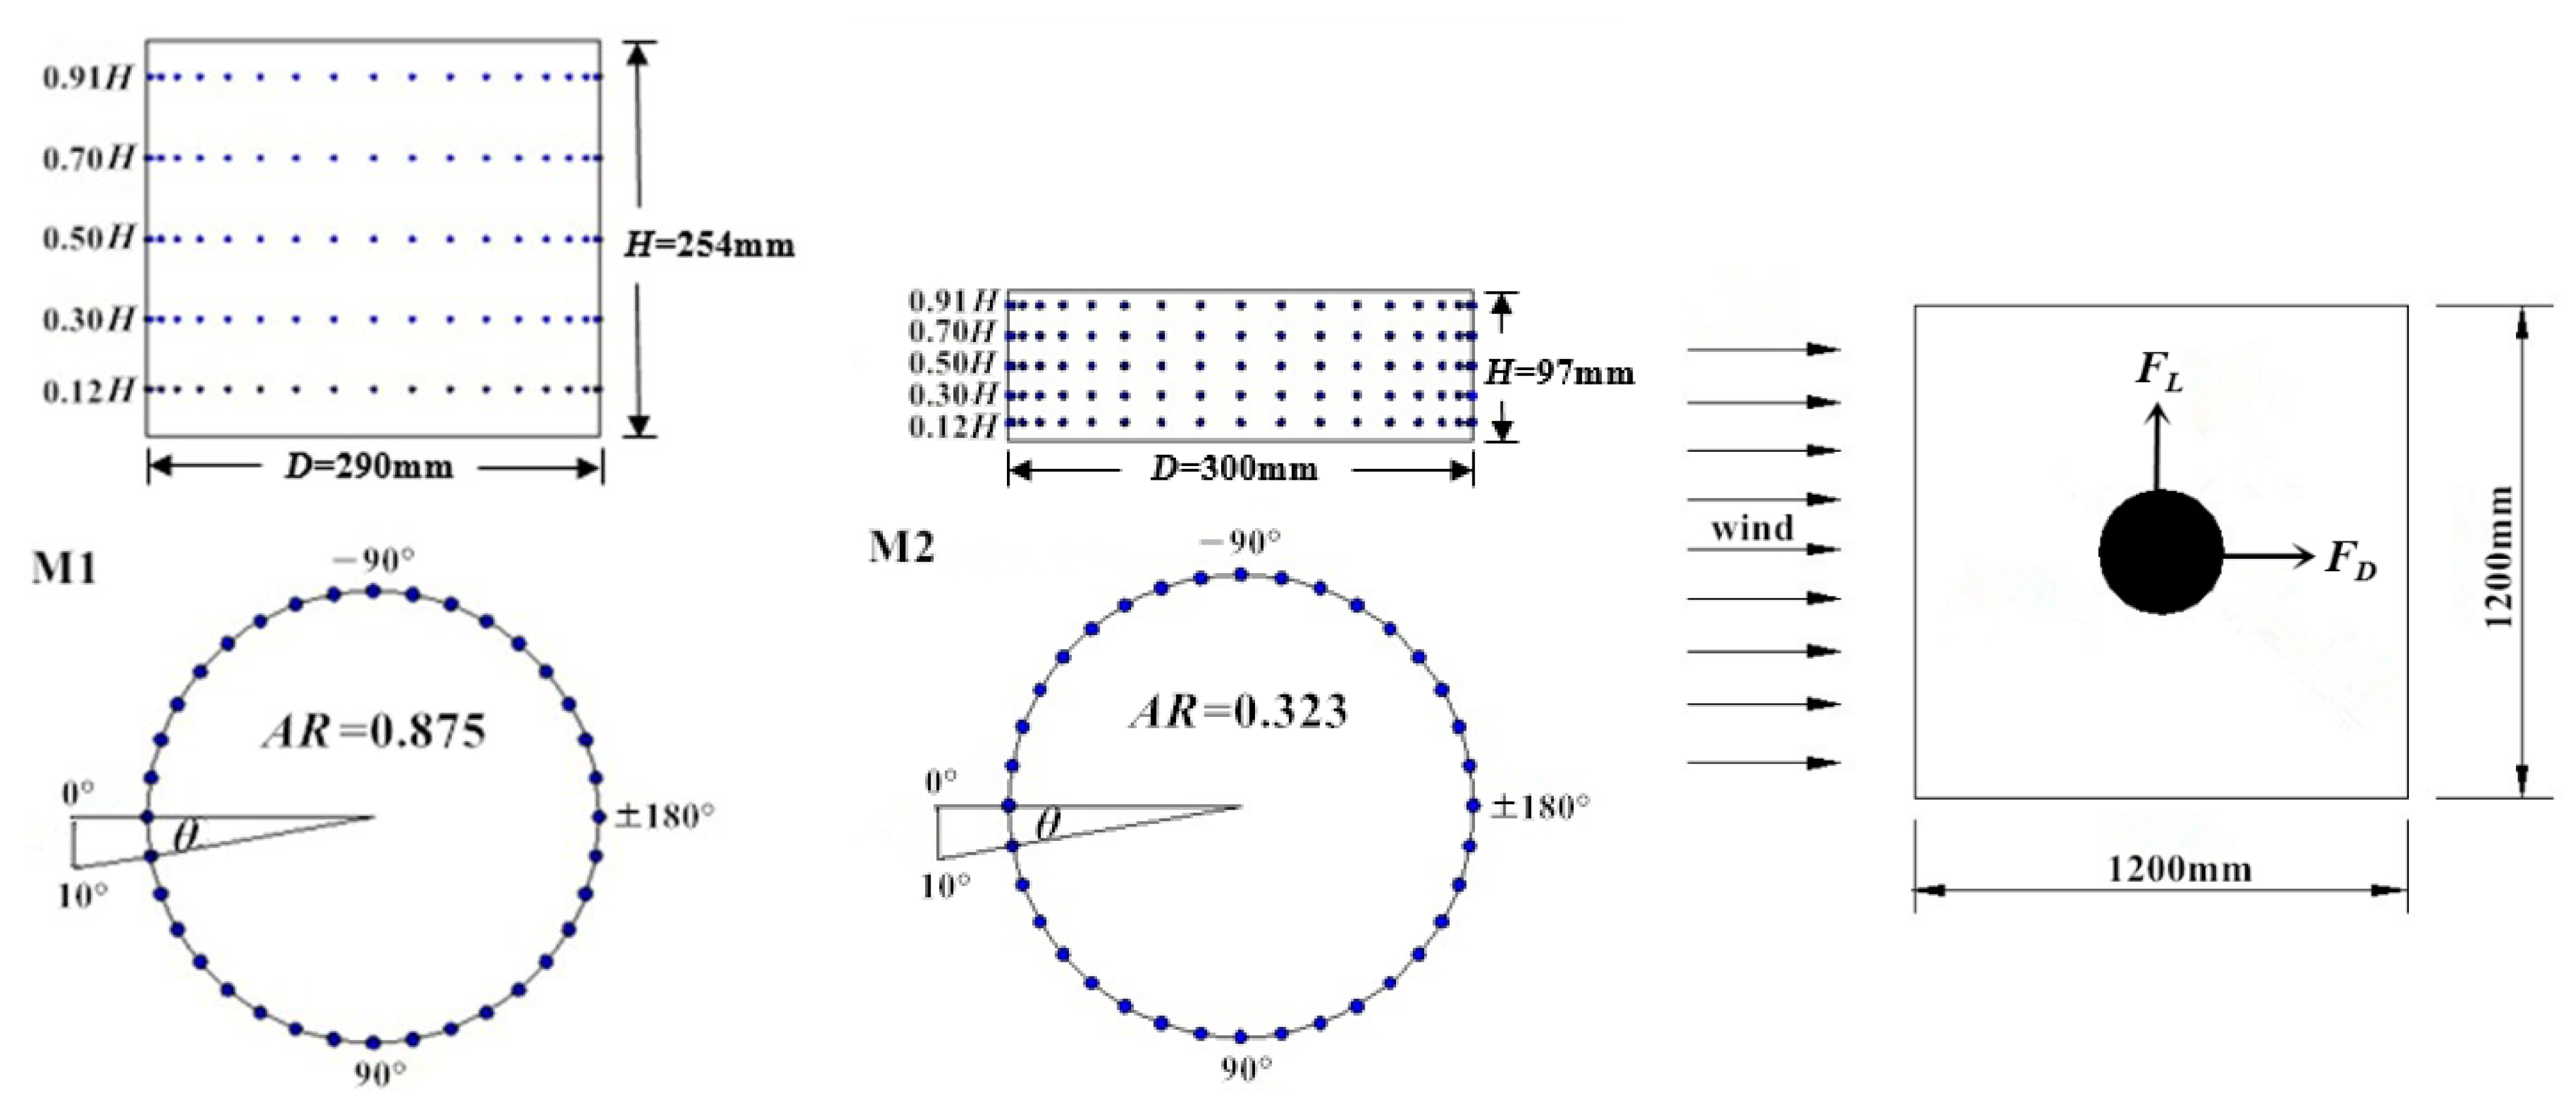
2.2. Details of Test Models

For this study, two smooth low-aspect-ratio cylinders were selected, referring to the size of actual oil tanks with AR = 0.323 and 0.875, named M1 and M2, respectively. The dimensions of M1 and M2 are shown in Figure 3; they were made of plastic with enough rigidity, and the scale ratios were 1:50 and 1:200. Their top ends were closed, and the base ends were fixed on the platform. A total of 180 pressure taps were arranged at the height of 0.91 H, 0.70 H, 0.50 H, 0.30 H, and 0.12 H, and distributed at 10° intervals along the circumference at each height. Furthermore, FD and FL are the drag (along-wind) and lift (cross-wind) forces of models, respectively. The windward pressure taps paralleling the incoming flow direction are defined as 0°, and θ is the angle between the other taps and the incoming flow.
In addition, Figure 4 shows the relationship between wind speed and turbulence intensity on the surface of the platform center. It is observed that, in order to obtain a stable turbulence condition for each wind flow, the incoming flow speed needs to be faster than 7 m/s. Accordingly, the wind speed used in this research ranged from 7 m/s to 27.5 m/s, and the corresponding range of Re was around 1.4 × 10⁵–5.7 × 10⁵, as calculated by the wind speed and the diameter of the models (Re ≈ 69,000 UD).

2.3. Data Processing Method

Wind pressure fluctuations on the surface of models were measured by a multi-pressure measurement system (PSI DTC Initium, ESP-64HD, Initium Inc., Tokyo, Japan). The sampling frequency of the system was 312.5 Hz, and a total of 20,000 samples were collected at each pressure tap. The uncertainty was estimated to be around ±3% and ±6% for mean and fluctuating wind pressure, respectively. The wind pressure on the models is expressed in the form of a non-dimensional pressure coefficient, as defined by Equation (1):
C P , i t = P i t P 1 2 ρ V H 2
where Cp,i(t) is the wind pressure coefficient of tap i at time t; Pi(t) is the measured pressure of tap i at time t; P is the static pressure; ρ is the air density; and VH is the wind speed at the top of models.
The local force coefficient and base force coefficient CD,k(t), CJD(t) (along-wind) and CL,k(t), CJL(t) (cross-wind) were calculated based on the wind pressure measurement, as defined by Equations (2)–(5). It should be noted that when Re > 104, the surface viscous friction drag is negligibly small [19,39]. Considering that the range of Re ≈ 1.4 × 10⁵–5.7 × 10⁵ in the present study, it is acceptable to omit any friction contribution:
C D , k t = π N i = 1 N C P , i t cos ( θ )
C L , k t = π N i = 1 N C P , i t sin ( θ )
C J D t = k = 1 M C D , k t H k / H
C J L t = k = 1 M C L , k t H k / H
where N is the number of pressure taps at elevation k; Hk is the corresponding tributary height; and M is the number of pressure tap layers.

3. Results and Discussion

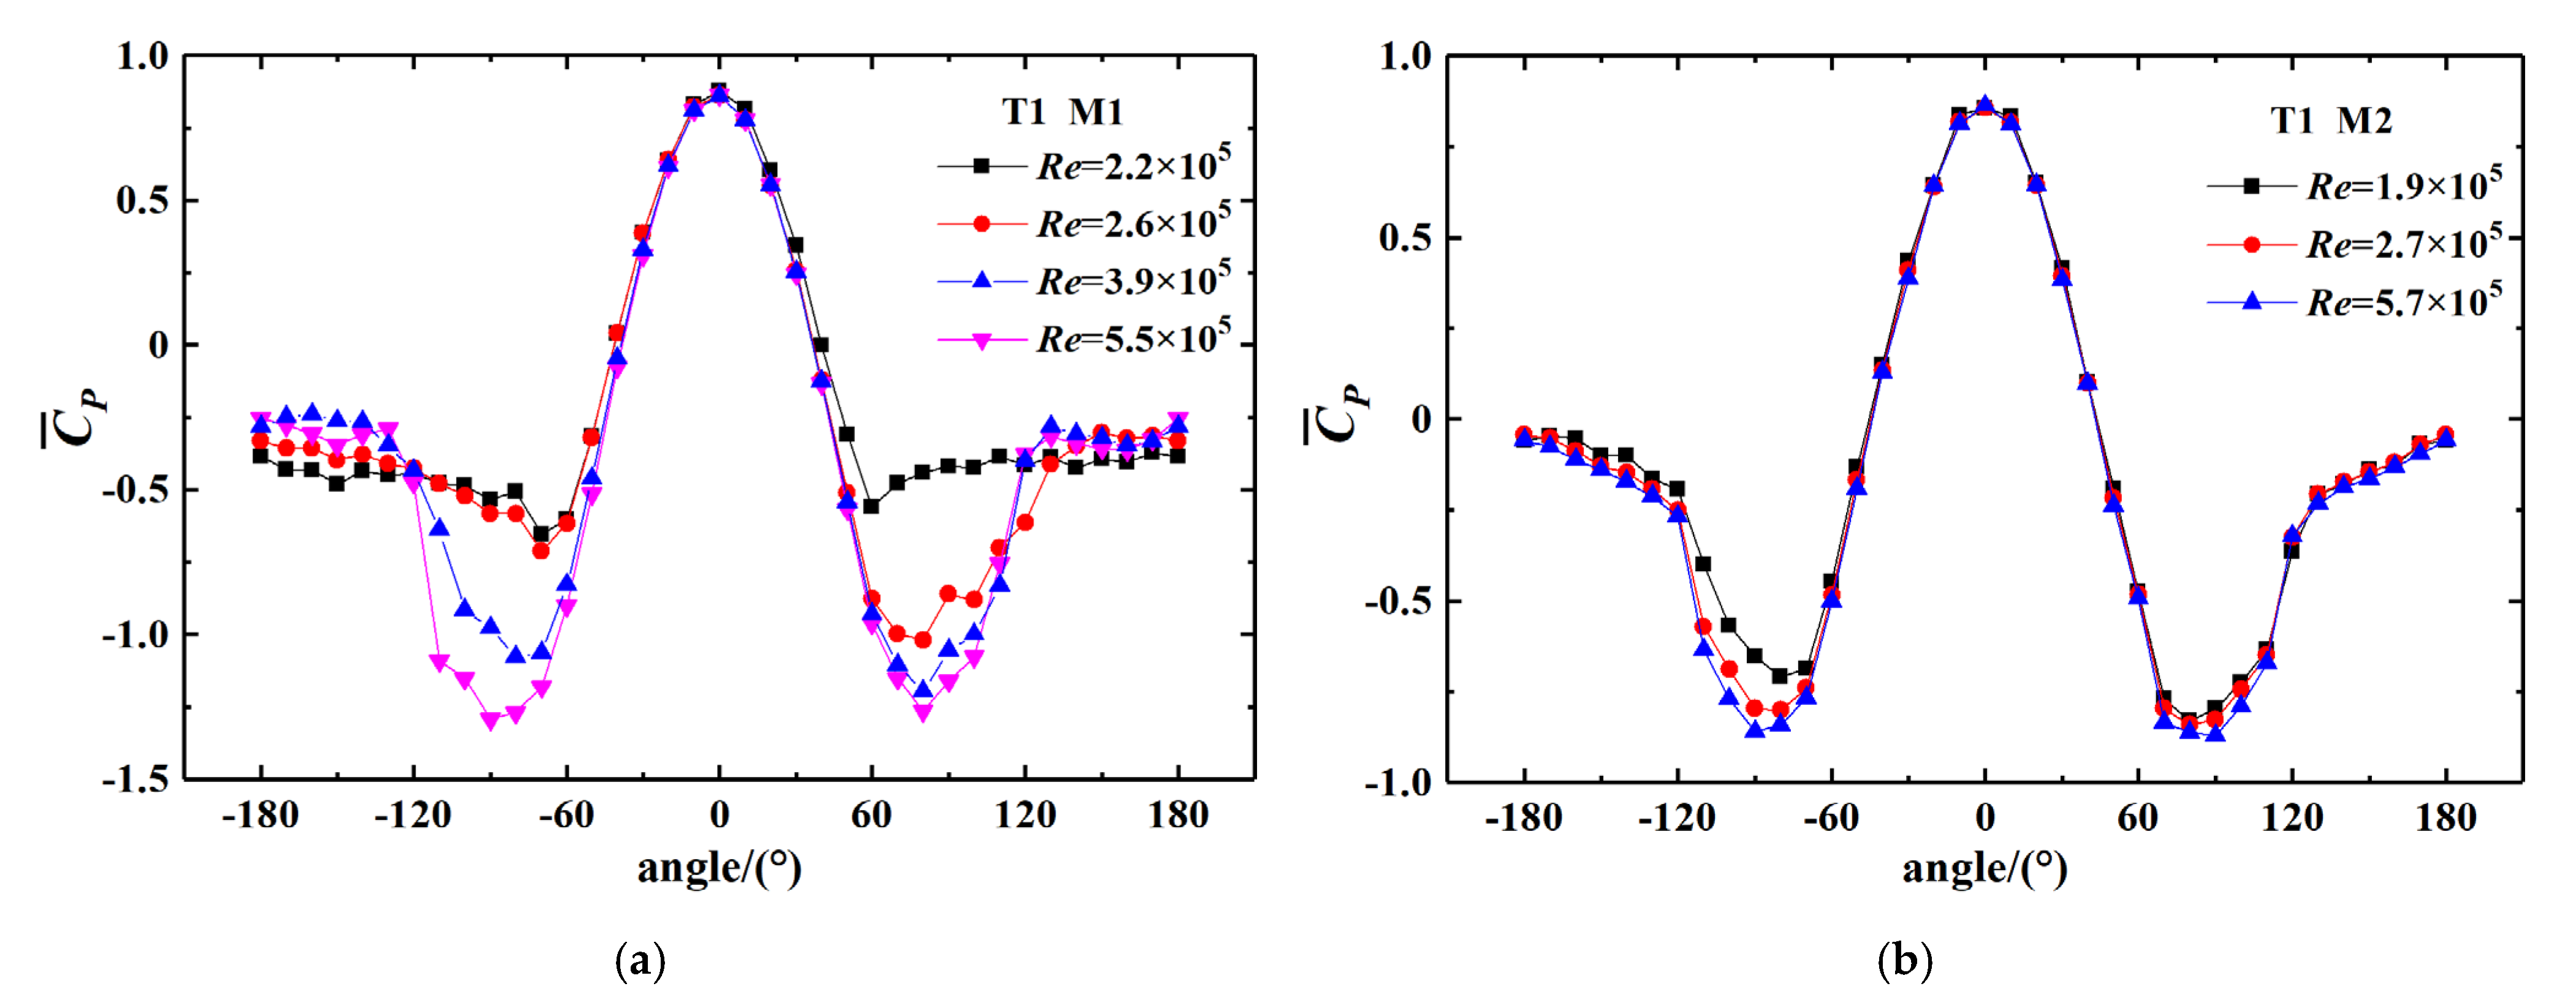
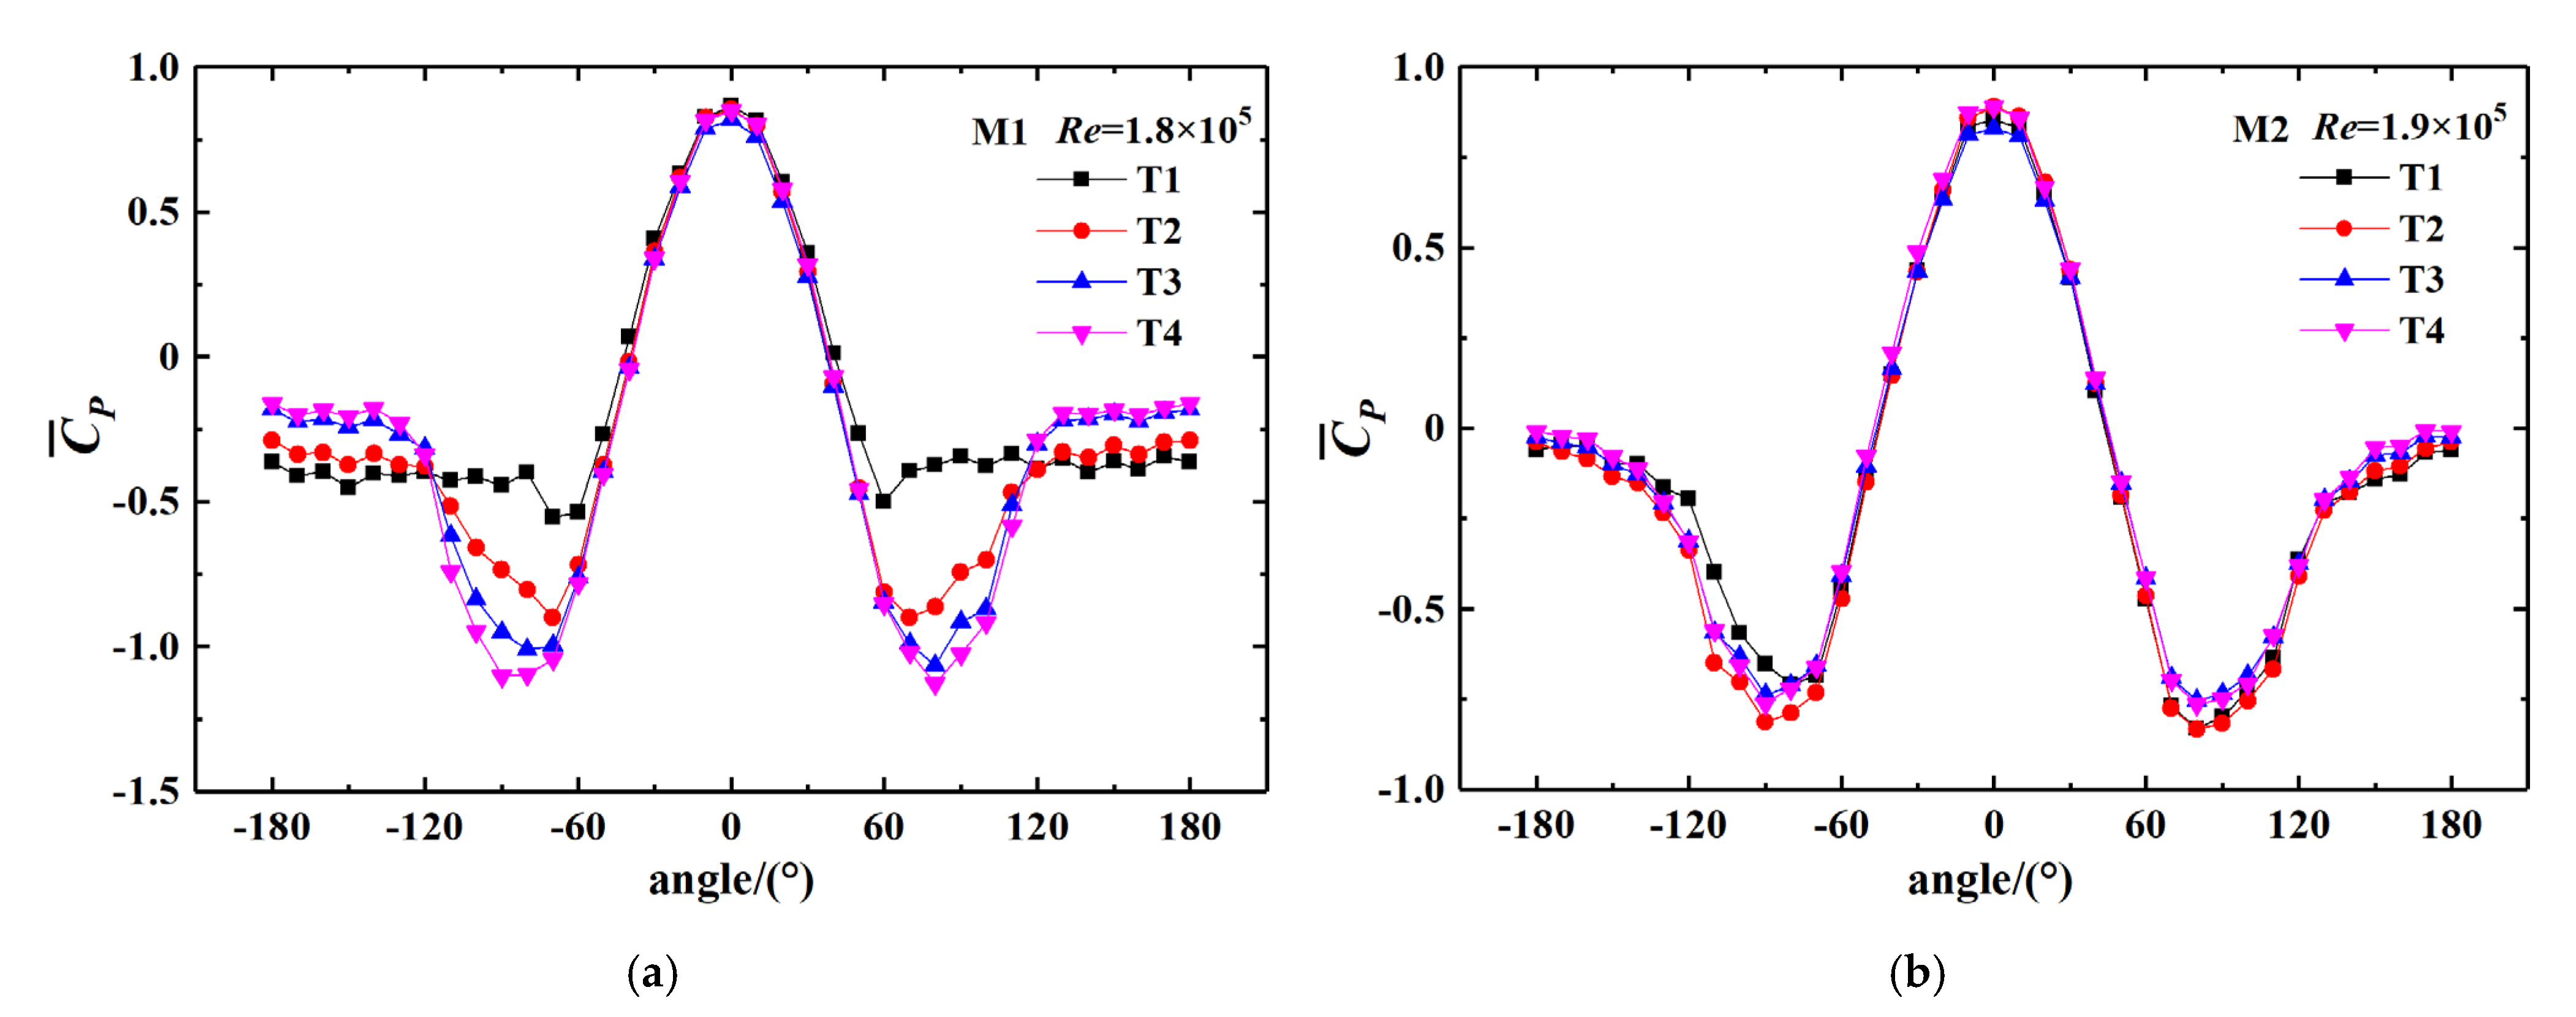
3.1. Mean Pressure Coefficient

Based on the results of the wind tunnel test, Figure 5a shows the distribution of the mean pressure coefficient C ¯ p of M1 under various Re values. At Re = 2.2 × 10⁵, the value of C ¯ p was found to have an increasing section at 70–80°, and tended to be stable thereafter. This phenomenon can be considered as a typical laminar separation in the subcritical regime, and the separation point is near the 70–80° [40]. For Re = 2.6 × 10⁵, the left side also had a laminar separation, while the right side of C ¯ p increased sharply and a platform appeared at 90–100°, indicating the formation of a separation bubble. At the same time, the separation point moved to 140° with the transition to the critical regime [40]. When Re = 3.9 × 10⁵, both sides of M1 had platforms corresponding to the complete critical regime. With the further increase of Re = 5.5 × 10⁵, the platform on the right disappeared, indicating the transition to the supercritical regime [40]. As for the M2 model in Figure 5b, although the distribution of C ¯ p on both sides had a little difference at Re = 1.9 × 10⁵, there were no significant platforms similar to M1, and the value of C ¯ p was smaller than that of M1 in negative pressure range. Therefore, it can be concluded that the Re effect on the circular distributions of C ¯ p decreases with the decreasing AR for low-aspect-ratio cylinders.
Figure 6a shows the distribution of the mean pressure coefficient C ¯ p of M1 under different wind fields. The value of C ¯ p in T1 was in a subcritical laminar separation state, and the separation point was between 70° and 80°. At the same time, in the T2 and T3 wind fields, C ¯ p presented obvious platforms for 90–100° on the right side, corresponding to the critical regime. In the T4 wind field, a relatively symmetrical C ¯ p with no prominent platforms was observed. Compared with the T1 wind field, the separation points in T2, T3, and T4 were backward to 130°, and the leeward pressure coefficient became larger with the turbulence increment. As for the M2 model, in Figure 6b, the value of C ¯ p is almost symmetric in T2, T3, and T4. Moreover, unapparent platforms 100–110° of the left side in T2 and T3 were detected, but no platforms were observed in T4. It can be deduced that, when the incoming turbulence increases, the wind pressure distribution of low-aspect-ratio cylinders tends to be in a higher Re state, that is, the supercritical regime is reached at a smaller Re. Similar results were also obtained in Blackburn’s research [41].

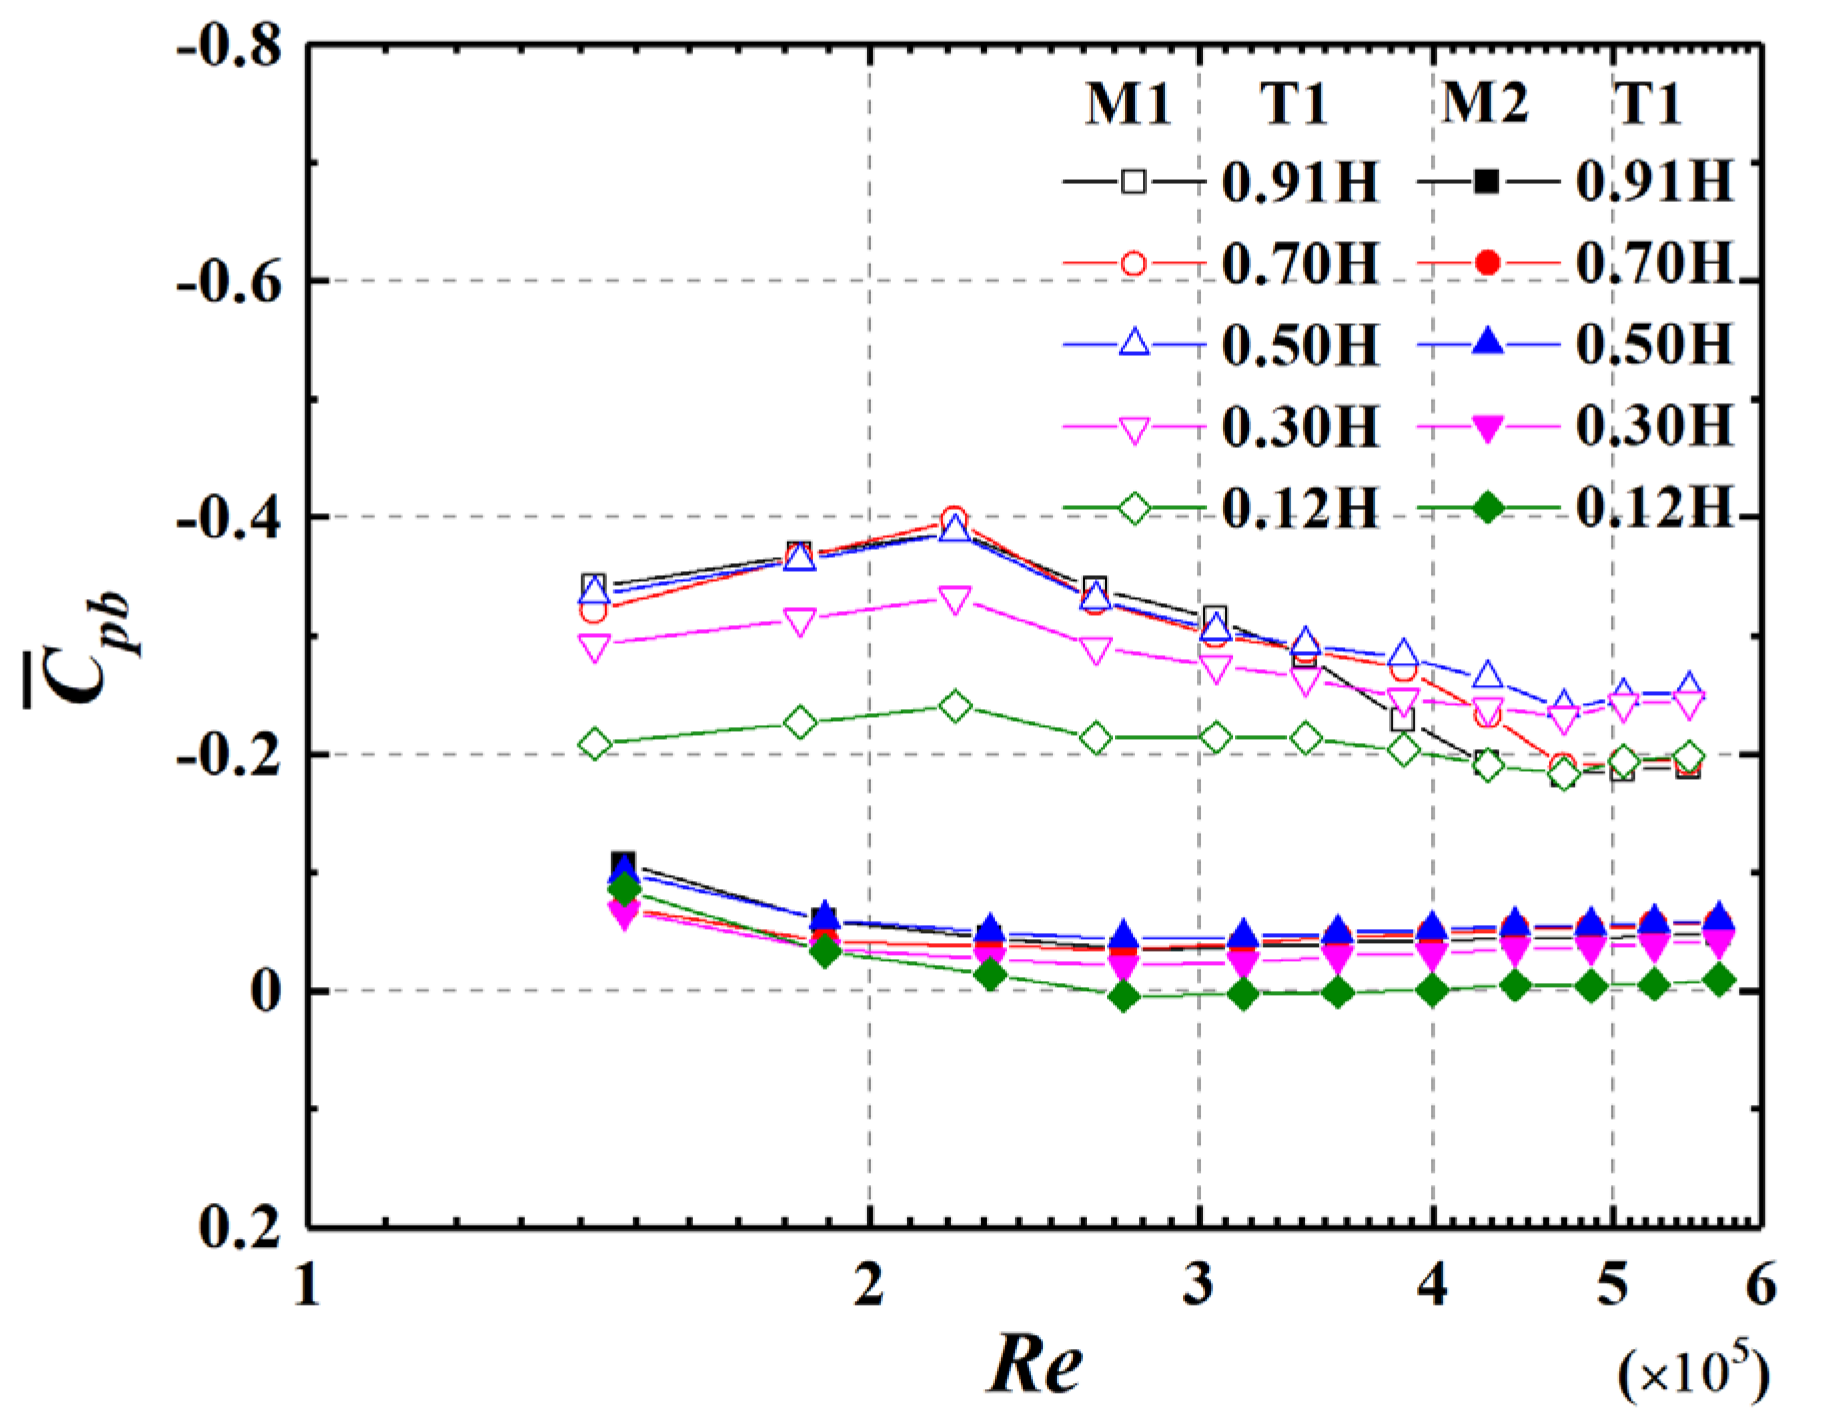
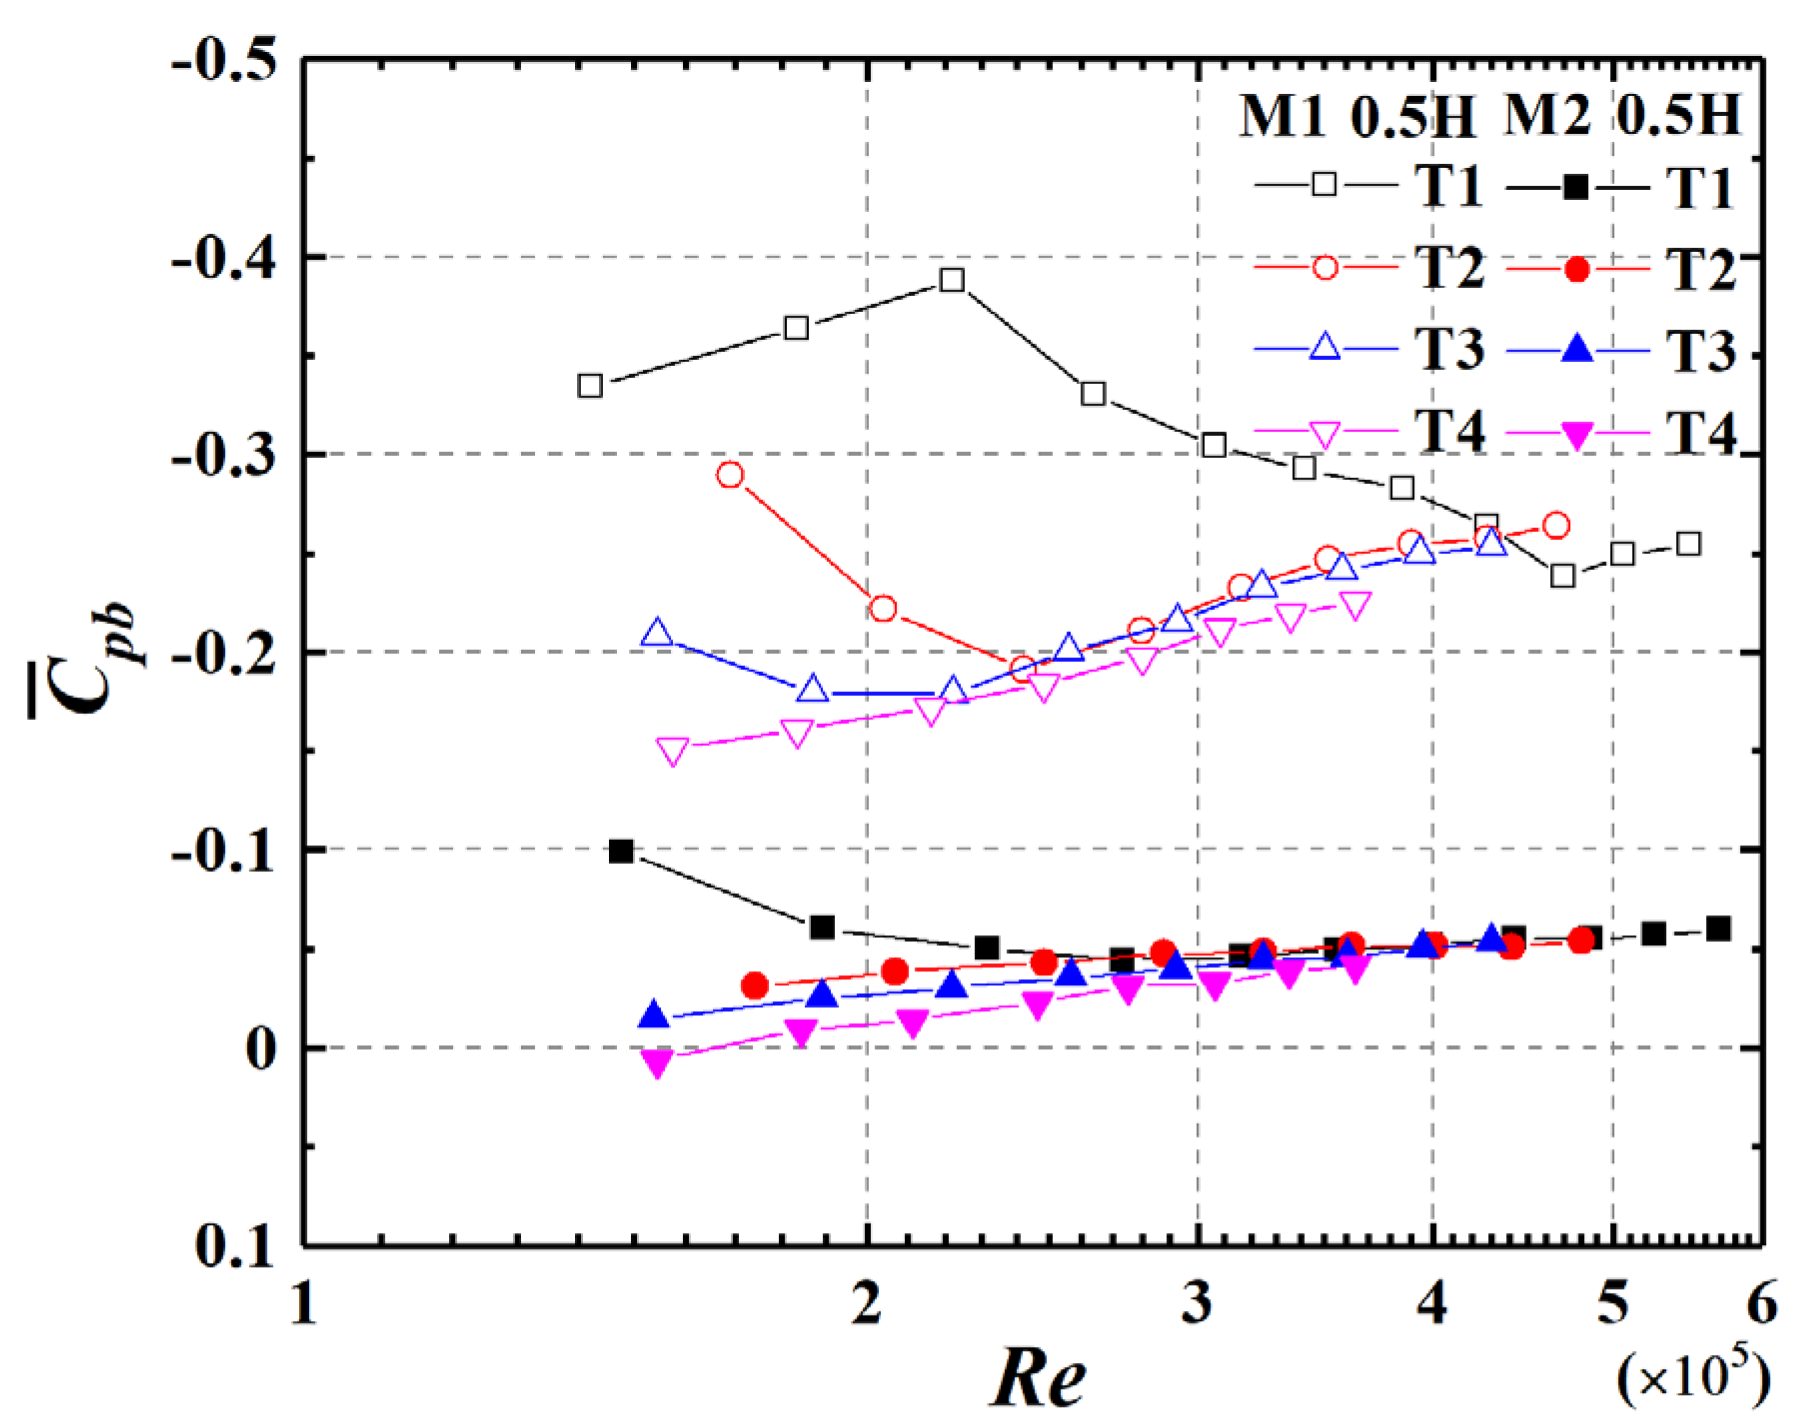
3.2. Base Pressure Coefficient

The base pressure coefficient, defined as the pressure difference in the wake of the cylinder, is an important component of the drag [4,6,8]. Figure 7 shows the variation of the base pressure coefficient C ¯ p b with Re at different height of models. The stronger free end effect of M2 resulting in C ¯ p b at all heights was smaller than that of M1. The value of C ¯ p b for M1 increased at Re = 1.4 × 10⁵–2.2 × 10⁵, but gradually decreased at the Re = 2.2 × 10⁵–4.7 × 10⁵ due to the narrower wake flow in the critical regime. In cases where the model height was below 0.5 H, the value of C ¯ p b increased with height, while at 0.7 H and 0.91 H, there was a sharp decrease after Re = 3.4 × 10⁵. As for the M2 model, the value of C ¯ p b decreased at Re = 1.5 × 10⁵–2.7 × 10⁵, then showed a slight upward trend; it also increased with a height below 0.5 H. It can be deduced that the flow around low-aspect-ratio cylinders is not uniform along the height, which is consistent with Wang’s [19] research.
Figure 8 depicts the influence of wind fields. For the M1 model, the variation of C ¯ p b in T1 was completely different from the other wind fields, and peaked at Re = 2.2 × 10⁵. In the T2 and T3 wind fields, the change tended to decrease before Re = 2.2 × 10⁵, then increased to become consistent; however, a continuous increase depending on Re was observed in the T4 wind field. For the M2 model, due to the stronger free end effect, the value of C ¯ p b was smaller than M1, and the variation in the four wind fields was not as great as that of M1. In general, the value of C ¯ p b also tends to be a higher Re state with increasing turbulence.

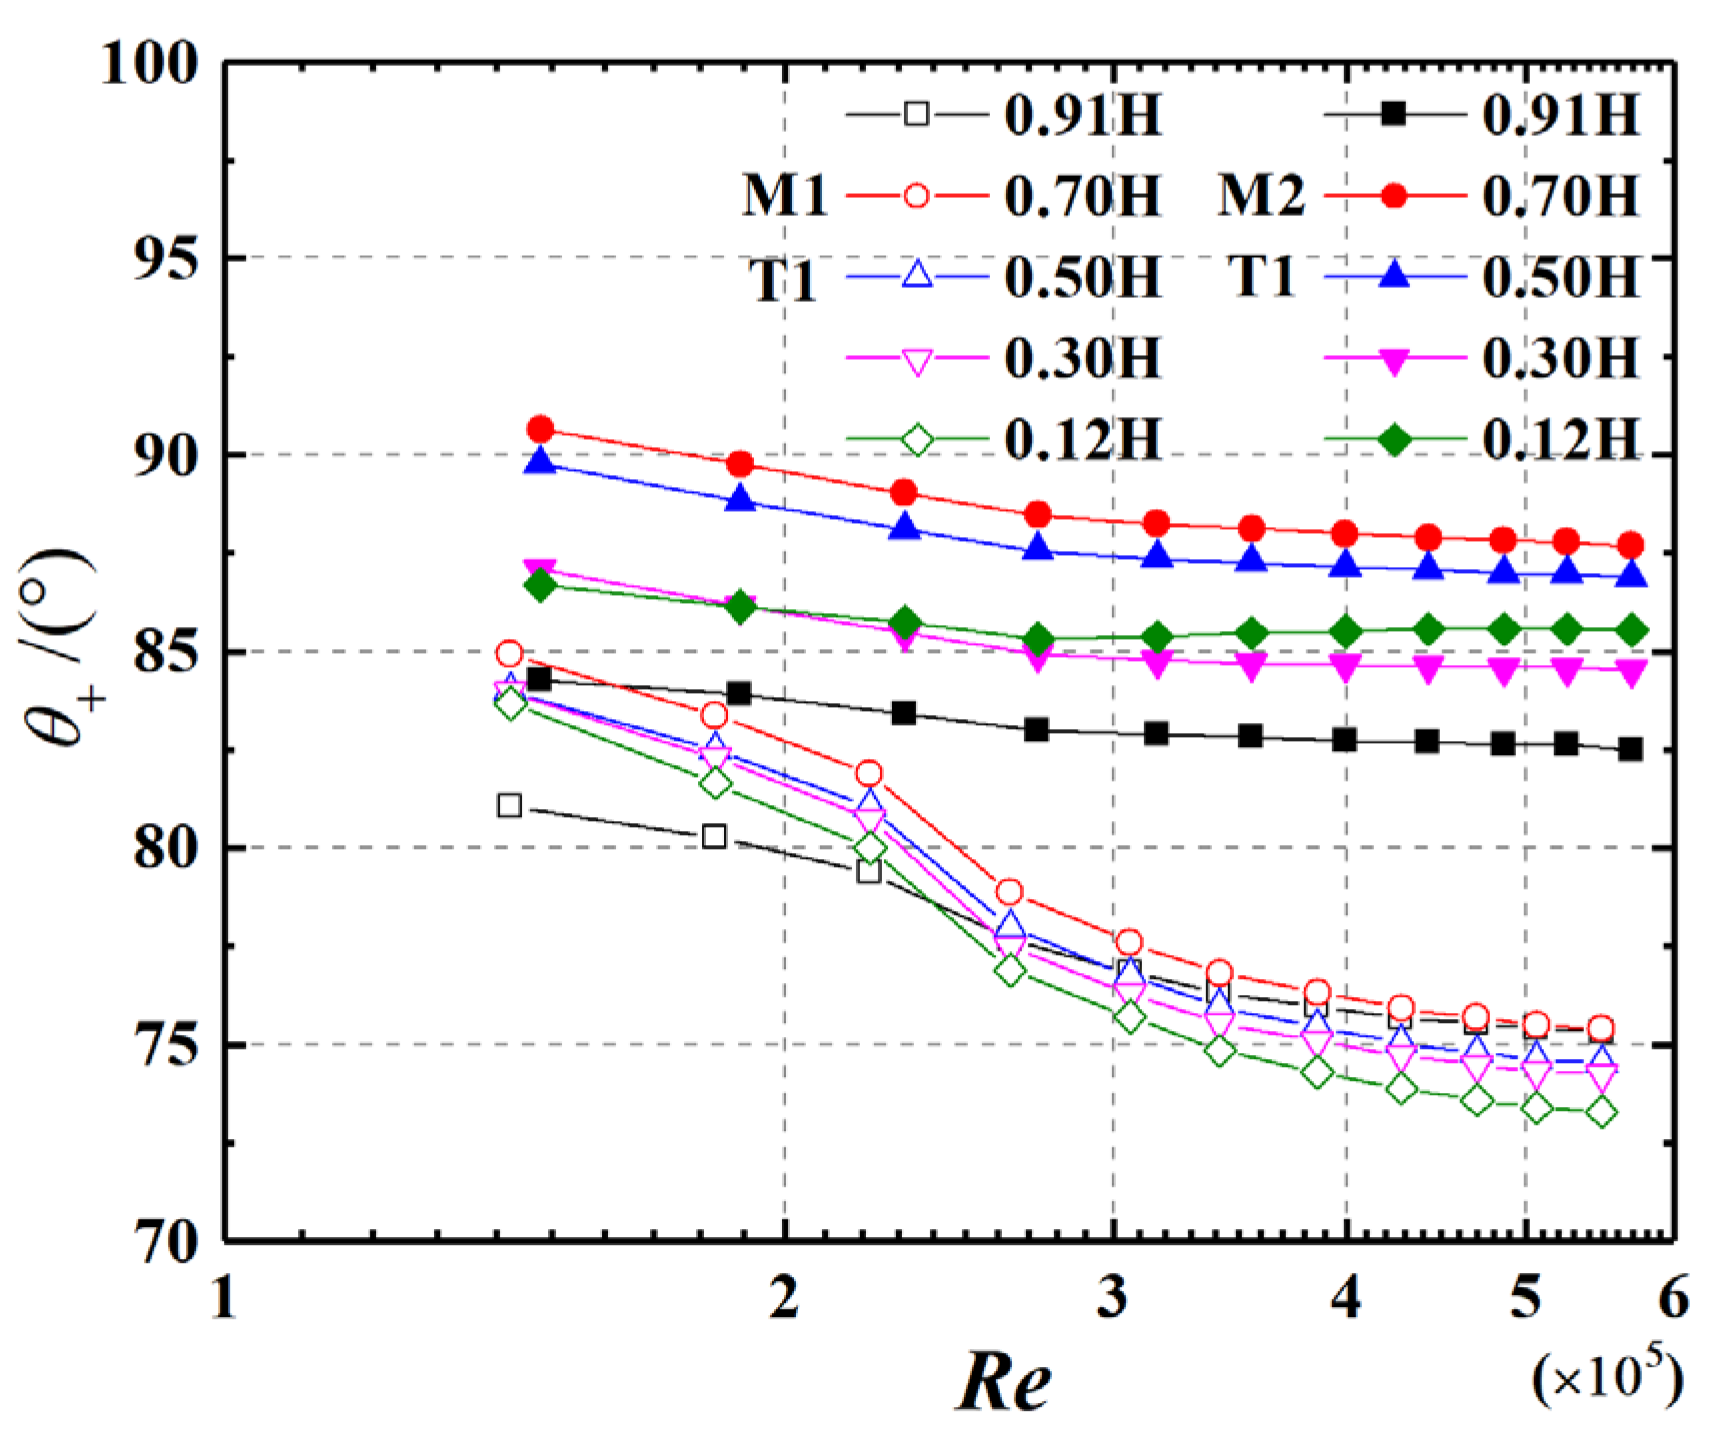
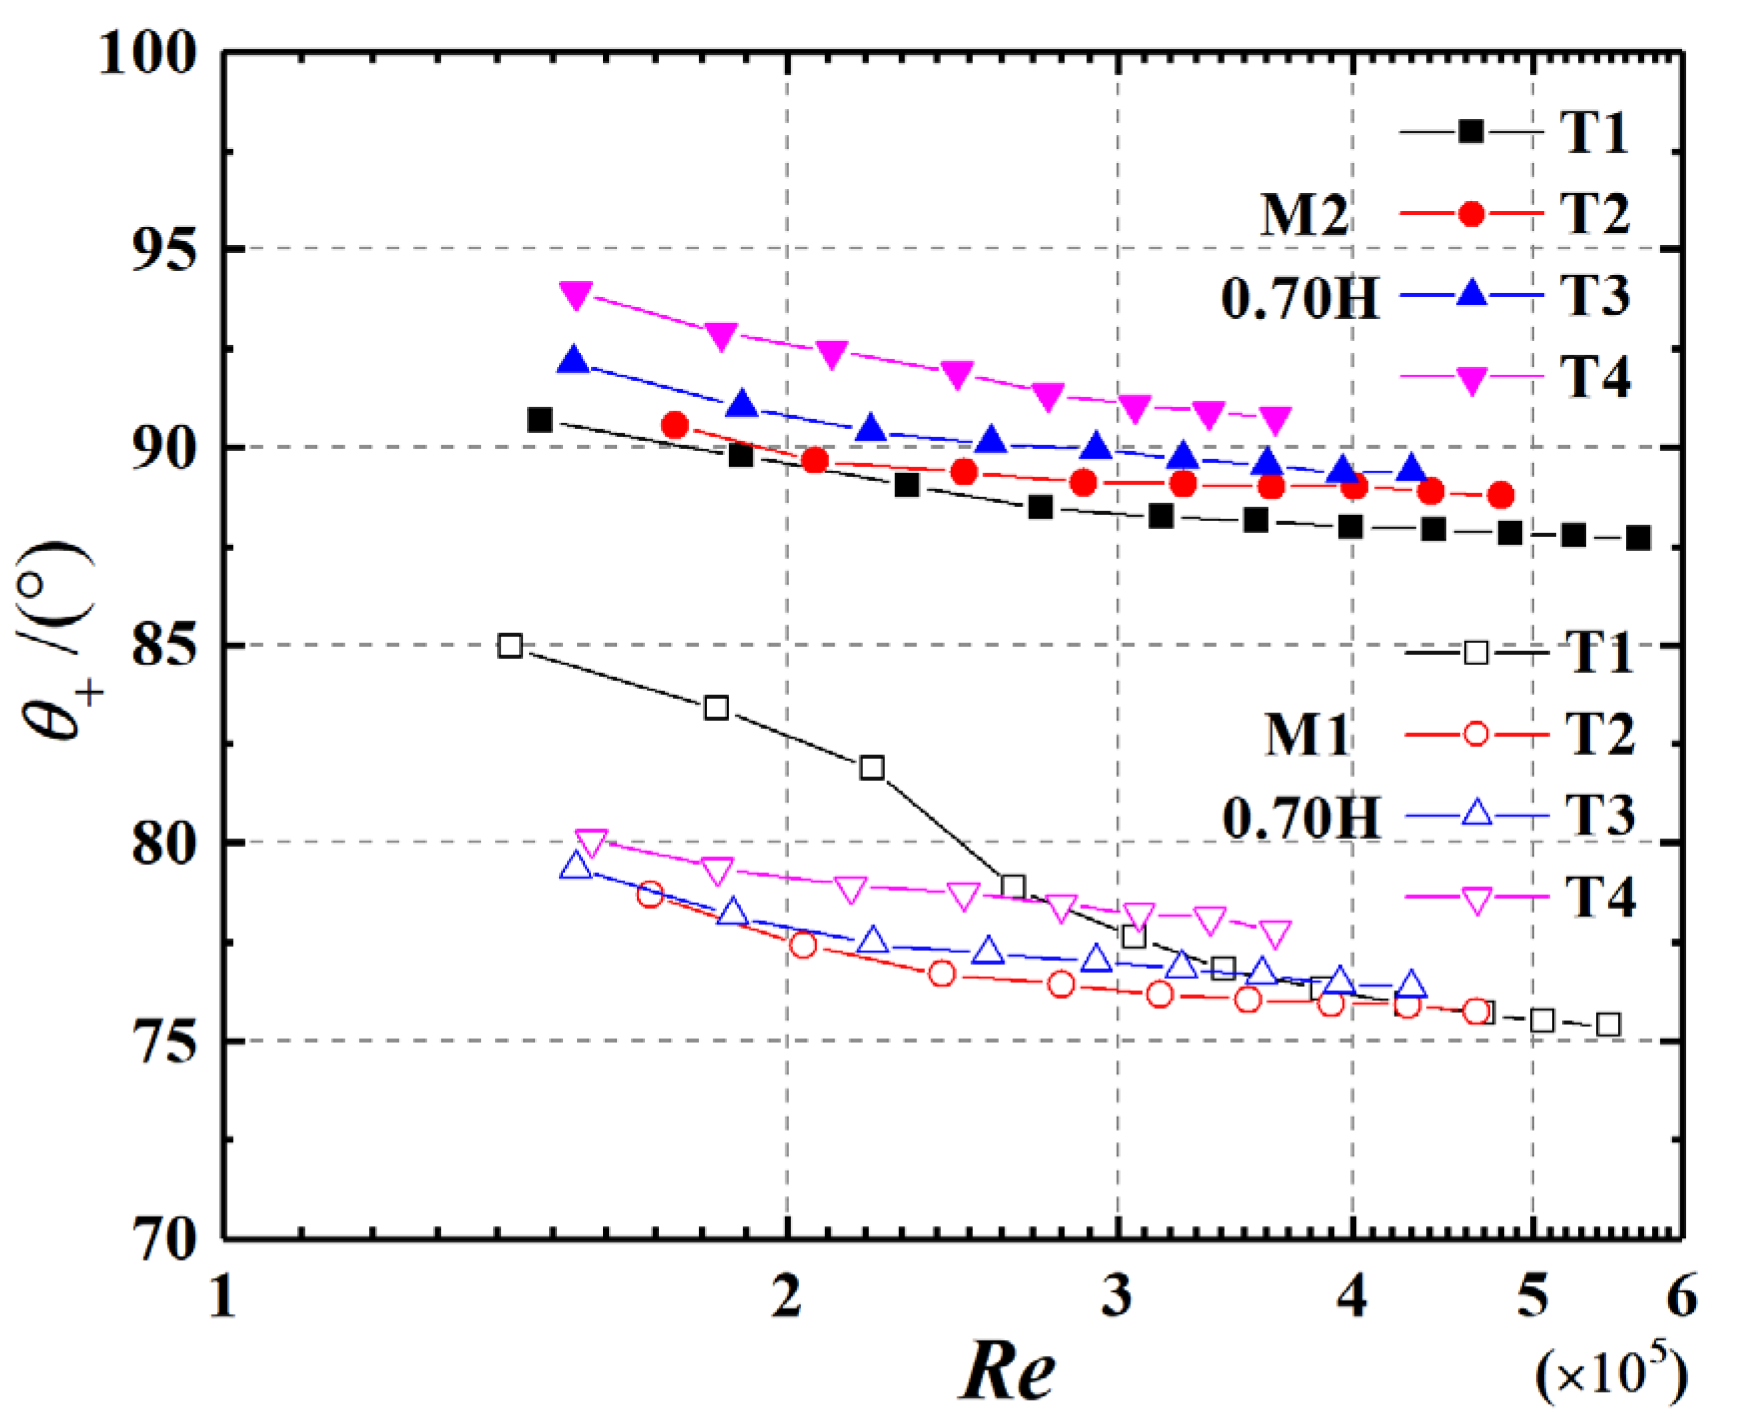
3.3. Positive Pressure Range

Positive pressure on the windward area of low-aspect-ratio cylinders, such as oil tanks, is critical for buckling destruction [42,43]. The zero-pressure angle, which is the angle at which the wind pressure coefficient equals 0, is an important parameter representing the positive pressure range over the windward area [44,45]. The positive pressure range is the sum of the zero-pressure angles on the left and right sides of the cylinder. The fluctuation of the positive pressure range with Re at various heights of models is shown in Figure 9. In general, the positive pressure range decreased with Re, and the value above M2 was greater than M1. For M1, the positive pressure range increased at heights below 0.70 H of the model, but before Re = 2.2 × 10⁵, the value at 0.91 H was the smallest, then tended to be the same as 0.70 H. For M2, the variation of the positive pressure range with Re was similar to M1, and the maximum and minimum values were detected at 0.70 H and 0.91 H, respectively.
The influence of wind fields on the positive pressure range is presented in Figure 10. It was observed that the positive pressure range for M2 increased with turbulence, and similar results emerged for M1, except for the T1 wind field. The results also reveal that AR is the main factor influencing the positive pressure range, which is consistent with the research presented by Zhao [44] and Cao [45].

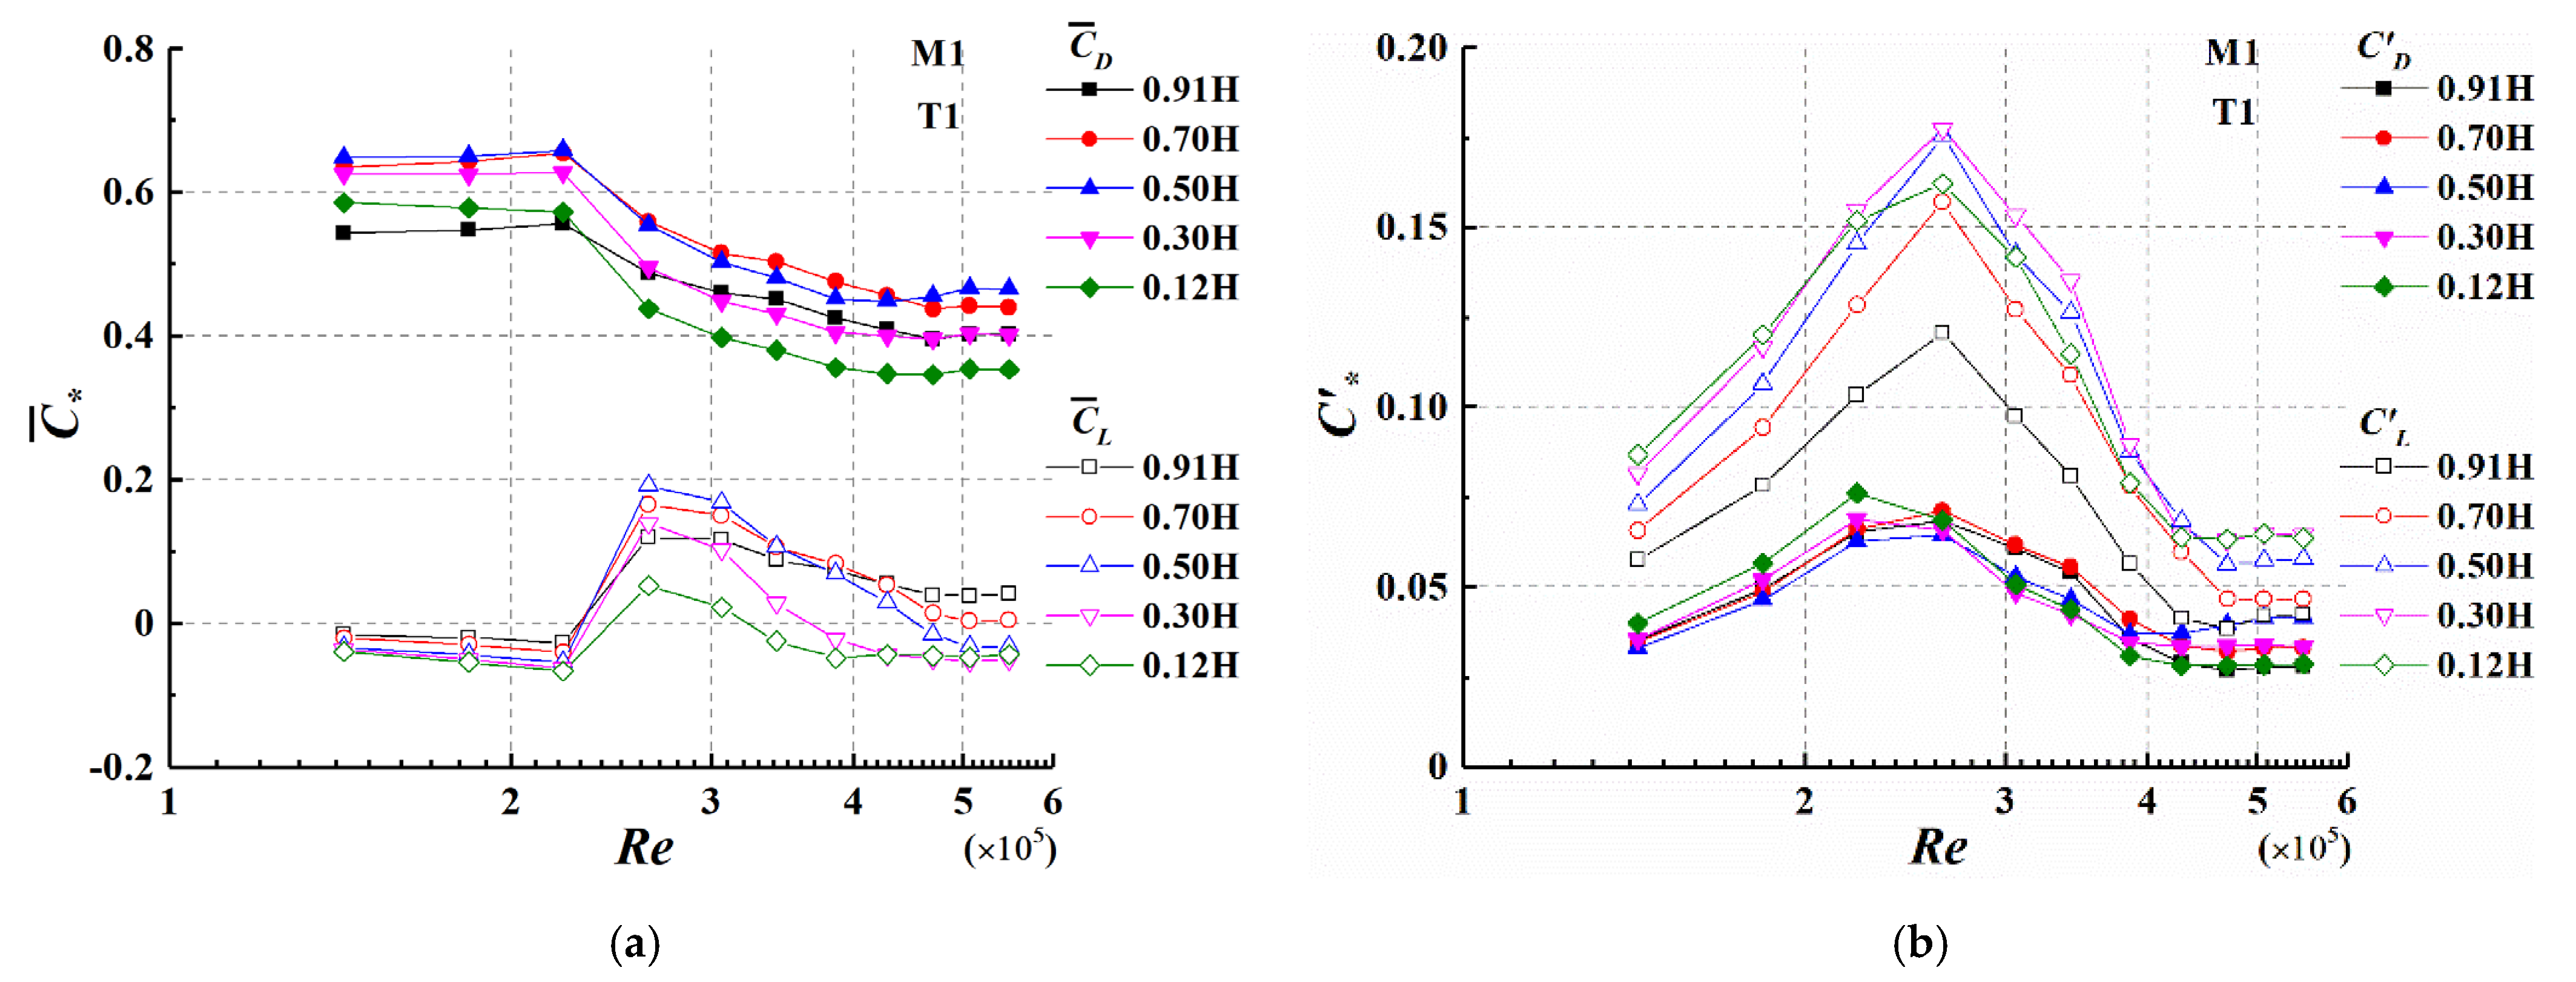
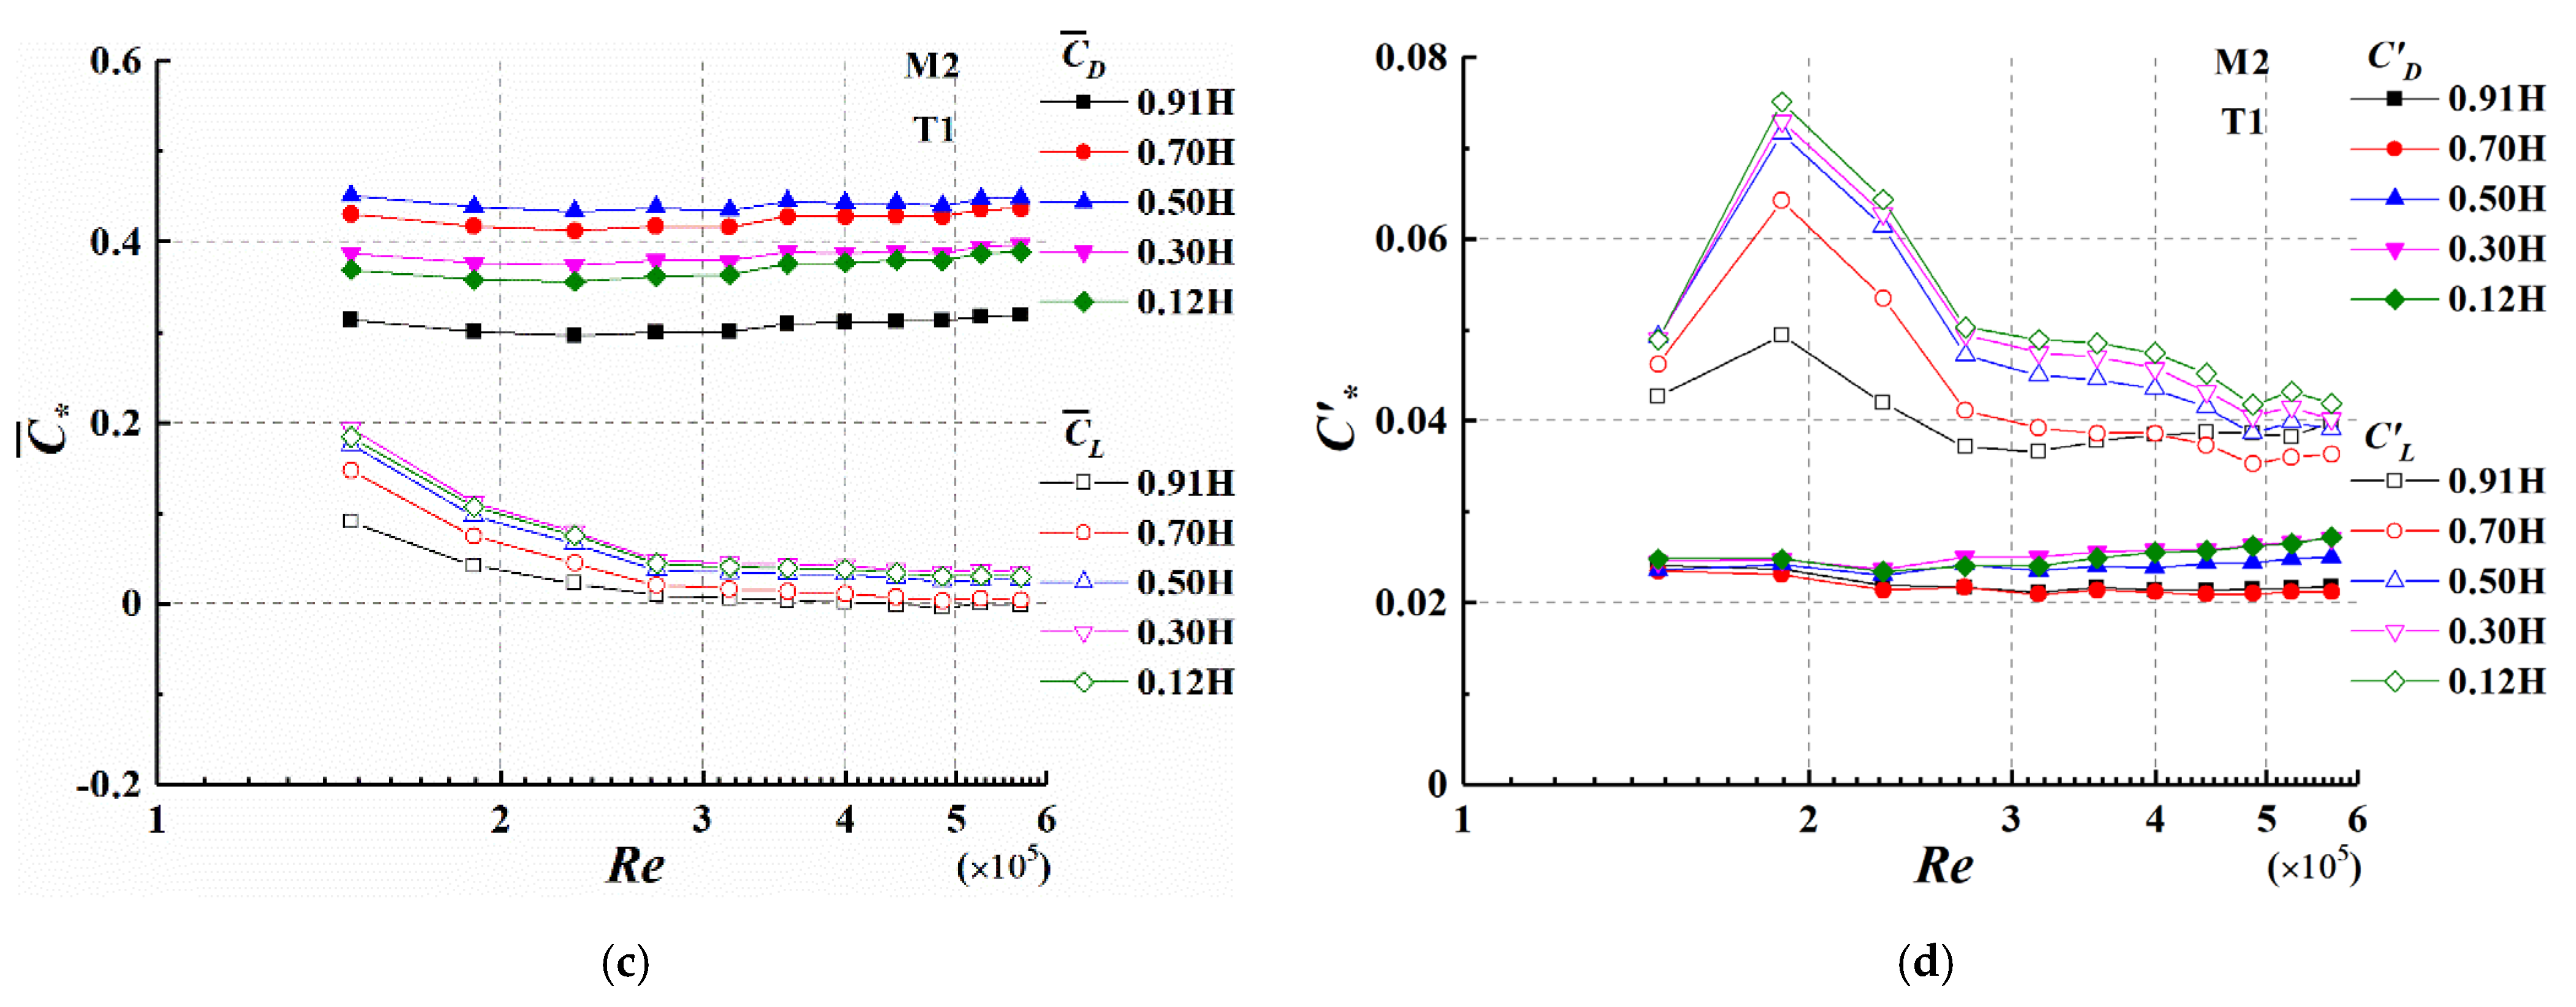
3.4. Local Force Coefficient

Figure 11 shows the mean local force coefficient of low-aspect-ratio cylinders in the smooth flow, as well as previous studies, and the value of C ¯ D and C ¯ L are at 0.5 H of finite length cylinders. For the 2D cylinder [5,8,19], a significant Re effect can be seen. A total of three regimes, subcritical (Re ≤ 2.0 × 10⁵), critical (2.0 × 10⁵ < Re ≤ 4.0 × 10⁵), and supercritical (Re > 4.0 × 10⁵), could also be approximately identified according to the curves. However, the Re effect decreased with decreasing AR for finite length cylinders due to the three-dimensional flow [1], especially when AR = 0.323, where almost no Re effect was observed. For low-aspect-ratio cylinders, the value of C ¯ D was smaller than that of AR = 5.5 [19] and 2D cylinders in subcritical regime, and the variation of C ¯ D also did not change as much as other cylinders under the critical regime. However, the extreme value of C ¯ L could still be observed, which corresponded to the formation of the separation bubble on one side of the cylinder [40].
The local force coefficients at each height of cylinders varying with Re are shown in Figure 12. As can be seen in Figure 12a, for M1, the value of C ¯ D and C ¯ L did not change with Re = 1.4 × 10⁵–2.2 × 10⁵, indicating that the flow on both sides showed subcritical laminar separation, and that the separation points were in fixed position. With Re = 2.2 × 10⁵–2.6 × 10⁵, one side went to the critical regime, the separation point moved backward, and the leeward pressure decreased. The other side was also in laminar separation. This resulted in a decrease for C ¯ D , and since the distribution of wind pressure on both sides was asymmetrical, C ¯ L increased and reached a maximum at Re = 2.6 × 10⁵. With the further increase in Re = 2.6 × 10⁵–4.7 × 10⁵, the other side also went to the critical regime; while C ¯ D was decreasing continuously, the wind pressure on both sides was gradually symmetrical and C ¯ L decreased. In the case of Re = 4.7 × 10⁵–5.5 × 10⁵, C ¯ D and C ¯ L eventually remained constant under the supercritical regime. Furthermore, by comparing the value at each height of M1, C ¯ D and C ¯ L in the middle-upper parts of M1 were larger than at other heights. The value of C D and C L is given in Figure 12b. C L was completely larger than C D , and had a greater value in the middle-lower part of M1, while C D did not change significantly with the height of M1. Meanwhile, C D and C L reached their maximum at around Re = 2.6 × 10⁵, corresponding to one side of M1 went to the critical regime. For M2 in Figure 12c, the Re effect of M2 was not as apparent as that of M1: the value of C ¯ L decreased with Re = 1.5 × 10⁵–3.2 × 10⁵, and then remained stable at nearly 0 while C ¯ D was almost unchanged with Re. In addition, C ¯ D and C ¯ L had a larger value in the middle-upper and middle-lower parts of M2, respectively. The value of C L decreased with height and reached its maximum at Re = 1.9 × 10⁵ (Figure 12d), but C D had no significant change with Re and height.

3.5. Power Spectrum

Figure 13 shows the power spectrum of the local lift coefficient at 0.5 H of models under different Re values. Due to the strong free end effect, low-aspect-ratio cylinders were found not to have significant vortex shedding, unlike slender cylinders [23,46,47]. For M1 in Figure 13a, the flow around the cylinder was in a subcritical laminar separation at Re = 1.8 × 10⁵, and the power spectrum contained energy over a wide frequency band. In the case of Re = 2.6 × 10⁵, the flow had a transition from sub-criticality to criticality, from which a separation bubble appeared on the one side of cylinder, and a peak occurred distinctly at around fD/U = 0.13, which was the frequency of vortex shedding St. With a further increase of Re = 3.1 × 10⁵–5.5 × 10⁵, two separation bubbles were gradually visible, and the spectral peaks became broad and unstable. It can be found that, despite being affected by the end effect, there was still a Karman vortex street around M1, which was consistent with Gonçalves ‘s result [34]. As the same time, the broad spectral peaks at higher Re indicated that vortex shedding occurred under varying flow configurations, adding contributions to the overall spectrum at different Strouhal frequencies, which were not all obtained simultaneously [6]. For M2 in Figure 13b, the power spectrum essentially showed broad spectral peaks in Re = 2.7 × 10⁵–5.7 × 10⁵, indicating that the free end effect was predominant, and the broad spectral peaks were associated with vortex shedding around the free end of the cylinder [34]. The influence of wind fields on the power spectrum of the local lift coefficient is given in Figure 14. With the increase in turbulence, it was clearly seen that there were broad spectral peaks in the power spectrum for two cylinders. The greater turbulence can be cited as the other factor that may affect vortex shedding [41,48].

3.6. Base Force Coefficient

Figure 15 presents the base force coefficient of models under different wind fields. For M1 in Figure 15a, a transition from sub-criticality to criticality was detected in T1, which, unlike the other wind fields, caused a variation in the mean base force coefficient. With increasing turbulence, the flow around M1 went to the supercritical regime at lower Re values [41]. Therefore, the mean base force coefficient in T2, T3, and T4 did not significantly change, and the value of C ¯ J D and C ¯ J L eventually stabilized at around 0.4 and 0, respectively. As for the fluctuating value in Figure 15b, the value of C J L was larger than that of C J D . Meanwhile, C J D and C J L reached their maximum at around Re = 2.6 × 10⁵ in T1, and, correspondingly, one side of M1 went to the critical regime. On the other hand, as the turbulence increased, the variation of C J D and C J L tended to be at a higher Re state, and gradually became insignificant with Re. For M2, the mean and fluctuating value of base force coefficient had almost no Re effect due to the stronger free end effect. With the exception that the value of C ¯ J L in T1 decreased with Re = 1.5 × 10⁵–3.2 × 10⁵ (in Figure 15c), C ¯ J D and C ¯ J L were also stable at around 0.4 and 0, respectively. The fluctuating value C J D , in Figure 15d, did not change with Re, but increased with turbulence. The variation of C J L was similar with C J D in T2, T3, and T4, but it showed an insignificant Re effect at Re = 1.5 × 10⁵–2.7 × 10⁵. It can be found that when turbulence is greater than 4.0%, turbulence and Re have no significant effect on the mean base force of low-aspect-ratio cylinders.

4. Conclusions

In this paper, a wind tunnel test was conducted on smooth low-aspect-ratio cylinders with AR = 0.323 and 0.875, respectively. The influence of parameters, including wind fields, AR, and Re, was analyzed by comparing the coefficient of wind pressure, base pressure, local and base force, etc. for two cylinders. The main conclusions reached as a result of the findings are as follows:
(1)
The cylinder with AR = 0.875 has a significant Re effect, and the distribution of the circular pressure coefficient at different Re shows the process from sub-criticality to super-criticality. However, due to the stronger free end effect, the Re effect for AR = 0.323 is not significant, and the value of the circular pressure coefficient in the negative pressure range is smaller than that of AR = 0.875. In addition, increasing the incoming turbulence causes the wind pressure distribution to be at a higher Re state, that is, the supercritical regime is reached at a smaller Re.
(2)
Aspect ratio is the main factor affecting the value of the base pressure coefficient and positive pressure range. The base pressure coefficient increases with AR, and has a Re effect for AR = 0.875. The positive pressure range decreases with AR and Re, and has large values in the middle-upper part of cylinders. The variation of the base pressure coefficient and positive pressure range also tends to be at a higher Re state as turbulence increases.
(3)
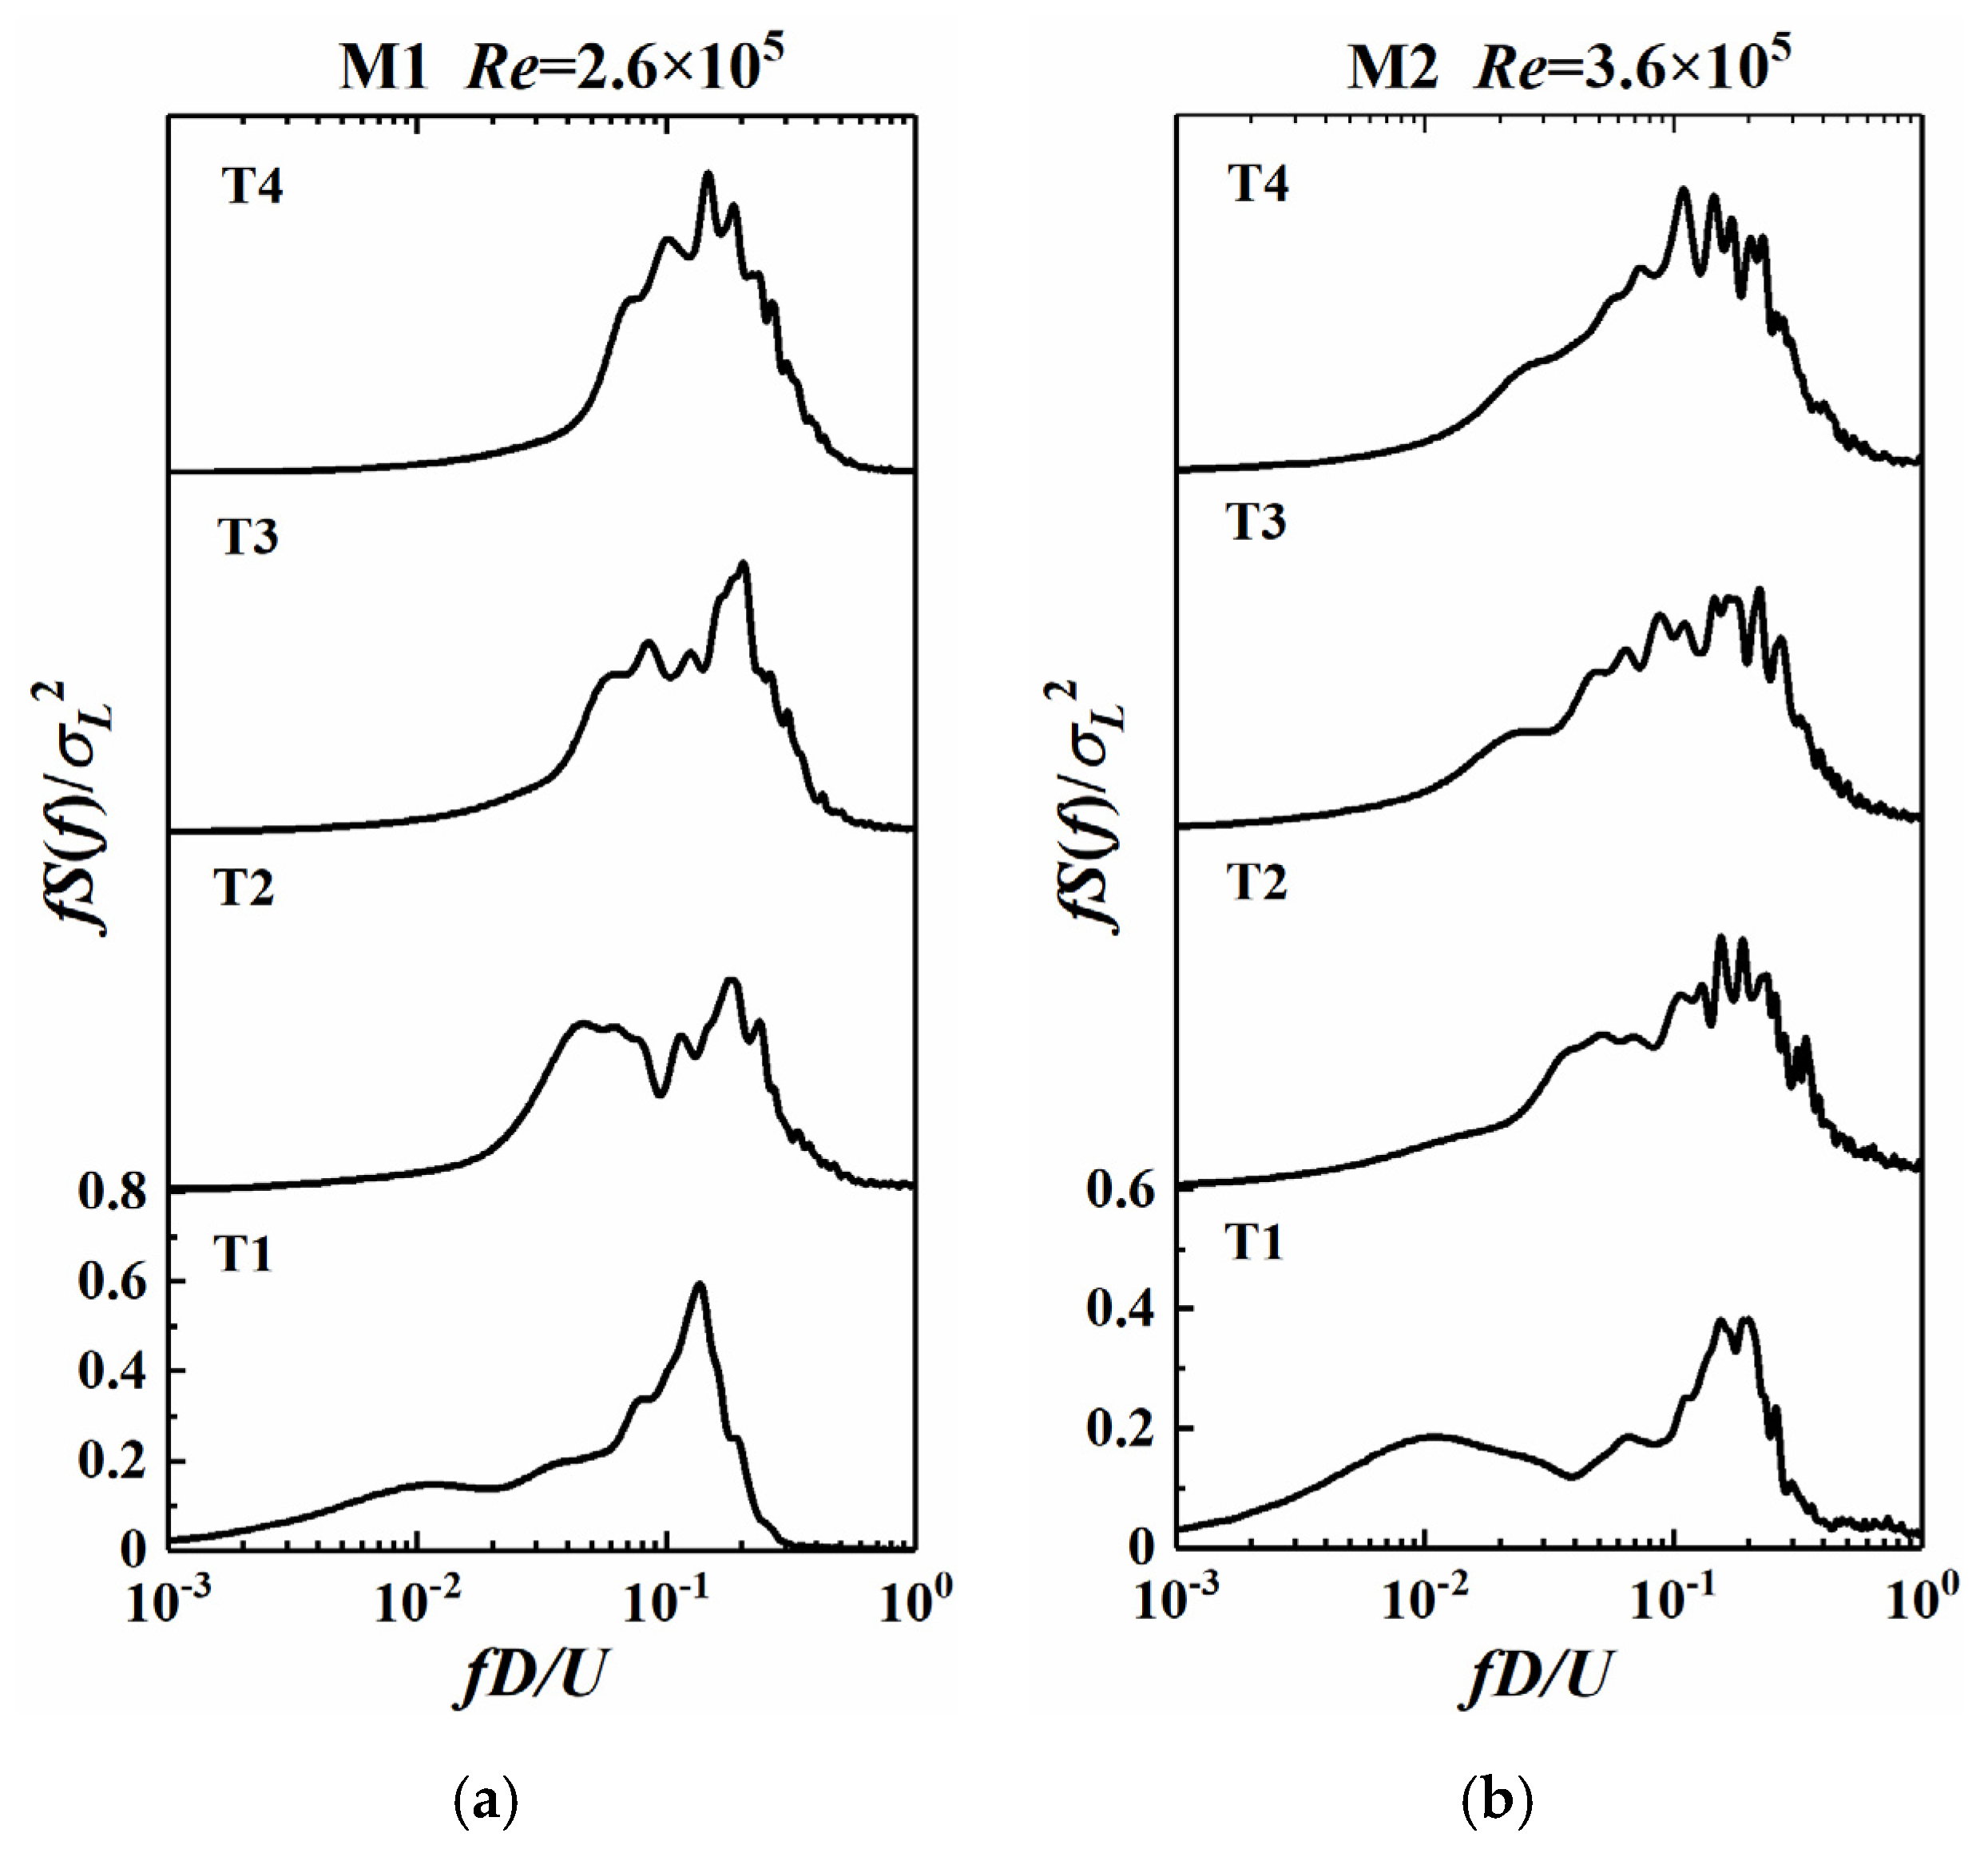
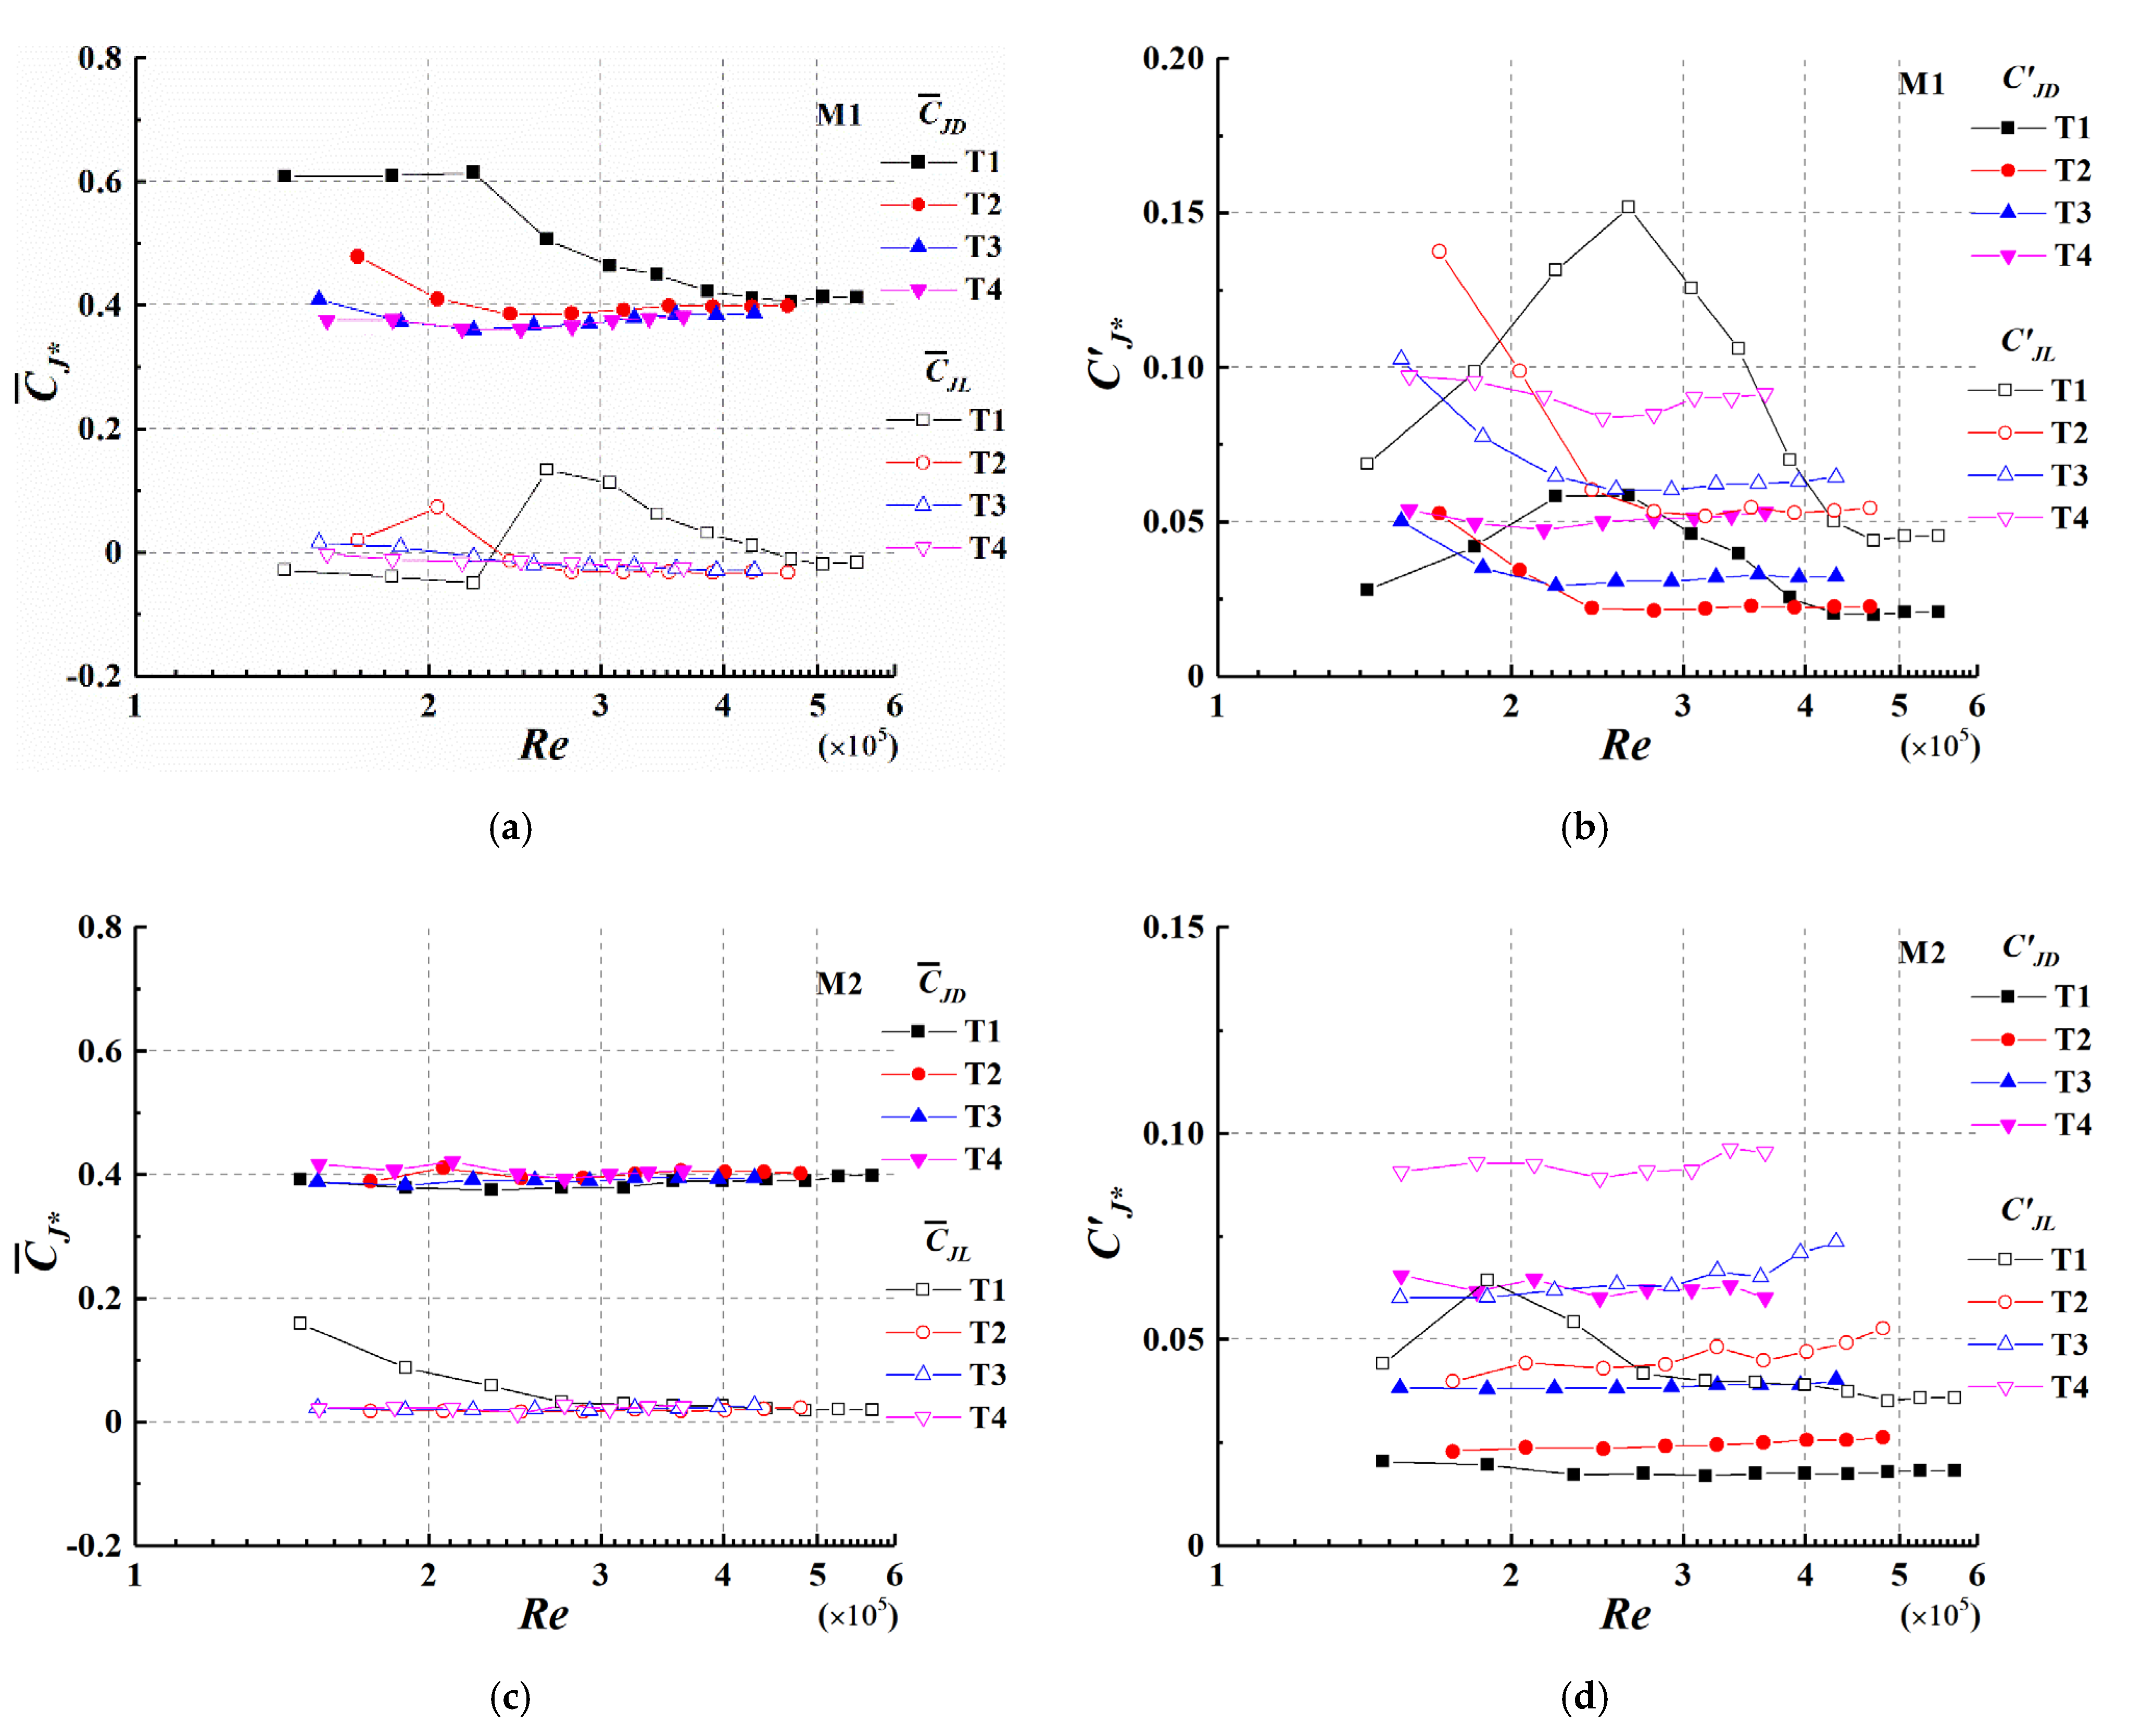
In the transition from sub-criticality to criticality, the local force coefficients for AR = 0.875 vary substantially. The mean value of the drag coefficient decreases in the transition, while the lift coefficient reaches its maximum at Re = 2.6 × 10⁵, corresponding to the separation bubble appearing on one side of the cylinder. The fluctuating value of the drag and lift coefficient also reaches its maximum at Re = 2.6 × 10⁵. However, for AR = 0.323, only the lift coefficient has a Re effect at Re ≤ 2.7 × 10⁵. Due to the influence of the free end and turbulence, which may suppress vortex shedding, the power spectrum of the lift coefficient for two cylinders mainly shows broad spectral peaks with Re and turbulence. In addition, when turbulence is greater than 4.0%, turbulence and Re have little effect on the mean base force coefficient of low-aspect-ratio cylinders.

Author Contributions

Conceptualization, B.L. and Z.H.; methodology, B.L.; software, Y.T.; validation, B.L. and Z.H.; formal analysis, Z.H.; investigation, M.X.; resources, B.L.; data curation, Z.H.; writing—original draft preparation, Z.H.; writing—review and editing, Z.H.; visualization, S.S.; supervision, B.L.; project administration, B.L.; funding acquisition, B.L. All authors have read and agreed to the published version of the manuscript.

Funding

This research is funded by the National Natural Science Foundation of China (51878041), and the 111 project of the Ministry of Education and the Bureau of Foreign Experts of China (B13002).

Institutional Review Board Statement

Not applicable.

Informed Consent Statement

Not applicable.

Data Availability Statement

Please contact the corresponding author.
The authors declare no conflict of interest.

Nomenclature

ReReynolds numberρair density (kg/m3)
ARaspect ratioStStrouhal number
ARcrcritical aspect ratioσL2variance of local lift coefficient
Hheight of cylinders (mm)θ+positive pressure range (°)
Ddiameter of cylinders (mm)Cp,i(t)wind pressure coefficient
hheight above the wind tunnel ground (mm)Pi(t)measured wind pressure (Pa)
Iuturbulence intensity (%) C ¯ P mean wind pressure coefficient
Pstatic pressure (Pa)S(f)power spectral density
VHwind speed at the top of models (mm) C ¯ P b base pressure coefficient
Hktributary height (mm)FD, FLdrag and lift force (N)
Umean wind speed (m/s)CD,k(t), CL,k(t)local force coefficient
Urmean wind speed at reference height (m/s)CJD(t), CJL(t)base force coefficient
θangle between taps and the incoming flow (°) C ¯ D , C ¯ L mean local force coefficient
ffrequency (Hz) C D , C L fluctuating local force coefficient
Nnumber of pressure taps at each layer C ¯ J D , C ¯ J L mean base force coefficient
Mnumber of pressure tap layers C J D , C J L fluctuating base force coefficient

References

  1. Sumner, D. Flow above the free end of a surface-mounted finite-height circular cylinder: A review. J. Fluids Struct. 2013, 43, 41–63. [Google Scholar] [CrossRef]
  2. Demartino, C.; Ricciardelli, F. Aerodynamics of nominally circular cylinders: A review of experimental results for Civil Engineering applications. Eng. Struct. 2017, 137, 76–114. [Google Scholar] [CrossRef]
  3. Derakhshandeh, J.F.; Alam, M.M. A review of bluff body wakes. Ocean Eng. 2019, 182, 475–488. [Google Scholar] [CrossRef]
  4. Bearman, P.W. On vortex shedding from a circular cylinder in the critical Reynolds number régime. J. Fluid Mech. 1969, 37, 577–585. [Google Scholar] [CrossRef]
  5. Achenbach, E.; Heinecke, E. On vortex shedding from smooth and rough cylinders in the range of Reynolds numbers 6 × 10³ to 5 × 10⁶. J. Fluid Mech. 1981, 109, 239–251. [Google Scholar] [CrossRef]
  6. Farell, C.; Blessmann, J. On critical flow around smooth circular cylinders. J. Fluid Mech. 1983, 136, 375–391. [Google Scholar] [CrossRef]
  7. Agrwal, N.; Dutta, S.; Gandhi, B.K. Experimental investigation of flow field behind triangular prisms at intermediate Reynolds number with different apex angles. Exp. Therm. Fluid Sci. 2016, 72, 97–111. [Google Scholar] [CrossRef]
  8. Yao, J.F.; Lou, W.J.; Shen, G.H.; Guo, Y.; Xing, Y.L. Influence of inflow turbulence on the flow characteristics around a circular cylinder. Appl. Sci. 2019, 9, 3595. [Google Scholar] [CrossRef] [Green Version]
  9. Kravchenko, A.G.; Moin, P. Numerical studies of flow over a circular cylinder at Re-D = 3900. Phys. Fluids 2000, 12, 403–417. [Google Scholar] [CrossRef]
  10. Mittal, S. Computation of three-dimensional flows past circular cylinder of low aspect ratio. Phys. Fluids 2001, 13, 177–191. [Google Scholar] [CrossRef]
  11. Inoue, O.; Hatakeyama, N. Sound generation by a two-dimensional circular cylinder in a uniform flow. J. Fluid Mech. 2002, 471, 285–314. [Google Scholar] [CrossRef]
  12. Inoue, O.; Mori, M.; Hatakeyama, N. Aeolian tones radiated from flow past two square cylinders in tandem. Phys. Fluids 2006, 18, 046101. [Google Scholar] [CrossRef]
  13. Dawi, A.H.; Akkermans, R.A.D. Direct and integral noise computation of two square cylinders in tandem arrangement. J. Sound Vib. 2018, 436, 138–154. [Google Scholar] [CrossRef]
  14. Abbasi, S. Effects of blowing location on aeroacoustics of the flow over a circular cylinder. J. Appl. Fluid Mech. 2022, 15, 231–243. [Google Scholar]
  15. Akkermans, R.A.D.; Cieslik, A.R.; Kamp, L.P.J.; Trieling, R.R.; Clercx, H.J.H.; van Heijst, G.J.F. The three-dimensional structure of an electromagnetically generated dipolar vortex in a shallow fluid layer. Phys. Fluids 2008, 20, 116601. [Google Scholar] [CrossRef] [Green Version]
  16. Cieslik, A.R.; Akkermans, R.A.D.; Kamp, L.P.J.; Clercx, H.J.H.; van Heijst, G.J.F. Dipole-wall collision in a shallow fluid. Eur. J. Mech. B Fluid 2009, 28, 397–404. [Google Scholar] [CrossRef]
  17. Norberg, C. An experimental investigation of the flow around a circular cylinder: Influence of aspect ratio. J. Fluid Mech. 1994, 258, 287–316. [Google Scholar] [CrossRef]
  18. Uematsu, Y.; Yamada, M. Effects of aspect ratio and surface-roughness on the time-averaged aerodynamic forces on cantilevered circular-cylinders at high Reynolds numbers. J. Wind Eng. Ind. Aerod. 1995, 55–55, 301–312. [Google Scholar] [CrossRef]
  19. Wang, H.F.; Peng, S.; Zhou, Y.; He, X.H. Transition along a finite-length cylinder in the presence of a thin boundary layer. Exp. Fluids 2016, 57, 57–66. [Google Scholar] [CrossRef]
  20. Frohlich, J.; Rodi, W. LES of the flow around a circular cylinder of finite height. Int. J. Heat Fluid Flow 2004, 25, 537–548. [Google Scholar] [CrossRef]
  21. Pattenden, R.J.; Bressloff, N.W.; Turnock, S.R.; Zhang, X. Unsteady simulations of the flow around a short surface-mounted cylinder. Int. J. Numer. Meth. Fluids 2007, 53, 895–914. [Google Scholar] [CrossRef]
  22. Krajnovic, S. Flow around a tall finite cylinder explored by large eddy simulation. J. Fluid. Mech. 2011, 676, 294–317. [Google Scholar] [CrossRef] [Green Version]
  23. Sakamoto, H.; Oiwake, S. Fluctuating forces on a rectangular prism and a circular cylinder placed vertically in a turbulent boundary layer. J. Fluid Eng. T ASME 1984, 106, 160–166. [Google Scholar] [CrossRef]
  24. Sumner, D.; Heseltine, J.L.; Dansereau, O.J.P. Wake structure of a finite circular cylinder of small aspect ratio. Exp. Fluids 2004, 37, 720–730. [Google Scholar] [CrossRef]
  25. Beitel, A.; Heng, H.; Sumner, D. The effect of aspect ratio on the aerodynamic forces and bending moment for a surface-mounted finite-height cylinder. J. Wind Eng. Ind. Aerod. 2019, 186, 204–213. [Google Scholar] [CrossRef]
  26. Afgan, I.; Moulinec, C.; Prosser, R.; Laurence, D. Large eddy simulation of turbulent flow for wall mounted cantilever cylinders of aspect ratio 6 and 10. Int. J. Heat Fluid Flow 2007, 28, 561–574. [Google Scholar] [CrossRef]
  27. Palau-Salvador, G.; Stoesser, T.; Frohlich, J.; Kappler, M.; Rodi, W. Large eddy simulations and experiments of flow around finite-height cylinders. Flow Turbul. Combust. 2010, 84, 239–275. [Google Scholar] [CrossRef]
  28. Sabransky, I.J.; Melbourne, W.H. Design pressure distribution on circular silos with conical roofs. J. Wind Eng. Ind. Aerod. 1987, 26, 65–84. [Google Scholar] [CrossRef]
  29. Portela, G.; Godoy, L.A. Wind pressures and buckling of cylindrical steel tanks with a conical roof. J. Constr. Steel Res. 2005, 61, 786–807. [Google Scholar] [CrossRef]
  30. Portela, G.; Godoy, L.A. Wind pressure and buckling of grouped steel tanks. Wind Struct. 2007, 10, 23–44. [Google Scholar] [CrossRef]
  31. Tsutsui, T.; Igarashi, T.; Nakamura, H. Fluid flow and heat transfer around a cylindrical protuberance mounted on a flat plate boundary layer. JSME Int. J. B Fluid T 2000, 43, 279–287. [Google Scholar] [CrossRef] [Green Version]
  32. Tsutsui, T.; Kawahara, M. Heat transfer around a cylindrical protuberance mounted in a plate turbulent boundary layer. J. Heat Trans. T ASME 2006, 128, 153–161. [Google Scholar] [CrossRef]
  33. Tsutsui, T. Flow around a cylindrical structure mounted in a plane turbulent boundary layer. J. Wind Eng. Ind. Aerod. 2012, 104, 239–247. [Google Scholar] [CrossRef]
  34. Gonçalves, R.T.; Franzini, G.R.; Rosetti, G.F.; Meneghini, J.R.; Fujarra, A.L.C. Flow around circular cylinders with very low aspect ratio. J. Fluid Struct. 2015, 54, 122–141. [Google Scholar] [CrossRef]
  35. Cunningham, P.; Linn, R.R.; Koo, E.; Wilson, C.J. Large-eddy simulations of air flow and turbulence within and around low-aspect-ratio cylindrical open-top chambers. J. Appl. Meteorol. Clim. 2013, 52, 1716–1737. [Google Scholar] [CrossRef]
  36. Rinoshika, H.; Rinoshika, A. Effect of a horizontal hole on flow structures around a wall-mounted low-aspect-ratio cylinder. Int. J. Heat Fluid Flow 2018, 71, 80–94. [Google Scholar] [CrossRef]
  37. Zhai, X.X. Experimental Simulation of the Wind Field in Atmospheric Boundary Layer Wind Tunnel; Beijing Jiaotong University: Beijing, China, 2011. (In Chinese) [Google Scholar]
  38. Park, C.W.; Lee, S.J. Free end effects on the near wake flow structure behind a finite circular cylinder. J. Wind Eng. Ind. Aerod. 2000, 88, 231–246. [Google Scholar] [CrossRef]
  39. Zdravkovich, M.M. Flow Around Circular Cylinders, Volume 1: Fundamentals; Oxford University Press: Oxford, UK, 1997. [Google Scholar]
  40. Achenbach, E. Distribution of local pressure and skin friction around a circular cylinder in cross-flow up to Re = 5 × 10⁶. J. Fluid Mech. 1968, 34, 625–639. [Google Scholar] [CrossRef]
  41. Blackburn, H.M.; Melbourne, W.H. The effect of free-stream turbulence on sectional lift forces on a circular cylinder. J. Fluid Mech. 1996, 306, 267–292. [Google Scholar] [CrossRef] [Green Version]
  42. Uematsu, Y.; Uchiyama, K. Deflection and buckling behavior of thin, circular cylindrical-shells under wind loads. J. Wind Eng. Ind. Aerod. 1985, 18, 245–261. [Google Scholar] [CrossRef]
  43. Uernatsu, Y.; Yasunaga, J.; Koo, C. Design wind loads for open-topped storage tanks in various arrangements. J. Wind Eng. Ind. Aerod. 2015, 138, 77–86. [Google Scholar]
  44. Zhao, Y.; Cao, Q.S.; Su, L. Buckling design of large circular steel silos subject to wind pressure. Thin Walled Struct. 2013, 73, 337–349. [Google Scholar] [CrossRef]
  45. Cao, Q.S.; Zhao, Y.; Zhang, R. Wind induced buckling of large circular steel silos with various slenderness. Thin Walled Struct. 2018, 130, 101–113. [Google Scholar] [CrossRef]
  46. Kareem, A.; Cheng, C.M.; Lu, P.C. Pressure and force fluctuations on isolated circular cylinders of finite height in boundary layer flows. J. Fluids Struct. 1989, 3, 481–508. [Google Scholar] [CrossRef]
  47. Esfeh, M.K.; Sohankar, A.; Shirani, E. Influence of rounding corners on the wake of a finite-length cylinder: An experimental study. Int. J. Heat Fluid Flow 2021, 91, 108854. [Google Scholar] [CrossRef]
  48. Norberg, C. Interaction between freestream turbulence and vortex shedding for a single tube in cross-flow. J. Wind Eng. Ind. Aerod 1986, 23, 501–514. [Google Scholar] [CrossRef]
Figure 1. Mean wind speed and turbulence profiles.
Applsci 12 05891 g001
Figure 2. Experiment setup in the wind tunnel.
Applsci 12 05891 g002aApplsci 12 05891 g002b
Figure 3. Test models and taps distribution.
Applsci 12 05891 g003
Figure 4. The relationship between wind speed and turbulence intensity on the surface of the platform center.
Applsci 12 05891 g004
Figure 5. The distribution of the wind pressure coefficient at 0.5 H of models under different Re. (a) M1; (b) M2.
Applsci 12 05891 g005
Figure 6. The distribution of the wind pressure coefficient at 0.5 H of models under different wind fields. (a) M1; (b) M2.
Applsci 12 05891 g006
Figure 7. The variation of the base pressure coefficient with Re at different height of models.
Applsci 12 05891 g007
Figure 8. The variation of the base pressure coefficient with Re under different wind fields.
Applsci 12 05891 g008
Figure 9. The variation of positive pressure range with Re at different height of models.
Applsci 12 05891 g009
Figure 10. The variation of positive pressure range with Re under different wind fields.
Applsci 12 05891 g010
Figure 11. The comparison of the mean local force coefficient of circular cylinders in the smooth flow. (a) The mean local drag coefficient; (b) The mean local lift coefficient.
Applsci 12 05891 g011
Figure 12. The variation of the local force coefficient with Re at different height of models. (a) M1, the mean local force coefficient; (b) M1, the fluctuating local force coefficient; (c) M2, the mean local force coefficient; (d) M2, the fluctuating local force coefficient.
Applsci 12 05891 g012aApplsci 12 05891 g012b
Figure 13. Power spectrum of the local lift coefficient at 0.5 H of models under different Re. (a) M1; (b) M2.
Applsci 12 05891 g013
Figure 14. Power spectrum of the local lift coefficient at 0.5 H of models under different wind fields. (a) M1; (b) M2.
Applsci 12 05891 g014
Figure 15. The variation of the base force coefficient of models with Re under different wind fields. (a) M1, the mean base force coefficient; (b) M1, the fluctuating base force coefficient; (c) M2, the mean base force coefficient; (d) M2, the fluctuating base force coefficient.
Applsci 12 05891 g015
Publisher’s Note: MDPI stays neutral with regard to jurisdictional claims in published maps and institutional affiliations.

