Featured Application
This study determines the effects of leakage attributed to conduit defects on the failure behavior on the downstream slope of a homogeneous reservoir. The outcomes of model experiments and three-dimensional deformation–seepage analysis, which were conducted based on the failure shape, pore-water pressure, hydraulic gradient, and settlement, were compared with the changes in the water storage capacity of a failed reservoir owing to conduit defects.
Abstract
This study determines the effects of leakage attributed to conduit defects on the failure behavior on the downstream slope of a homogeneous reservoir. To analyze the failure mechanism, model experiments and a three-dimensional deformation–seepage analysis were conducted based on the failure shape, pore-water pressure, hydraulic gradient, and settlement, and the results were compared with the changes in the water storage capacity of the failed reservoir owing to conduit defects. The comparison showed that failure estimation based on settlement gauges and water storage capacity is limited in its ability to detect rapid changes compared with monitoring methods. An area of potential failure owing to internal erosion was formed at a location that is 1.4–2.4 times the conduit height on the downstream slope. The findings of this study can provide insights for determining the pre-reinforcement required to prevent or minimize reservoir failure due to the fact of leakage.
1. Introduction
In the past, embankment dams were mainly used for irrigation. However, their purposes have diversified to include flood protection, water supply, and electricity generation. In general, more than 70% of dams worldwide are embankment dams, and the history of levee dam construction is much older than that of concrete dams [1]. The old embankment dams were built mainly with earth materials, with many including hydraulic structures such as reservoirs. However, existing embankment dams are currently aging; further, insufficient maintenance of small-scale earthen dams (h < 15 m) often results in failure during heavy rainfall events.
The main causes of earthen embankment dam failure are known to be overtopping (35.9%) and piping (30.5%) [2]. Herein, piping refers to a phenomenon in which soil and water in the embankment zone are discharged to the slope as erosion gradually develops inside the embankment [3,4]. Embankment failure owing to overtopping develops over time depending on soil parameters such as compaction energy, compacted soil moisture, and soil texture [5,6,7]. Internal erosion is associated with a more complex mechanism because it occurs over a long period of time inside the embankment, which fails gradually [8,9]. As the number of reservoirs that have recently reached their embankment life limits increases, the likelihood of internal erosion as a major cause of embankment failure increases. In Korea, the lifetime of a reservoir is estimated to be approximately 50–70 years. The relatively short lifetime of these reservoirs compared with those in other countries is attributed to the poor construction of the reservoirs, which were built under Japanese colonial rule, during the Korean civil war, and during industrialization in the 1940s and 1980s. In addition, reservoirs are frequently damaged on a yearly basis owing to heavy rains due to the fact of seasonal disturbances in Korea. These complex environments make it difficult to predict potential embankment failure.
Embankment failure due to the fact of internal erosion is highly dependent on the physical properties of the soil materials that make up the embankment [5,10]. In particular, the structural defects of the conduit or the material anisotropy with the filling zone at the boundary of the conduit can increase the probability of failure in terms of aggravation of internal erosion. Internal erosion has a time-dependent relationship with soil weakening. Therefore, a cautious approach is needed, because if a conduit cracks, the internal erosion can be accelerated further by an increase in water pressure. In this study, the following three situations were considered for the path of internal erosion:
- (a)
- Long-term internal erosion owing to material anisotropy occurring at the conduit boundary and fill zone (e.g., the Sandae Reservoir) [11];
- (b)
- (Conduit cracks are known to cause structural defects (such as corrosion) in weak areas of the conduit owing to soil and water loads, thus resulting in internal erosion [12,13,14];
- (c)
- The outer part of the conduit may be surrounded by a clay layer for the purpose of reducing the water pressure applied to the conduit. However, at the soil–structure interface, an increase in the degree of compaction and in the clay content can lead to a more severe failure due to the increase in the critical hydraulic gradient [11].
The commonality of these three assumptions indicates that internal erosion extends downstream of the embankment, and the downstream slope can become a hazardous area.
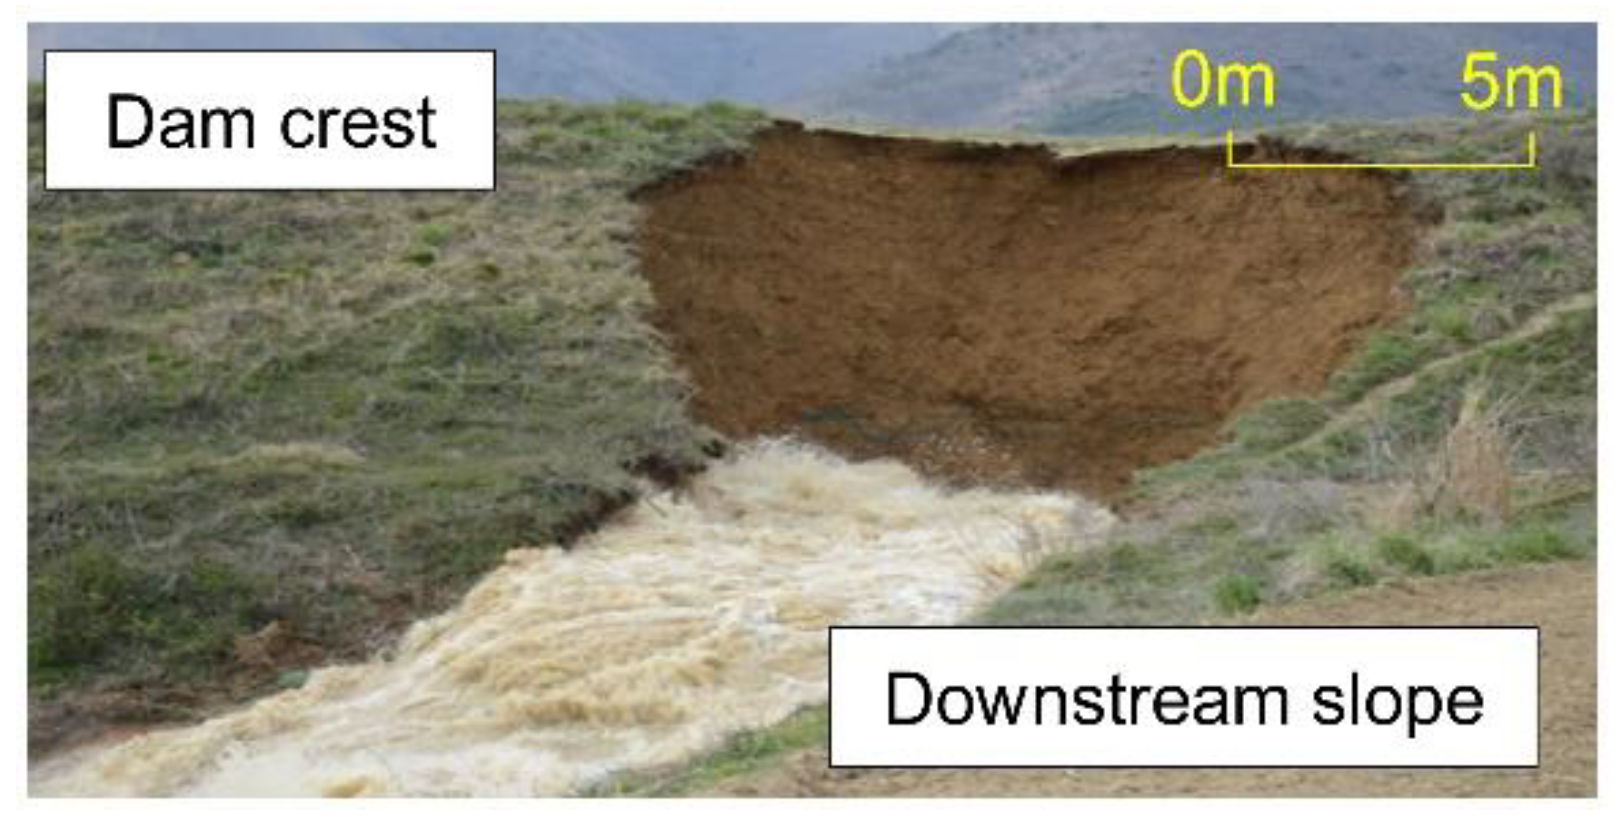
Figure 1 illustrates an example of failure caused by conduit leakage at Korea’s Sandae Reservoir in April 2013 [15]. The Sandae Reservoir is a homogeneous embankment composed of low-plasticity clay. The permeability coefficients in 2003 and 2013 were 2.50 × 10⁻⁸ and 3.57 × 10⁻⁷ m/s, respectively, which is equivalent to a 14.3 times increase. Failure due to the fact of internal erosion resulted in a circular concave shape dug out around the conduit on the downstream slope, which gradually expanded to the top of the embankment. The failure width of the embankment, which started on the slope around the conduit, was approximately 12.2 m. Furthermore, the time that elapsed from the moment at which the leaked water appeared on the downstream slope until failure occurred was approximately 3 h, which is extremely short. These results show that homogeneous earthen dams have little resistance to leakage, suggesting that appropriate mitigation measures need to be taken through a pre-reinforcement approach for vulnerable areas based on an understanding of the structural defects of conduits.

Figure 1.
Leakage due to the presence of conduit defects (Sandae Reservoir, 2013).
Therefore, a large-scale indoor model experiment was performed to investigate the effect of internal erosion on the filling zone’s erosion width and depth and on the failure expansion in the area where conduit cracks are present. The experiment modeled the conduit for conditions in which seepage could occur and examined the failure time based on the measured values for the failure shape, pore-water pressure, and settlement. To ensure their reliability, these results were compared with the results of a three-dimensional, fully coupled seepage–deformation analysis and with the failure outcomes of the Sandae Reservoir.
2. Materials and Methods
2.1. Model Reservoir
In embankments exceeding 50 years of age in Korea, filters are often nonfunctional owing to their age [16]. Aging filters may either completely lack filters to protect the embankment or may have inadequate filters according to modern design standards [2]. Additionally, a previous study found that 25% of internal erosion failures were due to the fact of inadequate filtration within the embankment [17,18]. These studies reveal problems with filter design in older reservoirs and explain the difficulty in ensuring the long-term normal performance of filters from erosion or filter clogging, as the risk of potential failure of the embankment is high in these environments.
However, if a crack occurs in the conduit, the risk of failure may be considerably high. Nearly one-third of internal erosion failures are closely related to backward erosion piping; the finding that half of them develop erosion along the conduit or foundation contact or as internal erosion along the foundation contact is a reminder of the importance of conduit structures [16].
Therefore, in this study, an experimental model comprising a homogeneous embankment was configured to investigate the occurrence of failures on the embankment slope owing to conduit leakage. The experimental model was designed as a prototype at a scale of 1:20. The height, width, and length of the model were 76, 126, and 540 cm, respectively. The model slope inclinations (vertical distance: horizontal distance) were 1.0:2.0 and 1.0:2.5 in the downstream and upstream slopes, respectively.
The guidelines stipulate a high homogeneity of geotechnical properties for construction materials to control infiltration in the design of an earthen dam. In the design and analysis of earthen dams, the permeability coefficient is assumed constant regardless of the depth and location of the embankment; however, in practice, it is nonhomogeneous and anisotropic [17,18]. This inhomogeneity and anisotropy, along with many variables, complicate the seepage flow within the embankment. Therefore, in this study, the following two methods were considered for model construction:
- (a)
- For the model embankment, only soils that passed through a 12 mm sieve were used to ensure that the specimens could be laid homogenously. Additionally, the compaction moisture content was adjusted to the optimal moisture content (14 ± 2%);
- (b)
- To achieve a uniform density, each layer had an approximate thickness of 10 cm, and the compaction was made with a vibrating machine (frequency: 9000–12,000, 50 Hz) until approximately 90% of the maximum dry density was reached.
As described above, the permeability coefficient of the embankment zone is considered isotropic due to the controlled soil particle size and compaction process. However, at the boundary between the conduit and embankment zone, soil erosion or loss occurs, possibly increasing the change in velocity head. Accordingly, while anisotropy is unavoidable around the conduit, erosion due to the homogenization of the embankment zone can yield consistent results.
Table 1 lists the physical and mechanical properties of the soils used in the experiments. All values listed in Table 1 were obtained by laboratory tests, with each value calculated according to American Society for Testing and Materials (ASTM) standards.

Table 1.
Geotechnical properties of the tested materials.
2.2. Measurement Location and Experimental Conditions
The model experiment simulated the phenomenon in which seepage water flows along the boundary of a cracked conduit and concentrates on the downstream slope, thus resulting in a backward piping phenomenon owing to internal erosion. Regarding the drainage zone, no filter was applied to the embankment model, similar to the condition of the Sandae Reservoir. Figure 2 shows the model dimensions and the locations wherein the measurement gauges were installed. Pore-water pressure gauges (rated capacity: 50 kPa) were installed in each section (P1–P6) below and above the conduit. The settlement gauge was installed in the center of the dam crest. The conduit was placed in the middle of the embankment (width: 63 cm). The model conduit was a plastic perforated pipe (length: 246 cm) comprising holes (φ: 50 mm; spacing between holes: 60 mm) for inducing erosion.
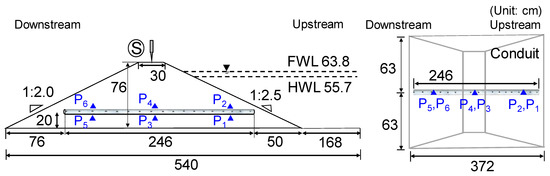
Figure 2.
Measurement location and experimental cross-sectional configuration (unit: cm).
The modeled holes were vertically spaced in four positions: above and below and to the left and right sides of the conduit. The conduit was embedded in the embankment, and the inlet and outlet of the conduit were open to model conduit leaks. Information regarding crack and defect locations in the actual conduit may be unclear, as it depends on the structural conditions of each reservoir conduit. However, long-term leakage at the boundary of the conduit is likely to act in the downstream direction along the infiltration path in the embankment and may cause failure on the downstream slope (e.g., the Sandae Reservoir). Accordingly, in this experiment, a conduit model was configured for leakage owing to erosion to reach the downstream side.
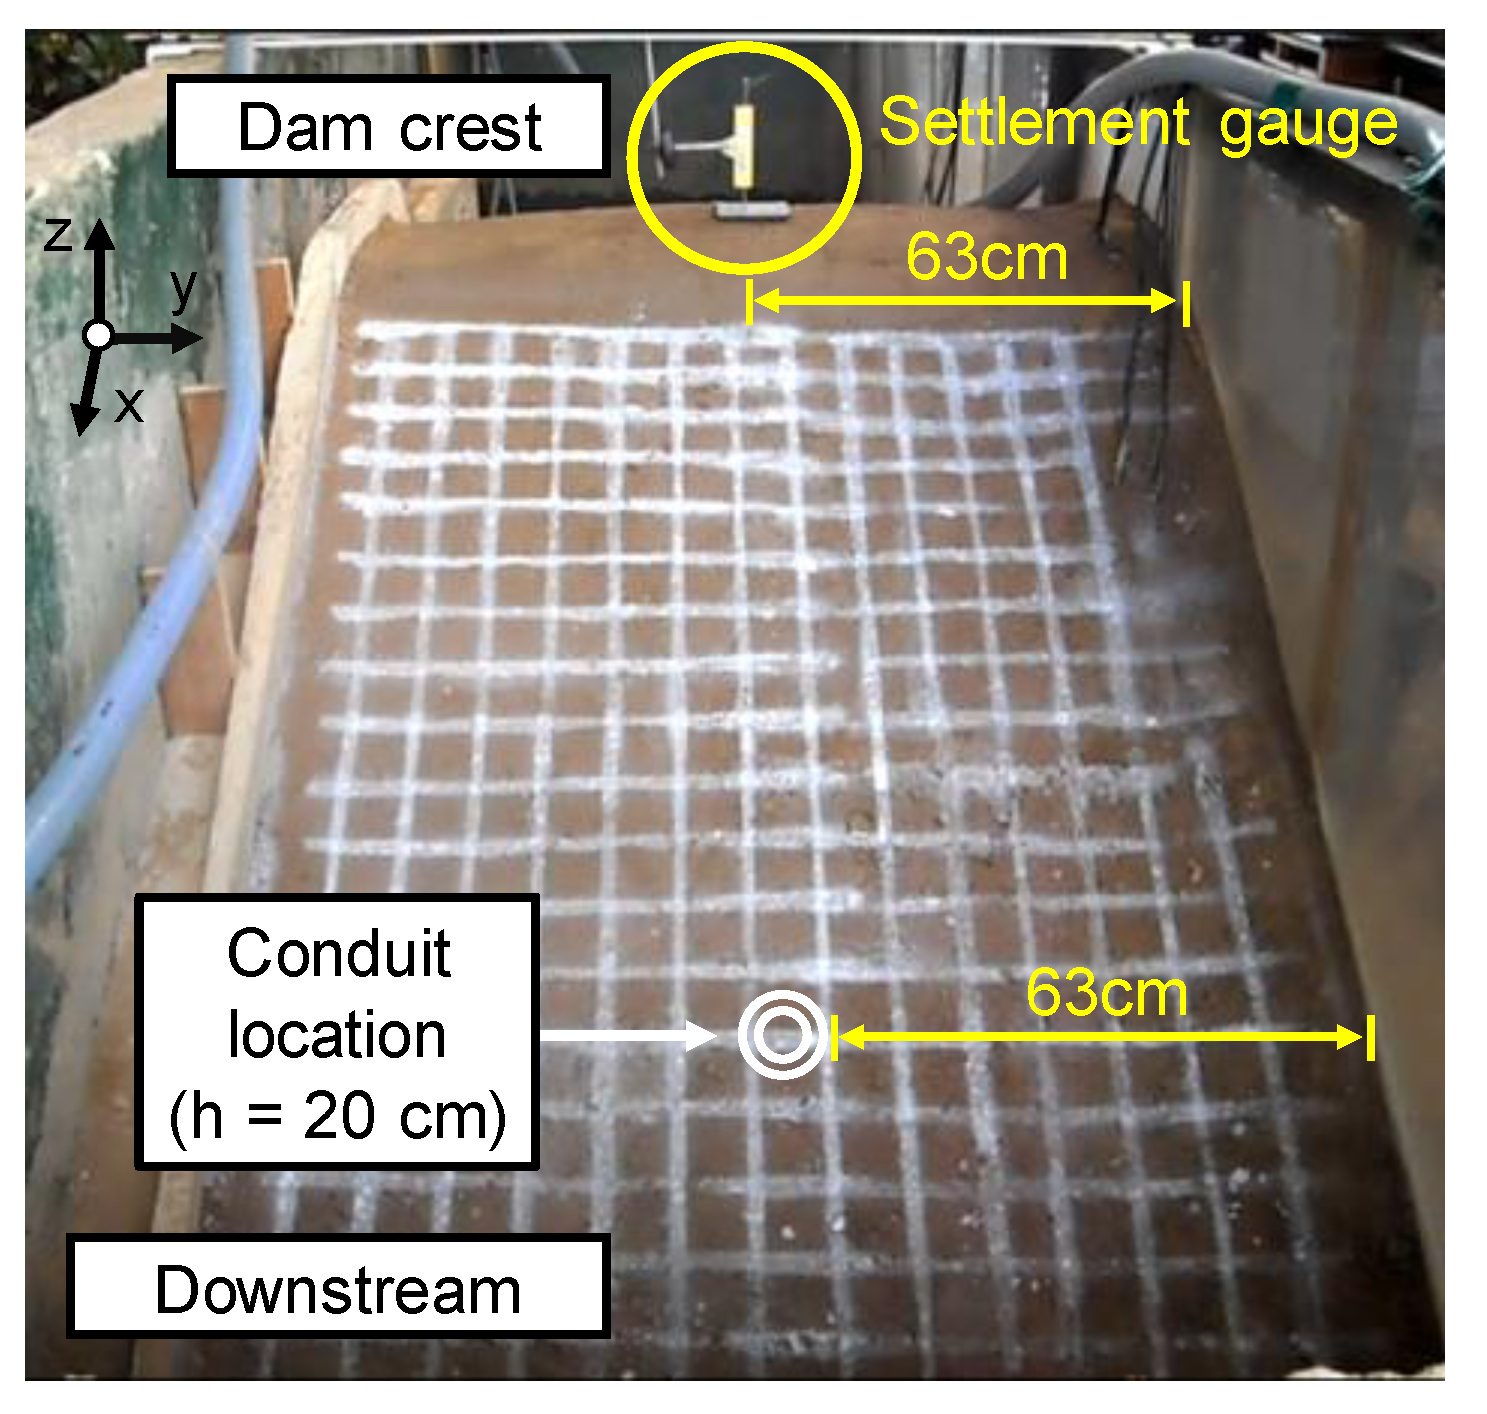
The initial condition of the model embankment was a compaction degree of ~90%. Upstream water level conditions were supplied through a water supply device to maintain high-water levels. The monitoring time was the interval from the time the upstream water level reached the high-water level (HWL) (t = 0–30 min) until the time at which the downstream slope failed. Figure 3 shows the position of the downstream slope in the initial state and the location of the settlement gauge at the dam crest. A white grid was configured to identify deformations on the downstream slope. The settlement gauge (specifications: 50 mm) was located at the same point (center of the dam crest) where the conduit was installed (63 cm from the y-axis). All measurements were automatically recorded by a data logger and a computer, and all the processes were filmed with a video camera to analyze the failure.
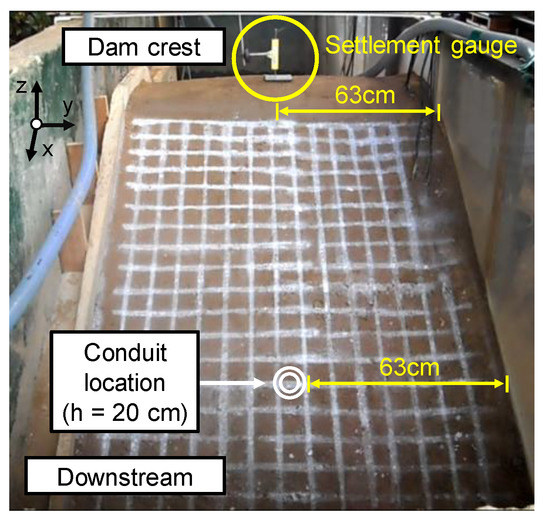
Figure 3.
Position of the downstream slope in the initial state and the location of the settlement gauge at the dam crest.
3. Results and Discussion
3.1. Embankment Failure Shape
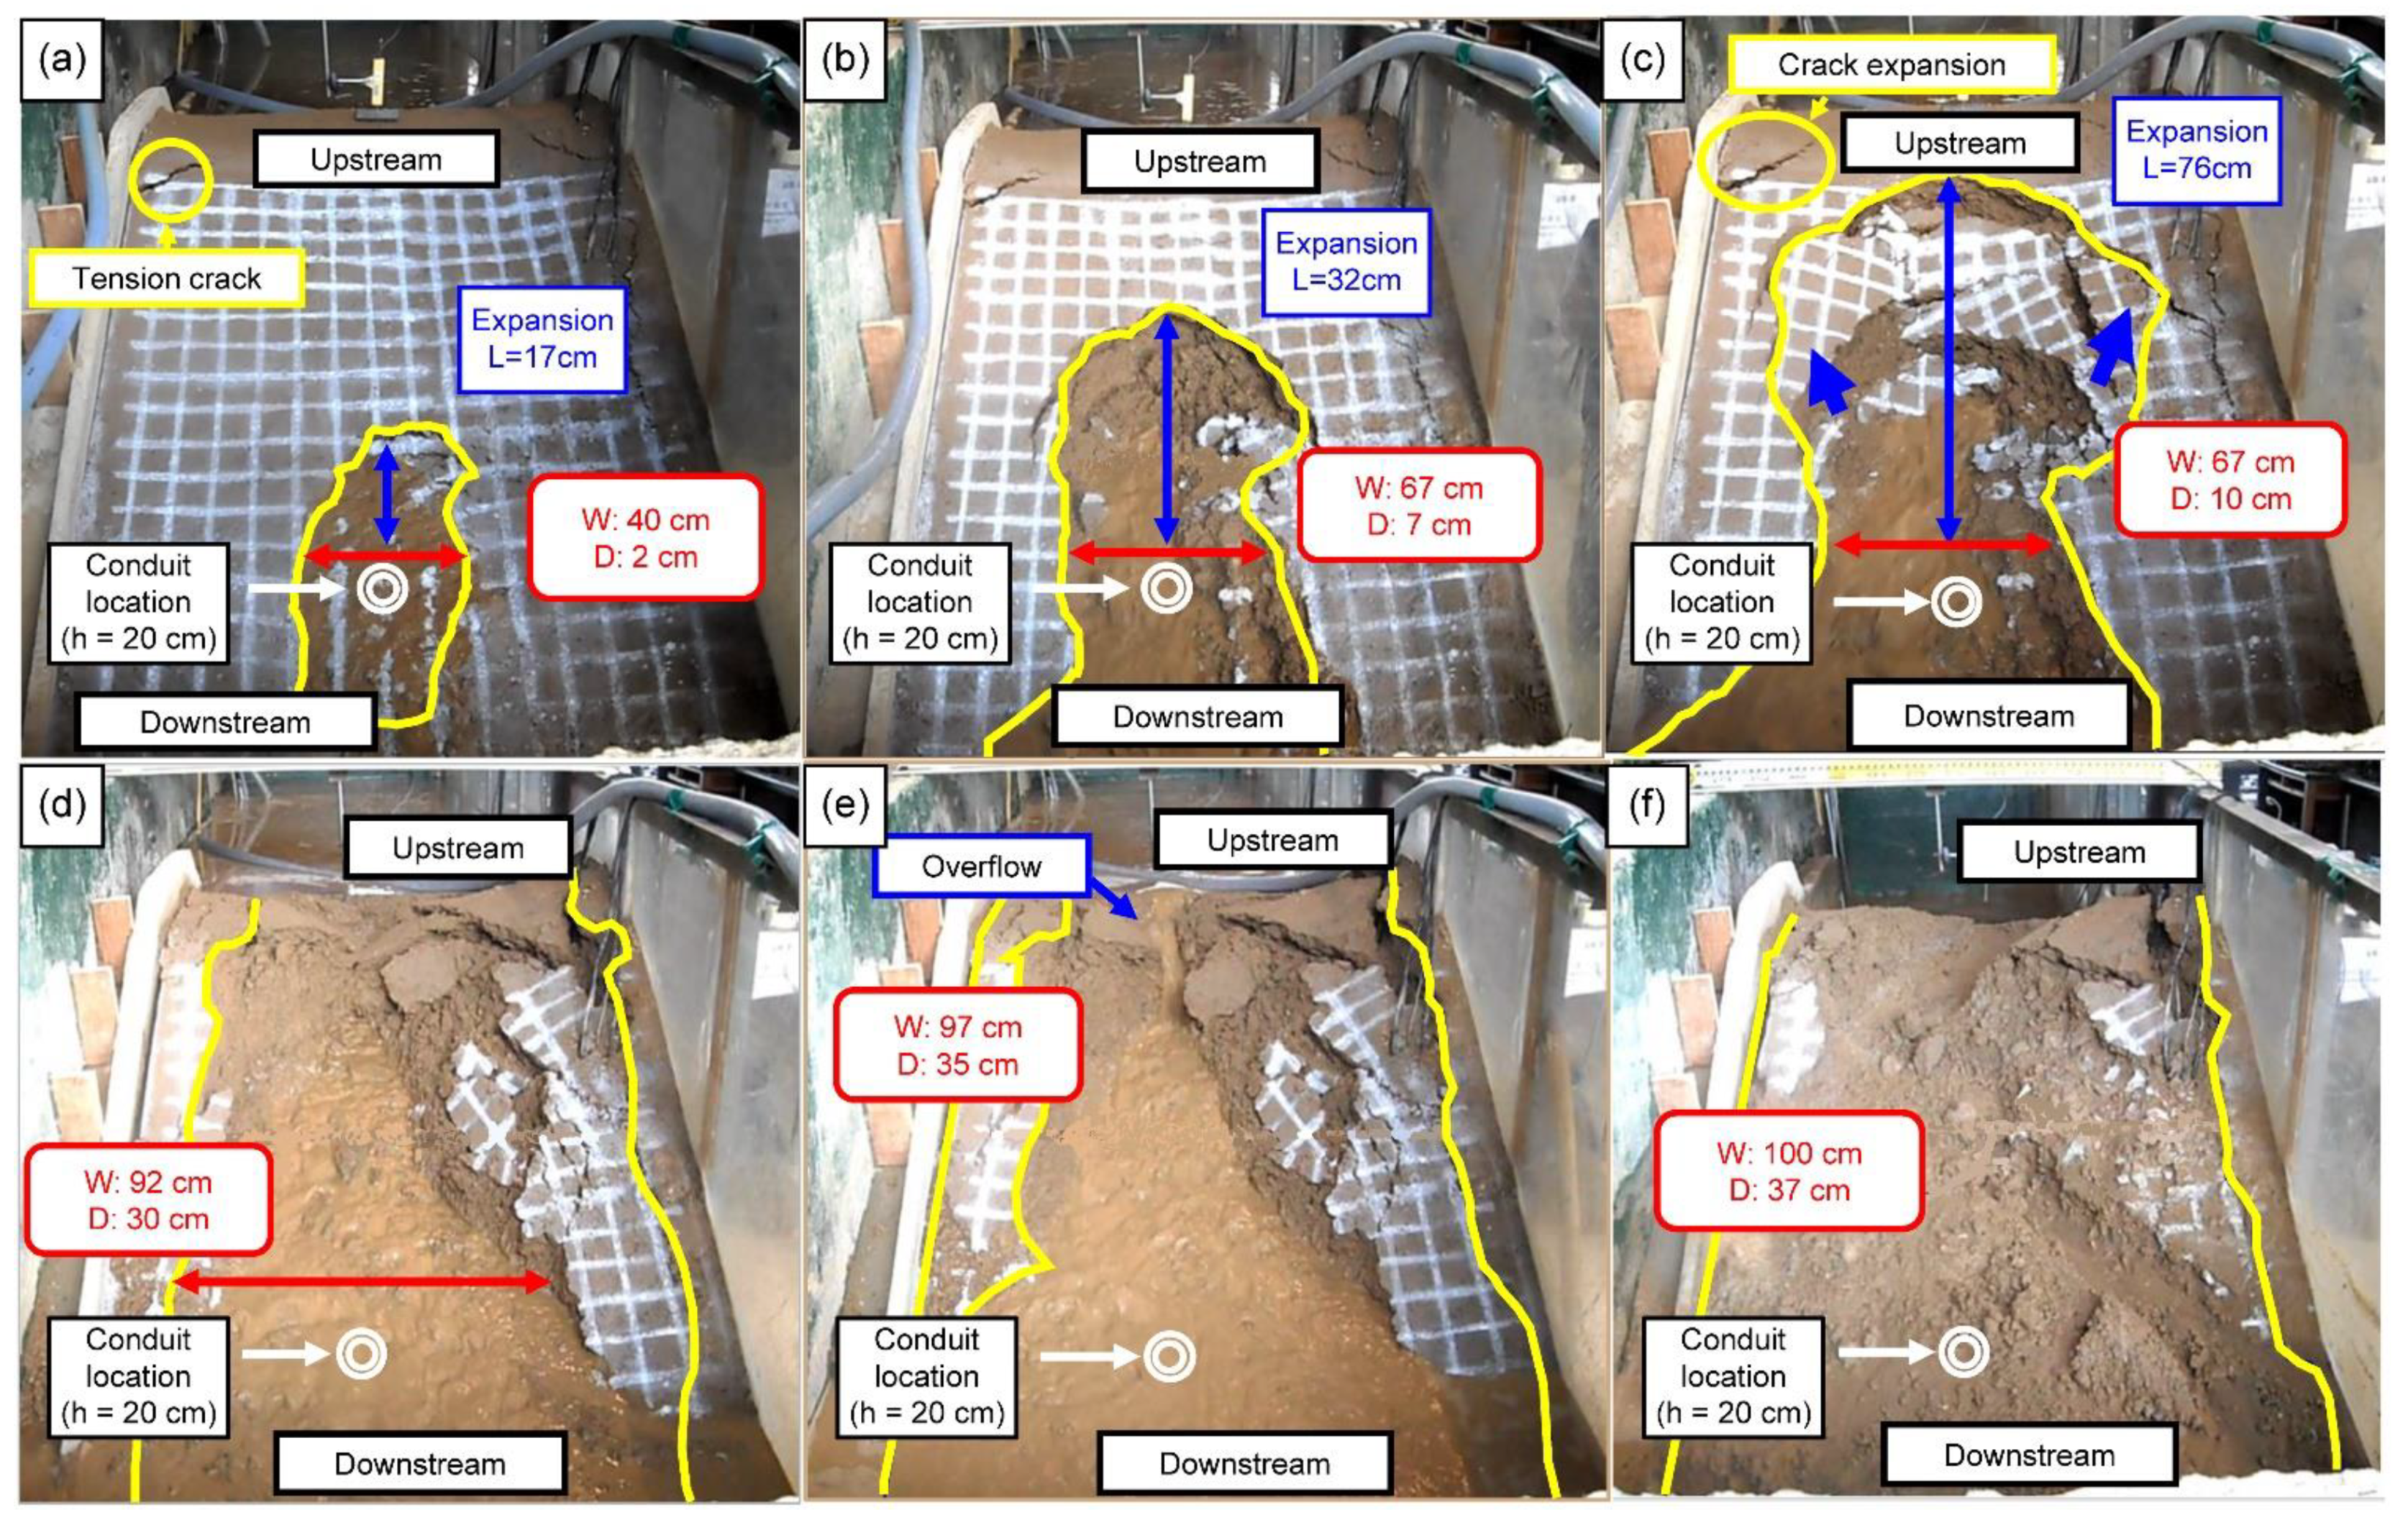
One of the reasons for the failure of deteriorated earthen embankments is the movement of soil particles at the conduit–embankment interface; this failure initiates internal erosion when conduit cracks and joints are deformed. As the leakages from the cracks in the conduit flow downstream along the conduit boundary, the downstream embankment can become a risk zone for failure. Estimating the risk zones provides important information for future embankment pre-reinforcement plans. In this study, the risk zone was estimated based on the failure process and shape at the downstream slope. Figure 4 shows the process from the onset of deformation on the downstream slope (t = 155 min), owing to leakage, to the time the embankment failure occurred (t = 180 min). After reaching the full-water level (FWL), the time (t = 0–155 min) at which the deformation was not visible on the downstream slope was excluded (see Figure 4). The process was divided into the following: (a) initial (t = 155 min), (b) progress (t = 157 min), (c) rapid development (t = 158 min), (d) dam crest failure (t = 165 min), (e) overflow (t = 168 min), and (f) complete failure (t = 180 min) stages. Table 2 presents an overview of the failure process on the downstream slope according to the progression of the internal erosion, which was based on the height (h = 20 cm), at the site where the conduit was located. The pattern of slope failure due to the presence of conduit defects was characterized by the gradual extension from the lower area of the embankment, where the conduit was located to the dam crest side. By contrast, the slope failure caused by overtopping was completely different from that of the failure due to the presence of conduit defects, as the slope failure occurred from the dam crest to the lower part of the embankment. As the strength of the embankment was maintained at the initial stage of slope failure owing to overtopping, gradual step-like erosion appeared on the downstream slope [5]. However, in this experiment, gradual step-like erosion was not observed in the overtopping phase (t = 168 min). From these results, it is presumed that the strength of the embankment was already lost owing to the many deformations that occurred on the downstream slope before overtopping. Based on these results, the following can be inferred:

Figure 4.
Process of embankment failure due to the fact of piping: (a) initial (t = 155 min); (b) progress (t = 157 min); (c) rapid development (t = 158 min); (d) dam crest failure (t = 165 min); (e) overflow (t = 168 min); (f) complete failure (t = 180 min) stages.
Table 2.
Failure process outcomes on the downstream slope.
- (a)
- Leakage due to the presence of conduit defects primarily weakens the strength of the downstream slope. Accordingly, when secondary overtopping occurs, the slope failure can be accelerated;
- (b)
- From a disaster warning and response point of view, a failure due to the presence of conduit defect may allow for more adverse conditions to respond to a disaster than failure due to the fact of overtopping.
In the case of slope failure owing to overtopping and conduit defects, qualitative comparisons cannot be easily conducted, because the physical properties and environment of each reservoir are different with respect to failure time, failure scale, and deformation level. However, failure due to the presence of conduit defects suggests that the potential risk may be relatively high compared with overtopping disasters because deformations originating inside the embankment are not identified.
Figure 5 presents the process of forming the vulnerable part of the downstream slope based on the erosion depth (D), erosion width (W), and the length of expansion attributed to erosion (L). Herein, the erosion depth is the maximum perpendicular distance to the slope when the slope fails owing to deformation. The erosion width is the maximum distance when deformation occurs along the horizontal direction on the slope where the conduit is located. The erosion length is the maximum distance when deformation occurs parallel to the dam crest from the slope where the conduit is located. The failure in the downstream slope occurred in the following sequence. The erosion depth was observed first. Subsequently, the erosion width showed a tendency to develop as the erosion length extended to the top of the slope.
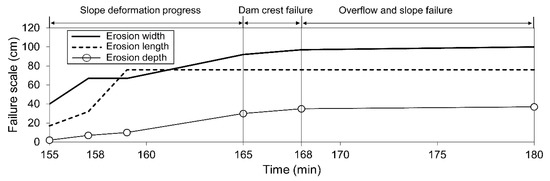
Figure 5.
Erosion width (W), erosion depth (D), and expanded length (L) at the downstream slope.
The erosion width and depth exhibited a tendency to gradually increase (up to 168 min), but the erosion length converged at 157 min. The convergence of the erosion length means that on the slopes, the deformation is rapidly progressing and no longer expands. Although the length and width in cross-sections at the downstream slope were almost the same, the rapid convergence results of the erosion length show that it was more sensitive to volumetric deformation owing to leakage compared to erosion width. Considering the monitoring and erosion scale results, the erosion depth was estimated to be an important factor influencing the deformation in the downstream slope for the first time. The erosion depth estimation was based on the results of a previous study in which cavitation due to the fact of internal erosion was found in the defective area of the conduit [15]. Specifically, changes in the erosion depth can be considered as cavities are formed by internal erosion, which are concentrated at the conduit boundary, and eventually collapse over time. Therefore, the experimental results obtained in this study suggest that methods used to control or suppress the erosion depth to address the problem caused by conduit defects may be important for disaster prevention in deteriorated reservoirs.
3.2. Pore-Water Pressure (PWP) Variations
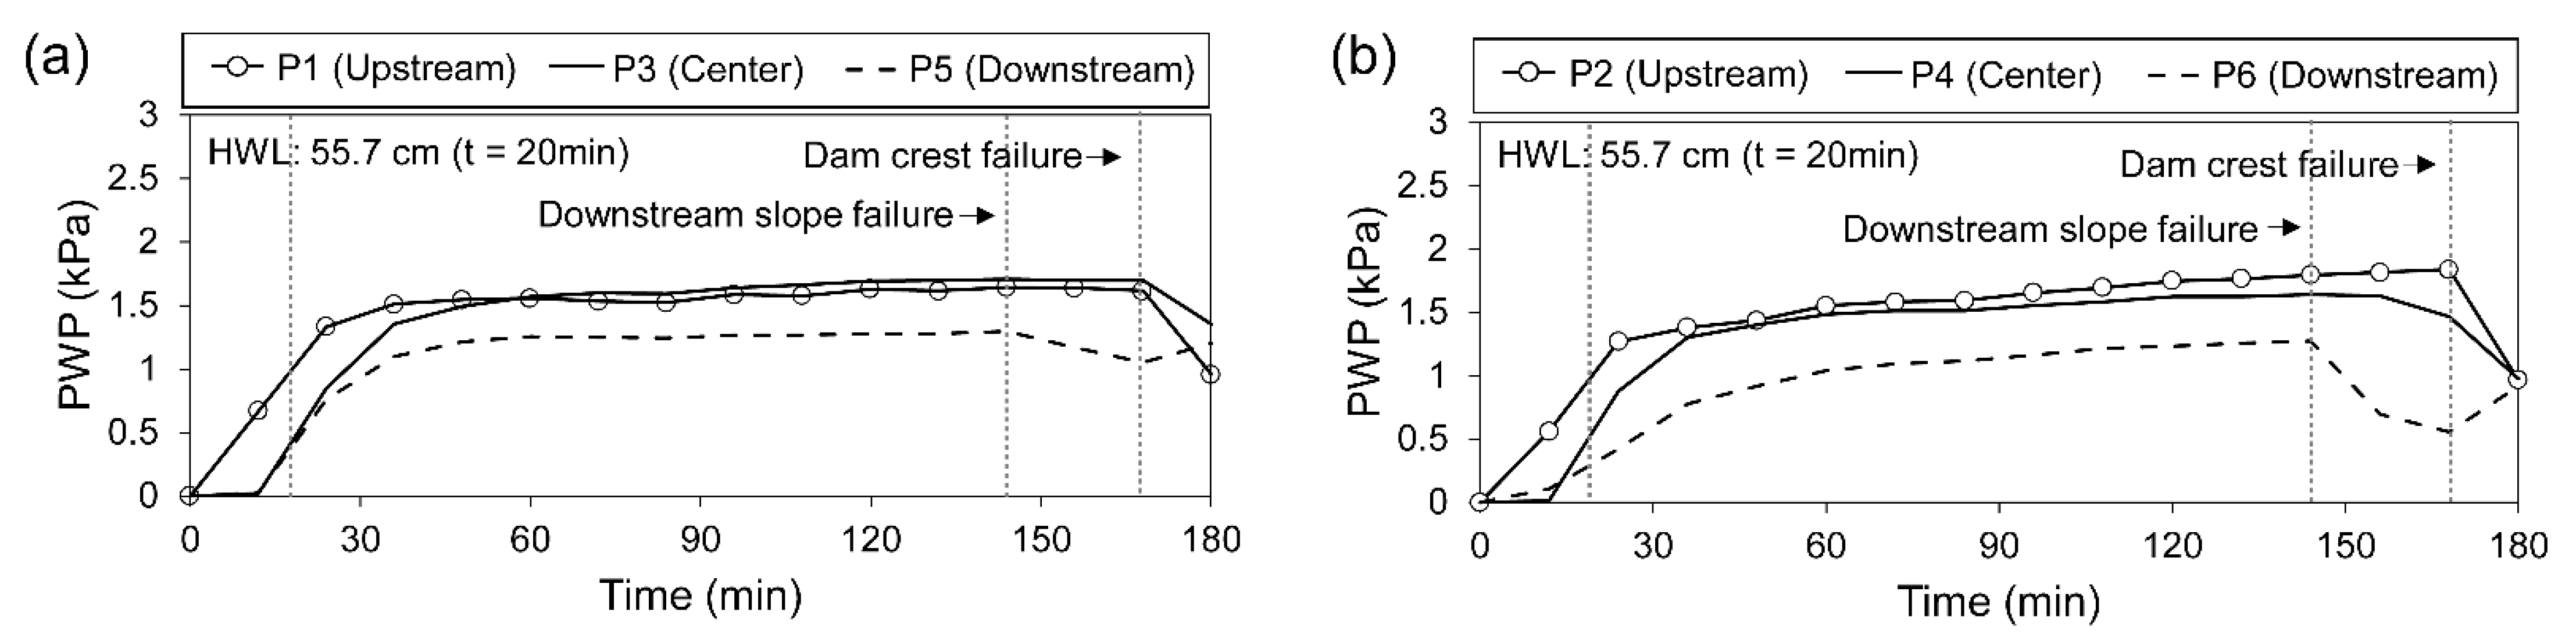
Measurement data are important for tracking the failure process via changes within the embankment. This study analyzed the effects of leaks in the conduit on the failure that occurred inside the embankment based on the pore-water pressure (PWP). Figure 6 shows the results of measuring the PWP by maintaining the HWL (55.7 cm, t = 20 min) on the upstream slope to the failure at the downstream slope (see Figure 4). For water level conditions, the FWL was maintained by using a water supply device before deformation appeared on the downstream slope (t = 20–155 min). Under conditions wherein deformation was observed on the slope, the water supply was stopped (t = 155–180 min). After reaching the HWL on the upstream slope, the PWP in the bottom conduit (P1, P3, and P5) exhibited an extremely small increase that maintained an almost constant level. However, the PWP above the conduit (P2, P4, and P6) continued to increase. These differences indicate that the seepage force constantly affects the parts above the conduit, which suggests that the surface above the conduit may be vulnerable to internal erosion. At the HWL, the PWP first began to decrease after 144 min at P5 and P6, which were located in the downstream conduit. These results reveal that the deformation of the downstream slope occurred slightly earlier than the PWP reduction in the model experiment, but they both occurred over a similar time range (see Figure 4).
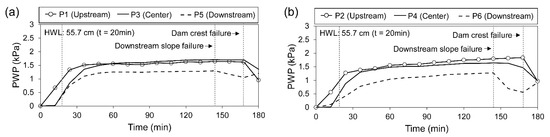
Figure 6.
Variations in pore-water pressure: (a) below the conduit (P1, P3, and P5) and (b) above the conduit (P2, P4, and P6).
3.3. Finite Element Analysis
As the embankment dam is affected by a variety of boundary conditions, such as permeability, temperature, and self-weights, PWP changes are not constant over time. Therefore, to model the seepage that acts on the interior of the actual embankment, it is necessary to perform a fully coupled analysis of the deformation–seepage that can simultaneously account for the flow of the water within the void and for the load-caused ground deformation. Accordingly, in this study, a fully coupled analysis of the deformation–seepage was performed using the GTS NX software [19] based on the three-dimensional finite element method. The soil properties (See Table 1), water level, and time boundary conditions applied to the analysis were the same as those in the model experiment, and the Mohr–Coulomb model was applied. In addition, the foundation ground of the analysis model was defined as an impermeable layer so that seepage occurred only inside the embankment zone; herein, the analysis model examined the hydraulic gradient that acted in the vertical direction (z-axis) as well as the displacement trends at the embankment dam crest. In addition, the results of each PWP located at the conduit boundary were compared with the experimental values.
Table 3 and Table 4, respectively, list the physical properties and soil–water characteristic curves of samples used in the model. The soil–water characteristic curves were applied to sandy clay (embankment zone) based on van Genuchten’s data [20].
Table 3.
Parameters used in the analysis.
Table 4.
Parameters of the soil–water characteristic curve used in the analysis.
3.3.1. PWP via Finite Element Analysis
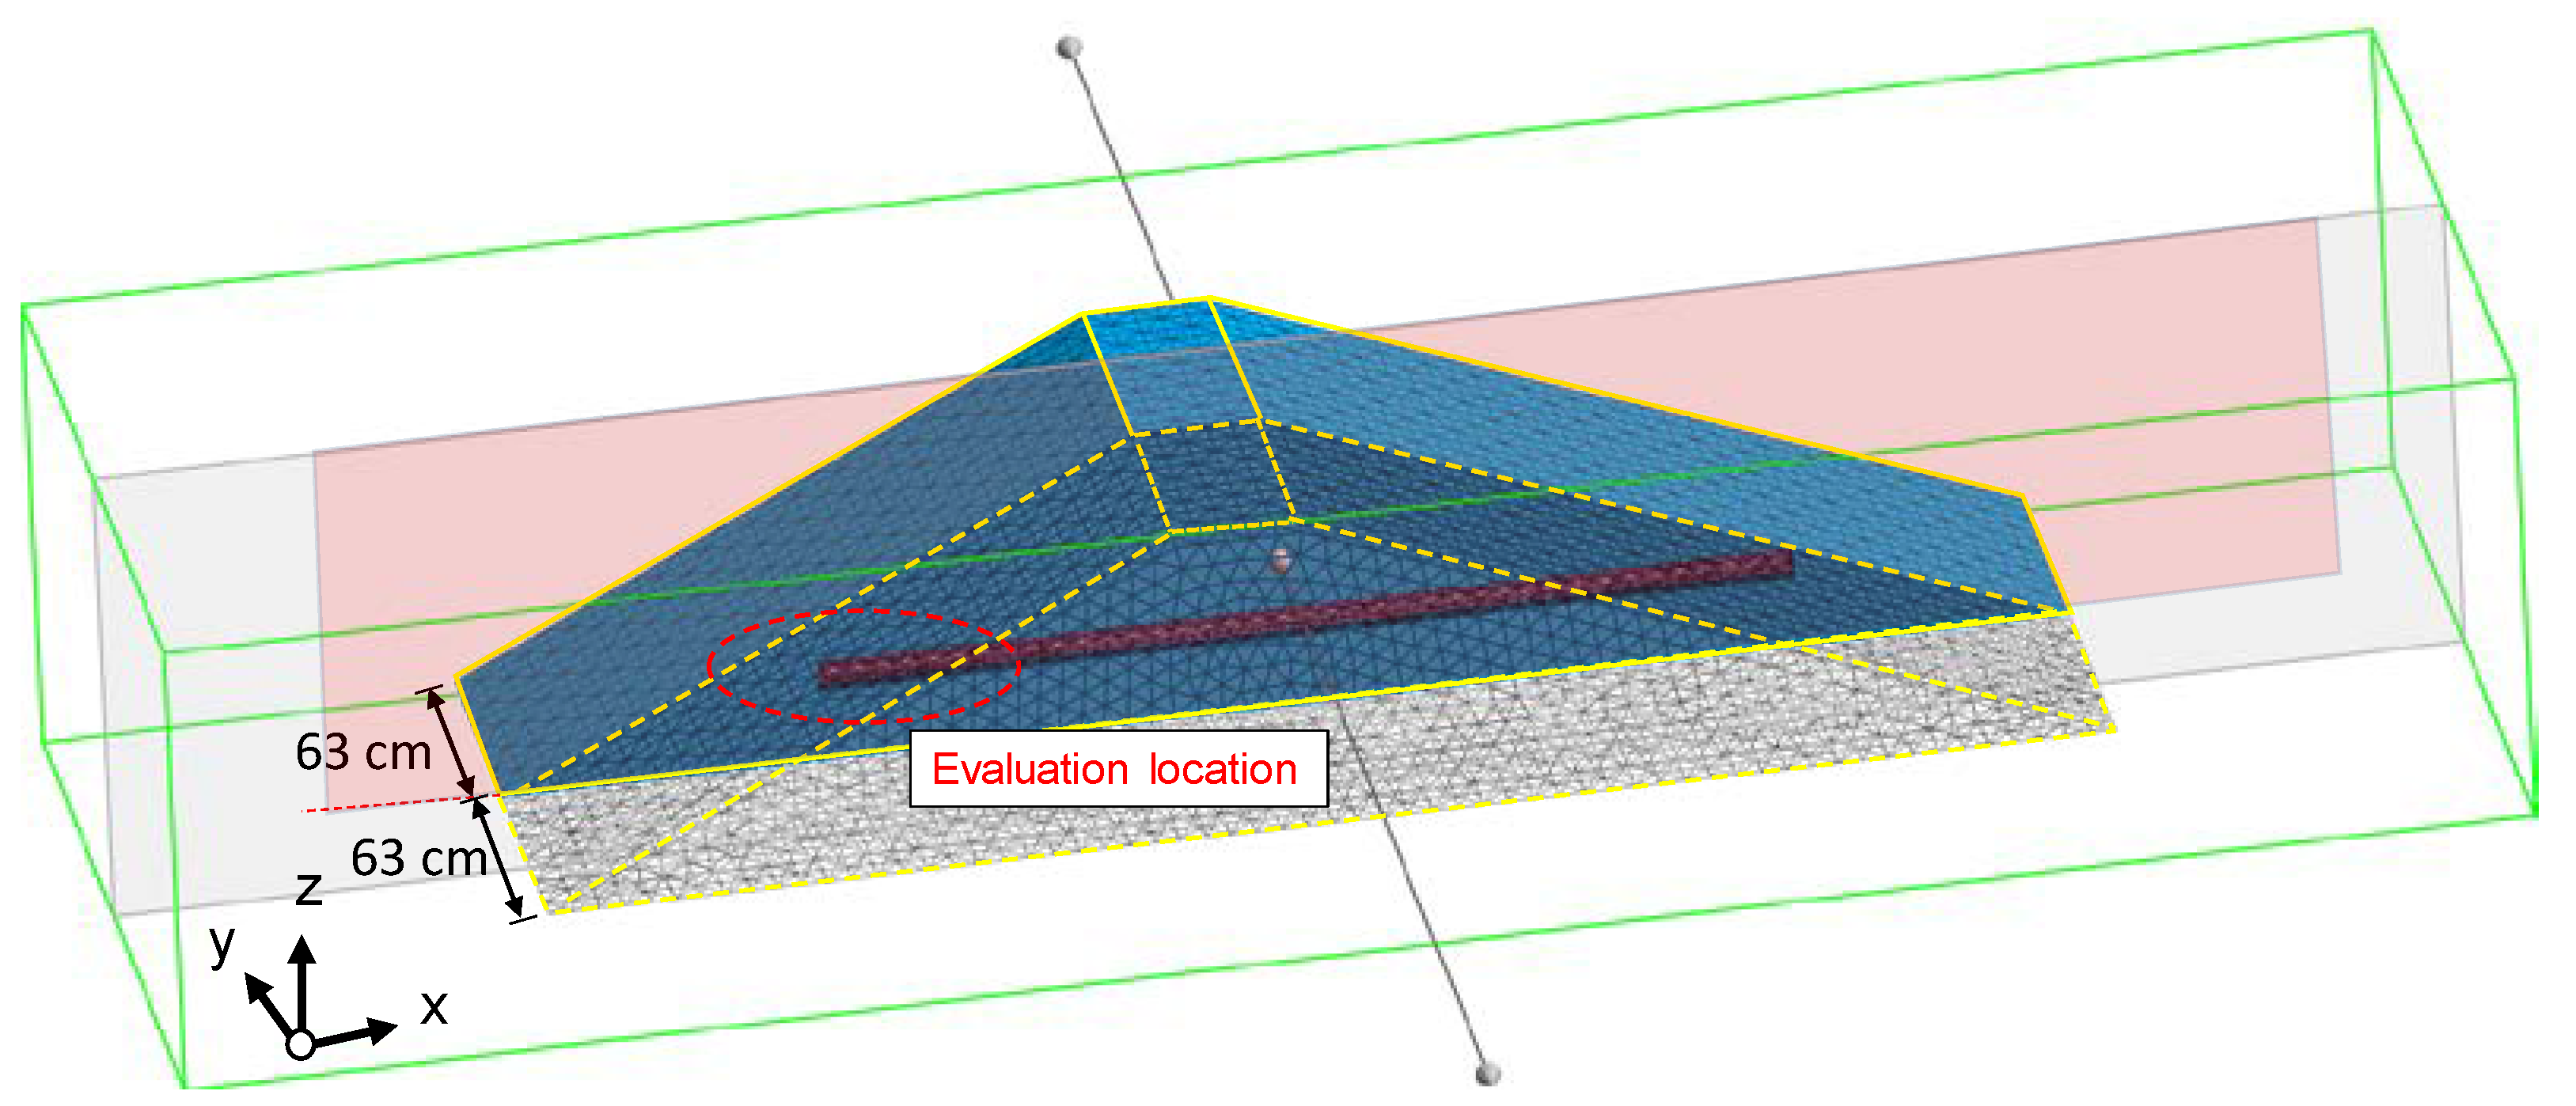
The analysis results provide useful information in that it is possible to properly identify the PWP variations due to the presence of conduit cracks inside the embankment. Figure 7 shows a two-dimensional cross-section obtained by extracting the point where the conduit was located (63 cm from the y-axis) in the three-dimensional cross-section. The evaluation location of the PWP was the fill zone (red circle: dashed line) below and above the conduit on the downstream slope side.

Figure 7.
Evaluation location of the PWP.
Figure 8 shows the PWP distributions for variations in the PWP at (a) t = 30, (b) 120, (c) 155, and (d) 180 min. While the water level increased (t = 30 min), the PWP increased only slightly at the crack surface at the bottom of the conduit. The PWP above the conduit did not show any change and, thus, was considered an early stage of infiltration.
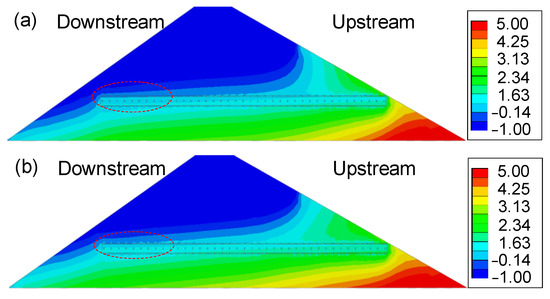
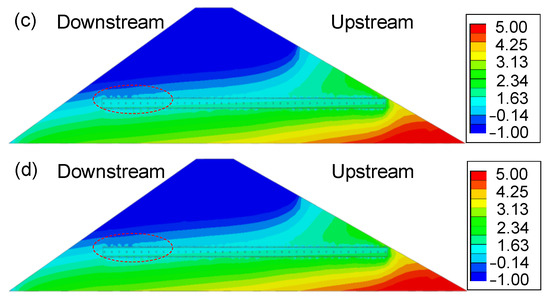
Figure 8.
Variations in the PWP at (a) t = 30; (b) 120; (c) 155; (d) 180 min (unit: kPa).
While an HWL was maintained (t = 120 min), an increase in PWP was observed above the conduit through the crack hole; thus, it is considered that the seepage water had sufficiently reached the upper part of the conduit. The PWP distributions at 155 and 180 min were almost similar. The PWP above the conduit expanded along the conduit boundary, while the PWP at the downstream slope also increased.
Figure 9 shows the PWP change calculated from the analysis. Above and below the conduit, the PWP change was more simplified than the experimental results. These results depend on whether they reflect the continuity of soil erosion and loss in the experiments and analysis. In the experiment, soil erosion or loss occurred on the crack surface of the conduit, gradually expanding to the weak spot. In contrast, the analysis represented only the movement and increase in hydraulic pressure at the crack surface of the conduit. Here, the soil parameters were the same regardless of the location of the analysis section; thus, PWP change was considered more stable than the experiment.
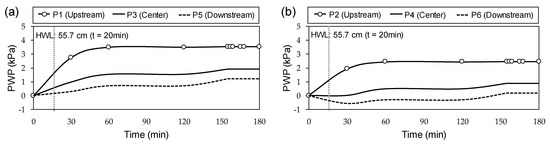
Figure 9.
Variations in pore-water pressure: (a) below the conduit (P1, P3, and P5) and (b) above the conduit (P2, P4, and P6).
The main difference between the experiment and analysis was the PWP variations of P3 and P4 measured at the center of the embankment. In the experiment, P3 and P4 showed PWP changes close to P1 and P2, which were installed on the upstream side, indicating that erosion occurred at the center of the embankment. In the analysis, there was ambiguity in the judgment of erosion. Therefore, the experimental results were empirical, and it may be appropriate to use the analysis results as basic data for experiments to estimate various phenomena caused by conduit cracks.
3.3.2. Hydraulic Gradient via Finite Element Analysis
The initial stage of internal erosion depends on the relationship between the critical hydraulic gradient and the soil permeability coefficient. Moreover, the risk of piping increases as internal erosion continues [9,12,13,21]. According to the literature regarding the risk zone for the critical hydraulic gradient, the hydraulic gradient for internal erosion is reported to be approximately one-fifth to one-third of the critical hydraulic gradient to ensure soil stability, and abrupt changes in strength occur at hydraulic gradients ≥ 0.5 [22]. In this analysis, the critical hydraulic gradient calculated based on the risk zone was in the range of 0.5–1.0. In this range, it was assumed that the hydraulic gradient had already reached conditions under which erosion could occur and that the top conduit and downstream slope may demonstrate unstable conditions for piping.
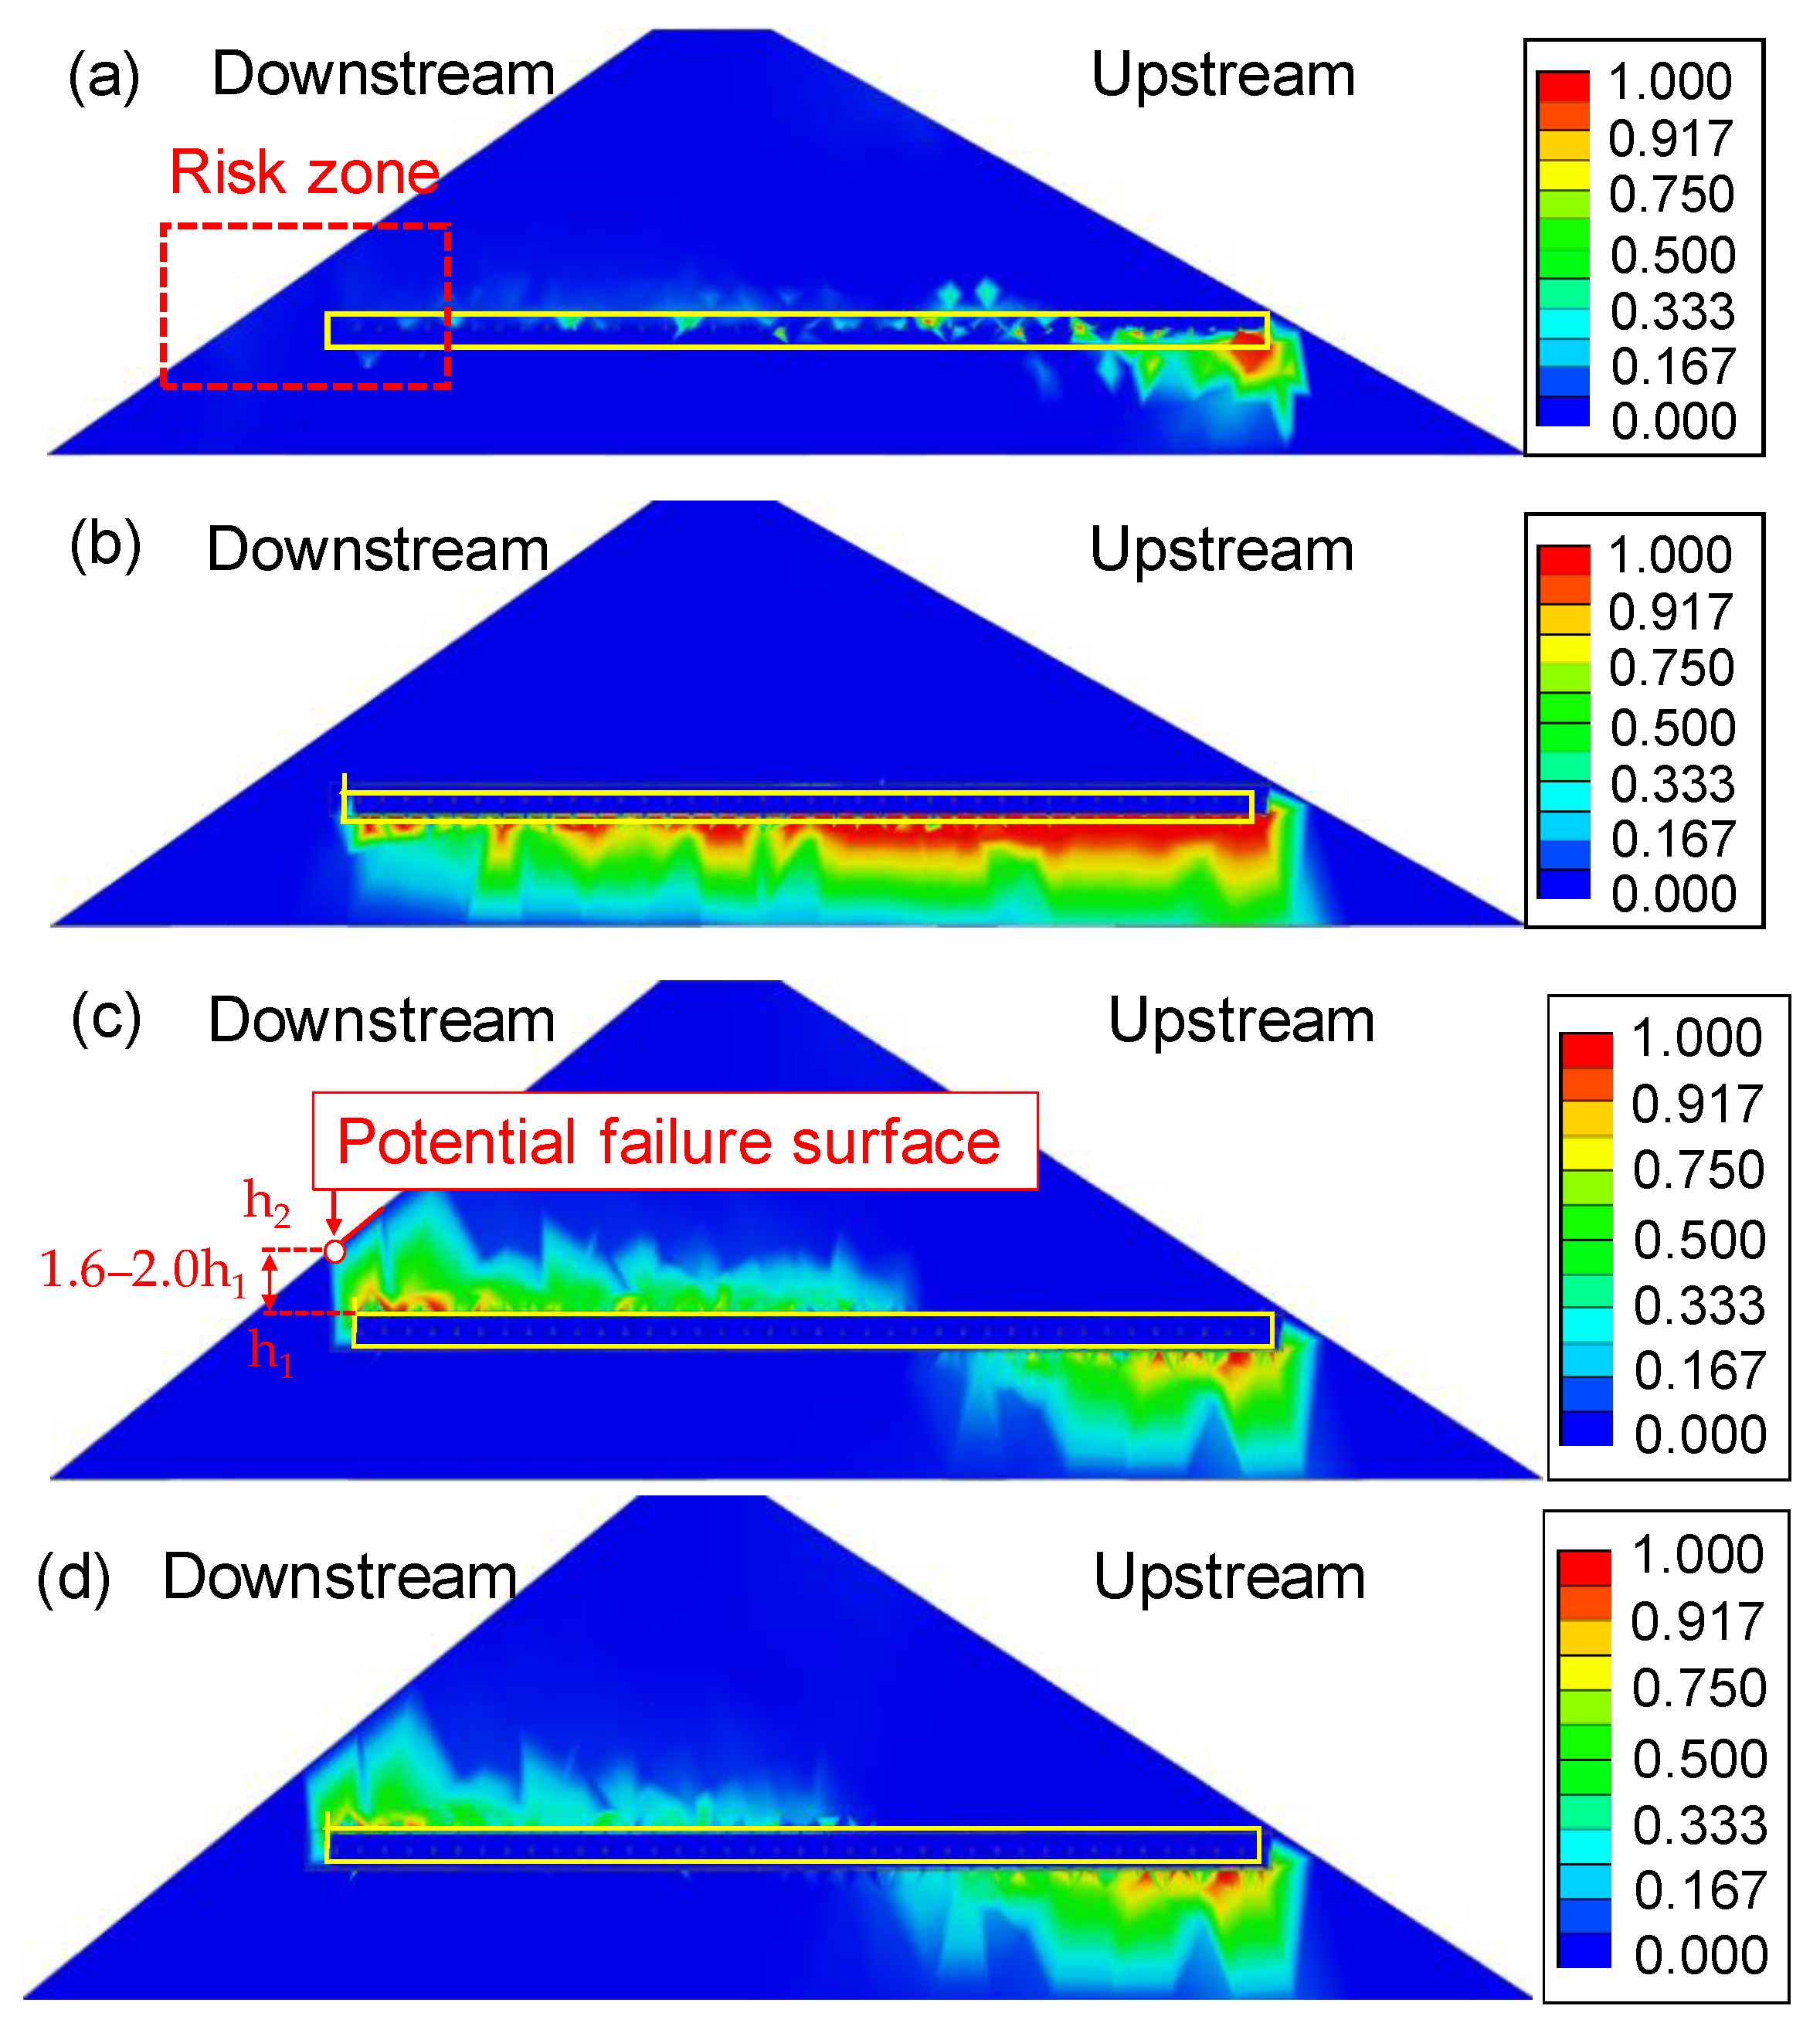
Figure 10 shows the changes in the hydraulic gradient (Ie) over time. While the water level increased (t = 30 min), the conduit leakage did not reach the downstream side. While an HWL was maintained (t = 120 min), Ie was distributed around the bottom part of the conduit, and the hydraulic slope was extended to the downstream slope (t = 155–180 min). Furthermore, tracking the failure position of the slope, wherein the hydraulic gradient was concentrated, led to the finding that a failed surface could be potentially formed at a height (h2) of 1.6–2.0 times the height (h1) above the conduit. Herein, the potential failure range owing to Ie was mostly consistent with the failure location of the downstream slope (h2 was equal to 1.4–2.4 times h1) as suggested in the experiment.
Figure 10.
Variations in the hydraulic gradient (z-axis) at (a) t = 30; (b) 120; (c) 155; (d) 180 min.
Therefore, the analysis results were valid as data supporting the experimental results and provide useful information for tracking the mechanism of slope failure due to the erosion of conduit cracks. Such information can be used to reinforce weak areas at the top conduit and downstream slope by tracking the hydraulic gradient and the failure location. Based on the analysis and experimental results, the location of the vulnerable area chosen to suppress the erosion depth on the downstream slope was suggested to be in the range of 1.4–2.4 times the height (h2) of the top conduit (h1). In addition, as the leak of the conduit eventually reached the downstream slope and caused failure, this experiment established the slope and conduit that were located on the downstream side as a risk zone.
3.3.3. Settlement Comparison Based on the Experiment and Analysis
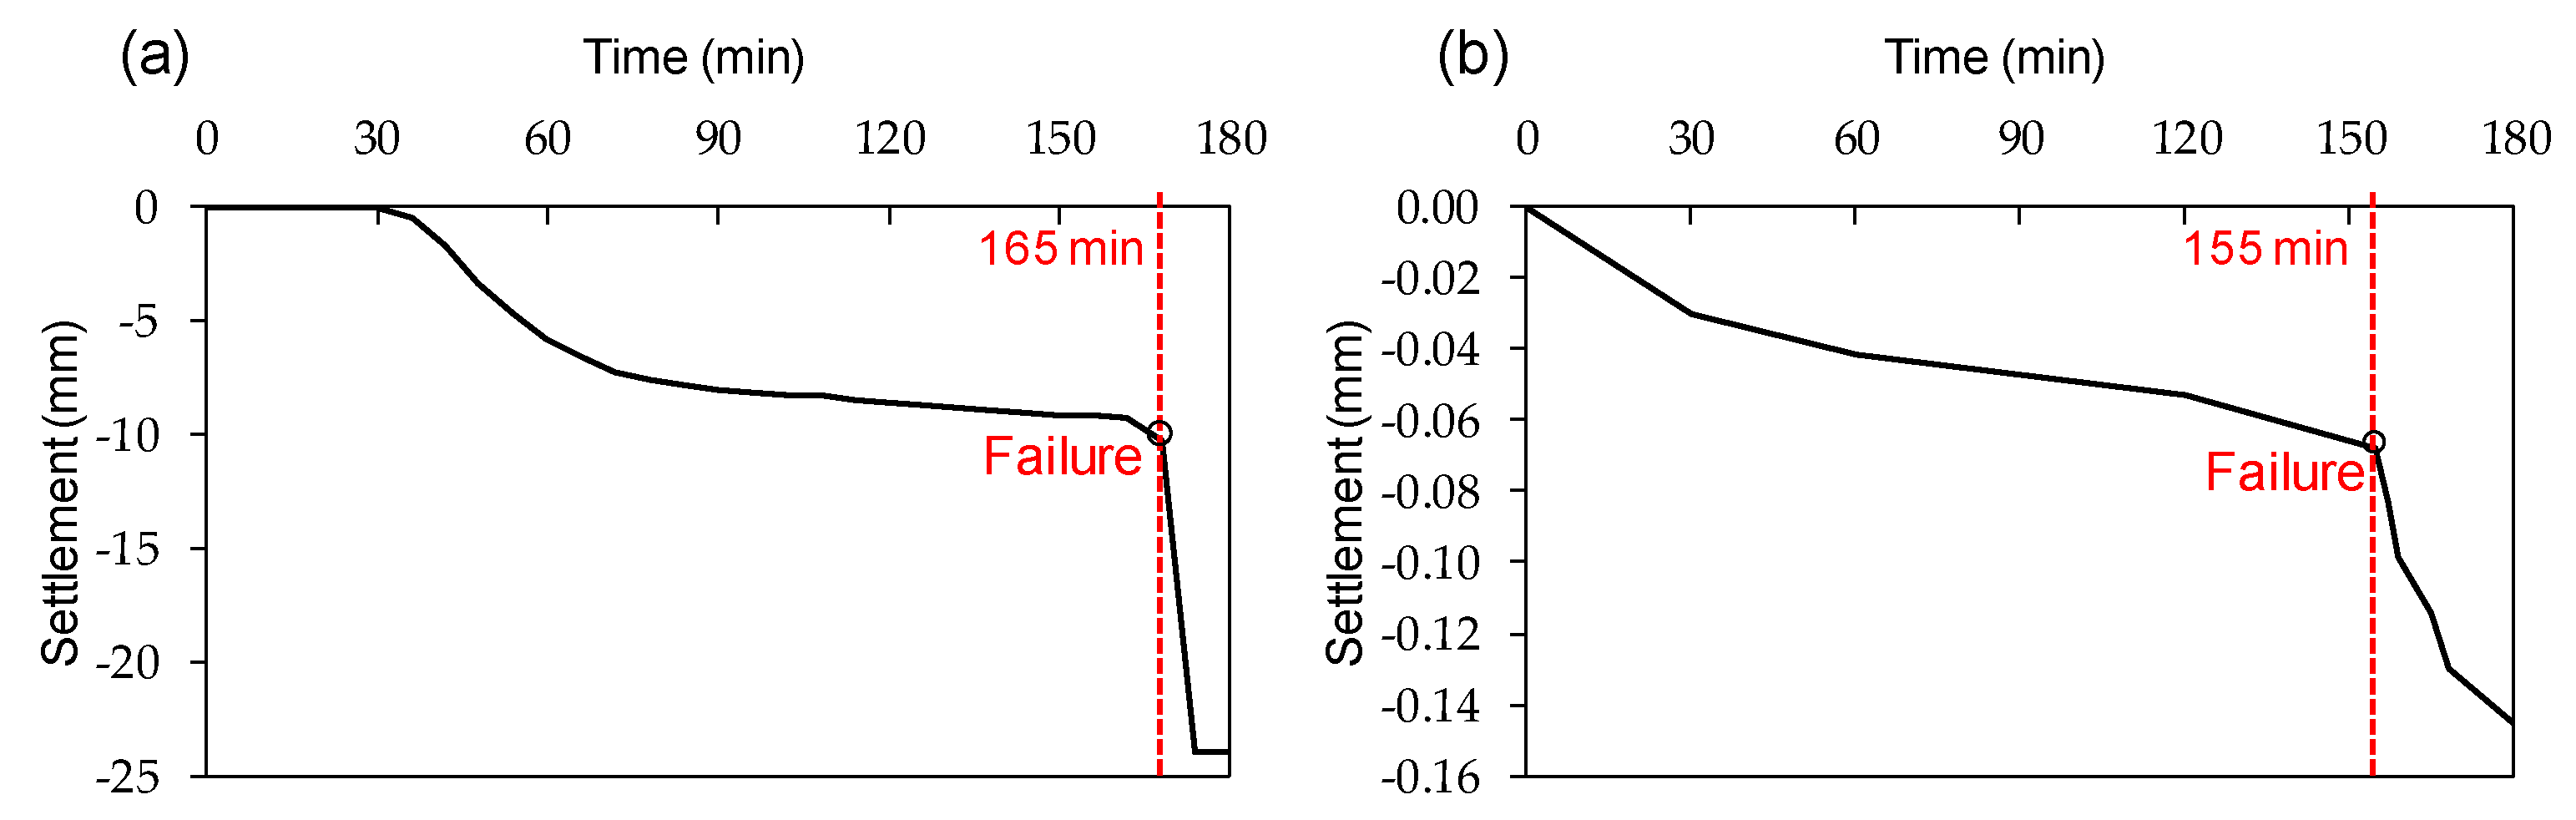
The failure of the dam crest can cause an overflow and rapidly cause the failure of the entire embankment, which can cause extensive damage to the downstream areas. Accordingly, data on the amount of settlement in the dam crest and the time that is expected to elapse before failure can provide insights into the type of pre-reinforcement that can prevent or minimize the failure of the dam crest due to the conduit leakage. In this study, the relationship between the settlement amount in the analysis and model experiment and the time that elapsed before failure was analyzed and compared with the storage yield of the Sandae Reservoir, which actually failed in 2013 owing to a conduit defect. Figure 11 shows the settlement data calculated experimentally and via analysis.
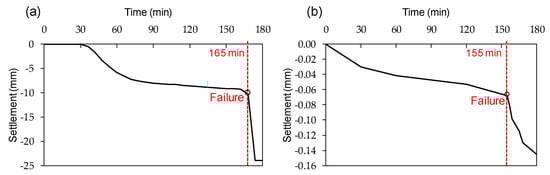
Figure 11.
Settlement data calculated experimentally and via analysis: (a) experiment result; (b) analysis result.
Large differences were observed between the analyzed (30 min: 0.03 mm; 180 min: 0.148 mm) and the experimental data (30 min: 0.004 mm; 180 min: 23.95 mm) over time. This difference was related to the change in the cross-sectional shape according to the actual deformation in the analysis and experiment. In the analysis, even if there was a large deformation, the actual fracture phenomenon was not reproduced. Accordingly, the analyzed cross-section maintained a constant shape without any other changes. In contrast, in the experiment, the change in the cross-sectional shape occurred with continuous failure due to the fact of erosion, and a relatively large settlement appeared owing to the gradual increase in stress.
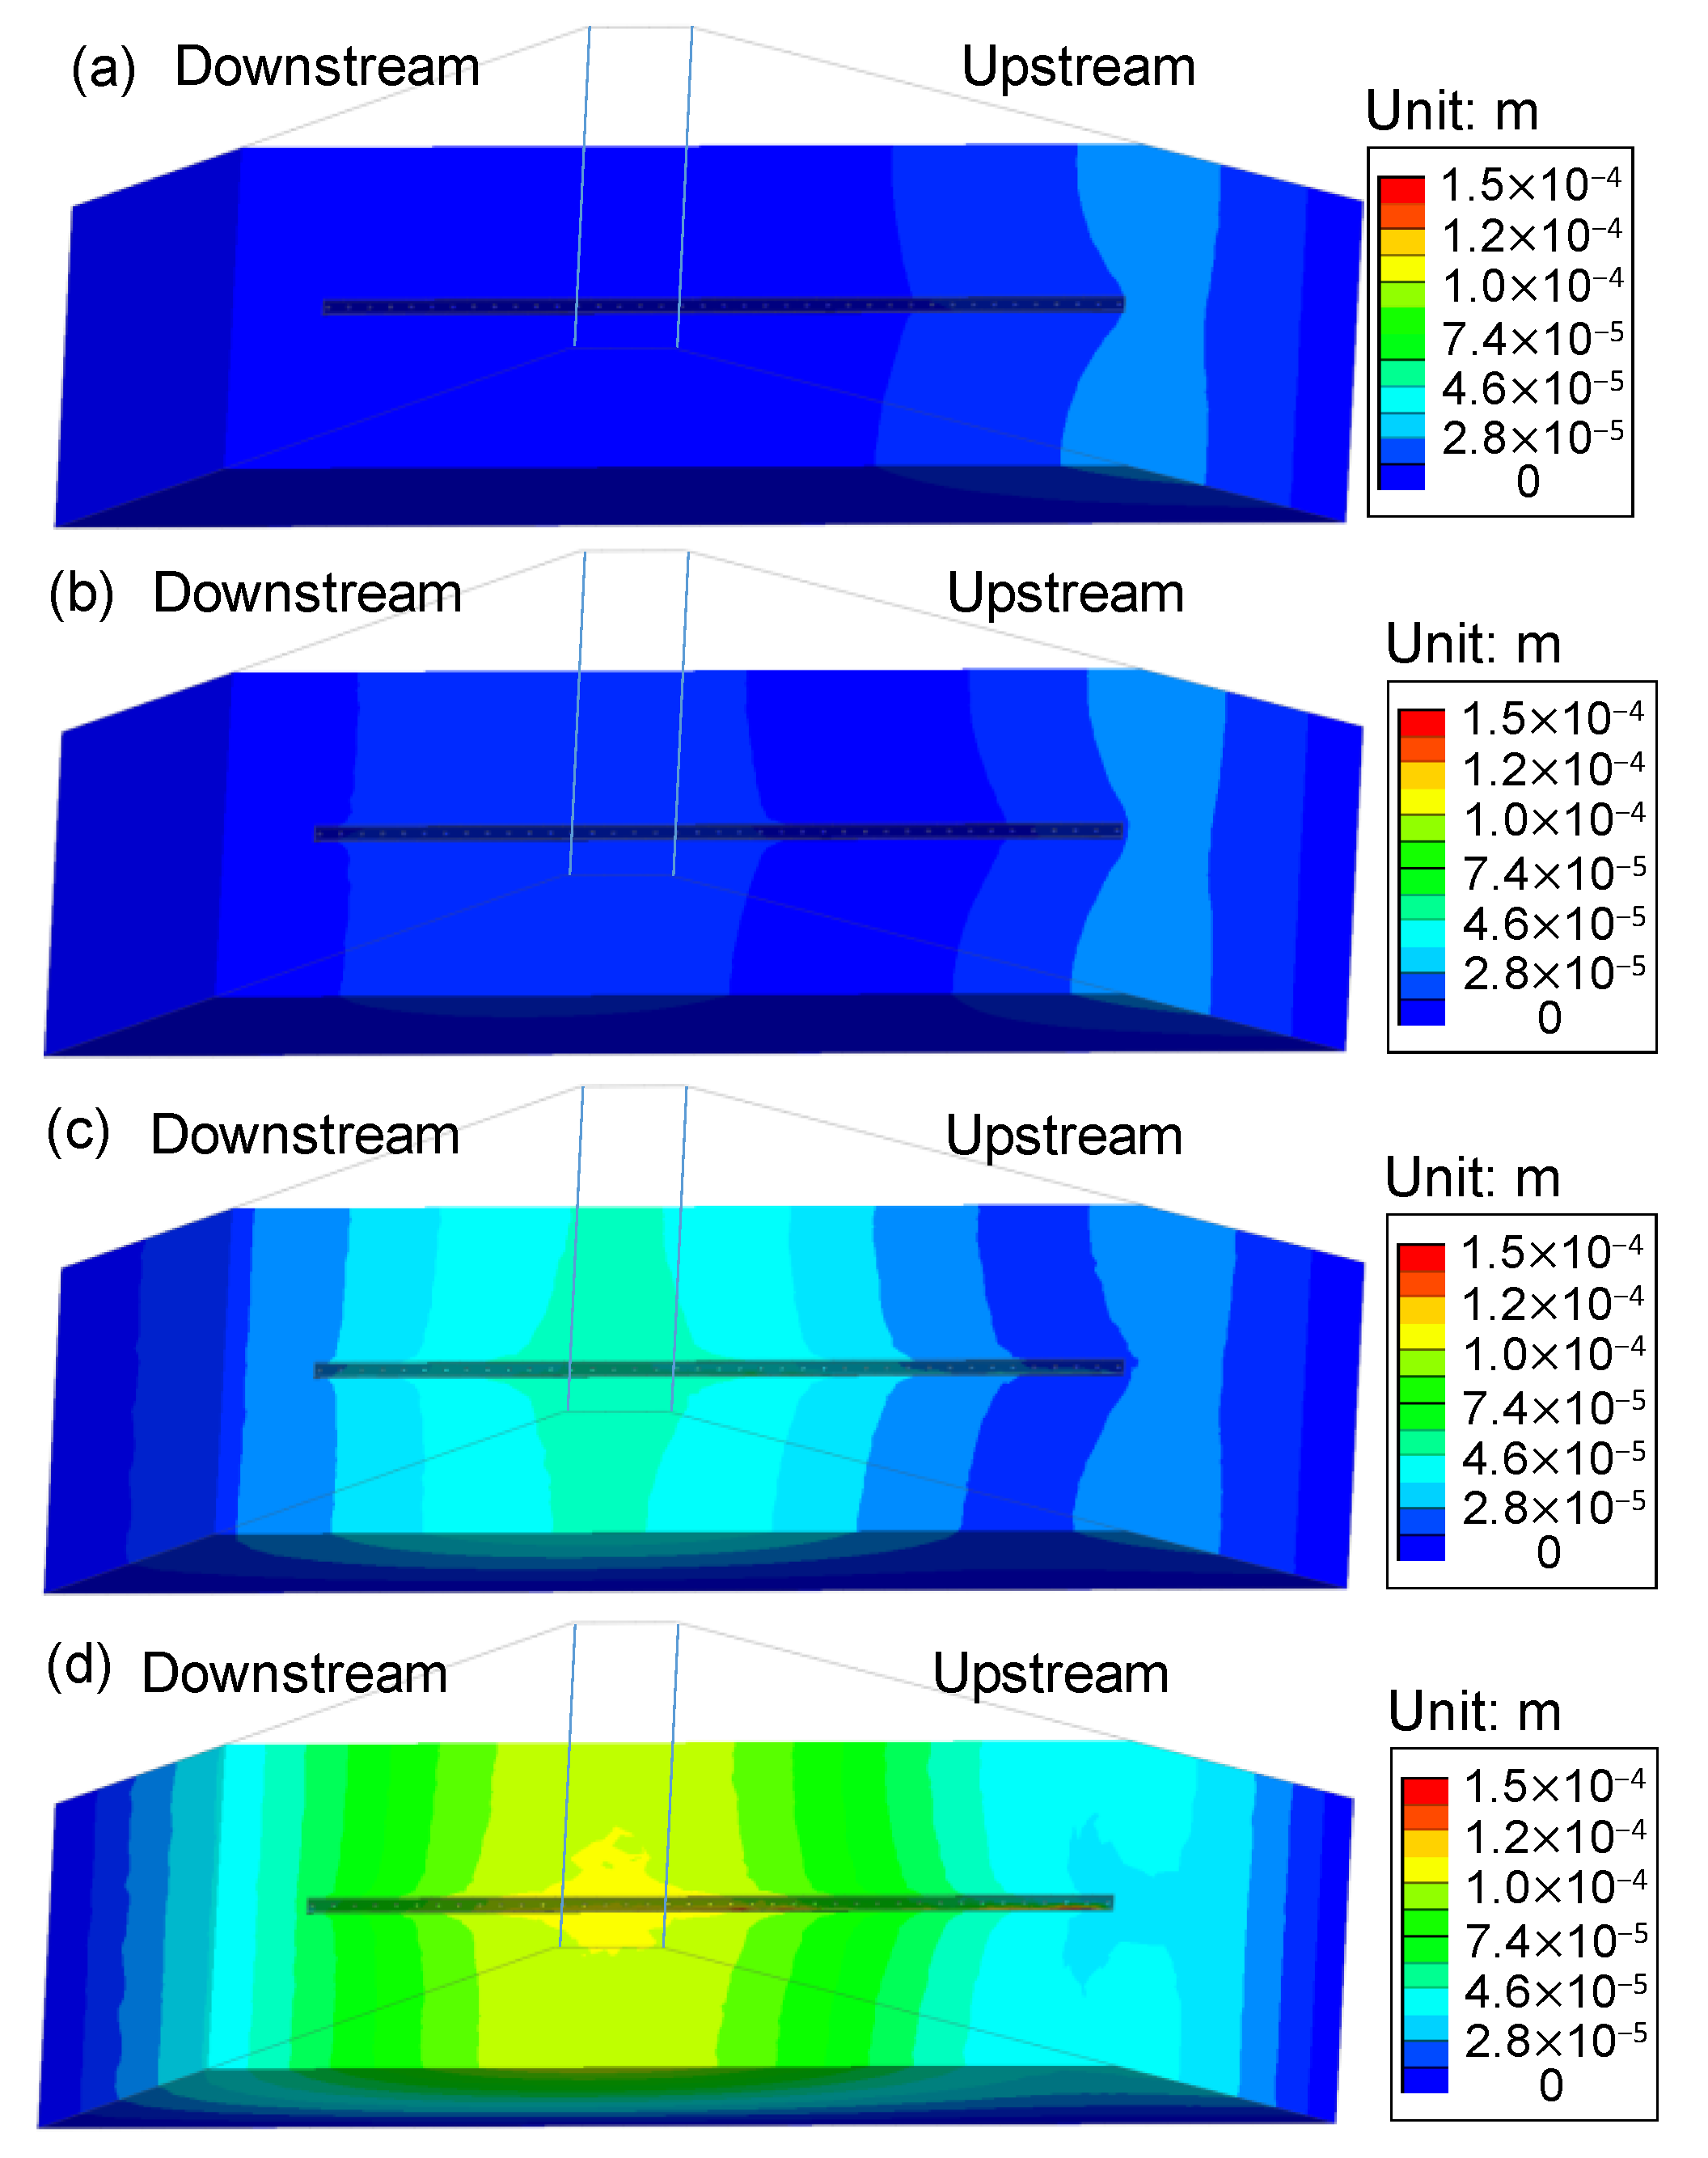
Figure 12 shows the distribution of settlement acting at the height (h = 25 cm) where the conduit was located in the analysis. Although the overall value of settlement in the analysis was small, it showed a sharp decrease at approximately 0.065 mm (t = 155 min), showing a settlement pattern similar to the experimental result.
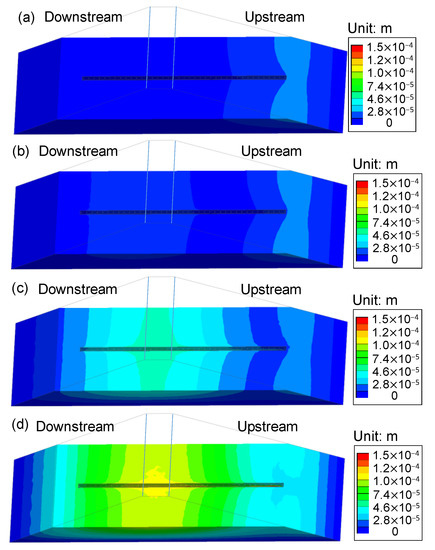
Figure 12.
Variations in the settlement at (a) t = 30; (b) 120; (c) 155; (d) 180 min.
These results are considered related to the self-weight acting on the central zone of the embankment with a larger area ratio than that of the downstream and upstream embankment zones. Here, it can be surmised that the central zone of the embankment may become a vulnerable area due to the water pressure changes (erosion or loss) on the crack surface of the conduit. Possibly, erosion that started in the central zone of the embankment developed along the boundary of the conduit to the downstream embankment, resulting in slope failure.
Such an estimate may be a phenomenon related to the increase in PWP (P3 and P4) at the center of the embankment in the experiment (see Figure 6). Therefore, it is considered that an increase in PWP and the action of the self-weight in the central zone of the embankment can be the first danger zone that causes the instability of the embankment.
3.3.4. Disaster Response Review
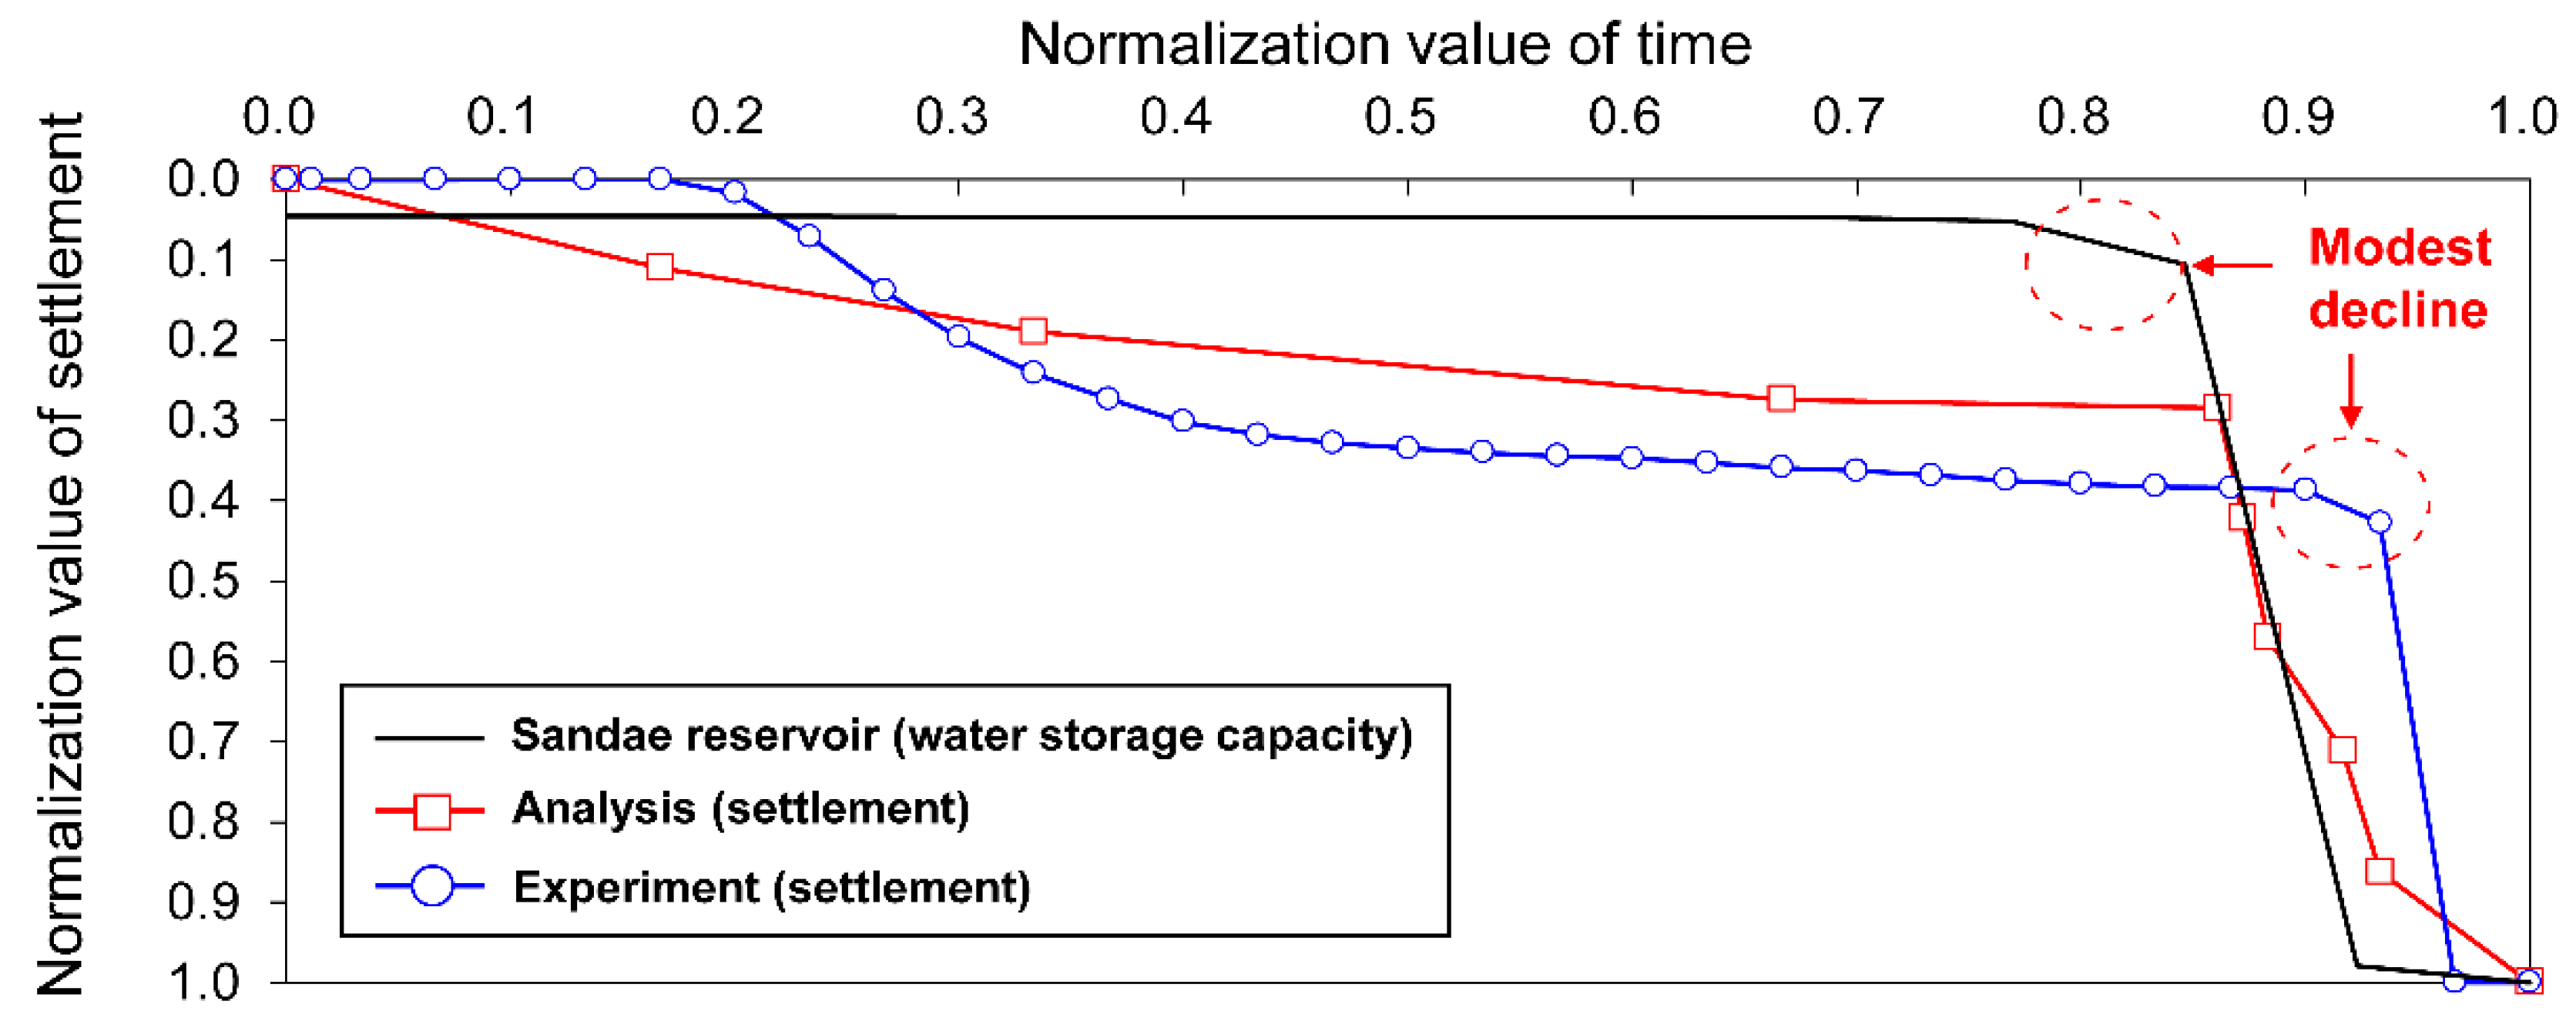
In this study, the amount of settlement was compared quantitatively based on experiments and analyses, and normalization was performed. The Sandae Reservoir data were normalized based on the time spent in the experiment. In the normalization method, the experimental and analysis values had similar trends, with differences only in scale. Thus, after setting the minimum and maximum values to zero and one, respectively, for the input value, the min–max normalization method, which is used to scale the remaining values between zero and one, was applied. Figure 13 illustrates the experimental and analysis values, as well as the normalization results measured in this study, including the storage capacity of the Sandae Reservoir. The basis for judging that a small reservoir has reached collapse is when the reservoir curve tends to a modest decline at the FWL. At the same time, it refers to the time needed to evacuate the people living in the downstream area. Tracking the time for the curve to present a modest decline in the experiment, the deformation corresponded to a phase (165 min) that rapidly extended from the downstream slope to the vicinity of the dam crest (see the rapid development stage in Figure 4c). However, the slope deformation (155 min) existed at an earlier stage than the rapid development stage (165 min).
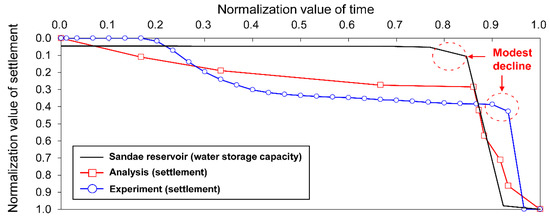
Figure 13.
Normalized results for the experimental and analytical storage capacity values.
These results show that settlement gauges and methods of measuring water storage capacity are less sensitive to disaster response. Accordingly, the failure risk assessment suggests that the use of slope deformation is appropriate, and it may be important to establish a monitoring system that can automatically detect the deformation of the downstream slope. Conversely, in the analysis, the settlement curve showed only a sharp downward trend, and the estimation of the time of slope collapse was thus ambiguous. These results explain that deformation, such as continuous soil loss and the movement of soil particles, may be difficult to reproduce at a level close to the prototype. The low sensitivity associated with the analysis results is directly related to the reliability of disaster mitigation measures. Thus, a method that uses the analysis results is considered invalid. Therefore, at present, the method associated with the construction of a monitoring system and control of the erosion depth can be a reasonable method for disaster response to minimize the embankment failure problem attributed to conduit defects.
4. Conclusions
This study proposed that the structural faults of deteriorated conduits cause reservoir embankment failure, the mechanism of which was analyzed by examining the failure shape, pore-water pressure, and settlement. The experimental results were compared with the seepage characteristics determined by the three-dimensional seepage–deformation coupled analysis. Based on the results, the following conclusions were drawn:
- An increase in the erosion depth is an important indicator that embankment failure, owing to the expansion of the slope failure, is imminent. However, because the erosion depth increases over a very short period of time, measurement methods are limited in their ability to detect rapid changes. This suggests that applying pre-reinforcement to the slope can be an effective method for suppressing the erosion depth, and discussions regarding the reinforcement method at the top of the conduit are necessary. The model experiment results can provide basic data on how to repair and reinforce the conduit of the deteriorated reservoir. They can also be used to identify the piping mechanism in the conduit and predict the possibility of failure;
- The pore-water pressure and settlement were measured, and the results indicate that they exhibited abrupt decreases and increases at the time of embankment failure, respectively. All the measured values generally corresponded to the time at which failure occurred. The pore-water pressure increased slightly as piping progressed, and then decreased rapidly as the dam crest failed. The differences in pore-water pressures above and below the conduit were determined to be attributed to seepage, and the likelihood of internal erosion was greater in regions above the conduit. The pore-water pressure above the conduit continuously increased, even though the water level within the embankment reached a steady state. This may have created a critical region for internal erosion. In the downstream conduit position, the time over which the pore-water pressure decreased was slightly shorter than in other locations; hence, failure occurred very fast at this location;
- The hydraulic gradients were distributed below the conduit and gradually extended toward the regions above the conduit of the downstream slope. The results indicate that piping above the conduit near the downstream slope was likely. The stability of the piping owing to the conduit leakage was evaluated by the critical hydraulic gradient. The exit hydraulic gradient in the risk zone of the downstream slope was in the range of 0.5–0.75, and the stability of the embankment was smaller than the reference safety factor (SF = 2.0). By tracking the vulnerable areas of the slope based on the hydraulic gradient distribution and the experimental results, it was determined that a potential failure surface could be formed at heights equal to 1.4–2.4 times (h2) the height (h1) of the downstream side’s conduit;
- Reviewing the settlement in the analysis, it was found that the settlement was concentrated in the central zone of the embankment where the conduit was located. Under these conditions, if the increase in PWP and the action of self-weight continue in the central zone of the embankment, it is presumed that it will be the first risk area that threatens the stability of the embankment;
- The evaluation of the time of failure based on the experimental and analysis results and the amount of water storage capacity in the Sandae Reservoir indicated that the measurement method (settlement and water storage capacity) was less sensitive to deformation changes than the monitoring method. Given that time is crucial for responding to a disaster caused by a reservoir failure, an automated monitoring system that can immediately identify the deformation of the downstream slope can be a suitable method for rapid disaster warning;
- Based on the results, it was found that the amount of settlement in the dam crest and the time that is expected to elapse before failure can provide significant insights into the type of pre-reinforcement required to prevent or minimize the failure of the dam crest due to the fact of conduit leakage.
In addition, the experimental method can provide useful information for estimating the failure phase of the actual reservoir due to the presence of conduit defects. Overall, the results presented in this study are expected to serve as guidelines for the appropriate reinforcement and design of conduits in old reservoirs.
Author Contributions
Software, J.-H.R. and C.-H.K.; investigation, T.-H.L. and J.-W.S.; writing—review and editing, Y.-H.L.; project administration, supervision, and conceptualization, D.-W.L. All authors have read and agreed to the published version of the manuscript.
Funding
This work was supported by the Basic Science Research Program through the National Research Foundation of Korea (NRF), funded by the Ministry of Education (Grant No. 2019R1I1A3A01058517), and a National Research Foundation of Korea (NRF) grant funded by the Ministry of Science, ICT, and Future Planning of the South Korean Government (Grant No. 2019R1C1C1007100). In addition, this work was supported by the Korea Institute of Planning and Evaluation for Technology in Food, Agriculture, and Forestry (IPET) through the Agricultural Infrastructure and Disaster Response Technology Development Project, funded by the Ministry of Agriculture, Food, and Rural Affairs (MAFRA) (Grant No. 320002-01).
Institutional Review Board Statement
Not applicable.
Informed Consent Statement
Not applicable.
Data Availability Statement
The data presented in this study may be available upon reasonable request from the corresponding author.
Acknowledgments
We would like to thank the Rural Research Institute and the Korea Rural Community Corporation for their support (data, administrative) in preventing disasters caused by cracks in conduits.
Conflicts of Interest
The authors declare no conflict of interest.
References
- Vallejo, S.A.N. Hydraulic Engineering Failures of Large Dams. Master’s Dissertation, Civil Engineering Construction University of Porto, Porto, Portugal, June 2016; p. 42. Available online: https://repositorioaberto.up.pt/bitstream/10216/84171/2/136712.pdf (accessed on 16 May 2022).
- Foster, M.A.; Fell, R.; Spannagle, M. The statistics of embankment dam failures and accidents. Can. Geotech. J. 2000, 37, 1000–1024. [Google Scholar] [CrossRef]
- Fell, R.; Wan, C.F.; Cyganiewiewicz, J.; Foster, M. Time for development of erosion and piping in embankment dams. J. Geotech. Geoenviron. Eng. 2003, 129, 307–314. [Google Scholar] [CrossRef]
- Wan, C.F.; Fell, R. Investigation of rate of erosion of soils in embankment dams. J. Geotech. Geoenviron. Eng. 2004, 130, 373–380. [Google Scholar] [CrossRef]
- Hanson, G.J.; Cook, K.R.; Hunt, S.L. Physical modeling of overtopping erosion and breach formation of cohesive embankments. Trans. ASAEB 2005, 48, 1783–1794. [Google Scholar] [CrossRef]
- Jandora, J.; Řiha, J. The Failure of Embankment Dams Due to Overtopping; Brno University of Technology: Brno, Czechia, 2009. [Google Scholar]
- Alhasan, Z.; Jandora, J.; Říha, J. Study of dam-break due to overtopping of four small dams in the Czech Republic. Acta Univ. Agric. Silvic. Mendel. Brun. 2015, 63, 717–729. [Google Scholar] [CrossRef] [Green Version]
- Zhao, M.; Liu, P.; Jiang, L.; Wang, K. The Influence of Internal Erosion in Earthen Dams on the Potential Difference Response to Applied Voltage. Water 2021, 13, 3387. [Google Scholar] [CrossRef]
- Richards, K.S.; Reddy, K.R. Critical appraisal of piping phenomena in earth dams. Bull. Eng. Geolog. Environ. 2007, 66, 381–402. [Google Scholar] [CrossRef]
- Hunt, S.L.; Hanson, G.J.; Cook, K.R.; Kadavy, K.C. Breach widening observations from earthen embankment tests. Trans. ASABE 2005, 48, 1115–1120. [Google Scholar] [CrossRef]
- Xie, Q.Y.; Liu, J.; Han, B.; Li, H.T.; Li, Y.Y.; Jiang, Z.Q. Experimental investigation of interfacial erosion on culvert-soil interface in earth dams. Soils Found. 2018, 59, 671–686. [Google Scholar] [CrossRef]
- Ojha, C.S.P.; Singh, V.P.; Adrian, D.D. Influence of porosity on piping models of levee failure. J. Geotech. Geoenviron. Eng. 2001, 127, 1071–1074. [Google Scholar] [CrossRef]
- Ojha, C.S.P.; Singh, V.P.; Adrian, D.D. Determination of critical head in soil piping. J. Geotech. Geoenviron. Eng. 2003, 129, 511–518. [Google Scholar] [CrossRef]
- Ali, A.A.; Hunt, S.L.; Tejral, R.D. Embankment Breach Research: Observed Internal Erosion Processes. Trans. ASABE 2021, 64, 745–760. [Google Scholar] [CrossRef]
- Lee, Y.H.; Ryu, J.H.; Heo, J.; Shim, J.W.; Lee, D.W. Stability improvement method for embankment dam with respect to conduit cracks. Appl. Sci. 2022, 12, 567. [Google Scholar] [CrossRef]
- Lee, Y.H.; Park, S.Y.; Tokida, K.I.; Lee, D.W. Three-dimensional seepage characteristics of reservoir embankment considering interval of horizontal filter. Int. J. Offshore Polar Eng. 2018, 28, 80–86. [Google Scholar] [CrossRef]
- Reddi, L.N.; Bonala, M.V. Filtration and drainage in geotechnical/geoenvironmental engineering. In Proceedings of Sessions of Geo-Congress 98; American Society of Civil Engineers: Reston, VA, USA, 1998. [Google Scholar]
- Mousavian, S. Seepage Monitoring and Diagnosis of Distresses in an Earth Embankment Dam Using Probability Methods; New Jersey Institute of Technology: Newark, NJ, USA, 2017. [Google Scholar]
- MIDAS IT. Midas Geotechnical and Tunnel Analysis System (Midas GTS). 2020. Available online: https://www.midasgeotech.com/blog/tag/geotechnical-engineering (accessed on 20 October 2020).
- Carsel, R.; Parrish, R. Developing joint probability distributions of soil water retention characteristics. Water Res. Res. 1988, 24, 755–769. [Google Scholar] [CrossRef] [Green Version]
- USSD. The Aging of Embankment Dams. 2010. Available online: https://www.ussdams.org/wp-content/uploads/2016/05/aging.pdf (accessed on 20 October 2020).
- Ke, L.; Takahashi, A. Strength reduction of cohesionless soil due to internal erosion induced by one-dimensional upward seepage flow. Soils Found. 2012, 52, 698–711. [Google Scholar] [CrossRef] [Green Version]


Publisher’s Note: MDPI stays neutral with regard to jurisdictional claims in published maps and institutional affiliations. |
© 2022 by the authors. Licensee MDPI, Basel, Switzerland. This article is an open access article distributed under the terms and conditions of the Creative Commons Attribution (CC BY) license (https://creativecommons.org/licenses/by/4.0/).