Article

Prebiotic Isomaltooligosaccharide Provides an Advantageous Fitness to the Probiotic Bacillus subtilis CU1

1
Laboratoire Ecologie & Biologie des Interactions, UMR CNRS 7267, Université de Poitiers, 86000 Poitiers, France
2
Plateforme Technologique BISCEm, US042 Inserm—UAR 2015 CNRS, Université de Limoges, 87000 Limoges, France
3
Laboratoire PEIRENE, UR 22722, Université de Limoges, 87000 Limoges, France
4
INRAE, UR BIA, F-44316 Nantes, France
5
INRAE, BIBS Core Facility, F-44316 Nantes, France
6
Microbiology Laboratory UMR 5248 Bordeaux Sciences-Agro, Université de Bordeaux, 33175 Gradignan, France
*
Authors to whom correspondence should be addressed.
Appl. Sci. 2022, 12(13), 6404; https://doi.org/10.3390/app12136404
Submission received: 10 May 2022 / Revised: 16 June 2022 / Accepted: 16 June 2022 / Published: 23 June 2022
(This article belongs to the Special Issue Microbiota Restoration and Modulation by Functional Products)

Abstract

:
Bacillus subtilis CU1 is a probiotic strain with beneficial effects on immune health in elderly subjects and diarrhea. Commercialized under spore form, new strategies to improve the germination, fitness and beneficial effects of the probiotic once in the gut have to be explored. For this purpose, functional food ingredients, such as isomaltooligosaccharides (IMOSs), could improve the fitness of Bacillus probiotics. IMOSs are composed of α(1 → 6)- and α(1 → 4)-linked oligosaccharides and are partially indigestible. Dietary IMOSs stimulate beneficial members of intestinal microbiota, but the effect of a combination of IMOSs with probiotics, such as B. subtilis CU1, is unknown. In this study, we evaluate the potential effect of IMOSs in B. subtilis CU1 and identify the metabolic pathways involved. The biochemical analysis of the commercial IMOSs highlights a degree of polymerization (DP) comprised between 1 and 29. The metabolism of IMOSs in CU1 was attributed to an α-glucosidase, secreted in the extracellular compartment one hundred times more than with glucose, and which seems to hydrolyze high DP IMOSs into shorter oligosaccharides (DP1, DP2 and DP3) in the culture medium. Proteomic analysis of CU1 after growth on IMOSs showed a reshaping of B. subtilis CU1 metabolism and functions, associated with a decreased production of lactic acid and acetic acid by two times. Moreover, we show for the first time that IMOSs could improve the germination of a Bacillus probiotic in the presence of bile salts in vitro, with an 8 h reduced lag-time when compared to a glucose substrate. Moreover, bacterial concentration (CFU/mL) was increased by about 1 log in IMOS liquid cultures after 48 h when compared to glucose. In conclusion, the use of IMOSs in association with probiotic B. subtilis CU1 in a synbiotic product could improve the fitness and benefits of the probiotic.

1. Introduction

The use of bacteria to improve human health has been proposed for many years. The term probiotic has been defined by the Food and Agriculture Organization/World Health Organization (FAO/WHO, 2001) as “live microorganisms which when administered in adequate amounts confer a health benefit to the host” [1]. Probiotics have been shown to be useful in the oral bacteriotherapy of gastrointestinal and other disorders [2,3]. The term of probiotic is mainly related to lactic acid bacteria, such as Lactobacillus or Bifidobacterium. However, it can be extended to other microorganisms that have not been fully explored, such as Bacillus species, members of the allochthone microflora [4]. The use of Bacillus strains as probiotics is supported by an increasing number of studies over the past 20 years, notably because of their ability to resist to the acid gastric environment under spore form [5,6]. Moreover, Bacillus spores are able to germinate into vegetative forms in the intestine if the conditions are favorable [7,8,9]. The consumption of Bacillus-based probiotics have also be shown to abolish the colonization by S. aureus through the blockage of a pathogen’s signaling system [10]. Although Bacillus have been used as probiotics in different commercial preparations, such as LifeinU™ or Enterogermina®, the mechanisms responsible for their beneficial effects remained relatively unexplored. B. subtilis CU1 (LifeinU™) product is a probiotic strain known to have an antagonistic activity against several pathogens, including S. aureus, E. faecium and C. difficile [11]. Moreover, we previously highlighted the immunostimulatory properties of the lipoteichoic acid of the CU1 strain in vitro [12]. Interestingly, B. subtilis CU1 can stimulate systemic and mucosal immune responses, increasing intestinal and salivary SIgA and serum IFN-gamma levels in humans [13]. In addition, strain CU1 displayed potent antidiarrheal activity in mice through the regulation of NHE3 and CFTR transporter proteins [14]. Casula and Cutting [7] have shown that B. subtilis could germinate in the small intestine, if nutritional germinants are available, leading to a brief colonization of the gut. For this reason, the addition of a prebiotic compound to the intake of probiotic spores could favor its germination once in the small intestine.
By analogy, with probiotics, prebiotics were defined as “nondigestible food ingredients that beneficially affect the host by stimulating growth and/or activity of a limited number of bacteria in the intestine” [15,16,17]. To enhance the relative effect of each, combination of probiotics and prebiotics, named synbiotic, is a hopeful concept introduced by Gibson and Roberfroid [15]. Indeed, the prebiotic source could promote the survival and the establishment of a probiotic strain in the gastrointestinal tract [18]. Probiotics and prebiotics have been mostly investigated separately, but their respective advantages could work in a synergic manner and are yet to be explored. Among the prebiotic compounds commercially available, isomaltooligosaccharides (IMOSs) are produced by the enzymatic conversion of starch. IMOSs are composed of α(1 → 6)- and α(1 → 4)-linked glucose oligomers and mainly used as functionalized food in Asia. In vivo studies showed the effective role of IMOSs to increase bifidobacteria and lactobacilli in the gut of humans and rodents [19,20,21], and to decrease gas production in the gut [22]. However, the beneficial effects of the association of IMOSs with probiotic Bacilli have only been partially explored [23].
The aim of this study is to investigate the effects of a commercial prebiotic IMOS on the growth and metabolism of the probiotic B. subtilis CU1, and to explore the possible role of this carbon source on the proteomic adaptation of the strain to gastrointestinal conditions. We first evaluate the growth abilities of B. subtilis CU1 on several prebiotic sources, leading to the selection of IMOS as the prebiotic of interest. We then analyze IMOS structure by mass spectrometry, and we show the ability of the strain to use the prebiotic as a unique carbon source through the secretion of α-glucosidase. A comparison of B. subtilis CU1 proteomes after growth on glucose or IMOSs suggests the fitness advantage of the strain when combined with the prebiotic substrate. We finally show that IMOSs improve resistance to the bile salts of B. subtilis CU1 vegetative cells and spore germination in the presence of bile salts.

2. Materials and Methods

2.1. Spectrometric Analyses of IMOS Components

IMOSs were obtained from Nanjing Zelang (purity 99%, Nanjing, China). The composition of IMOS preparation was determined by MALDI-MS [24] and ESI-qTOF. Mass measurements were performed on an Autoflex III MALDI-TOF/TOF spectrometer (Bruker Daltonics, Bremen, Germany) equipped with a Smartbeam laser (355 nm, 200 Hz) in positive or negative ionization modes, and with a linear or reflector detection mode. IMOSs were solubilized at 1 mg/mL in water and mixed with the DMA/DHB matrix in a 1:1 (v/v) ratio. A total of 1 µL of the mixture was deposited on a polished steel MALDI target plate. In the linear mode, the mass/charge range (m/z) was set to 2000–10,000, and in reflector mode to 500–5000. The laser intensity was set at 1000 A.U. with 5 s of acquisition time. The calibration of the instrument was systematically performed before any new series of analysis, with galactomannans (DP3 to DP13) for the reflector mode and IMOS (DP 3 to DP 50) for linear mode. The mass spectra were automatically processed with Flex Analysis 3.0 software (Bruker Daltonics, Bremen, Germany) and only the ions with a signal-to-noise (S/N) ratio above 5 were considered. The results were analyzed and represented using the Flex Analysis 3.0 analysis software (Bruker Daltonics, Bremen, Germany).
For ESI-qTOF experiments, a fraction of DP6 IMOS obtained by liquid chromatography (see Section 2.4) was infused into the ESI system at a concentration of 50 µg/mL. The sample was introduced into a Synapt G2 Si HDMS system (Thermo Fischer Scientific, Waltham, MA, USA) at a flow rate of 5 µL/min with methanol/water 1:1 (v/v) as the solvent. Measurements were performed in the positive and negative ionization modes. The fragments were produced and measured in the collision cell/transfer unit. Spectra were recorded for 30 s (low DIC1 energy plan). Collision energy was set based on the signal/noise ratio observed for the obtained fragments. The acquired data were stored and processed using MassLynx 4.1 software (Waters, Milford, MA, USA). Spectra annotations were made using Microsoft PowerPoint Professional Plus 2019.

2.2. Strains and Culture Conditions

B. subtilis CU1 (LifeinU™, Lesaffre, Marcq-en-Baroeul, France), B. licheniformis BL31 (Biosporin®, Biofarm, Kharkiv, Ukraine), B. cereus CH (Anyang Yuanshou Biopharmaceutical, Anyang, China), B. amyloliquefaciens 26D (Phytosporin®, Kiev, Ukraine) and B. subtilis 2–4/2 (soil, BSA collection) were grown in modified Spizizen’s medium for cultivation on different carbon sources. Modified Spizizen’s medium contained the following composition per liter: K2HPO4 (7.5 g), KH2PO4 (7.5 g), (NH4)2HPO4 (3 g), MgSO4.7H2O (0.2 g), FeSO4.7H2O (0.01 g) and MnSO4.7H2O (0.007 g). The pH of the medium was adjusted to 8.0 before sterilization. For growths on solid medium, agar was added at a final concentration of 13% (w/v) before sterilization. Prebiotics or glucose (Sigma, St. Louis, MO, USA) were used as unique carbon sources. Glucose-containing medium was used as a control. Commercial prebiotics and the corresponding suppliers are presented in Table S1 (see Supplementary Materials). Carbohydrate solutions were filtered through a 0.22 µm pore-size filter and added to the sterile medium to obtain a final substrate concentration of 10 g/L. Ox bile salts (Sigma) were dissolved in distilled water, filtered through a 0.22 µm membrane and added to the sterile medium to a final concentration of 5 g/L or 10 g/L. Cultures were incubated aerobically in 100 mL at 37 °C under agitation at 150 rpm.

2.3. Growth Experiments

The glucose- or prebiotic-containing agar plates were inoculated with end-log-phase precultures in the corresponding carbohydrate and incubated aerobically for 36 h at 37 °C. The glucose- or IMOS-containing broths were inoculated with end-log phase precultures in glucose or IMOS to an optical density at 595 nm of 0.05, and incubated aerobically for 24 h or 48 h at 37 °C in an orbital shaker at 150 rpm together with controls. Growth kinetics were monitored by OD measurements at 595 nm (Jenway 7300 spectrophotometer, Cole-Palmer, Villepinte, France) for 24 h or 48 h with respect to time-zero absorbance.

2.4. Determination of Substrate Utilization in the Culture Medium

Carbohydrates in the supernatant were analyzed by high-performance liquid chromatography with refractometric detection (Kontron, Ismaning, Germany). Rezex™ RSO Oligosaccharides Ag+ column (200 × 10 mm, Phenomenex, Torrance, CA, USA), coupled with Rezex™ 60 × 10 mm (Phenomenex) pre-column, was used at 85 °C for the determination of DP1, DP2 and DP3 oligosaccharides. A total of 1 mL of culture supernatant was centrifuged at 8000× g for 5 min at 4 °C and 20 µL of supernatant was injected. The column was eluted by 0.3 mL/min of ultrapure water as mobile phase in an isocratic mode, as described by the supplier.

2.5. Determination of Glucosidase Activity

Glucosidase was assayed by adding 25 µL of culture supernatant to 0.5 × 10⁻⁶ M of soluble substrate paranitrophenyl α-D glucopyranoside or paranitrophenyl β-D glucopyranoside in 450 µL of 0.05 × 10⁻³ M sodium carbonate buffer at pH 4.5. The reaction mixture was incubated at 30 °C for 2 h and the reaction stopped by adding 500 µL of 1 M disodium carbonate at pH 4.5. Optical density (OD) was measured after 15 min at 405 nm. One unit of enzyme activity was defined as the amount of enzyme that released 1 mol of paranitrophenol per mol of proteins per min under the standard assay conditions.

2.6. Determination of Lactate and Short-Chain Fatty Acid (SCFA) Production

A total of 500 μL of culture supernatant was harvested after 0, 8, 12 and 24 h of culture, then diluted with 1 M of sulfuric acid to a final concentration of 5 mM. A total of 15 μL of 10 mg/mL of 3-methylvaleric acid was added to the mixture (as internal standard). Supernatants were injected into an Aminex HPX-87H column (300 × 7.8 mm, BioRad, Hercules, CA, USA) protected by a Micro-Guard pre-column (BioRad). The elution was performed with 5 mM of sulfuric acid in isocratic mode at a flow rate of 0.6 mL/min and a temperature of 35 °C. Detection was performed by a spectrophotometer (Waters 2489 UV/visible detector) set at 215 nm. Qualitative and quantitative analyses were conducted by comparing the peak’s relative retention times and areas of unknown compounds with those of a standard mixture of organic acids (lactic acid, acetic acid, propionic acid, butyric acid, isobutyric acid, valeric and isovaleric acids). Data are expressed as the absolute concentration in mg/mL.

2.7. Proteomic Analysis

2.7.1. Preparation of Protein Samples

Protein sample preparation was adapted from Li et al. [25]. Briefly, four end-log-phase Bacillus subtilis cultures (12 h of culture) in the presence of glucose (control) or IMOS as unique carbon sources were centrifuged for 20 min at 3500× g. The absence of spores (below 5%) was confirmed by Gram and malachite green stainings. The pellets were washed three times with a low-salt washing buffer then vacuum-dried and stored at −20 °C. Dried pellets were resuspended in 1 mL of 40 mM Tris pH 8 containing a protease inhibitor cocktail (Roche, Basel, Switzerland) and ruptured by sonication for 10 min (pulse 10 s–stop 50 s) at 4 °C. A total of 15 U RQ1 DNase and 0.015 mL of 10 mM RNase A were added to the suspension for 1 h at 4 °C. The samples were dried again and resuspended into 0.5 mL of 8 M urea, 2 M thiourea, 4% CHAPS, 40 mM Tris and 60 mM DTT. After 30 min at 4 °C and at room temperature for 30 min more, the suspension was centrifuged at 8000× g for 15 min. The supernatant was collected and protein purification was performed using a 2D Clean-Up kit (Cytiva, Uppsala, Sweden), as described by the manufacturer. Protein concentration was determined using the 2D Quant Kit (Cytiva). Aliquots of 150 µg of proteins were stored at −80 °C until used for 2-DE.

2.7.2. Isoelectrofocalization (IEF)

Isoelectric focusing was performed in Immobiline IPG strips (Immobiline™ DryStrip pH 4–7, 7 cm, Cytiva) on an IPGphor system (Cytiva) in triplicate for each sample. Strips were placed for 12 h in a rehydration solution with a final concentration of 8 M urea, 2 M thiourea, 4% CHAPS (w/v), 65 mM DTT, traces of bromophenol blue and 0.5% (v/v) of IPG Buffer (Cytiva). A total of 150 µg of protein samples was mixed with DTT and IPG buffers (Cytiva) to final concentrations of 65 mM and 0.5% (v/v), respectively. The mixture was pipetted onto the strip holder. Isoelectric focusing (IEF) was conducted at 20 °C on the IPGphor unit, with a maximal intensity of 50 µA per strip, under the following steps: (1) Grad 300 V for 1 h, (2) 1000 V for 2 h, (3) 5000 V for 2 h (4) and Step 5000 V for 2 h.
After focusing, the strips were soaked for 15 min in reduction solution (Tris pH 8.8, 2% SDS, 6 M urea, 30% glycerol and 125 mM DTT), followed by 15 min in an alkylation solution (Tris pH 8.8, 2% SDS, 6 M urea, 30% glycerol, 125 mM iodoacetamide and traces of bromophenol blue).

2.7.3. SDS-PAGE

The strips were loaded on 10% polyacrylamide gels and run on a Mini VE 260 Hoefer (Cytiva) powered by an Electrophoresis Power Supply 1001 (Cytiva) at 100 V for approximately 2 h 30 min. Migration was performed in a buffer containing glycine 192 mM, Tris 25 mM and SDS 0.1% (v/v) at 4 °C. For staining, proteins were first fixed for 2 h in a 30% (v/v) ethanol solution containing orthophosphoric acid 2% (v/v). Gels were then immersed in two successive bathings of orthophosphoric acid 2% (v/v) for 30 min. Protein staining was performed in a solution of ammonium sulfate 1.2 mM containing ethanol 18% (v/v) and orthophosphoric acid 2% (v/v). After 30 min, a solution of Coomassie blue 0.5% (w/v) (G-250, Sigma, USA) was added in the bath at 1% (v/v). Gel staining was performed during 72 h under low agitation at room temperature. The scanning of 2D-PAGE gels was conducted using Scanner II (Cytiva) coupled with Labscan software from the same provider. Image and statistical analyses were performed with Progenesis Samespot software from NonLinear Dynamics (Newcastle, UK). Images of the IMOS condition were compared with the glucose condition as control. Spot intensity was normalized to the entire spot’s intensity to overcome experimental variability. Final values for the expression ratios of specific protein spots between IMOS condition and control were determined for >1.3- or <1.3-fold differences. The statistical significance of each expression level was calculated using Student’s t-test on the logged ratio.

2.7.4. Protein Digestion

The stained protein spots were first excised from 2-DE gels. The excised spots were first destained by washing in milliQ distilled water, then dehydrated in 50 μL of acetonitrile (ACN) followed by rehydration in 50 μL of 100 mM ammonium bicarbonate for 15 min at 37 °C. An equivalent volume of ACN was then added to the mix and further incubated for 15 min at 37 °C. The samples were then dried by vacuum desiccator (Speed Vac, Thermo Scientific, Waltham, MA, USA). Sequencing grade modified trypsin (Promega, Madison, WI, USA) was prepared from a stock solution at 100 ng/μL and diluted in 25 mM ammonium bicarbonate to a final concentration of 10 ng/μL. Dehydrated spots were incubated in 25 μL of 10 ng/μL trypsin diluted in 25 mM ammonium bicarbonate pH 8 overnight at 37 °C. The supernatant was then collected in a 0.5 mL microcentrifuge tube and the digested peptides were extracted sequentially in 50 μL of 40% ACN/1% formic acid (FA), then 10 μL of 25% ACN/1% FA and finally 25 μL of 60% ACN. All samples were then dried by evaporation using a vacuum desiccator.

2.7.5. MALDI-TOF/TOF-MS Analysis for Protein Identification

After tryptic digestion and evaporation, the peptides were resolubilized in 10 µL of 2% ACN/0.05% trifluoroacetic acid (TFA) for analysis by Nano-LC MS/MS. This system was composed of an Ultimate 3000 liquid Nano-chromatography (Thermo Scientific, Bleiswijk, The Netherlands) and the Probot (Thermo Scientific, The Netherlands) for spotting, coupled offline to a 4800 MALDI TOF/TOF mass spectrometer (Sciex, Framingham, MA, USA). For each sample, 5 µL was injected into a pre-column (C18 PepmapTM 300 µm ID × 5 mm, Thermo Scientific, The Netherlands) with a flow rate of 20 µL/min of 2% CAN/0.1% TFA. After a desalting step of 5 min, the pre-column was coupled to the analytical column (C18 PepmapTM 75 μm ID × 150 mm, Thermo Scientific, The Netherlands) previously equilibrated with 100% of solvent A (ACN 2%/TFA 0.1%). The peptides were eluted from the pre-column to the analytical column using a linear gradient from 0% to 50% of solvent B (ACN 90%/TFA 0.1%) for 45 min at a flow rate of 250 nL/min. At the column outlet, the eluate was mixed with the MALDI matrix (α-Cyano-4-hydroxycinnamic acid, CHCA at 3.3 mg/mL) containing 0.3 fmol/µL of Glu-1-Fibrinopeptide B (used for internal calibration), and spotted on the MALDI plate at the rate of one spot every 15 s. The plate was calibrated in MS and MS/MS with the PepMix4 mixture (Laser Biolabs, Sophia Antipolis, France). MS spectra were acquired by the MALDI TOF/TOF over a m/z mass range of 800 to 4000 with a laser intensity set at 3100 (arbitrary units) with 600 laser shots per spot. A list of precursors was established on the basis of the following criteria: the 100 most intense peaks per spot with a signal-to-noise ratio of at least 5. The precursors were then fragmented in MS/MS starting with the weakest (intensity of 4000 laser).

2.7.6. Peptide Identification

For protein identification, the Nano-LC MS/MS results were analyzed by Protein Pilot software (version 4.5, Sciex, Framingham, MA, USA) to be search for in the UniProt database (release 2014_09) via the Mascot software (version 2.2, Matrix Science, London, UK) with the following criteria: species Bacillus subtilis, 0.5 Da tolerance for peptide and peptide fragment mass, a single missed cleavage site allowed during trypsin digestion, and carbamidomethylation of cysteine residues (due to the alkylation of -SH groups by iodoacetamide) and oxidation of methionine as variable modifications. Protein identification was validated if at least 2 peptides had a score of greater than 25, or 1 peptide had a score of greater than 50 at a confidence level of at least 95%. A figure of the proposed model based on the proteomic analysis was produced with Microsoft PowerPoint Professional Plus 2019.

2.8. Tolerance to Bile

Bile tolerance was evaluated for both vegetative bacteria or spores. Spores were obtained after four days of culture in minimal medium with glucose or IMOS (94% of spores were obtained). The % of sporulation was confirmed by Gram and malachite green stainings. The samples were then heat at 80 °C/10 min to kill vegetative cells. Bile tolerance was tested by incubating vegetative cells or spores in minimal medium containing 0.5% (w/v) of bile salts and 10 g/L of carbon source in 48-well microplate. Cultures were incubated over 48 h at 37 °C with 150 rpm shaking. OD measurements were performed at 595 nm by a spectrophotometer (TECAN™, Sunrise Remote, Grödig, Austria) with automatic reading every hour.

2.9. Statistical Analysis

For each studied parameter, data were expressed as mean (±SD). Figures and statistical analyses were produced using Prism 8.0.1 (GraphPad, San Diego, CA, USA). Except for proteomics data, the differences between the IMOS group and glucose (control) were compared using the Mann–Whitney test. * p < 0.05, ** p < 0.01 and *** p < 0.001 were used to indicate statistical significances. Regarding the proteomics data, the statistical significance of each expression level was calculated using Student’s t-test on the logged ratio.

3. Results

3.1. Growth Ability of B. subtilis Probiotic Strains on Prebiotics

We selected five Bacillus strains marketed as probiotics; then, we first determined their ability to use prebiotic oligosaccharides as a carbon source for their growth. The tested prebiotics and suppliers are presented in Table S1 (see Supplementary Information). The growth measurements of the Bacillus strains on each oligosaccharide was performed on agar minimum medium containing a single prebiotic source. After 36 h of growth, the analysis was qualitatively performed by the simple observation of colony sizes in comparison to a glucose reference, and the results are reported in Table 1. Excepted with lactulose, all the prebiotics tested seemed to allow the growth of the studied strains, with the exception of B. cereus CH. Among all of these oligosaccharides, galactooligosaccharides (GOSs), soy oligosaccharides (SOSs) and isomaltooligosaccharides (IMOSs) appear to be the most effective substrates on Bacillus strains, and seem to promote the production of exopolysaccharides or EPSs (larger halo observed around the colonies, data not shown). Since IMOSs are a starch hydrolysate and a significant number of strains of the Bacillus genus are known to grow with starch as a unique carbon source, and given the high purity of the commercial substrate, we then focused our study on IMOSs. Because of our extensive knowledge of the probiotic B. subtilis CU1, and its in vivo probiotic properties, we selected the association of B. subtilis CU1 and IMOS for the following experiments. The results obtained for B. subtilis CU1 are presented in Figure S1.

3.2. Chemical Analysis of Commercial IMOS Structure

IMOSs were produced from starch after enzymatic reaction. For a better understanding of the prebiotic effect, commercial IMOSs obtained from Nanjing Zelang (Nanjing, China) were characterized by MALDI-MS/MS and ESI MS in reflecting and linear modes (Figure S2A,B, respectively). The values of m/z, corresponding intensities and structures are presented in Table 2 and Table 3, respectively. The repartition of the degree of polymerization (DP) in the sample was estimated to be comprised between 1 and 29. Spectrometric analysis permitted us to confirm that the bonds between glucose units were α(1 → 4) and α(1 → 6) linkages (Figure 1A). Figure 1B represents the general structure of IMOSs.

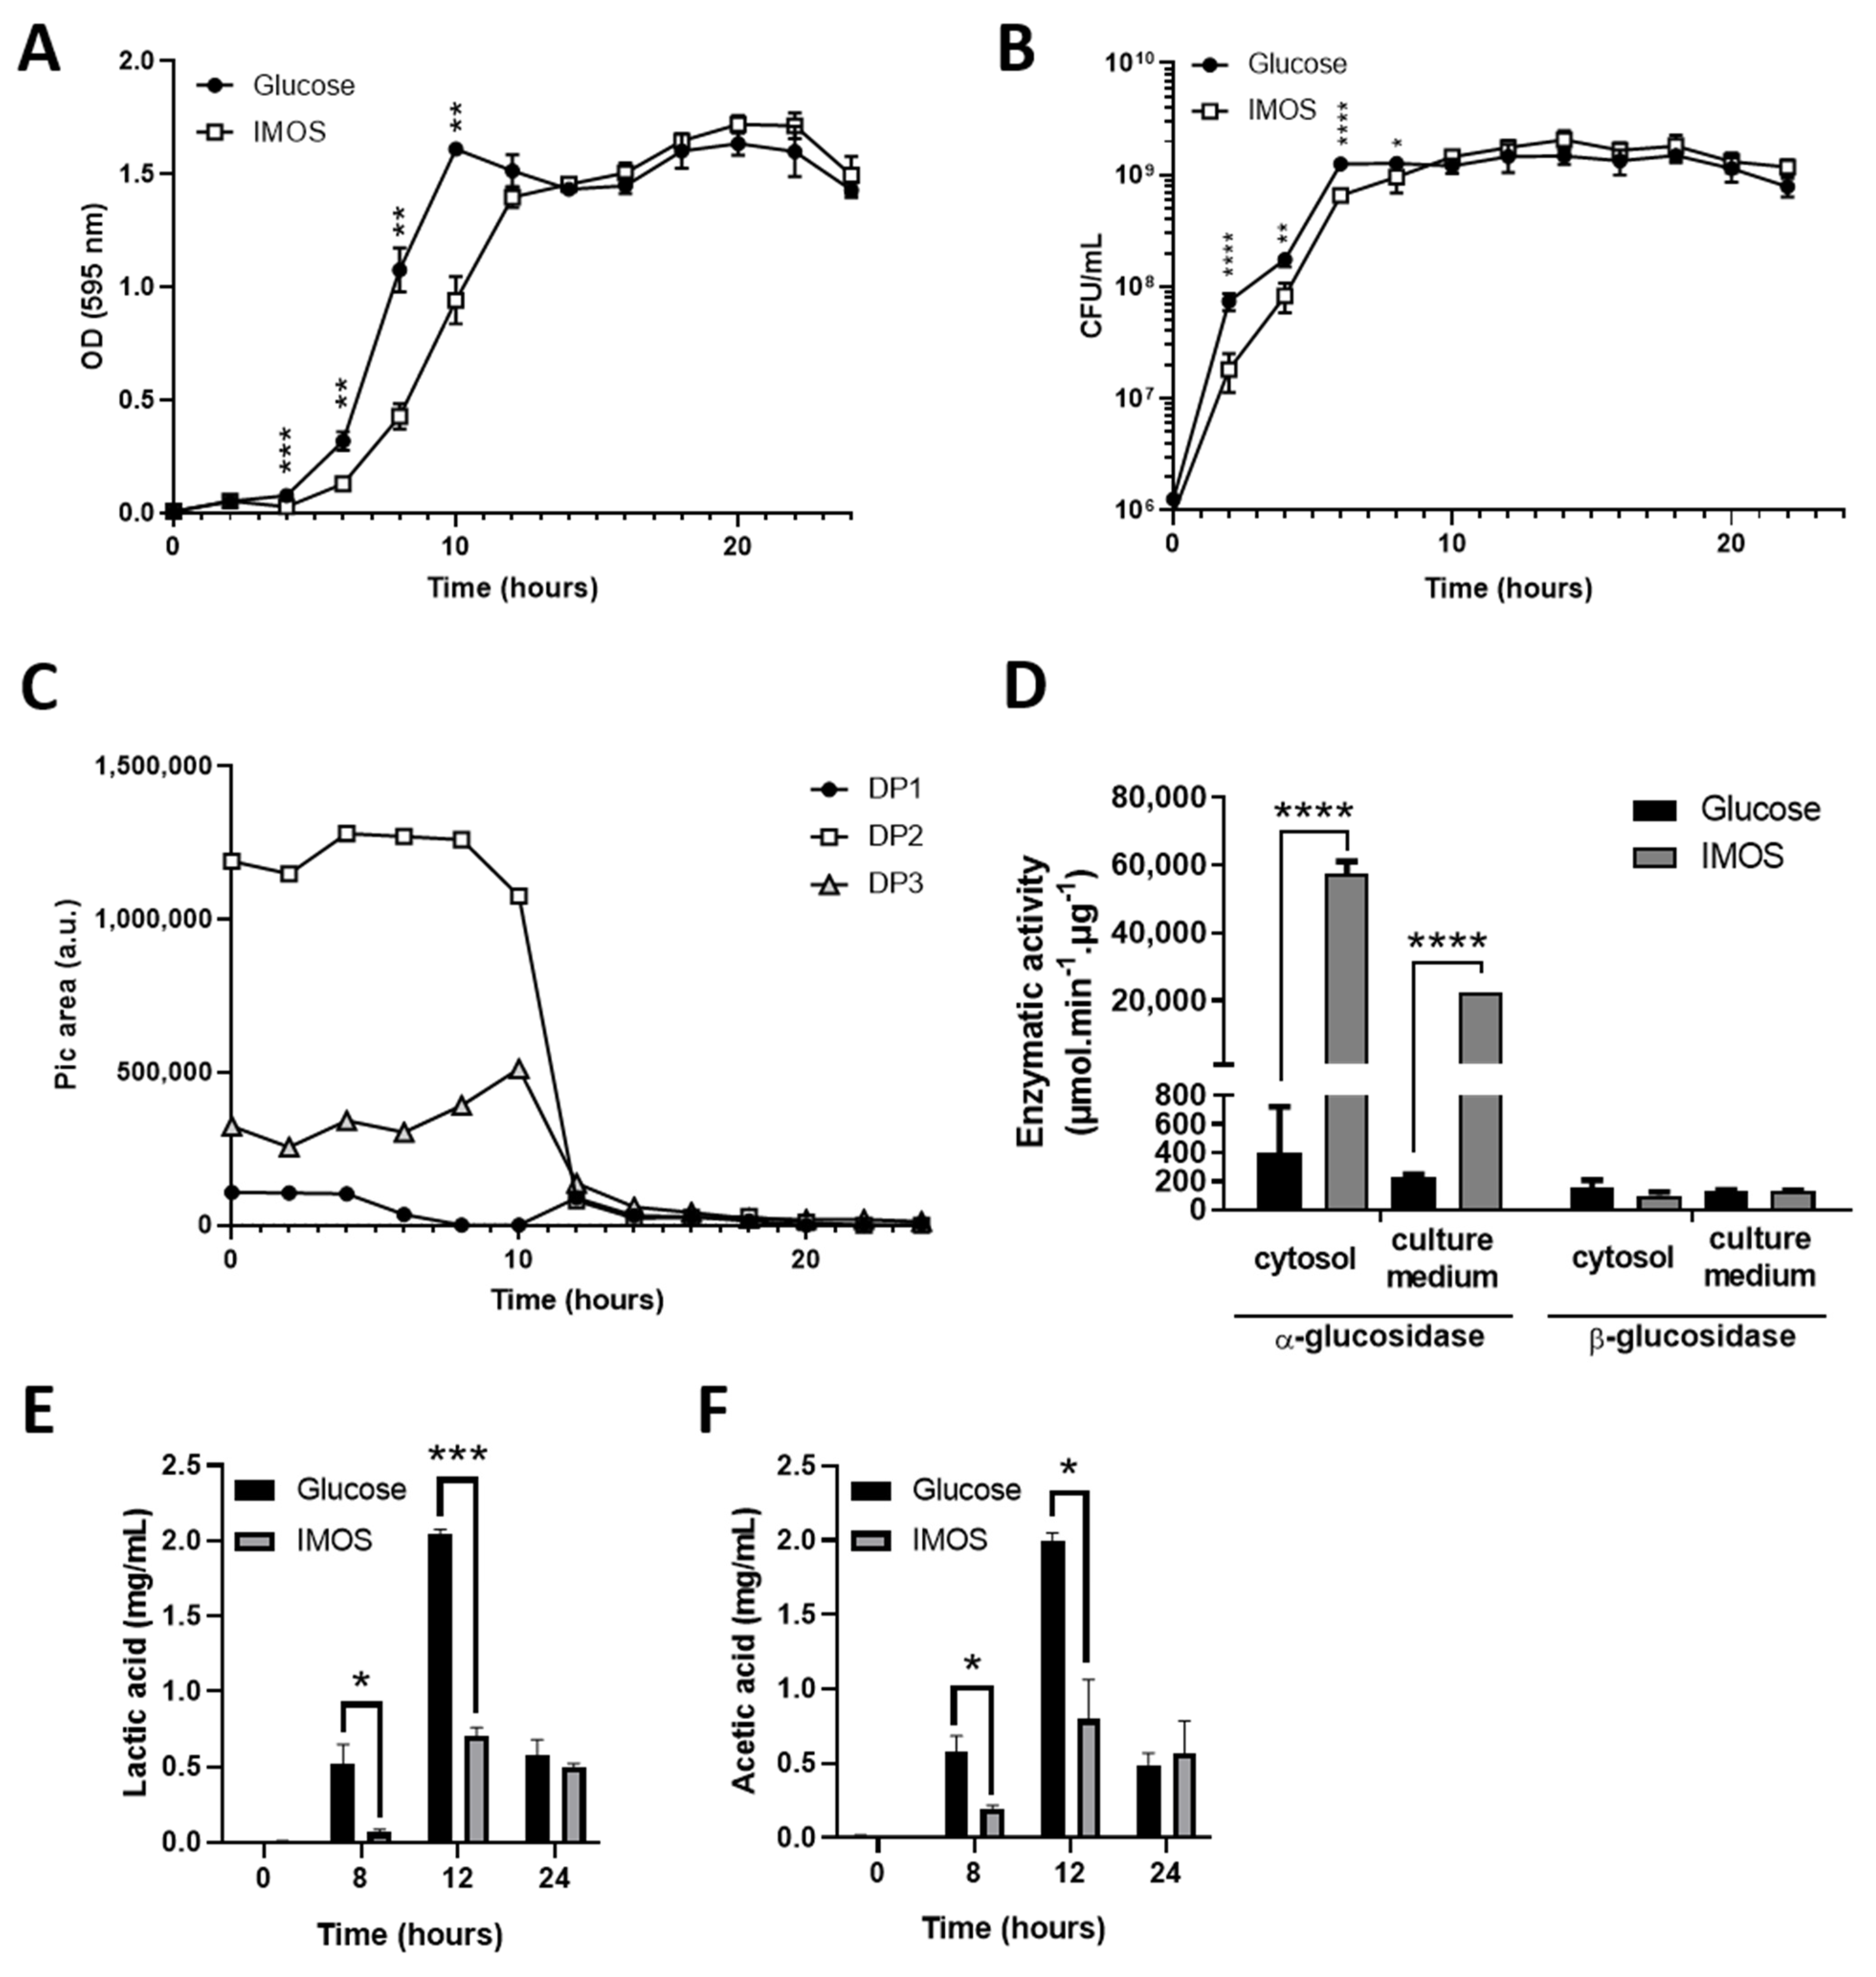
3.3. B. subtilis CU1 Is Able to Grow on IMOSs as a Unique Carbon Source

The growth kinetics of probiotic B. subtilis CU1 were determined in minimal medium with IMOS as a unique carbon source and compared to glucose as the control carbon source. Figure 2A represents OD measurements at 595 nm, and Figure 2B represents CFU/mL determination during the growth of the strain. The results show that B. subtilis CU1 is able to grow in minimal conditions on both glucose and IMOS containing medium (Figure 2A,B). The growth kinetics are similar on both carbon sources, but with a higher generation time on IMOS (85.2 min on IMOS against 63 min on glucose estimated from the maximum specific growth rate). The general shape of the growth curves obtained by bacterial numeration on agar plates supports the results obtained by OD measurements, with a final bacterial concentration at 12 h of about 109 CFU/mL with each substrate (Figure 2B). No growth was observed on the minimal medium without a carbon source (data not shown).

3.4. IMOSs Are Hydrolyzed in the Extracellular Medium

Given the diversity of DP in the IMOS mix, the consumption of mono-(DP1), di-(DP2) and trisaccharide (DP3) was monitored by HPLC every 2 h in the culture medium of B. subtilis CU1 during its growth on IMOS. We noted that, among those three saccharides, a major proportion of isomaltose (DP2) was found in the mix before adding the bacteria to the medium, while a weak amount of glucose was measured (Figure 2C). We observed that the glucose monomer was the first metabolized carbohydrate, whatever its initial concentration in the culture medium (Figure 2C), while higher DP were metabolized after the consumption of glucose. We also observed that glucose residues were totally consumed after 8 h of growth. However, the glucose level increased between 12 h and 14 h of growth to reach its initial concentration, while higher DP oligosaccharides were consumed. Moreover, increasing concentrations of DP2 and DP3 before their consumption by the strain was also observed. These results suppose that high DP IMOSs are hydrolyzed in shorter oligosaccharides in the culture medium, suggesting that a glucosidase is released by the strain during its growth.

3.5. IMOS Induces α-Glucosidase Activity in B. subtilis CU1 and Reduces Lactic and Acetic Acid Production

Given the ability of the strain to use IMOS as a unique carbon source, we monitored the possible release of glucosidase in the culture medium. The activities of α- and β-glucosidases were determined in the culture medium and in the cytosol of B. subtilis at the end-log phase of growth with IMOS or glucose as unique carbon sources. No difference in the β-glucosidase activity was observed between the two tested conditions (Figure 2D). Moreover, the results show that only a basal level of α-glucosidase activity is detected in both the culture medium and the cytosol of B. subtilis CU1 after growth on glucose (Figure 2D). However, high α-glucosidase activity was detected in the supernatant and the cytosol of the strain in the culture medium with IMOS. These results suggest that the synthesis and release of α-glucosidase is specifically induced by IMOS when it is used as a carbon source. In order to explore the metabolism of IMOS, we determined the production of lactic acid and short-chain fatty acids (SCFAs) in the culture medium by HPLC. If no production of butyric and propionic acid was observed, we measured a drastic reduction in lactic acid and acetic production with IMOS when compared to glucose (Figure 2E,F, respectively).

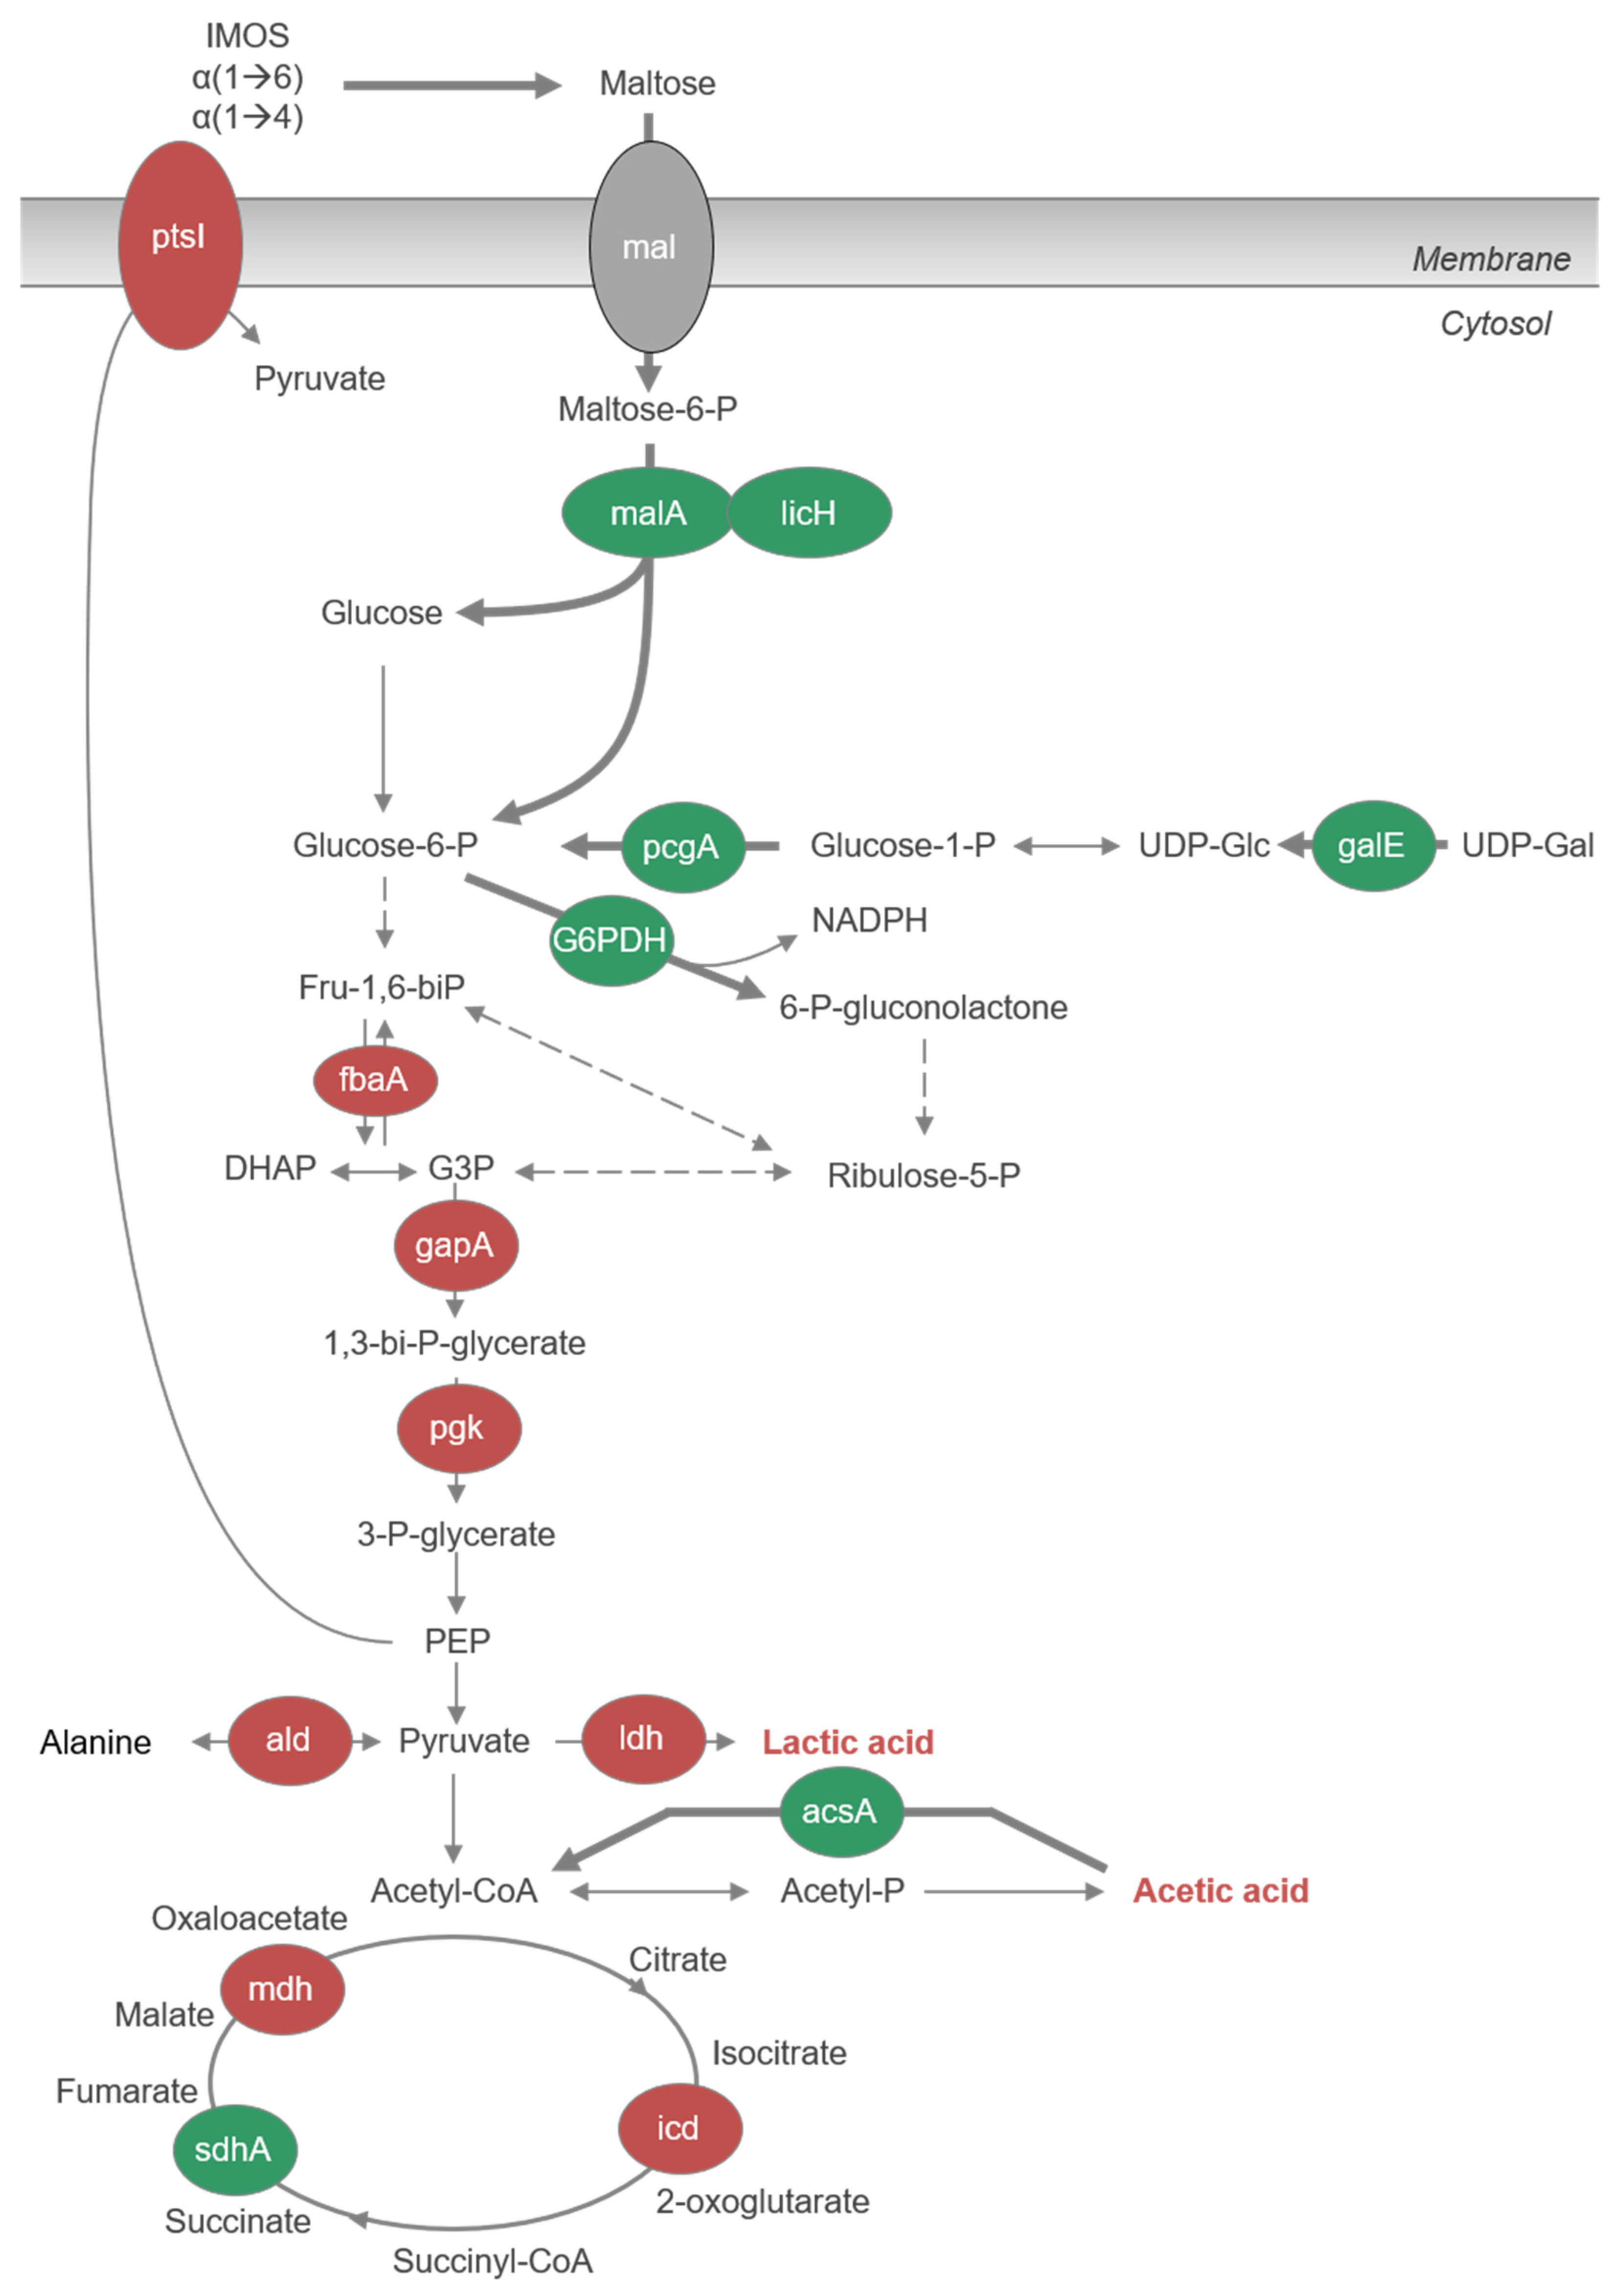
3.6. Proteome Analysis after Growth on IMOS

In order to investigate the metabolic effect of IMOS on the fitness of B. subtilis CU1, we assessed a 2D-PAGE proteomic analysis of the strain after 12 h of growth on glucose or IMOS as unique substrates (n = 3 per group). A total of 69 spots differentially expressed between the two groups were selected with a fold-change greater than 1.3 and a p-value ≤ 0.5 (Student’s t-test on the logged ratio), then subjected to identification by Nano-LC MALDI-TOF/TOF (Figure S3). Among them, 28 proteins were identified and are presented in Table 4. A total of 13 proteins were overexpressed and 15 under expressed in IMOS conditions. Several proteins involved in protein synthesis (elongation factor G, elongation factor Tu and chaperonin GroEL) as well as purine synthesis (glycine hydroxymethyltransferase) were identified among the under-expressed proteins. This observation could be explained by the slightly reduced growth of the bacteria at 12 h on the IMOS substrate, with a possibly reduced cellular proliferation. Several proteins involved in the metabolism and transport of carbohydrates were identified, including maltose-6-phosphate glucosidase, glyceraldehyde-3-phosphate dehydrogenase, phosphoglycerate kinase, probable 6-phospho-β-glucosidase and fructose bisphosphate aldolase. Maltose-6-phosphate glucosidase (GlvA or MalA), which is overexpressed in the presence of IMOS, is an enzyme capable of hydrolyzing maltose-6-phosphate into glucose and glucose-6-phosphate, suggesting the upstream transformation of IMOS into maltose-6-phosphate and isomaltose-6-phosphate. Glyceraldehyde-3-phosphate dehydrogenase (GapA or GAPDH) is downregulated in the presence of IMOS. It is a key kinase of glycolysis, which enables the reversible conversion of glyceraldehyde-3-phosphate to glyceraldehyde-1,3-bisphosphate [26] for the production of pyruvate. The reaction catalyzed by this enzyme is also responsible for the production of reducing force (NADH). The identification of a 6-phospho-β-glucosidase for few spots is difficult to explain. Indeed, no β-glycosidic bond was observed by mass spectrometry in the structure of IMOS, and the use of this enzyme for the assimilation of the prebiotic substrate has not been demonstrated. In contrast, two other glycolysis enzymes, a phosphoglycerate kinase (Pgk) and a probable fructose bisphosphate aldolase (FbaA), were under expressed in the presence of IMOS. FbaA catalyzes a reversible aldolization reaction of glyceraldehyde-3-phosphate to fructose 1,6-bisphosphate. We also observed the repression of LDH expression in the presence of IMOS, which explains the decrease in lactic acid production reported in this study (Figure 2E). UDP-glucose 4-epimerase (GalE) is overexpressed in the presence of IMOS. It is a galactose metabolic enzyme that catalyzes the reversible conversion of UDP-galactose to UDP-glucose, coupled with the reduction in NAD. UDP-glucose and UDP-galactose are nucleotides required for the biosynthesis of exopolysaccharides (EPSs) [27]. In addition, in B. subtilis, GalE catalyzes the interconversion of UDP-GlcNac to UDP-GalNac [28]. This result suggests that IMOS could modulate the synthesis of EPS by B. subtilis CU1, as observed on the agar plate. The expression of isocitrate dehydrogenase (icd), an enzyme involved in the Krebs cycle, is reduced in the presence of IMOSs. In bacteria, this enzyme is repressed by an isocitrate dehydrogenase kinase that inactivates the enzyme by phosphorylation when there is sufficient ATP in the cell. It seems that a second regulatory site, this time at the level of transcription or translation, can be set up by the bacteria to control ATP levels in the cell. This observation suggests that the energy yield with IMOS is greater than with glucose as the sole carbon substrate. Succinate dehydrogenase (SdhA) and malate dehydrogenase (Mdh) are two enzymes involved in the Krebs cycle. In the presence of IMOSs, the overexpression of SdhA allows the transfer of electrons from succinate to the respiratory chain, thereby increasing energy production in the form of ATP. The Mdh enzyme, which transforms malate into oxaloacetate, is suppressed.
Finally, we observed a reduction in TasA, a protein involved in sporulation and released by the bacteria prior to the process [29]. This result suggests that sporulation could be delayed with IMOS as a carbon substrate when compared to glucose. Overall, our results show that IMOS as a substrate leads to a reshaping of B. subtilis CU1 metabolism and functions. A proposed model for IMOS metabolism in B. subtilis CU1 is presented Figure 3. Our observations raised the question whether these changes could enhance the probiotic effects of the bacteria.

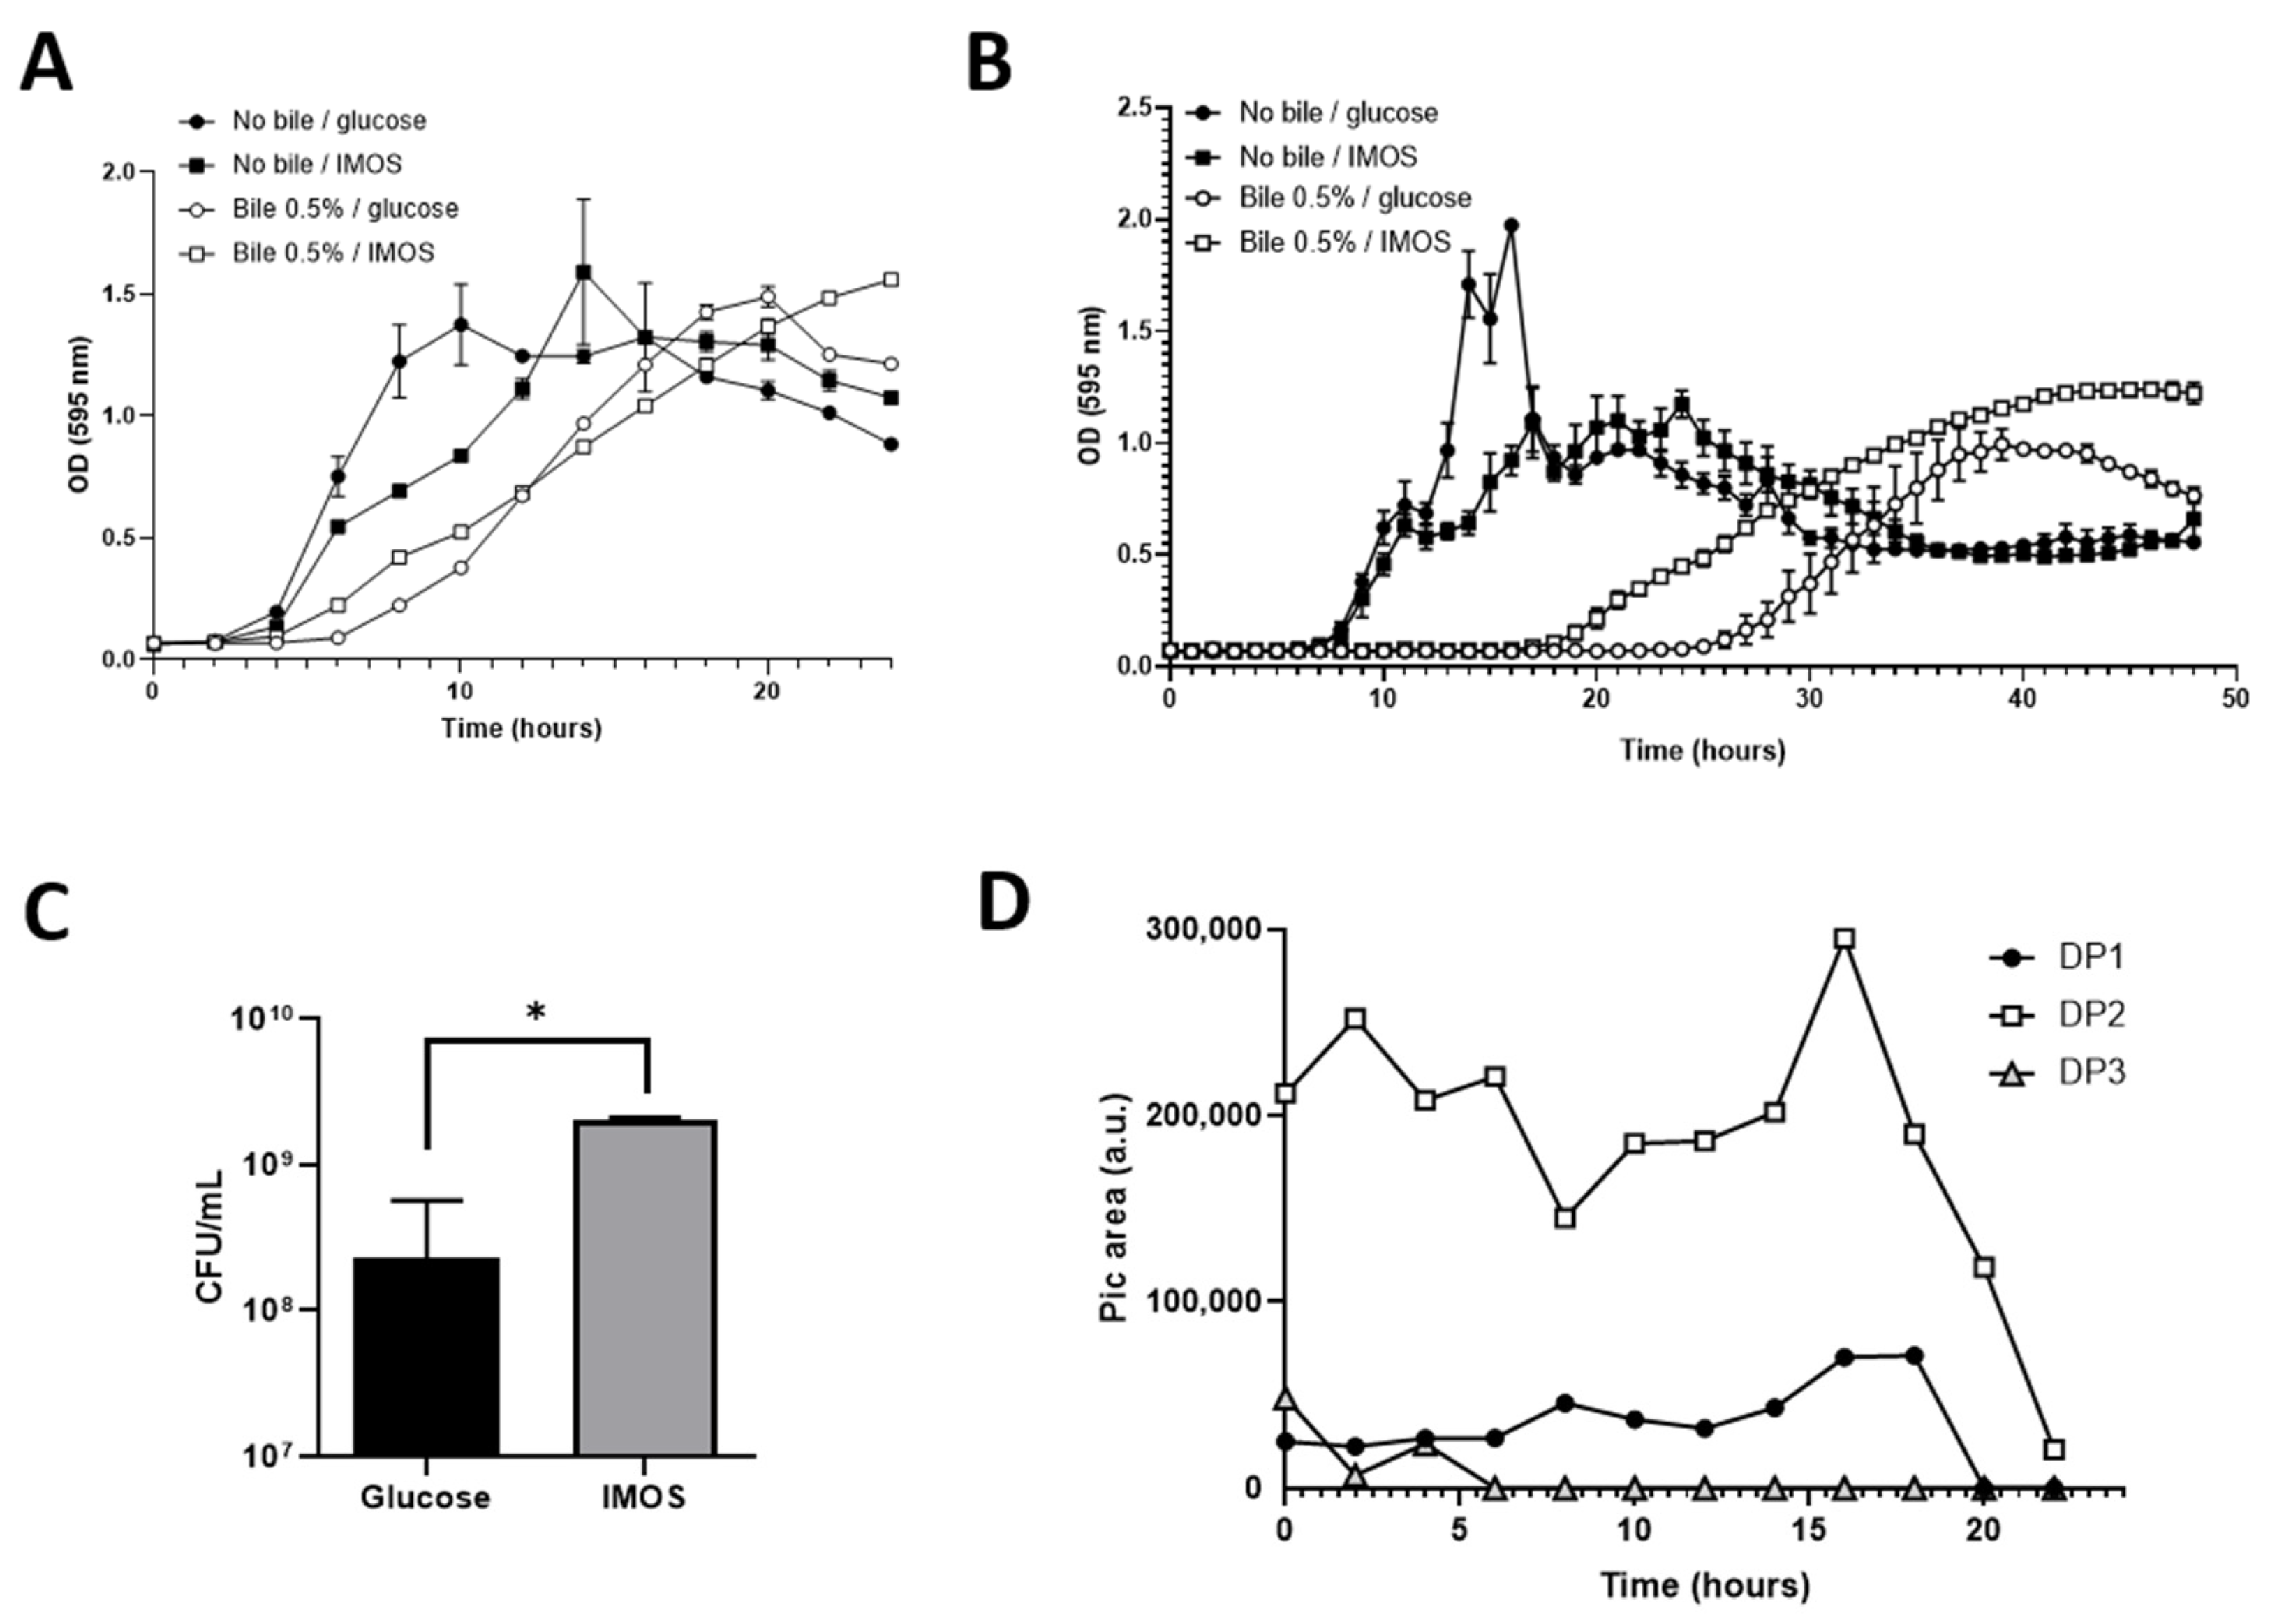
3.7. IMOSs Provide a Fitness Advantage to B. subtilis CU1 for Bile Tolerance

Bile tolerance is a criterion used to select probiotic strains. The bile tolerance of B. subtilis CU1 have been previously observed (personal data), but its viability after 24 h of incubation at 37 °C in presence of bile salts (0.5%) is lower than those of the Bacillus clausii strains from the Enterogermina® product [30]. In this section, we first investigated the influence of the carbon source on the bacteria growth in presence or absence of 0.5% bile by the measurement of the OD at 595 nm (Figure 4A). In the absence of bile, we observed the same growth pattern as reported in Section 3.3. In glucose medium, bile increases the lag-time and reduces the growth rate, but the growth profiles are quite similar compared to the results obtained in absence of bile salts (Figure 4A). However, with IMOSs, the exponential growth phase of B. subtilis started earlier when compared to glucose (Figure 4A). Lag-time due to bile seemed to be reduced in the presence of IMOS as a unique carbon source, and the cell yield after 24 h was higher compared to growth with glucose.
Bacillus probiotics are formulated as spore preparations. In this context, it is important to study the impact of IMOSs on spore germination in the presence of bile salts. We regarded the ability of B. subtilis spores to germinate and grow in the presence of 0.5% bile salts with glucose or IMOS as unique carbon sources during 50 h by measuring the OD at 595 nm. The results presented here for spore germination in IMOSs were obtained with spores prepared in IMOSs, while germination in glucose was assessed with spores prepared in glucose. The lag-time before the beginning of the growth phase was reduced by 8 h with IMOS as a carbon source (Figure 4B), indicating an improvement in the germination time in the presence of bile. Moreover, growth seemed to continue for a longer period of time with IMOS (Figure 4B), and the levels of CFU/mL were increased by about 1 log in IMOS cultures after 48 h when compared to glucose (Figure 4C). Taken together, these results show that IMOSs can enhance the bile resistance of B. subtilis CU1 vegetative cells and spores, and favor the germination of B. subtilis CU1 spores. However, we have not observed any effects on germination in the absence of bile (data not shown). To understand the mechanisms underlying this effect, we followed the carbon source consumption during the growth in the presence of 0.5% of bile salts. Figure 4D shows that glucose (DP1) is not the first metabolized carbon source in comparison to our previous results without bile salts. DP1 and DP2 were consumed by the bacteria at the same time, and higher levels of DP2 were rapidly produced in the culture medium, which implies α-glucosidase release. In the presence of bile salts, the strain seemed to inhibit the repression of IMOS utilization, despite the availability of glucose in the culture medium.

4. Discussion

Environmental probiotic Bacillus species display the potential to support human and animal microbiota. Bacterial spore formers of the Bacillus genus are being used as probiotic supplements for use in animals and humans. Indeed, endospore formers are interesting because their spores are resistant to acidic pH and stable for long periods of time in probiotic preparations [31]. However, new strategies to improve the germination, fitness and bioactivity of Bacillus probiotics, once in the gut, have to be explored [32]. Among these strategies, the combination with dietary fibers, such as prebiotics, has retained the attention of the research and industry communities. In this work, we showed the ability of several Bacillus probiotic strains to grow on commercial prebiotics. Among them, B. subtilis CU1 was grown on a commercial prebiotic substrate isomaltooligosaccharide (IMOS, Nanjing Zelang, China). B. subtilis CU1 is used in a probiotic preparation for oral bacteriotherapy of gastrointestinal disorders, microbiota dysbiosis and to enhance immunity [13,14,33]. However, little is known regarding the possible association of B. subtilis CU1 with certain prebiotics, such as IMOS.
Structural spectrometric analysis of the commercial IMOS purchased for this study showed a composition with glucose units with α(1 → 4) and α(1 → 6) linkages, and a degree of polymerization (DP) estimated between 1 and 29. Depending on the manufacturer, commercial preparations of IMOSs could be quite different and influence their digestibility [34]. As a functional oligosaccharide, IMOS has been demonstrated to improve gut microbiota and promote the proliferation of beneficial bacteria, especially Bifidobacteria [35]. Moreover, the beneficial effects of IMOSs on animal and human health have been previously described [36,37], but little is known about the effect of a diet supplementation with IMOSs on the metabolism and fitness of probiotic Bacilli, especially in humans. It is known that Bacillus subtilis strains can be used to attenuate dysbiosis in vitro and in animals [38,39,40,41]. Moreover, Li et al. [42] reported that Bacillus and IMOSs complement each other in improving gut microbiota populations and intestinal disorders. More recently, Gu et al. [43,44] reported that dietary IMOSs and Bacillus supplementation regulated the concentration of serum reproductive hormones and the duration of farrowing and post-weaning estrus by changing the gut microbiota of sows. If few papers have reported the beneficial effects of the IMOS and Bacillus combination, to our knowledge, there is no study evaluating if IMOSs could support Bacillus metabolism and physiology once in the gut and how IMOS could improve Bacillus probiotic effects. Commercial probiotic Bacilli, including B. subtilis CU1, are commercialized under spore form. This means that the bacteria reach the intestinal tract as a spore, and are able to germinate if the conditions are favorable [7,8]. In a competitive microbial environment, nutrient acquisition is a major contributor to the survival of any individual bacterial species, and the ability to access uncommon energy sources can provide a fitness advantage. The enhancement of metabolic conditions for probiotic CU1 could be of great interest to improve probiotic efficiency. For this reason, we next evaluated the effect of IMOSs on bacteria physiology. We have shown that high DP IMOSs are hydrolyzed in shorter oligosaccharides, including DP1 and DP2, in the extracellular medium of B. subtilis CU1, suggesting that a glucosidase is released by the strain during its growth. We suggested that the slight increase in DP1 concentration between 10–12 h might have been due to the hydrolysis of DP3 and higher DP oligosaccharides. We showed that B. subtilis CU1 produced extracellular α-glucosidase, but not β-glucosidase, confirming the ability of the strain to hydrolyze high DP oligosaccharides in the culture medium. No study has previously reported the degradation mechanism of high DP IMOSs in the extracellular medium of Bacillus, and this ability could favor the development of the probiotic within the gut microbiota. Hu et al. [45] showed that the metabolism of IMOSs by Lactobacillus reuteri was attributed to α(1 → 6)-specific glucanase DexB and maltose phosphorylase, but limited to short-chain oligosaccharides. This extracellular hydrolytic activity could favor bioavailability for shorter IMOSs to stimulate the beneficial members of intestinal microbiota and increase microbiota bioactivity, as previously observed with other prebiotics [46,47]. We then compared the proteome of CU1 following growth on glucose or IMOSs. Several proteins involved in carbohydrate metabolism and transport were highlighted, including maltose-6-phosphate glucosidase (MalA) and phosphoenolpyruvate-protein phosphotransferase (PEP-PTS), which were overexpressed with IMOS when it was used as a unique carbon source. A proposed model for IMOS metabolism by B. subtilis CU1 is presented in Figure 3. Our observations suggest that IMOSs are metabolized into maltose in the extracellular medium through the secretion of certain glycolytic enzymes, such as glucoamylases and α-amylases [48], which cleaves α(1 → 6) ramifications and α(1 → 4) linkages, respectively. Maltose-6-phosphate is then accumulated into the bacteria via the PEP-PTS system. The maltose-6-phosphate was then taken up by GlvA to be hydrolyzed into glucose and glucose-6-phosphate, which can be used directly for glycolysis. GlvA is known to be induced in the presence of maltose and repressed in the presence of glucose [49], which agrees with our observations. However, glucose-6-phosphate dehydrogenase (G6PDH), the first enzyme of the pentose-phosphate pathway [50], was identified during a previous analysis conducted by one-dimensional electrophoresis and overexpressed in the presence of IMOSs (data not shown). These observations suggest that the metabolism of IMOSs could fuel the pentose phosphate pathway and increase the production of NADPH. Moreover, we observed a decreased expression of several enzymes involved in glycolysis and the TCA cycle, as well as a reduced amount of lactic and acetic acid production with IMOS as a substrate, suggesting a downregulation of mixed acid fermentation. Among the proteins overexpressed in IMOS cultures, UDP-N-acetylmuramoyl-l-alanyl-d-glutamate-2,6-diaminopimelate ligase plays a central role in the biosynthesis of peptidoglycan, while a spore coat-associated protein N is decreased. Taken together, our results show that IMOSs can drastically change the physiology and energy metabolism in CU1.
Finally, we reported that, in the presence of bile salt, IMOS utilization can provide an advantageous fitness to vegetative and spores of B. subtilis CU1. These results show that, in the presence of bile, IMOSs can promote spore germination more effectively than glucose. Spore germination is likely to be triggered by the presence of specific nutrients. If one hypothesizes that such an advantage of IMOSs can be transposed in vivo to the level of the intestinal tract, then the association of the probiotic in the form of spores with a prebiotic IMOS substrate, poorly absorbed in the intestine, could make it possible to increase the supply of carbon sources available for the strain. We expect that IMOSs can favor the bioactivity of the probiotic within the gut microbiota and increase its beneficial effects on dysbiosis and intestinal disorders in animals [40,44,51]. Generally, in the presence of specific nutrient molecules, termed germinants, which are sensed by the spores’ specific germinant receptors (GRs), the spores can rapidly return to active growth in the process of germination followed by outgrowth [52]. A study conducted by Hornstra et al. [53] showed that the rates and efficiency of spore germination were greatly decreased when B. cereus spores were prepared in a poor medium compared to a rich one. This hypothesis could also explain the beneficial effect of IMOSs on the probiotic germination. However, no effect on the germination of CU1 was observed in the absence of bile. In the presence of bile, DP1 no longer seemed to be the substrate preferentially used. DP2 appeared to be consumed first by the strain in small proportions. During further bacterial growth, DP2 was used simultaneously with glucose. These results suggest that a catabolic repression of IMOS use in the presence of glucose might be inhibited in the presence of bile. The role of carbohydrates in the mechanisms of bile resistance in the genus Bacillus have not been well described to date. However, changes in carbohydrate metabolism in the presence of bile have been reported in Bifidobacterium animalis and Bifidobacterium longum by Sanchez et al. [54,55,56,57]. Authors have reported an increased ATP production after incubation with bile through different pathways. While B. longum increases ATP production through glycolysis, B. animalis increases substrate-level phosphorylation. A study conducted by Perrin et al. [58] demonstrated that the bile resistance of B. breve and B. longum increased if the medium contained FOS, rather than its monomeric components glucose and fructose. It would seem that the effect of bile can be limited by the addition of a carbon source whose metabolism allows the strain to set up energy-dependent detoxification mechanisms. It is possible that higher energy yields are obtained with oligosaccharides compared to those obtained with monosaccharides, thus contributing to a better resistance to bile. The influence of the carbon source on bile tolerance has also been studied by Ruas-Madiedo et al. [59]. The authors followed the growth and fermentation of B. animalis subsp. lactis IPLA 4549, and its bile-resistant counterpart, in a medium containing glucose or maltose as a carbon source. The authors highlighted that, in the absence of bile, maltose leads to a more favorable growth of the bile-resistant strain, compared to what is observed with glucose. The authors hypothesized that the resistant strain adapted its metabolism to increase ATP yields by preferentially using maltose, although it could still use glucose if the nutrient intake decreased. A proteomic study suggests that, for the bile-resistant strain, the “D-fructose-6-phosphate shunt” moves to other metabolic pathways, i.e., to the degradation of oxalic acid, which could theoretically increase ATP production [56]. A similar observation was also reported for L. plantarum with an increase in a F0F1-ATP synthase expression in the presence of bile salts [60]. An extensive analysis is required to confirm these mechanisms in B. subtilis CU1 in the presence of IMOSs.
Taken together, our results suggest that IMOSs could be a good candidate to be associated with B. subtilis CU1 in a synbiotic product, in order to improve bacteria physiology in the gut and the germination of spores in the presence of bile. We expect that IMOSs could favor the bioactivity of the probiotic within the gut microbiota and increase its beneficial effects on microbiota-associated intestinal disorders.

Supplementary Materials

The following are available online at https://www.mdpi.com/article/10.3390/app12136404/s1, Figure S1: B. subtilis CU1 growth on minimal medium containing single prebiotic substrate; Figure S2: MS spectra obtained in reflective and linear modes; Figure S3: B. subtilis CU1 proteomic profile; Table S1: List of commercial oligosaccharides used in this study.

Author Contributions

Conceptualization, R.V., M.C.U., P.B. and T.-S.O.; methodology, R.V., E.P., K.V-D., K.G., C.L., D.R., M.C.U., P.B. and T.-S.O.; software, R.V.; validation, R.V., M.C.U., P.B. and T.-S.O.; formal analysis, R.V., E.P., K.V.-D. and D.R.; investigation, R.V., M.C.U., P.B. and T.-S.O.; resources, R.V., V.S., M.C.U., P.B. and T.-S.O.; data curation, R.V., E.P., K.V.-D. and D.R.; writing—original draft preparation, R.V.; writing—review and editing, R.V., V.S., M.C.U., P.B. and T.-S.O.; visualization, R.V. and M.C.U.; supervision, M.C.U., P.B. and T.-S.O.; project administration, T.-S.O., P.B. and V.S.; funding acquisition, P.B., V.S. and T.-S.O. All authors have read and agreed to the published version of the manuscript.

Funding

Romain Villéger received grant from the Région Limousin for this project.

Institutional Review Board Statement

Not applicable.

Informed Consent Statement

Not applicable.

Data Availability Statement

Not applicable.

Acknowledgments

We gratefully thank Région Limousin for funding this project and IUT Génie Biologique du Limousin for hosting the experiments.

Conflicts of Interest

The authors declare no conflict of interest.

References

  1. Hill, C.; Guarner, F.; Reid, G.; Gibson, G.R.; Merenstein, D.J.; Pot, B.; Morelli, L.; Canani, R.B.; Flint, H.J.; Salminen, S.; et al. Expert Consensus Document. The International Scientific Association for Probiotics and Prebiotics Consensus Statement on the Scope and Appropriate Use of the Term Probiotic. Nat. Rev. Gastroenterol. Hepatol. 2014, 11, 506–514. [Google Scholar] [CrossRef] [PubMed] [Green Version]
  2. Suez, J.; Zmora, N.; Segal, E.; Elinav, E. The Pros, Cons, and Many Unknowns of Probiotics. Nat. Med. 2019, 25, 716–729. [Google Scholar] [CrossRef] [PubMed]
  3. Wilkins, T.; Sequoia, J. Probiotics for Gastrointestinal Conditions: A Summary of the Evidence. Am. Fam. Physician 2017, 96, 170–178. [Google Scholar] [PubMed]
  4. Lee, N.-K.; Kim, W.-S.; Paik, H.-D. Bacillus Strains as Human Probiotics: Characterization, Safety, Microbiome, and Probiotic Carrier. Food Sci. Biotechnol. 2019, 28, 1297–1305. [Google Scholar] [CrossRef]
  5. Spinosa, M.R.; Braccini, T.; Ricca, E.; De Felice, M.; Morelli, L.; Pozzi, G.; Oggioni, M.R. On the Fate of Ingested Bacillus Spores. Res. Microbiol. 2000, 151, 361–368. [Google Scholar] [CrossRef]
  6. Barbosa, T.M.; Serra, C.R.; La Ragione, R.M.; Woodward, M.J.; Henriques, A.O. Screening for Bacillus Isolates in the Broiler Gastrointestinal Tract. Appl. Environ. Microbiol. 2005, 71, 968–978. [Google Scholar] [CrossRef] [Green Version]
  7. Casula, G.; Cutting, S.M. Bacillus Probiotics: Spore Germination in the Gastrointestinal Tract. Appl. Environ. Microbiol. 2002, 68, 2344–2352. [Google Scholar] [CrossRef] [Green Version]
  8. Duc, L.H.; Hong, H.A.; Cutting, S.M. Germination of the Spore in the Gastrointestinal Tract Provides a Novel Route for Heterologous Antigen Delivery. Vaccine 2003, 21, 4215–4224. [Google Scholar] [CrossRef]
  9. Ramirez-Peralta, A.; Zhang, P.; Li, Y.; Setlow, P. Effects of Sporulation Conditions on the Germination and Germination Protein Levels of Bacillus subtilis Spores. Appl. Environ. Microbiol. 2012, 78, 2689–2697. [Google Scholar] [CrossRef] [Green Version]
  10. Piewngam, P.; Zheng, Y.; Nguyen, T.H.; Dickey, S.W.; Joo, H.-S.; Villaruz, A.E.; Glose, K.A.; Fisher, E.L.; Hunt, R.L.; Li, B.; et al. Pathogen Elimination by Probiotic Bacillus via Signalling Interference. Nature 2018, 562, 532–537. [Google Scholar] [CrossRef]
  11. Urdaci, M.C.; Bressollier, P.; Pinchuk, I. Bacillus clausii Probiotic Strains: Antimicrobial and Immunomodulatory Activities. J. Clin. Gastroenterol. 2004, 38, S86–S90. [Google Scholar] [CrossRef] [PubMed] [Green Version]
  12. Villéger, R.; Saad, N.; Grenier, K.; Falourd, X.; Foucat, L.; Urdaci, M.C.; Bressollier, P.; Ouk, T.-S. Characterization of Lipoteichoic Acid Structures from Three Probiotic Bacillus Strains: Involvement of d-Alanine in Their Biological Activity. Antonie Van Leeuwenhoek 2014, 106, 693–706. [Google Scholar] [CrossRef] [PubMed] [Green Version]
  13. Lefevre, M.; Racedo, S.M.; Ripert, G.; Housez, B.; Cazaubiel, M.; Maudet, C.; Jüsten, P.; Marteau, P.; Urdaci, M.C. Probiotic Strain Bacillus subtilis CU1 Stimulates Immune System of Elderly during Common Infectious Disease Period: A Randomized, Double-Blind Placebo-Controlled Study. Immun. Ageing A 2015, 12, 24. [Google Scholar] [CrossRef] [PubMed] [Green Version]
  14. Urdaci, M.C.; Lefevre, M.; Lafforgue, G.; Cartier, C.; Rodriguez, B.; Fioramonti, J. Antidiarrheal Action of Bacillus subtilis CU1 CNCM I-2745 and Lactobacillus plantarum CNCM I-4547 in Mice. Front. Microbiol. 2018, 9, 1537. [Google Scholar] [CrossRef] [PubMed] [Green Version]
  15. Gibson, G.R.; Roberfroid, M.B. Dietary Modulation of the Human Colonic Microbiota: Introducing the Concept of Prebiotics. J. Nutr. 1995, 125, 1401–1412. [Google Scholar] [CrossRef] [PubMed]
  16. Laparra, J.M.; Sanz, Y. Interactions of Gut Microbiota with Functional Food Components and Nutraceuticals. Pharmacol. Res. 2010, 61, 219–225. [Google Scholar] [CrossRef] [Green Version]
  17. Gibson, G.R.; Hutkins, R.; Sanders, M.E.; Prescott, S.L.; Reimer, R.A.; Salminen, S.J.; Scott, K.; Stanton, C.; Swanson, K.S.; Cani, P.D.; et al. Expert Consensus Document: The International Scientific Association for Probiotics and Prebiotics (ISAPP) Consensus Statement on the Definition and Scope of Prebiotics. Nat. Rev. Gastroenterol. Hepatol. 2017, 14, 491–502. [Google Scholar] [CrossRef] [Green Version]
  18. Cencic, A.; Chingwaru, W. The Role of Functional Foods, Nutraceuticals, and Food Supplements in Intestinal Health. Nutrients 2010, 2, 611–625. [Google Scholar] [CrossRef]
  19. Kaneko, T.; Yokoyama, A.; Suzuki, M. Digestibility Characteristics of Isomaltooligosaccharides in Comparison with Several Saccharides Using the Rat Jejunum Loop Method. Biosci. Biotechnol. Biochem. 1995, 59, 1190–1194. [Google Scholar] [CrossRef] [Green Version]
  20. Yen, C.-H.; Tseng, Y.-H.; Kuo, Y.-W.; Lee, M.-C.; Chen, H.-L. Long-Term Supplementation of Isomalto-Oligosaccharides Improved Colonic Microflora Profile, Bowel Function, and Blood Cholesterol Levels in Constipated Elderly People—A Placebo-Controlled, Diet-Controlled Trial. Nutrition 2011, 27, 445–450. [Google Scholar] [CrossRef]
  21. Ketabi, A.; Dieleman, L.A.; Gänzle, M.G. Influence of Isomalto-Oligosaccharides on Intestinal Microbiota in Rats. J. Appl. Microbiol. 2011, 110, 1297–1306. [Google Scholar] [CrossRef] [PubMed]
  22. Rycroft, C.E.; Jones, M.R.; Gibson, G.R.; Rastall, R.A. A Comparative in Vitro Evaluation of the Fermentation Properties of Prebiotic Oligosaccharides. J. Appl. Microbiol. 2001, 91, 878–887. [Google Scholar] [CrossRef] [PubMed] [Green Version]
  23. Zhang, Q.; Tan, B.; Mai, K.; Zhang, W.; Ma, H.; Ai, Q.; Wang, X.; Liufu, Z. Dietary Administration of Bacillus (B. licheniformis and B. subtilis) and Isomaltooligosaccharide Influences the Intestinal Microflora, Immunological Parameters and Resistance against Vibrio Alginolyticus in Shrimp, Penaeus japonicus (Decapoda: Penaeidae). Aquac. Res. 2011, 42, 943–952. [Google Scholar] [CrossRef]
  24. Ropartz, D.; Bodet, P.-E.; Przybylski, C.; Gonnet, F.; Daniel, R.; Fer, M.; Helbert, W.; Bertrand, D.; Rogniaux, H. Performance Evaluation on a Wide Set of Matrix-Assisted Laser Desorption Ionization Matrices for the Detection of Oligosaccharides in a High-Throughput Mass Spectrometric Screening of Carbohydrate Depolymerizing Enzymes. Rapid Commun. Mass Spectrom. RCM 2011, 25, 2059–2070. [Google Scholar] [CrossRef] [PubMed]
  25. Li, X.; Ding, X.; Xia, L.; Sun, Y.; Yuan, C.; Yin, J. Proteomic Analysis of Bacillus thuringiensis Strain 4.0718 at Different Growth Phases. Sci. World J. 2012, 2012, e798739. [Google Scholar] [CrossRef] [Green Version]
  26. Doan, T.; Aymerich, S. Regulation of the Central Glycolytic Genes in Bacillus subtilis: Binding of the Repressor CggR to Its Single DNA Target Sequence Is Modulated by Fructose-1,6-Bisphosphate. Mol. Microbiol. 2003, 47, 1709–1721. [Google Scholar] [CrossRef]
  27. Chai, Y.; Beauregard, P.B.; Vlamakis, H.; Losick, R.; Kolter, R. Galactose Metabolism Plays a Crucial Role in Biofilm Formation by Bacillus subtilis. mBio 2012, 3, e00184-12. [Google Scholar] [CrossRef] [Green Version]
  28. Soldo, B.; Scotti, C.; Karamata, D.; Lazarevic, V. The Bacillus subtilis Gne (GneA, GalE) Protein Can Catalyse UDP-Glucose as Well as UDP-N-Acetylglucosamine 4-Epimerisation. Gene 2003, 319, 65–69. [Google Scholar] [CrossRef]
  29. Stöver, A.G.; Driks, A. Secretion, Localization, and Antibacterial Activity of TasA, a Bacillus subtilis Spore-Associated Protein. J. Bacteriol. 1999, 181, 1664–1672. [Google Scholar] [CrossRef] [Green Version]
  30. Cenci, G.; Trotta, F.; Caldini, G. Tolerance to Challenges Miming Gastrointestinal Transit by Spores and Vegetative Cells of Bacillus clausii. J. Appl. Microbiol. 2006, 101, 1208–1215. [Google Scholar] [CrossRef]
  31. Cutting, S.M. Bacillus Probiotics. Food Microbiol. 2011, 28, 214–220. [Google Scholar] [CrossRef] [PubMed]
  32. Saad, N.; Villéger, R.; Ouk, T.-S.; Delattre, C.; Urdaci, M.; Bressollier, P. Probiotics, Prebiotics, and Synbiotics for Gut Health Benefices. In Beneficial Microbes in Fermented and Functional Foods; CRC Press: Boca Raton, FL, USA, 2014; ISBN 978-0-429-18974-6. [Google Scholar]
  33. Lefevre, M.; Racedo, S.M.; Denayrolles, M.; Ripert, G.; Desfougères, T.; Lobach, A.R.; Simon, R.; Pélerin, F.; Jüsten, P.; Urdaci, M.C. Safety Assessment of Bacillus subtilis CU1 for Use as a Probiotic in Humans. Regul. Toxicol. Pharmacol. RTP 2017, 83, 54–65. [Google Scholar] [CrossRef] [PubMed] [Green Version]
  34. Kohmoto, T.; Tsuji, K.; Kaneko, T.; Shiota, M.; Fukui, F.; Takaku, H.; Nakagawa, Y.; Ichikawa, T.; Kobayash, S. Metabolism of (13)C-Isomaltooligosaccharides in Healthy Men. Biosci. Biotechnol. Biochem. 1992, 56, 937–940. [Google Scholar] [CrossRef] [PubMed]
  35. Patel, S.; Goyal, A. Functional Oligosaccharides: Production, Properties and Applications. World J. Microbiol. Biotechnol. 2011, 27, 1119–1128. [Google Scholar] [CrossRef]
  36. Lan, J.; Wang, K.; Chen, G.; Cao, G.; Yang, C. Effects of Inulin and Isomalto-Oligosaccharide on Diphenoxylate-Induced Constipation, Gastrointestinal Motility-Related Hormones, Short-Chain Fatty Acids, and the Intestinal Flora in Rats. Food Funct. 2020, 11, 9216–9225. [Google Scholar] [CrossRef]
  37. Logtenberg, M.J.; Akkerman, R.; Hobé, R.G.; Donners, K.M.H.; Van Leeuwen, S.S.; Hermes, G.D.A.; de Haan, B.J.; Faas, M.M.; Buwalda, P.L.; Zoetendal, E.G.; et al. Structure-Specific Fermentation of Galacto-Oligosaccharides, Isomalto-Oligosaccharides and Isomalto/Malto-Polysaccharides by Infant Fecal Microbiota and Impact on Dendritic Cell Cytokine Responses. Mol. Nutr. Food Res. 2021, 65, e2001077. [Google Scholar] [CrossRef]
  38. Hong, H.A.; Duc, L.H.; Cutting, S.M. The Use of Bacterial Spore Formers as Probiotics. FEMS Microbiol. Rev. 2005, 29, 813–835. [Google Scholar] [CrossRef] [Green Version]
  39. Zhang, H.-L.; Li, W.-S.; Xu, D.-N.; Zheng, W.-W.; Liu, Y.; Chen, J.; Qiu, Z.-B.; Dorfman, R.G.; Zhang, J.; Liu, J. Mucosa-Reparing and Microbiota-Balancing Therapeutic Effect of Bacillus subtilis Alleviates Dextrate Sulfate Sodium-Induced Ulcerative Colitis in Mice. Exp. Ther. Med. 2016, 12, 2554–2562. [Google Scholar] [CrossRef] [Green Version]
  40. Tsukahara, T.; Kimura, Y.; Inoue, R.; Iwata, T. Preliminary Investigation of the Use of Dietary Supplementation with Probiotic Bacillus subtilis Strain QST713 Shows That It Attenuates Antimicrobial-Induced Dysbiosis in Weaned Piglets. Anim. Sci. J. 2020, 91, e13475. [Google Scholar] [CrossRef]
  41. Marzorati, M.; Van den Abbeele, P.; Bubeck, S.S.; Bayne, T.; Krishnan, K.; Young, A.; Mehta, D.; DeSouza, A. Bacillus subtilis HU58 and Bacillus coagulans SC208 Probiotics Reduced the Effects of Antibiotic-Induced Gut Microbiome Dysbiosis in an M-SHIME® Model. Microorganisms 2020, 8, 1028. [Google Scholar] [CrossRef]
  42. Li, J.; Tan, B.; Mai, K. Dietary Probiotic Bacillus OJ and Isomaltooligosaccharides Influence the Intestine Microbial Populations, Immune Responses and Resistance to White Spot Syndrome Virus in Shrimp (Litopenaeus vannamei). Aquaculture 2009, 291, 35–40. [Google Scholar] [CrossRef]
  43. Gu, X.L.; Li, H.; Song, Z.H.; Ding, Y.N.; He, X.; Fan, Z.Y. Effects of Isomaltooligosaccharide and Bacillus Supplementation on Sow Performance, Serum Metabolites, and Serum and Placental Oxidative Status. Anim. Reprod. Sci. 2019, 207, 52–60. [Google Scholar] [CrossRef] [PubMed]
  44. Gu, X.; Chen, J.; Li, H.; Song, Z.; Chang, L.; He, X.; Fan, Z. Isomaltooligosaccharide and Bacillus Regulate the Duration of Farrowing and Weaning-Estrous Interval in Sows during the Perinatal Period by Changing the Gut Microbiota of Sows. Anim. Nutr. 2021, 7, 72–83. [Google Scholar] [CrossRef] [PubMed]
  45. Hu, Y.; Ketabi, A.; Buchko, A.; Gänzle, M.G. Metabolism of Isomalto-Oligosaccharides by Lactobacillus reuteri and Bifidobacteria. Lett. Appl. Microbiol. 2013, 57, 108–114. [Google Scholar] [CrossRef] [PubMed]
  46. Böger, M.; Hekelaar, J.; van Leeuwen, S.S.; Dijkhuizen, L.; Lammerts van Bueren, A. Structural and Functional Characterization of a Family GH53 β-1,4-Galactanase from Bacteroides Thetaiotaomicron That Facilitates Degradation of Prebiotic Galactooligosaccharides. J. Struct. Biol. 2019, 205, 1–10. [Google Scholar] [CrossRef] [PubMed]
  47. Endo, A.; Tanno, H.; Kadowaki, R.; Fujii, T.; Tochio, T. Extracellular Fructooligosaccharide Degradation in Anaerostipes Hadrus for Co-Metabolism with Non-Fructooligosaccharide Utilizers. Biochem. Biophys. Res. Commun. 2022, 613, 81–86. [Google Scholar] [CrossRef]
  48. Garcia, C.A.; Gardner, J.G. Bacterial α-Diglucoside Metabolism: Perspectives and Potential for Biotechnology and Biomedicine. Appl. Microbiol. Biotechnol. 2021, 105, 4033–4052. [Google Scholar] [CrossRef]
  49. Yamamoto, H.; Serizawa, M.; Thompson, J.; Sekiguchi, J. Regulation of the Glv Operon in Bacillus subtilis: YfiA (GlvR) Is a Positive Regulator of the Operon That Is Repressed through CcpA and Cre. J. Bacteriol. 2001, 183, 5110–5121. [Google Scholar] [CrossRef] [Green Version]
  50. Zamboni, N.; Fischer, E.; Laudert, D.; Aymerich, S.; Hohmann, H.-P.; Sauer, U. The Bacillus subtilis YqjI Gene Encodes the NADP+-Dependent 6-P-Gluconate Dehydrogenase in the Pentose Phosphate Pathway. J. Bacteriol. 2004, 186, 4528–4534. [Google Scholar] [CrossRef] [Green Version]
  51. Leser, T.D.; Knarreborg, A.; Worm, J. Germination and Outgrowth of Bacillus subtilis and Bacillus licheniformis Spores in the Gastrointestinal Tract of Pigs. J. Appl. Microbiol. 2008, 104, 1025–1033. [Google Scholar] [CrossRef]
  52. Setlow, P. Germination of Spores of Bacillus Species: What We Know and Do Not Know. J. Bacteriol. 2014, 196, 1297–1305. [Google Scholar] [CrossRef] [PubMed] [Green Version]
  53. Hornstra, L.M.; de Vries, Y.P.; de Vos, W.M.; Abee, T. Influence of Sporulation Medium Composition on Transcription of Ger Operons and the Germination Response of Spores of Bacillus cereus ATCC 14579. Appl. Environ. Microbiol. 2006, 72, 3746–3749. [Google Scholar] [CrossRef] [PubMed] [Green Version]
  54. Sánchez, B.; Champomier-Vergès, M.-C.; Anglade, P.; Baraige, F.; de Los Reyes-Gavilán, C.G.; Margolles, A.; Zagorec, M. Proteomic Analysis of Global Changes in Protein Expression during Bile Salt Exposure of Bifidobacterium longum NCIMB 8809. J. Bacteriol. 2005, 187, 5799–5808. [Google Scholar] [CrossRef] [Green Version]
  55. Sánchez, B.; de los Reyes-Gavilán, C.G.; Margolles, A. The F1F0-ATPase of Bifidobacterium animalis Is Involved in Bile Tolerance. Environ. Microbiol. 2006, 8, 1825–1833. [Google Scholar] [CrossRef] [Green Version]
  56. Sánchez, B.; Champomier-Vergès, M.-C.; Stuer-Lauridsen, B.; Ruas-Madiedo, P.; Anglade, P.; Baraige, F.; de los Reyes-Gavilán, C.G.; Johansen, E.; Zagorec, M.; Margolles, A. Adaptation and Response of Bifidobacterium animalis Subsp. Lactis to Bile: A Proteomic and Physiological Approach. Appl. Environ. Microbiol. 2007, 73, 6757–6767. [Google Scholar] [CrossRef] [Green Version]
  57. Sanchez, B.; Ruiz, L.; de los Reyes-Gavilan, C.G.; Margolles, A. Proteomics of Stress Response in Bifidobacterium. Front. Biosci. J. Virtual Libr. 2008, 13, 6905–6919. [Google Scholar] [CrossRef] [Green Version]
  58. Perrin, S.; Grill, J.P.; Schneider, F. Effects of Fructooligosaccharides and Their Monomeric Components on Bile Salt Resistance in Three Species of Bifidobacteria. J. Appl. Microbiol. 2000, 88, 968–974. [Google Scholar] [CrossRef] [Green Version]
  59. Ruas-Madiedo, P.; Hernández-Barranco, A.; Margolles, A.; de los Reyes-Gavilán, C.G. A Bile Salt-Resistant Derivative of Bifidobacterium animalis Has an Altered Fermentation Pattern When Grown on Glucose and Maltose. Appl. Environ. Microbiol. 2005, 71, 6564–6570. [Google Scholar] [CrossRef] [Green Version]
  60. Hamon, E.; Horvatovich, P.; Izquierdo, E.; Bringel, F.; Marchioni, E.; Aoudé-Werner, D.; Ennahar, S. Comparative Proteomic Analysis of Lactobacillus plantarum for the Identification of Key Proteins in Bile Tolerance. BMC Microbiol. 2011, 11, 63. [Google Scholar] [CrossRef] [Green Version]
Figure 1. Structure of commercial IMOS determined by MS. (A) Mass spectra of ion m/z 1013.3 (DP6) obtained by ESI-MS/MS in positive mode with zoom on spectral sections corresponding to intracyclic fragmentations. (B) Structure of IMOSs composed of glucose oligomers with α(1 → 4) and α(1 → 6) linkages.
Applsci 12 06404 g001
Figure 2. B. subtilis CU1 grown on commercial IMOS as sole carbon source via the secretion of α-glucosidase enzyme. Growth curves for B. subtilis CU1 in minimal medium with glucose (control) or IMOS as sole carbon sources determined by (A) OD measurement at 595 nm and (B) bacterial count on agar plate. (C) IMOS consumption (DP1, DP2 and DP3) during growth of B. subtilis CU1 determined by liquid chromatography. The data presented are from one representative experiment among three. (D) Determination of α-glucosidase and β-glucosidase activities in the culture medium or the cytosol of B. subtilis CU1 after 12 h of culture on glucose or IMOS as sole carbon sources. (E) Production of lactic acid and (F) acetic acid in the culture medium of CU1 determined by HPLC. The data from panels (A,B,DF) are presented as means ± SD and are from one representative experiment performed in triplicate among three. * p < 0.05, ** p < 0.01, *** p < 0.001 or **** p < 0.0001 were used to indicate statistical significance according to Mann–Whitney test.
Applsci 12 06404 g002
Figure 3. Proposed model of IMOS metabolism by B. subtilis CU1. Upregulated and downregulated proteins in IMOS condition when compared to glucose are in green and red circles respectively. Lactic acid and acetic acid are reduced in the extracellular medium. Figure produced with Microsoft PowerPoint Professional Plus 2019.
Applsci 12 06404 g003
Figure 4. IMOS provides an advantageous fitness to B. subtilis CU1 spores in the presence of bile salts. Graphs (A,B) represent the growth curves for B. subtilis CU1 obtained in minimal medium with glucose or IMOS as carbon source in the presence or absence of 0.5% bile salts and inoculated with vegetative bacteria (A) or spores (B), respectively. Growth curves have been obtained by OD595nm measurement. (C) Bacterial numeration in CFU/mL in the culture medium inoculated with spores after 48 h of culture in the presence of bile (D) DP1, DP2 and DP3 determination by LC during the growth of B. subtilis CU1 with 0.5% bile, with IMOS as carbon substrate. The data presented are from one representative experiment among three. Data are presented as means ± SD (Mann–Whitney test; * p < 0.05), excepted for (D).
Applsci 12 06404 g004
Table 1. Evaluation of the growth of Bacillus probiotic strains on commercial prebiotic carbon sources. The growth evaluation was assessed on minimal agar medium containing a single prebiotic substrate. After 36 h of growth, the analysis was performed by simple observation of the colony sizes in comparison to a glucose reference.
Minimal MediumGlucoseInulineFOSGOSXOSAXOSLactuloseSOSIMOS
B. subtilis CU1-++++++++++-++++
B. subtilis 2-4/2-+++++++++-++++
B. licheniformis BL31-++++++--+++
B. amyloliquefaciens 26D-++++++++++++-++++
B. cereus CH--------+-
- no growth; + low growth; ++ high growth.
Table 2. Analysis of IMOSs by MS in reflecting mode.
m/zIntensityStructure
527.176157.68Hexose DP3 [M + Na]+
689.2142223.32Hexose DP4 [M + Na]+
851.261450.49Hexose DP5 [M + Na]+
1013.312968.06Hexose DP6 [M + Na]+
1175.3912780Hexose DP7 [M + Na]+
1337.498990.45Hexose DP8 [M + Na]+
1499.634306.84Hexose DP9 [M + Na]+
1661.8123.6Hexose DP10 [M + Na]+
1823.99760.99Hexose DP11 [M + Na]+
1986.21732.69Hexose DP12 [M + Na]+
2148.55619.39Hexose DP13 [M + Na]+
Table 3. Analysis of IMOSs by MS in linear mode.
m/zIntensityStructurem/zIntensityStructure
2304.9191.8 Hexose DP14 [M + Na]+5716.9 357.89Hexose DP35 [M + Na]+
2467.52417.54Hexose DP15 [M + Na]+5879.2289.48 Hexose DP36 [M + Na]+
2630.15320.01Hexose DP16 [M + Na]+6041.2241.18Hexose DP37 [M + Na]+
2792.66904.94 Hexose DP17 [M + Na]+6203.5171.66Hexose DP38 [M + Na]+
2955.27446.49 Hexose DP18 [M + Na]+6366149.94Hexose DP39 [M + Na]+
3117.86954.73 Hexose DP19 [M + Na]+652895.96Hexose DP40 [M + Na]+
3280.36237.11Hexose DP20 [M + Na]+6690.777.76Hexose DP41 [M + Na]+
3442.95472.17 Hexose DP21 [M + Na]+6852.760.27 Hexose DP42 [M + Na]+
3605.44478.89Hexose DP22 [M + Na]+7015.142.01Hexose DP43 [M + Na]+
37683701.86Hexose DP23 [M + Na]+7177.748.18Hexose DP44 [M + Na]+
3930.33221.14Hexose DP24 [M + Na]+734028.32 Hexose DP45 [M + Na]+
4092.82474.79Hexose DP25 [M + Na]+7501.3 23.11 Hexose DP46 [M + Na]+
4255.52011.96Hexose DP26 [M + Na]+7663.120.08 Hexose DP47 [M + Na]+
4417.91667.19Hexose DP27 [M + Na]+7826.816.6 Hexose DP48 [M + Na]+
4580.11462.97Hexose DP28 [M + Na]+7988.416.03 Hexose DP49 [M + Na]+
4742.81206.39Hexose DP29 [M + Na]+8150.67.11 Hexose DP50 [M + Na]+
4905.1973.39Hexose DP30 [M + Na]+831214.43 Hexose DP51 [M + Na]+
5067.5748.39 Hexose DP31 [M + Na]+8474.89.34 Hexose DP52 [M + Na]+
5229.9573.19 Hexose DP32 [M + Na]+8799.64.14 Hexose DP54 [M + Na]+
5392.1487.02 Hexose DP33 [M + Na]+8961.16.26 Hexose DP55 [M + Na]+
5554.6388.19 Hexose DP34 [M + Na]+91215.09 Hexose DP56 [M + Na]+
Table 4. Identified proteins differentially expressed in B. subtilis CU1 after growth on IMOS. Protein differentially expressed have been selected on the criteria of a fold change ≥ 1.3 and p ≤ 0.05 (Student’s t-test), then identified by Nano-LC MALDI-TOF/TOF (n = 3 per condition).
Identified ProteinsAccess NumberNameSpotsFold Changep-Value
Amino acid & protein synthesis
Serine-glycine hydroxymethyltransferaseP39148glyA949−4.0<0.001
Elongation factor GP80868fusA412−3.3<0.001
60 kDa chaperoninP28598groEL692−2.10.016
Elongation factor TuP33166tufA1022−3.3<0.001
Aspartyl/glutamyl-tRNA(Asn/Gln) amidotransferase subunit BO30509gatB6001.70.001
Chaperone protein DnaKP17820dnaK483−1.70.005
Methionine--tRNA ligaseP37465metS10762.10.023
Phenylalanine--tRNA ligase beta subunitP17922pheT3261.90.035
Energy metabolism
Cytidylate kinaseP38493cmk8672.20.002
Acetyl-coenzyme A synthetaseP39062acsA10202.20.002
ATP synthase subunit betaP37809atpD878−2.10.003
Carbohydrate metabolism & transport
Methylmalonate semialdehyde dehydrogenaseP42412iolA5862.1<0.001
Alanine dehydrogenaseQ08352ald845−1.50.004
Isocitrate dehydrogenaseP39126icd894−2.9<0.001
Maltose-6-phosphate glucosidaseP54716malA6092.2<0.001
Probable 6-phospho-beta-glucosidaseP46320licH104720.002
UDP-glucose 4-epimeraseP55180galE7411.50.002
Succinate dehydrogenase flavoprotein subunitP08065sdhA5181.50.002
Glyceraldehyde-3-phosphate dehydrogenaseP09124gapA1042−20.003
PhosphoglucomutaseP18159pgcA4581.40.02
Probable fructose-bisphosphate aldolaseP13243fbaA834−2.4<0.001
Phosphoglycerate kinaseP40924pgk706−1.60.006
Malate dehydrogenaseP49814mdh760−1.80.005
L-lactate dehydrogenaseP13714ldh729−1.50.019
Phosphoenolpyruvate-protein phosphotransferaseP08838ptsI1073−1.60.022
Cell-wall synthesis
UDP-N-acetylmuramoyl-L-alanyl-D-glutamate--2,6-diaminopimelate ligaseQ03523murE10122.10.003
Spore coat-associated protein NP54507tasA1062−1.40.015
Antibiotic synthesis
Polyketide biosynthesis 3-hydroxy-3-methylglutaryl-ACP synthaseP40830pksG6011.60.007
Other functions
Pyridoxal biosynthesis lyaseP37527pdxS923−1.90.002
DNA-directed RNA polymerase subunit alphaP20429rpoA893−1.40.012
Publisher’s Note: MDPI stays neutral with regard to jurisdictional claims in published maps and institutional affiliations.

