Article

A Study of Eye-Tracking Gaze Point Classification and Application Based on Conditional Random Field

School of Mechatronical Engineering, Beijing Institute of Technology, Beijing 100081, China
*
Author to whom correspondence should be addressed.
Appl. Sci. 2022, 12(13), 6462; https://doi.org/10.3390/app12136462
Submission received: 8 May 2022 / Revised: 22 June 2022 / Accepted: 24 June 2022 / Published: 25 June 2022

Abstract

:
The head-mounted eye-tracking technology is often used to manipulate the motion of servo platform in remote tasks, so as to achieve visual aiming of servo platform, which is a highly integrated human-computer interaction effect. However, it is difficult to achieve accurate manipulation for the uncertain meanings of gaze points in eye-tracking. To solve this problem, a method of classifying gaze points based on a conditional random field is proposed. It first describes the features of gaze points and gaze images, according to the eye visual characteristic. An LSTM model is then introduced to merge these two features. Afterwards, the merge features are learned by CRF model to obtain the classified gaze points. Finally, the meaning of gaze point is classified for target, in order to accurately manipulate the servo platform. The experimental results show that the proposed method can classify more accurate target gaze points for 100 images, the average evaluation values Precision = 86.81%, Recall = 86.79%, We = 86.79%, these are better than relevant methods. In addition, the isolated gaze points can be eliminated, and the meanings of gaze points can be classified to achieve the accuracy of servo platform visual aiming.

1. Introduction

Eye-tracking techniques have been gradually applied in different fields, such as remote task of the servo platform motion, which is helpful to achieve accurate manipulation and highly human-machine interaction [1,2]. Some methods have been implemented to accurately estimate the line-of-sight and output gaze points [3,4,5]. When people wear on Head-mounted eye-tracking device, gazes the scene displayed on the Head-mounted display to complete remote tasks. This process contains persons’ interaction object and gaze region, and the output gaze points contain different meanings [6,7]. For visual characteristics, people’s gaze attention is uncertain, so that the gaze points have uncertain meanings [8,9,10,11], they use gaze points within a set range and time threshold or with other interaction modes. It is challenging to use eye-tracking gaze points to accurately manipulate the servo platform. Therefore, this paper research the classification of gaze points method from the visual characteristics factor [12,13,14], in order to understand the meaning of gaze point to manipulate the servo platform.
Vella [10] uses a Clustering method to describe gaze points feature and to recognize user. Kim [11] adopts Support vector machines (SVM) method to recognize the gaze direction. Boisvert [12] proposes a framework to apply Random Forest Algorithm (RF) for highlighting features that distinguish behavioral differences observed across visual task and understanding gaze behavior. Fuchs [13] uses Gaussian Hidden Markov Models (GHMM) to analysis gaze and estimate the current proximal intention. Coutrot [14] relies on Hidden Markov models (HMM) to classify scan-path fixations and infer an observer-related characteristic. Qiu [15] proposes Conditional Random Field model (CRF) to classify eye fixation data and Lafferty [16] uses this model CRF to classify sequence data. The same Benfold [17] uses CRF method according head motion, walking direction, and appearance to estimate coarse gaze direction. Above all, these research have used different classification and recognition methods to the eye gaze information, but these need more related information to input, and for our application is not clear.
Huang [18] fuses the visual saliency and task-dependent in eye-tracking gaze to learn eye attention transfer and predict gaze information. Related studies [19,20,21,22,23] on gaze point prediction take into account the integration of visual saliency and human gaze attention transfer, that is, the underlying visual characteristics of eye gaze visual characteristics and human brain consciousness attention. The similar research on Named entity recognition studies [24,25,26,27] need to encode input features and output recognition sequences, these are applicated in weapon, product quality and language areas.
According to above work, this paper research only has gaze point and gaze image as the input, will need encoding the inputting feature, then understanding the gaze point meaning to classify and recognize using based on CRF model. The clustering method [10] only needs to consider the distance relationship between data by looking for distance iteration of data. The SVM method [11] classifies the data types by looking for a hyperplane of data. Therefore, the proposed method is also compared with these two methods. The RF method [12] build many estimators including all feature to classify. The gaze points observed by the correlated HMM model method [14] are independent of each other, and the labeling at the current moment is only related to the labeling at the previous moment. However, the gaze point recognition often requires more features, and the labeling of the current moment should be related to the previous moment and the next moment. The GHMM method [13] to consider the distribution of features. The CRF model method [16] can customize the feature function, which express not only the dependence between observations, but also the complex dependence between the current observation and multiple states before and after. This can efficiently overcome the problems faced by HMM model. However, its disadvantage is that the sequence features require to be manually extracted. So, this paper based on CRF, with little input considered visual characteristics, and do some ways to solve our problem. That is different from other research.
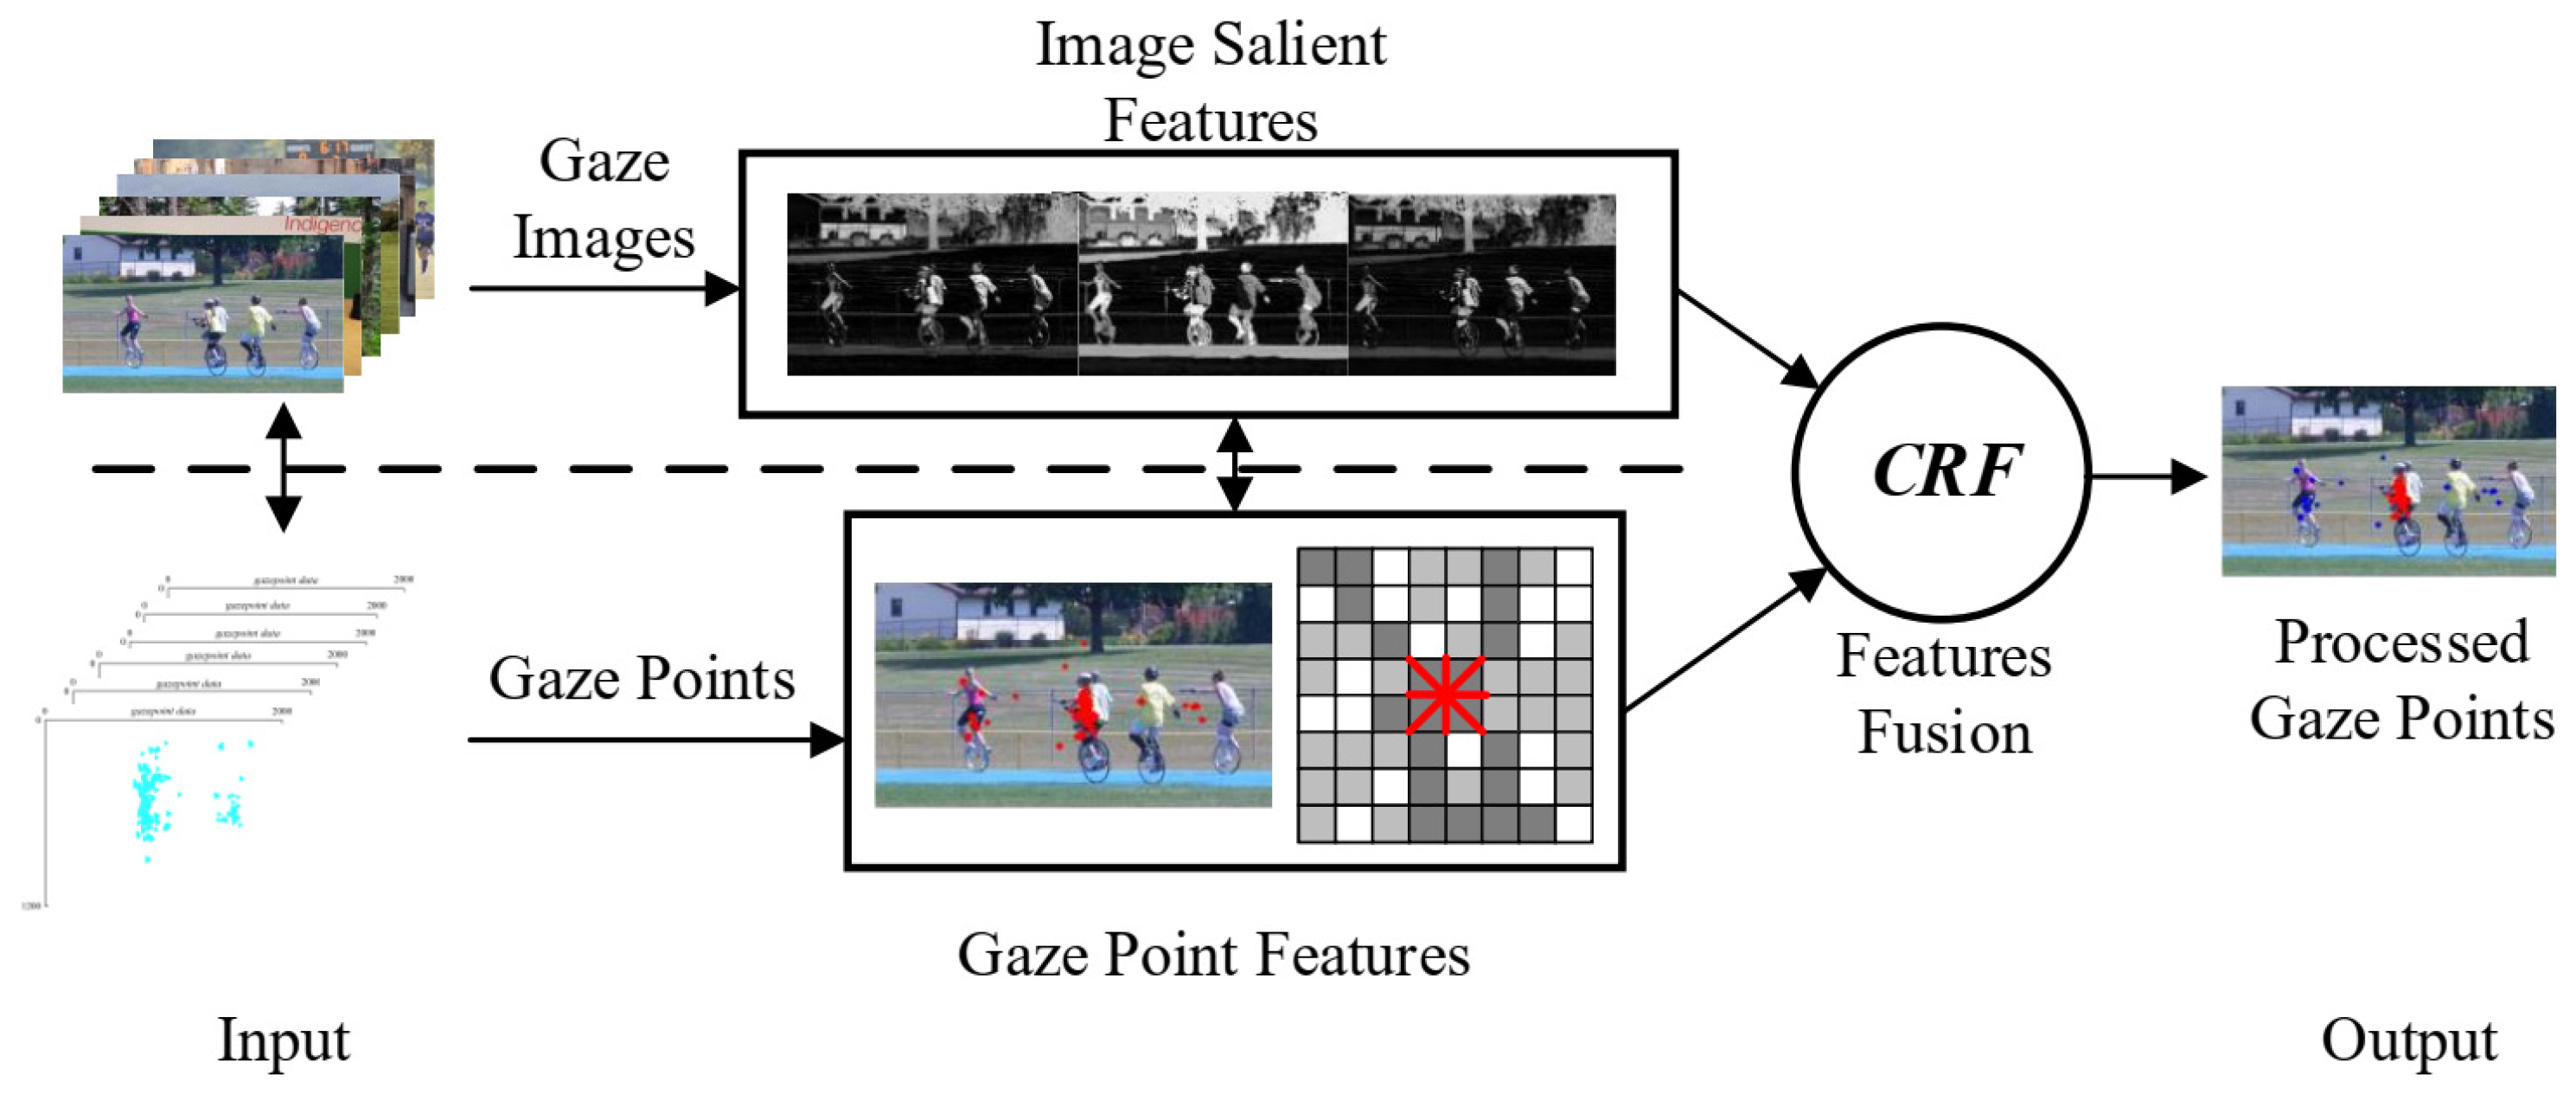
This paper proposes a gaze points classification method based on CRF and visual characteristics to extract the meaning of gaze points for a more accurate manipulation of servo platform, while the servo platform visually aim the target. Considering the saliency of images and task-related attention in human eye gaze tasks, the visual features of gaze images and gaze points are described, the LSTM model [18] is introduced to merge the two described feature relationships, and the CRF model is used to mark and classify the eye-tracking gaze points. The proposed method aims at classifying the gaze points from the perspective of visual characteristics and improving the accuracy of eye-tracking interaction. In the application of eye-tracking, the potential of eye-tracking interaction is fully utilized, and the isolated eye gaze point is removed.
The main contributions of this paper are summarized as follows.
(1)
A novel hybrid classification model is proposed, introducing visual characteristics about gaze scene image and gaze point;
(2)
The method achieves automatic and efficient analytical processing of gaze points in eye-tracking interaction.
This remainder of this paper is organized as follows. Section 2, describes the gaze point classification method of conditional random field based on visual characteristics. Section 3, presents the experimental process and data. Section 4, shows the experimental results and the comparison with other related methods. Finally, the conclusions and future work are drawn in Section 5.

2. Proposed Method

2.1. The Proposed Method Framework

Figure 1 shows the process of gaze point classification in the Conditional Random Filed (CRF) model based on the visual characteristics. More precisely, the gaze images and gaze points are input, various features are extracted and merged, through the establishment of the CRF learning model, and finally acquire the gaze points after classification are obtained. This section describes the specific implementation of the proposed method. Section 2.2 briefly introduces the CRF model. Section 2.3 presents the feature of the gaze images. Section 2.4 shows the feature of the gaze points. Section 2.5 describes the merge of the two features. Section 2.6 presents the specific implementation of the CRF gaze points classification based on visual characteristics.

2.2. Conditional Random Field Model

The Conditional Random Field (CRF) [15,16] is a discriminative undirected graph model which models the conditional probability of multiple variables after a given observation, in order to solve the problem of sequence labeling. The CRF model often assumes that the observation sequence is x = { x 1 , x 2 , , x n } , and the corresponding class label sequence is y = { y 1 , y 2 , , y n } . The CRF can then construct a conditional probability model P ( y | x ) , expressed as Equation (1),
P ( y | x ) = 1 Z exp ( P V ( y i 1 , y i , x , i ) + P U ( y i , x , i ) ) ,
where P V ( y i 1 , y i , x , i ) is the Transition Feature Function of the neighboring class marker positions on the whole observation sequence, P U ( y i , x , i ) is the State Feature Function of the marker positions i on the observation sequence, and Z is the normalization constant, also known as the normalization factor.
It can be seen from Equation (1) that the representation of the model mainly consists of feature function expressions. Therefore, the relevant feature functions of the gaze point should be established.

2.3. Expression of Image Saliency Feature

The human eye gaze at image contains rich feature information such as color, texture and structure. Different description methods of image feature have different advantages and disadvantages. In this paper, multiple feature factors are efficiently fused to describe the image target in order to enhance the robustness of visual feature descriptions of different images [28].
With the dominant role of objective human task, the saliency of the target task in the images is prior to other elements. However, the human attention is also affected by the image local contrast, target edge region and center bias prior [29,30,31], which affects the final output gaze point. An example of images saliency for different methodological visual characteristics are shown in Figure 2. The first column in the image of local contrast factor efficiently distinguishes the target region. The second and fourth columns of the images distinguish the target region relative to the background prior factor, and the fifth column of the images distinguishes the target region significantly relative to the center bias factor. However, in the third column of the images, the three methods used to distinguish the target “person” are not outstanding. However, the bright part of the image clearly distinguished, and the local contrast is relatively distinct from the target on the right side of the image.
Different salient features are used to represent the salient regions of the image [15,32,33]. This paper uses three color spaces (RGB, Lab and HSV), and extracts three features as image saliency features. Table 1 shows the target region pixel feature representation.
The characteristics of target area p in gaze image I are expressed as:
m p ( i , j ) = { m p R , m p G , m p B , m p L , m p a , m p b , m p H , m p s , m p V } ,
where m p ( i , j ) c , ( i , j ) is the pixel position of the target area, and c is the feature dimension.
Figure 3 shows the specific representation of the pixel features m p of the target area.
Initially gazing at the image, the image saliency region feature is G 0 s = max m p ( i , j ) , the 28 × 28 image block feature centered at ( i , j ) in the target region can be extracted to express, where pixel ( i , j ) in target p area is the most attractive target region, then the saliency feature of the next moment image saliency region will be expressed as a 28 × 28 image block feature centered at before gaze point in the target region.

2.4. Expression of Gaze Point Feature

During the gazing, the gaze point in each gaze image is D = { d 1 , d 2 , , d t } , where d t is the position of the gaze point falling in the image task target at moment t . A certain relationship exists between the gaze points, and it is possible to predict the image area where the next attention appears by the previous gaze point. Considering the different gaze differences of different people, 14 × 14 image block at this gaze point location is extracted as the visual feature, and the color features of RGB, Lab and HSV color spaces of the image block are extracted as the visual feature representation of this gaze point. The image block color space features corresponding to each group of the sequence of the attention point can be expressed as G a = { G 1 a , G 2 a , , G t a } , where G t a denotes the image block color features corresponding to the attention point at moment t . The color features are calculated as described in Section 2.3.

2.5. The Fusion of Features

The relationship between the target of gaze image and gaze point features is established, and the relationship between gaze points is described.
The graph model relationship based on CRF is shown in Figure 4, where the yellow and red points, respectively, represent the classification marker layer and the gaze point after classification, and the blue points represent the gaze point sequence described by different features. In the classification marker layer, each node is connected to its neighbors. The solid yellow line indicates that the nodes are connected to their neighboring nodes, and the red nodes are jointly affected by the class markers of the surrounding yellow nodes. In the observation layer, each blue node indicates the corresponding features, the image saliency features and gaze point features, and they are connected to the nodes in the corresponding classification marker layer, which indicates that these features affect the classification marker results.
Each node interacts with its neighbors in the classification and observation layer, and these nodes together determine the final classification label. A fusion module about image saliency and gaze point features is constructed by applying different weights to different feature channels in order to express the attention region, which can represent the output position of the gaze point. The LSTM model [18] is introduced to predict the channel weight vector in order to fuse the image visual features with the gaze point features for training the prediction of the attention region at the next gaze region. The module takes G t 1 s and G t 1 a as input and outputs the predicted channel weight vector ω t . G t 1 s = m p is the t 1 moment salience feature of the target in the image, which is also related to G t 1 a .
The fusion module framework is presented in Figure 5.
In the Figure 5, the channel weight extractor C takes the previous moment saliency features G t 1 s and the gaze point features G t 1 a as input. From each channel, the features of the gaze point location G t 1 a are projected to the region G t 1 s in order to obtain the channel weights ω t 1 :
ω t 1 = C ( G t 1 s , G t 1 a ) ,
where C is the nonlinear function denoting the cropping and averaging operation, and ω t 1 denotes the feature representation of the region of attention around the gaze point at moment t 1 .
The transfer probability P score of the gaze state is f t 1 P = P ( G t 1 a ) [ 0 , 1 ] , which indicates how likely the first gaze point occurs in the target. A channel weight vector is extracted for each gaze point to learn the transitions between gaze points, and learn the relationship between gaze points. That is, a series of channel weight vectors extracted from images with gaze points are used to train the LSTM and output the probability score of gaze transfer. In the testing process, given a channel weight vector, the training outputs a channel weight vector which represents the region of gaze point at the next gaze. The predicted gaze probability channel weight vector is expressed as:
ω t = f t 1 P · ω t 1 + ( 1 f t 1 P ) · L ( ω t 1 ) ,
where L ( ω t 1 ) is the channel weight vector output by training.
The mapping of gaze points predicted by gaze transfer probability is then computed as:
G t a = c = 1 n ω t [ c ] · G t s [ c ] ,
where c is the channels dimension, denotes the c-th dimension/channels of ω t / G t s .

2.6. CRF Model Implementation Details

In the gaze image I , the target area is first manually marked:
R T = { r ( r x , r y ) | r x [ x , x ] , r y [ y , y ] } ,
where r ( r x , r y ) denotes the area of the target in image I , r x [ x , x ] , r y [ y , y ] represents the range of values of the area, the location of the gaze point within this range. We classify and label the visual characteristics of the labeled gaze point as Y .
The training dataset contains gaze points D , gaze image I and gaze points of classification markers Y . Using the previously designed model, the corresponding relationship between these elements in the training samples is established, the classification of test gaze points is estimated, and the useful meaning gaze points are obtained. The CRF model is developed for input feature decoding, according to Equation (1) of Section 2.2, and the probability function is given by:
P ( Y | G ) = 1 Z exp { E ( Y | G ( D , I ) } ,
where G is the feature of the gaze point which is a fused visual feature to the gaze point representation. Y is the feature of the gaze point class marker, and E is expressed as:
E ( Y | G ( D , I ) ) = P U ( Y i , G ( D , I ) ) + P V ( Y i 1 , Y i , G ( D , I ) ) ,
where P U and P V are, respectively, unary feature function and binary neighborhood feature function of the gaze point, P U denotes the function between feature G and class label Y at a moment of gaze, which is used to describe the influence of the feature on the class label.
Using the previous analysis, P U is expressed as:
P U ( Y i , G ( D , I ) ) = P U ( Y i , G t ) ,
where Y i is the i -th feature of marked gaze points.
The neighborhood feature function between each gaze point Y i 1 and Y i is used to describe the relationship between neighboring gaze points:
P V ( Y i 1 , Y i , G ( D , I ) ) = P V ( Y i 1 , Y i , G t ) ,
The specific G t describes the encoding and relationship building for various inputs in the previous section, using CRF as a decoder for the interpretation of the above relationship:
y * = arg max s c o r e Y Y x ( Y , G ( D , I ) ) ,
The maximum fractional output is calculated using the Viterbi algorithm [24], where y * denotes the predicted classification gaze points, Y presents the marked gaze points and Y x denotes the possible gaze points.
In summary, the proposed gaze point classification method of conditional random field based on visual characteristics is summarized as follows (Algorithm 1):
Algorithm 1: A method for gaze point classification based on conditional random field and visual characteristics
Input: Training data and Testing data, containing gaze points D, gaze images I and marker gaze points Y.
Output: The optimal classification gaze points y * of Testing gaze points
1. Extracting the features of gaze images G t s and the features of gaze points G t a
2. The weight predictor based on LSTM to obtain the weight vector ω t of each feature channel of the gaze point (Equation (4)), fusing the features of gaze point and gaze image
3. Inputting all feature information into CRF to decode and acquire the corresponding training parameters
4. Extracting feature information for the gaze point and gaze image in the test data (Equations (9) and (10))
5. Calculating the function E (Equation (8)) using the step 3, to find the optimal classification gaze points y * of the test gaze points (Equation (11))
6. return Classification result of gaze points
The parameters of the proposed method are shown in Table 2:

3. Experiment

3.1. Experimental Device

A head-mounted eye-tracking device (Figure 6), is used in [34,35,36]. This device has an accuracy of 0.38°. Gaze points are collected in the experiment using this device. The scene camera and servo platform at the remote end in Figure 6, are used to realize the aiming equipment of the simulated servo platform. The center “+” of the scene camera follows the coordinate of the gaze point “+” to perform visual aiming.
The experimenters wear on the head-mounted eye-tracking device designed in this study. The eye camera collects the human eye image, and the head-mounted display shows the scene image information transmitted by the remote servo platform camera. The experimenter watches the scene image on the display, carries out the target gaze, and sends the gaze points to the servo platform to convert it into the servo movement values, so as to perform the control of the servo platform with eye-tracking gaze point. Figure 7 shows the visual aiming relationship between the gaze point and servo platform scene camera center “+”. When the center blue “+” of the scene camera and the green “+” of the gaze point are stably landed on the central stability region of the target, the visual aiming of the servo platform is performed. In the experimental verification of this study, the head-mounted eye-tracking device in Figure 6 is used to collect gaze point data, and the head-mounted display shows the scene image of gaze.

3.2. Experimental Data

The existing public saliency image datasets CSSD, DUTS, ECSSD, HKU-IS, PASCAL-S and SOD [37], contain different complex scenes and targets. In this study, the existing saliency datasets are used and 100 images that contain “person” are selected as shown in Figure 8, where the “person” in the images is the gaze target. In addition, other 6 scene images in our real scene are selected for gazing target “person”. In order to ensure the uniformity of the gaze result, each image is set as 1920 × 1080 pixels. The head-mounted eye-tracking device (Figure 6) collects human eye images and calculates the gaze point data. Each image is gazed at 5 s. 200 gaze points and 5 groups of gazes are completed by 5 experimenters, leading to a total of 100,000 gaze points data. The collected data are divided into 3 groups for training and 2 groups for testing, and the gaze point sequence classification experiments are carried out. Figure 9 presents an example of the distribution of gaze points obtained by gazing at different images collected from the same group of gaze point sequences representing the same graph shape color size. The study in this experiment uses python language based on pytorch library for training, prediction, and completing the comparison tests, with the learning rate of 0.0001.

3.3. Evaluation Criteria

The classification results are evaluated and analyzed from both objective and subjective perspectives. For the analysis of subjective results, the distribution of Gaze points (Ra, Gaze point ratio) and the degree of concentration (Co, Concentration) are compared to analyze the feasibility of the proposed method for classifying gaze points. For the analysis of objective results, the results of the proposed method are compared with the existing methods of the same category, specifically from the quantitative indexes of precision-recall (Precision-Recall) and weighted values (We, Weighted values).
(1)
Ra
The Gaze point ratio (Ra) measures the percentage of classification gaze point, which reflects the degree of attention distribution of the gazed target. The larger the Ra, the more attention is distributed on the target. Ra is computed as,
R a = D g a z e p o int   number Y g a z e p o int   number ,
where D g a z e p o int   number is the number of classified gaze points on the target and Y g a z e p o int   number is the total number of gaze points in the images.
(2)
Co
The concentration (Co) reflects the distribution density of gaze points classified. The larger the Co, the smaller the concentration of gaze attention and vice versa:
C o = 1 D 1 i = 0 i = D | D i D i 1 | ,
where | D i D i 1 | is the distance between two neighboring gaze points of the classified gaze points.
(3)
Precision-Recall
The Precision-Recall (PR) is an evaluation based on the overlap between manually labeled and classified gaze points. The higher the accuracy and recall, the better the algorithm’s filtering and classification results:
p r e c i s i o n = D S D T D S r e c a l l = D S D T D T ,
where D S is the classified gaze points and D T is the manually marked gaze points.
(4)
We
The Weighted values (We) reflect the comprehensive performance of the algorithm and are used to count the accuracy and recall rate between the gaze points of different targets and their valid points in the same gaze image, which comprehensively reflects the validity and reliability of the algorithm. They are defined as:
W e = ( 1 + β 2 ) · p r e c i s i o n · r e c a l l β 2 · p r e c i s i o n + r e c a l l ,
In this paper, β = 0.3 , which focuses more on the precision values.

4. Experimental Results and Analysis

4.1. Classification Results of Gaze Points

Figure 10 shows the gaze point classification process. The experimental results are analyzed from two aspects: subjective result analysis where the result of gaze point classification is analyzed from gaze point visualization, and objective analysis of the results, where the proposed method is compared with the relevant data classification method.
Compared with related classification method, the clustering method [10], the SVM method [11], the RF method [12], the GHMM method [13], the HMM method [14] and the CRF method [16] to further analyze proposed method results.

4.2. Subjective Result Analysis

Figure 11 presents the result of gaze points classification. The first row shows a visualization of the original gaze points. The second row shows the visualization result of gaze point classification by the proposed method.
Statistical calculation and analysis are performed on the method of visual gaze points (Figure 11). The results of Ra and Co of gaze concentration, as well as the subjective ratio of the sample gaze point classification results are shown in Figure 12. It can be seen that the distribution of gaze points in different gaze images is different, and the concentration degree of gaze is also different.
It can be seen from Figure 11 that there are many targets in the No. 1, No. 2, No. 3 gaze image, while the main target is clear, and the attention is relatively concentrated in the fixation process. In an example of image background watching a single task the main target is only one. When watching a gaze image in the process of test, there are 51 images of this type in the 100 images. Therefore, we analysis the concentrated attention is shown in Table 3, the result of scene image gazing with large target significantly, and average Ra and Co values after classification are analyzed by various methods, the gaze images and gaze points data are from our collect data. The proposed method Co = 16.44 is the lowest, Ra = 69.67% is higher than other five methods. In addition, the gaze points classification results reflect the well gaze attention.
In Figure 11, No. 4, No. 5, No. 6 gaze images in the target are more than in other images. In general, the visual characteristics of prominent performance are observed. The attention during the gaze is more scattered, and gaze exists for each target. The No. 4 image background single gaze task has a main target for the third person. The No. 5 image in the background is complex, but the relatively visual distribution of clear gaze task has main target for the second person. The No. 6 image in the background complex target is not prominent, and the main target of the gaze task is the first person. There are 49 images of such type in 100 images, and a statistical analysis of the gaze attentional concentration is shown in Table 4 with related methods, the gaze images and gaze points data are from our collect data. The proposed method Ra = 49.67% is the highest, Co = 21.39 is lower than other five methods. In addition, the gaze points classification results reflect the well gaze attention.
In general, the subjective result show that gazing images with different visual characteristics can have different effects on human attention and gaze results. The proposed method considers the human visual characteristics during gaze, which is more reasonable, and the classification of gaze points for targets is more relative with the physiological characteristics of people. Simultaneously, the results also showed that in such analysis of gaze point, the relative gaze point of concentration is high, and is relatively better for the gaze point interaction accuracy and stability.

4.3. Objective Result Analysis

Table 5 shows the comparison of gaze point classification results by different related algorithms in the example images of Figure 11. The proposed method outperforms the relevant algorithms in terms of precision, recall, and comprehensive performance.
It can be seen from Table 5 that the overall performance of the proposed method is well and stable. The results of the image No. 1 in Figure 11 of the gaze points are classified using the clustering method in [10]. Although the various evaluation values are higher, because the fact that classification of the data is iteratively calculated in terms of the distance situation between the data, this method is simply considered from the distribution distance, and the results after visualization are clear (Figure 13), containing many gaze points that do not belong to the target range. The result of the image No. 3 in Figure 11 shows that too many gaze points of the target are classified (Figure 14), which instead makes the various evaluation values low. Similarly, the classification SVM method in [11] also has a relatively good classification result for gaze points. Although the data characteristics are considered, the factor relationship between human visual characteristics is not considered. The proposed method is based on the ideological basis of research [14,16,24] for integrated research, which not only considers the feature establishment of gaze points, but also the relationship between features. It also integrates the influence of human visual characteristics into learning, and the overall result is higher than the objective evaluation value of the five methods.
Similarly, the results of the test data are statistically analyzed and the gaze points classification results of 100 gaze images are evaluated. Figure 15 presents the average comparison of test experimental results.
It can be seen from Figure 15 that the final evaluation results of the proposed method, Precision = 86.81%, Recall = 86.79%, We = 86.79%, they are still better than those of relevant methods. In general, the proposed method has slightly improved the comparison indexes compared with similar data classification methods, and the comparison of comprehensive performance is also slightly advantageous. However, the improved performance is not very prominent, and the percentage of improvement is not large. According to the presented analysis, on the one hand, the method still lacks the comprehensiveness of feature description in the description of gaze points and fails to better describe the feature relations between gaze points, and therefore the final classification result is not significantly superior to that of relevant methods. However, in the process of analysis from the starting of feature establishment, the method tries to establish gaze point features based on visual characteristic from different areas, and the same learning and training classification results are also better. On the other hand, this study tackles the case where the data distribution of the original gaze points is relatively concentrated, and the proportion of unintentional saccade is small. No matter what kind of gaze point classification is used, the distribution of the gaze points is more concentrated than that of the gaze consciousness, which is easy to classify.

4.4. Real Scene Image Gaze Points Classification and Application

Through the previously mention research on the classification of gaze points, the eye-tracking technology is used to control the servo platform and perform the visual aiming of the servo platform. Specifically, the experimenters wear on the eye-tracking device, and gaze at the targets on the display (the image transmitted by the scene camera on the servo platform) are verified. In addition, the original gaze point and the gaze point after classification are compared. Part 1 shows the gaze at real images experiment. Part 2 further shows the real-time servo platform visual aiming.
Part 1: experimenters gaze at the “person” (as for target) in the school and select six scenes to illustrate. Figure 16 presents the comparison of gaze points during the real images gazing.
In Figure 16, (1) the target of gaze is not specified, and the gaze points are widely distributed; (2) and (3) the gaze target is the person on the right; (4) the gaze target is designated as the second person; (5) the gaze target is the person on the right side of the step; (6) the gaze target is the person on the steps. In each image, the first row presents the gaze image, the second row presents the original gaze points, and the third row presents the classified gaze points. It can be clearly seen that the proposed method classifies the gaze points associated with the target “person”.
Table 6 presents the comparison of real images gaze test evaluation results. The proposed method can classify real scene images gaze points, the Co is the lowest, the Ra is better than other methods result, and the Precision, Recall and We all is better than others result. These further show our method have a well classification result based on visual characteristics, and in gazing process gaze target long time that with different attention distribution. So, when we manipulate servo platform accuracy aiming visual, need understanding the meaning of gaze point to use.
Part 2: experimenter gaze the center of target, as shown in Figure 17. Figure 17a is gaze target. During the gazing process, interference to the target Figure 17b and the target Figure 17c will appear from different positions to the target. The position of the “+” in the center of the servo platform scene camera during the gaze test is recorded. When the blue “+” and green “+” overlap in the target center of the stable area, the servo platform visual aiming is achieved.
Figure 18 shows the state of gaze point and servo platform scene camera following and visual aiming during gazing. Figure 18a is the gaze target, Figure 18b is the appearance of the first interference target, Figure 18c is the appearance of the second interference target.
Figure 19 shows the distribution of gaze points in the experimental visual aiming process. Figure 19a is the distribution of gaze points of the original output, and Figure 19b is the distribution of gaze points after classification.
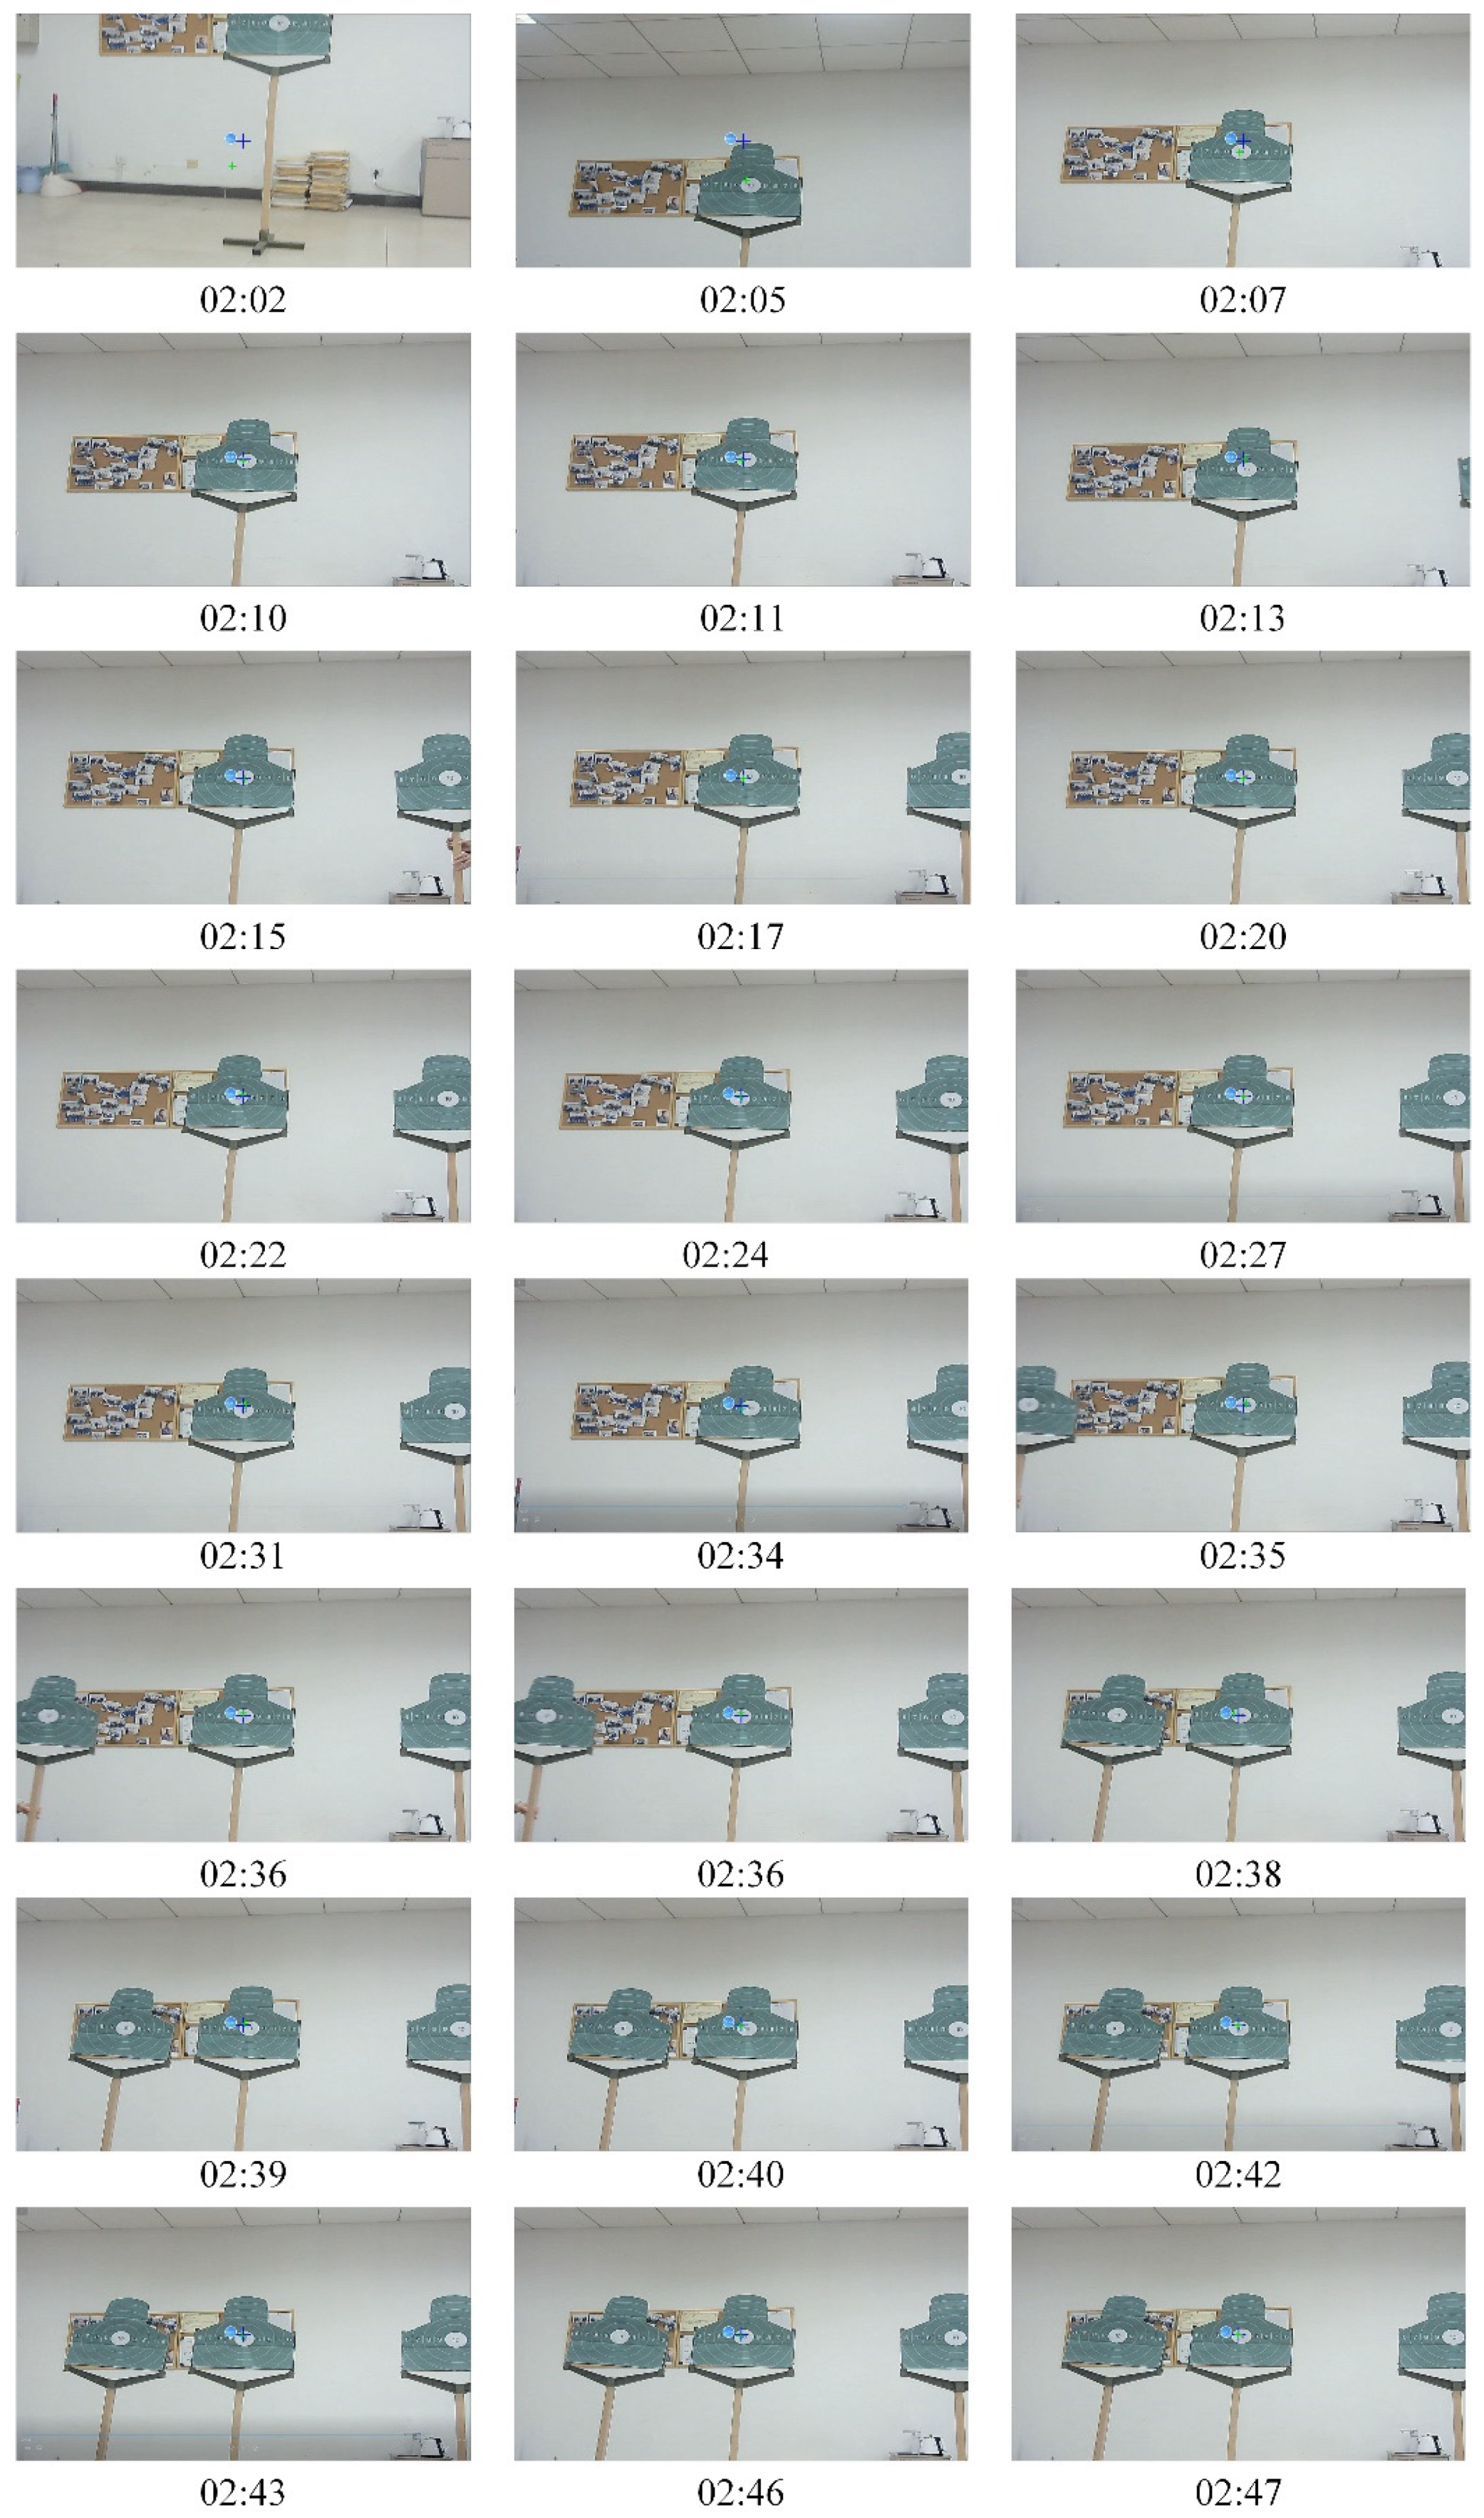
Figure 20 present the gaze process 24 different time visual aiming state.
The experimental results show that the proposed method can efficiently classify the gaze points of the target and make the servo platform camera more accurately follow and aim achieving the servo platform visual aiming.
In summary, the proposed gaze points classification method based on visual characteristics is experimentally tested by gazing at different 100 images, 6 real scene images and target. It can be seen that the distribution of gaze points in different gaze images reflects the different attention and gaze concentration of human eyes. For the gaze at a single background and a prominent target, the distribution of gaze points is highly concentrated. For the image having a complex background and no prominent target, the distribution of gaze points is scattered and widely distributed. The subjective and objective results obtained by the proposed method demonstrate that it achieves a high degree of gaze attention. In 100 gaze images average Precision = 86.81%, Recall = 86.79%, We = 86.79%, In 6 real scene the best Ra = 91.34%, Co = 16.98, Precision = 98.15%, Recall = 98.17%, We = 98.16%. These are also better and stable than those obtained by other methods. However, the evaluation values are not particularly improved. This is the presented study of visual characteristics and human physiological characteristics has not taken into consideration the different influencing factors, and there is no applicability for the establishment of various relationships. These still need to be further explored in future studies. Simultaneously, the experiment results of this study show the applicability of eye-tracking of gaze points classification, in order to achieve servo platform visual aiming.

5. Conclusions

This paper studied the gaze points classification based on visual characteristics, aiming at the head-mounted eye-tracking device to gaze control servo platform, and achieve servo platform visual aiming. The gaze points can be automatically analyzed and classified, so as to achieve accurate visual aiming of servo platform. Through feature encoding of gaze image and gaze points, an establish the learning relationship between features. The CRF model is further input to output the predicted gaze points classification. The experimental results show that the proposed method performs feature analysis of gaze points from different angles. Compared with the relevant algorithms, it can be clearly seen from the subjective results that the proposed method can efficiently classify target gaze points. In addition, the objective comparison with relevant algorithms shows that the proposed method has improved the accuracy, recall rate and weight value. Furthermore, it can be applied to more accuracy achieve visual aiming of servo platform.
In future work, we aim at further studying the human-oriented, autonomous and efficient eye-tracking modes, in order to be able to understand the meaning of gaze points. In addition, the application of gaze point, should do more online experiment research. This can improve the effective use of gaze points, and accurately perform the human-computer interaction application of eye-tracking.

Author Contributions

Conceptualization, K.B. and J.W.; methodology, K.B.; software, K.B., X.C. and H.W.; validation, K.B.; formal analysis, K.B. and H.W.; investigation, K.B.; resources, J.W.; data curation, K.B. and X.C.; writing—original draft preparation, K.B.; writing—review and editing, K.B. and J.W.; visualization, J.W.; supervision, J.W.; project administration, J.W.; funding acquisition, J.W. All authors have read and agreed to the published version of the manuscript.

Funding

This research was supported by the Defense Industrial Technology Development Program (JCKY2021602B029).

Institutional Review Board Statement

Not applicable.

Informed Consent Statement

Not applicable.

Data Availability Statement

Not applicable.

Acknowledgments

We thank the Defense Industrial Technology Development Program for their funding.

Conflicts of Interest

The authors declare no conflict of interest.

References

  1. Hessels, R.S. How does gaze to faces support face-to-face interaction? A review and perspective. Psychon. Bull. Rev. 2020, 27, 856–881. [Google Scholar] [CrossRef] [PubMed]
  2. Tanaka, Y.; Kanari, K.; Sato, M. Interaction with virtual objects through eye-tracking. Int. Workshop Adv. Image Technol. 2021, 2021, 1176624. [Google Scholar]
  3. Zhang, X.; Sugano, Y.; Fritz, M.; Bulling, A. MPIIGaze: Real World Dataset and Deep Appearance-Based Gaze Estimation. IEEE Trans. Pattern Anal. Mach. Intell. 2019, 41, 162–175. [Google Scholar] [CrossRef] [PubMed] [Green Version]
  4. Wang, J.; Zhang, G.; Shi, J. 2D Gaze Estimation Based on Pupil-Glint Vector Using an Artificial Neural Network. Appl. Sci. 2016, 6, 174. [Google Scholar] [CrossRef] [Green Version]
  5. Zhuang, N.; Ni, B.B.; Xu, Y.; Yang, X.; Zhang, W.; Li, Z.; Gao, W. MUGGLE: MUlti-Stream Group Gaze Learning and Estimation. IEEE Trans. Circuits Syst. Video Technol. 2020, 30, 3637–3650. [Google Scholar] [CrossRef]
  6. Zhang, Z.; Zhang, H.; Liu, S.; Xie, Y.; Durrani, T.S. Part-Guided Graph Convolution Networks for Person Re-identification. Pattern Recognit. 2021, 120, 108155. [Google Scholar] [CrossRef]
  7. Cai, M.; Lu, F.; Gao, Y. Desktop Action Recognition from First-Person Point-of-View. IEEE Trans. Cybern. 2019, 49, 1616–1628. [Google Scholar] [CrossRef]
  8. Xu, T.L.; Zhang, H.; Yu, C. See You See Me: The Role of Eye Contact in Multimodal Human-Robot Interaction. ACM Trans. Interact. Intell. Syst. 2016, 6, 2. [Google Scholar] [CrossRef] [Green Version]
  9. Syrjmki, A.H.; Lyyra, P.; Hietanen, J.K. I don’t need your attention: Ostracism can narrow the cone of gaze. Psychol. Res. 2020, 84, 99–110. [Google Scholar] [CrossRef] [Green Version]
  10. Vella, F.; Infantino, I.; Scardino, G. Person identification through entropy oriented mean shift clustering of human gaze patterns. Multimed. Tools Appl. 2017, 76, 2289–2313. [Google Scholar] [CrossRef]
  11. Kim Dong, J.; Hong, K. An Implementation of Gaze Recognition System Based on SVM. KIPS Trans. Softw. Data Eng. 2010, 17, 1–8. [Google Scholar]
  12. Boisvert, J.F.G.; Bruce, N.D.B. Predicting task from eye movements: On the importance of spatial distribution, dynamics, and image features. Neurocomputing 2016, 207, 653–668. [Google Scholar] [CrossRef]
  13. Fuchs, S.; Belardinelli, A. Gaze-Based Intention Estimation for Shared Autonomy in Pick-and-Place Tasks. Front. Neurorobotics 2021, 15, 647930. [Google Scholar] [CrossRef] [PubMed]
  14. Coutrot, A.; Hsiao, J.H.; Chan, A.B. Scanpath modeling and classification with hidden Markov models. Behav. Res. Methods 2018, 50, 362–379. [Google Scholar] [CrossRef] [PubMed] [Green Version]
  15. Qiu, W.; Gao, X.; Han, B. Eye Fixation assisted video saliency detection via total variation based pairwise interaction. IEEE Trans. Images Processing 2018, 27, 4724–4739. [Google Scholar] [CrossRef]
  16. Lafferty, J.; Mccallum, A.; Pereira, F.C. Conditional random fields: Probabilistic models for segmenting and labeling sequence data. In Proceedings of the International Conference on Machine Learning, Washington, DC, USA, 28 June–2 July 2011. [Google Scholar]
  17. Benfold, B.; Reid, I. Unsupervised learning of a scene-specific coarse gaze estimator. In Proceedings of the IEEE International Conference on Computer Vision, ICCV 2011, Barcelona, Spain, 6–13 November 2011; IEEE: Manhattan, NY, USA, 2011. [Google Scholar]
  18. Huang, Y.; Cai, M.; Li, Z.; Sato, Y. Predicting Gaze in Egocentric Video by Learning Task-dependent Attention Transition. Comput. Vis. ECCV 2018, 2018, 789–804. [Google Scholar]
  19. Yang, R.; Wang, W.; Lai, Q.; Fu, H.; Shen, J.; Ling, H.; Yang, R. Salient Object Detection in the Deep Learning Era: An In-Depth Survey. IEEE Trans. Pattern Anal. Mach. Intell. 2019, 44, 3239–3259. [Google Scholar]
  20. Chen, X.; Zheng, A.; Li, J.; Lu, F. Look, Perceive and Segment: Finding the Salient Objects in Images via Two-stream Fixation-Semantic CNNs. In Proceedings of the 2017 IEEE International Conference on Computer Vision (ICCV), Venice, Italy, 22–29 October 2017; IEEE: Manhattan, NY, USA, 2017. [Google Scholar]
  21. Wang, W.; Jianbing, S.; Dong, X.; Borji, A. Salient Object Detection Driven by Fixation Prediction. In Proceedings of the IEEE CVPR, Salt Lake City, UT, USA, 18–23 June 2018; IEEE: Manhattan, NY, USA, 2018. [Google Scholar]
  22. Kruthiventi, S.; Gudisa, V.; Dholakiya, J.H.; Venkatesh Babu, R. Saliency Unified: A Deep Architecture for simultaneous Eye Fixation Prediction and Salient Object Segmentation. In Proceedings of the Computer Vision & Pattern Recognition, Las Vegas, NV, USA, 27–30 June 2016; IEEE: Manhattan, NY, USA, 2016. [Google Scholar]
  23. Nishiyama, M.; Matsumoto, R.; Yoshimura, H.; Iwai, Y. Extracting Discriminative Features using Task-oriented Gaze Maps Measured from Observers for Personal Attribute Classification. Pattern Recognit. Lett. 2018, 112, 241–248. [Google Scholar] [CrossRef]
  24. Lample, G.; Ballesteros, M.; Subramanian, S.; Kawakami, K.; Dyer, C. Neural Architectures for Named Entity Recognition. In Proceedings of the 2016 Conference of the North American Chapter of the Association for Computational Linguistics: Human Language Technologies, San Diego, CA, USA, 12–17 June 2016. [Google Scholar]
  25. Xinyang, F.; Jie, Z.; Youlong, L.; Liling, L.; Xiaojia, L. Attention-BLSTM-Based Quality Prediction for Complex Products. Comput. Integr. Manuf. Syst. 2021, 1–17. Available online: http://kns.cnki.net/kcms/detail/11.5946.TP.20211126.1817.008.html (accessed on 7 December 2021).
  26. Xindong, Y.; Haojie, G.; Junmei, H.; Li, Y.; Lu, X. Recognition of Complex Entities in the Filed of Weapons and Equipment. Acta Sci. Nat. Univ. Pekin. 2021, 1–20. [Google Scholar] [CrossRef]
  27. Hongfei, L.; Panyu, L.; Yong, W. Military named entity recognition based on self-attention and Lattice-LSTM. Comput. Eng. Sci. 2021, 43, 1848–1855. [Google Scholar]
  28. Borji, A.; Cheng, M.M.; Jiang, H.; Li, J. Salient Object Detection: A Benchmark. IEEE Trans. Image Processing 2015, 24, 5706–5722. [Google Scholar] [CrossRef] [PubMed] [Green Version]
  29. Liu, T.; Yuan, Z.; Sun, J.; Wang, J.; Zheng, N.; Tang, X.; Shum, H.Y. Learning to Detect a Salient Object. IEEE Trans. Pattern Anal. Mach. Intell. 2011, 33, 353–367. [Google Scholar] [PubMed] [Green Version]
  30. Long, M.; Niu, Y.; Feng, L. Saliency Aggregation: A Data-Driven Approach. In Proceedings of the IEEE Conference on Computer Vision & Pattern Recognition, Portland, OR, USA, 23–28 June 2013; IEEE: Manhattan, NY, USA, 2013; pp. 1131–1138. [Google Scholar]
  31. Qiu, W.; Gao, X.; Han, B. A Superpixel-based CRF Saliency Detection Approach. Neurocomputing 2017, 244, 19–32. [Google Scholar] [CrossRef]
  32. Zhang, J.; Sclaroff, S.; Lin, X.; Shen, X.; Price, B.; Mech, R. Minimum barrier salient object detection at 80 fps. In Proceedings of the 2015 IEEE International Conference on Computer Vision, Washington, DC, USA, 7–13 December 2015; pp. 1404–1412. [Google Scholar]
  33. Zhu, W.; Liang, S.; Wei, Y.; Sun, J. Saliency Optimization from Robust Background Detection. In Proceedings of the 2014 IEEE Conference on Computer Vision and Pattern Recognition, Washington, DC, USA, 23–28 June 2014; pp. 2814–2821. [Google Scholar]
  34. Bai, K.; Wang, J.; Wang, H. A Pupil Segmentation Algorithm Based on Fuzzy Clustering of Distributed Information. Sensors 2021, 21, 4209. [Google Scholar] [CrossRef]
  35. Wang, H.; Wang, J.; Bai, K. Image cropping and abnormal pupil exclusion for pupil detection. Trans. Beijing Inst. Technol. 2020, 40, 1111–1118. [Google Scholar]
  36. Bai, K.; Wang, J.; Wang, H. Study on Fixation Effect of Human Eye to Calibration Interface. Trans. Beijing Inst. Technol. 2020, 40, 1195–1202. [Google Scholar]
  37. Studyeboy. Significance Detection Dataset—Study Notes [DB]. 2019. Available online: https://blog.csdn.net/studyeboy/article/details/102383922.html (accessed on 7 December 2021).
Figure 1. The process of gaze point classification.
Applsci 12 06462 g001
Figure 2. Example of visual characteristics saliency cues expression by different methods.
Applsci 12 06462 g002
Figure 3. Specific representation of the pixel features of the target area.
Applsci 12 06462 g003
Figure 4. Graph model relations based on CRF.
Applsci 12 06462 g004
Figure 5. The input feature fusion module.
Applsci 12 06462 g005
Figure 6. Eye-tracking device.
Applsci 12 06462 g006
Figure 7. Relationship between gaze point and visual aiming of servo platform.
Applsci 12 06462 g007
Figure 8. Example of experimental gaze images.
Applsci 12 06462 g008
Figure 9. Example of the distribution of gaze points for different scene images.
Applsci 12 06462 g009
Figure 10. The classification process of gaze point classification. (a) the gaze images; (b) the gaze points corresponding to each image; (c) the gaze point classification results.
Applsci 12 06462 g010
Figure 11. Result of gaze point classification. (1)–(6) is the number of the images, these number are used in Figure 12.
Applsci 12 06462 g011
Figure 12. Subjective comparison of sample attention point classification results.
Applsci 12 06462 g012
Figure 13. Image No. 1 which denotes the classification results of the clustering method in [10].
Applsci 12 06462 g013
Figure 14. Image No. 3 which denotes the classification results of the SVM method in [10].
Applsci 12 06462 g014
Figure 15. Average comparison of test experimental results (Clustering [10], SVM [11], RF [12], HMM [14], GHMM [13], CRF [16]).
Applsci 12 06462 g015
Figure 16. Comparison of gaze points during the real scene images. (1)–(6) is the number of the images, these number where be used in Table 6.
Applsci 12 06462 g016
Figure 17. Test scene of the target center gaze. (a). Gazing target; (b). Interference target; (c). Interference target.
Applsci 12 06462 g017aApplsci 12 06462 g017b
Figure 18. Aiming process of target. (a). Aiming target; (b). The appearance of the first interference target when aiming; (c). The appearance of the second interference target when aiming.
Applsci 12 06462 g018
Figure 19. Gaze point distribution during visual aiming. (a). Distribution of the original gaze points; (b). Distribution of gaze points after classifying.
Applsci 12 06462 g019
Figure 20. 24 different time visual aiming state.
Applsci 12 06462 g020
Table 1. Pixel features per target area.
FeatureDefinitionDimension
RGBAverage RGB value of target area3
LabAverage Lab value of target area3
HSVAverage HSV value of target area3
Table 2. The parameters of the proposed method.
ParametersMeanings
I Gaze image
D Gaze points
Y Marked gaze points
m p ( i , j ) The   pixel   ( i , j ) feature in the target region
G t s Gaze   image   I   features   at   t moment
G t a Gaze   point   D   features   at   t moment
y * Gaze point sequence after predictive classification
Table 3. Result of scene image gazing with large target saliency.
Clustering [10]SVM [11]RF [12]HMM [14]GHMM [13]CRF [16]Proposed Method
Ra86.47%67.01%61.63%67.52%62.66%66.33%69.67%
Co19.2116.9820.0317.4819.8717.5216.44
Table 4. Result of scene image gazing with small target saliency.
Clustering [10]SVM [11]RF [12]HMM [14]GHMM [13]CRF [16]Proposed Method
Ra32.16%48.61%40.31%48.24%48.37%48.87%49.67%
Co19.3823.5522.7321.1423.5621.4221.39
Table 5. Comparison of sample gaze test evaluation results.
123456
Clustering [10]Precision89.38%73.65%56.21%90.21%76.53%97.64%
Recall96.31%96.98%97.02%49.37%95.32%84.81%
We89.91%75.14%58.23%84.44%77.79%96.43%
SVM [11]Precision84.33%85.78%88.36%83.59%84.61%86.17%
Recall86.99%85.92%87.01%84.04%83.91%85.06%
We84.54%85.79%88.24%83.62%84.55%86.07%
RF [12]Precision82.46%83.61%83.01%82.86%83.45%84.26%
Recall82.68%83.85%83.25%82.96%83.63%85.24%
We82.56%83.73%83.16%82.91%83.57%84.69%
HMM [14]Precision86.33%85.95%62.06%89.04%84.19%86.14%
Recall85.77%86.23%63.54%88.53%84.96%86.26%
We86.28%85.97%62.17%88.99%84.25%86.14%
GHMM [13]Precision85.79%84.96%63.99%88.78%84.16%86.35%
Recall85.65%85.63%63.65%88.96%84.31%86.64%
We85.71%85.38%63.78%88.81%84.27%86.43%
CRF [16]Precision86.21%85.52%88.91%88.76%84.99%86.28%
Recall85.98%85.48%86.04%89.03%85.59%85.71%
We86.19%85.51%88.66%88.78%85.04%86.23%
Proposed methodPrecision86.21%85.99%89.15%89.27%84.65%96.58%
Recall85.98%86.17%86.38%89.41%85.22%86.95%
We86.19%86.00%88.91%89.28%85.61%96.61%
Table 6. Comparison of real images gaze test evaluation results.
123456
Clustering [10]Ra-81.87%96.31%91.34%86.52%84.17%
Co-61.2356.8644.1137.1343.62
Precision-93.62%94.34%96.68%94.23%96.51%
Recall-94.13%94.25%97.04%93.96%96.35%
We-93.97%94.31%96.79%94.17%96.42%
SVM [11]Ra-63.58%95.33%91.26%84.55%80.74%
Co-30.2156.2743.9133.2339.42
Precision-93.65%95.16%96.37%95.11%95.63%
Recall-93.78%95.35%96.24%94.97%95.52%
We-93.71%95.26%96.32%95.03%95.58%
RF [12]Ra-53.95%74.62%89.11%83.46%75.93%
Co-40.5856.3748.7443.6139.96
Precision-91.12%92.24%92.64%91.39%92.45%
Recall-92.33%92.41%91.58%91.42%92.58%
We-91.65%92.37%92.53%91.40%92.51%
HMM [14]Ra-56.33%63.86%90.28%80.24%77.69%
Co-26.3121.6459.0328.3133.41
Precision-94.95%94.17%95.38%94.64%96.72%
Recall-94.77%94.22%95.42%94.81%96.78%
We-94.81%94.20%95.40%94.76%96.75%
GHMM [13]Ra-51.91%64.23%91.02%79.36%78.44%
Co-27.5221.3548.2226.9834.06
Precision-93.88%94.91%95.64%94.35%95.99%
Recall-94.97%94.22%95.69%94.97%96.84%
We-94.63%94.64%95.67%94.83%96.63%
CRF [16]Ra-53.16%60.65%91.64%83.94%80.73%
Co-22.9317.5242.9726.8229.46
Precision-94.53%95.32%96.65%96.01%97.01%
Recall-94.58%95.29%96.87%96.44%96.35%
We-94.55%95.30%97.76%96.23%96.79%
Proposed methodRa-51.91%59.77%91.34%82.27%79.83%
Co-21.4716.9843.7425.4127.53
Precision-95.33%95.68%97.21%96.39%98.15%
Recall-95.78%95.35%97.19%96.78%98.17%
We-95.69%95.62%97.21%96.44%98.16%
Publisher’s Note: MDPI stays neutral with regard to jurisdictional claims in published maps and institutional affiliations.

