Abstract
In coal dry screening, online detection for screening efficiency is a significant challenge. Notwithstanding, the method of image processing is strenuous to implement in this field due to the complex surface texture of shattered coal. This method identifies the fractal phenomenon before and after coal screening is discovered for the indirect detection of screening efficiency. For better fractal dimension distribution, an image denoising and filter method for wiping off the coal image surface texture is applied. Additionally, an enhanced Kirsch edge-detection algorithm is employed to obtain coal particle edges. Furthermore, the relation between fractal dimension and screening efficiency is presented by using the box-counting method. In this research, we skilfully transform the tough problem of image detection for particle size distribution into the calculation of the fractal dimension of the coal-edge image, and closely associate the fractal dimension with screening efficiency. With this method, it will be easier to predict the screening efficiency in real-time.
1. Introduction
Coal accounts for ~30% of the world’s energy resources [1]. In 2019, China produced 3.85 billion tons of raw coal, which increased by 4.0% year on year and accounted for 47.3% of global production [2]. Intelligent coal production is currently a major direction, and dry screening is the primary method in the field of coal screening. Therefore, the detection of coal dry screening in real-time has always been a significant challenge in its field.
Currently, there is little research on real-time monitoring methods for coal dry screening. Liao [3] developed a new online automatic optical inspection system (OAOIS) applying digital image processing to measure the coarse particle size distribution. Igathinathane [4] demonstrated the inconsistencies of length-based separation by mechanical sieving using standard sieves and developed a user-coded Java ImageJ plugin based on determining distinct lengths of all particles to analyse particle size distribution (PSD) and determine various PSD parameters. Ulusoy [5] determined the particle size distribution (PSD) of various coal particles (hard coal and lignite) produced by two mills (ball and Gy-Ro mill) using a novel size-analysis technique, namely 3D dynamic image analysis (DIA). Zhang [6] designed a machine vision system to predict the ash content of fine cleaned coal products based on image processing. Abhik [7] proposed a new effective and precise method for converting coarse aggregates’ size-based distribution into a cumulative mass percentage. Zhang [8] established and enhanced the mass model of coarse coal particles, together with testing the results of adopting image analysis. Furthermore, Engin [9] described a fast and reliable analysis of LiDAR point-cloud data containing surface scans of aggregate piles/masses using their algorithm. Moreover, Liu [10] proposed a new method to evaluate the angularity of surface aggregates based on 3D point-cloud images. Yang [11] proposed a digital image-processing-based online detection system for coarse aggregate particle size and grain shape measurements (DIP). Additionally, Liao [12] developed a full scan inspection system with optical line scan technology for particle size analysis using digital image processing. These approaches have made many efforts to develop image-processing methods for clear-boundary particles; in spite of that, these methods have high requirements, including light sources and particle spacing, which are not suitable for industrial production.
In coal dry screening, it is arduous to use the previously mentioned methods because it is impossible to test the screening efficiency of a vibrating screen before the final product, because it is time-consuming and labour-consuming, and the above technology cannot measure the PSD of the coal heap. On the other hand, the fractal dimension can describe the granularity of the powder and aggregates. Besides, Patil [13] developed BiVO4 microspheres with fractal granularity using a simple surfactant-assisted hydrothermal method and utilized them as promising anode materials for Li-ion batteries (LIBs). In addition, Yin [14] investigated the size distribution and fractal characteristics of coal pores through nuclear magnetic resonance cryoporometry, which relates the fractal characteristics and size distribution of coal. Apart from that, Chu [15] derived new analytical expressions for the fractal dimension, the cumulative probability of size, and the mass distributions for particles. Pedrycz [16] introduced the concept of fuzzy fractal dimension and demonstrated its role in analysing the granular properties of data. He also proposed a power law of information granularity in the context of fuzzy modelling. Furthermore, coal-screening efficiency is related to the fractal dimension.
In this study, we developed a fractal method to indirectly describe coal-screening efficiency and coal particle size distribution on the basis of image processing. Simultaneously, a new image-detection system for coal dry screening is proposed. This paper is organized as follows. In Section 2, we present our new online image-detection system for the dry screening of coal. In Section 3, the basic theories for this system, including the image fractal dimension, wavelet transform, image filter, and Kirsch edge operator, are revealed. Several groups of images are created in Section 4 to compare the fractal dimension under various screening efficiencies. Finally, we conclude the highlights of this paper.
2. Materials
The online image-detection system for coal dry screening is presented in Figure 1. In the system, two CMOS cameras are fixed on the feeding and discharging conveyor belts at both ends of the vibrating screen. The CMOS cameras (which are IMX363s; exposure time is 0.001s) are approximately 400 mm high from the conveyor belt. The output image is 2944 × 2944 pixels in resolution. The computer is linked to the data line of the CMOS camera. By comparing the graphic changes of the feed conveyor belt and discharge conveyor belt, the system can detect the screening efficiency in real time.
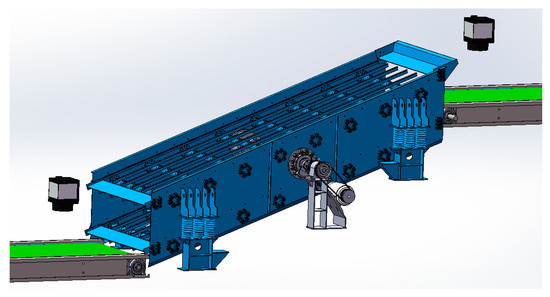
Figure 1.
The online image-detection system for coal dry screening.
3. Methodologies
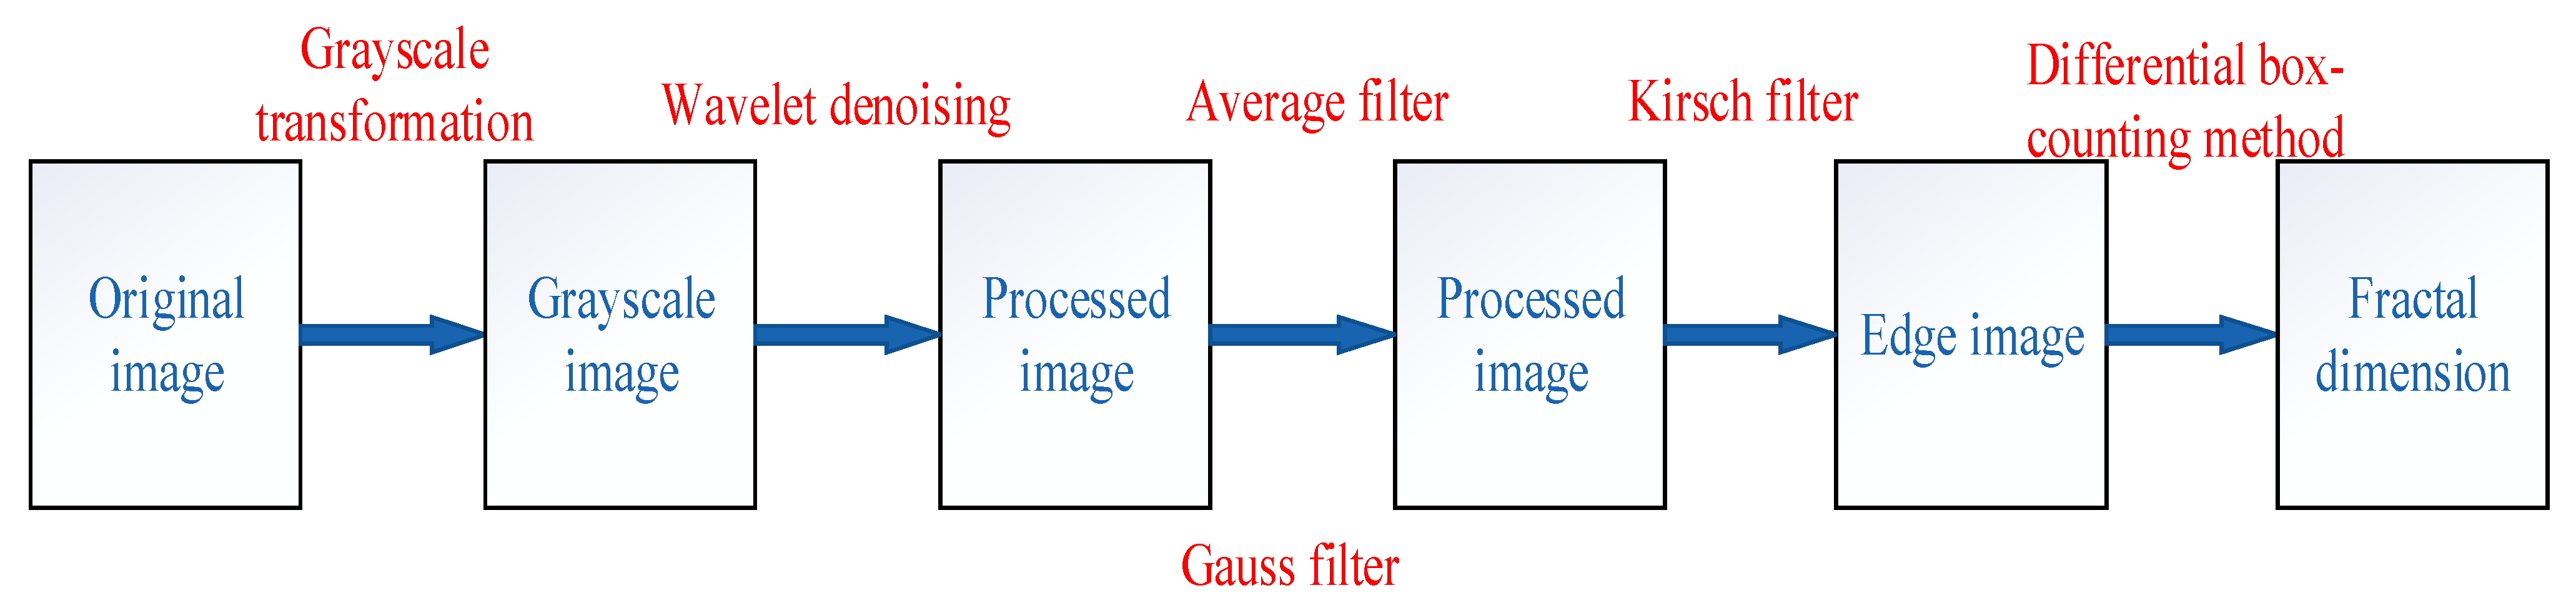
After obtaining images from the detection system, there are three processes for processing the coal images to obtain the fractal dimension. The first is the preprocess. In this process, the coal images, transformed to grayscale images at first, are denoised by the wavelet-transform method and filtered by the average and Gauss methods. After this, the edge-detection algorithm, on the basis of the Kirsch operator, is applied to obtain the coal-edge images. Ultimately, a differential box-counting method is used to calculate the fractal dimension of the coal-edge images. In short, our idea is to use a series of image-processing techniques to obtain the edge image of coal and then calculate its fractal dimension. The detailed flowchart of the image-processing steps is demonstrated in Figure 2.
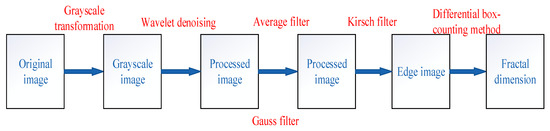
Figure 2.
The flowchart of image-processing steps.
3.1. Fractal Dimension for Coal Particle Image
Fractals can be found in many self-similar natural objects. For non-self-similar objects, fractal dimensions can also be used to describe their geometric characteristics and properties. In our research, the images of coal do not strictly obey the law of self-similarity, yet the box dimension can be used to study the coal particle size distribution and screening efficiency of vibrating screens. For this purpose, a differential box-counting method is used to determine the coal’s box size [17]. The basic equation of the differential box dimension is given by
Nr represents the differential grayscale surface area under measure r. Measure r signifies that the image of size M × M pixels is scaled down to size s × s under measure r, and the relation is as follows:
For each different measure r, the combination of the grid gray level and two-dimensional coordinates forms the three-dimensional surface of the whole image.
Furthermore, the differential grayscale surface area Nr is given by
where nr(i,j) is the maximum gray level difference of the scaled grid (i,j) and is represented as
where l is the maximum grayscale in the grid(i,j) and k is the minimum grayscale.
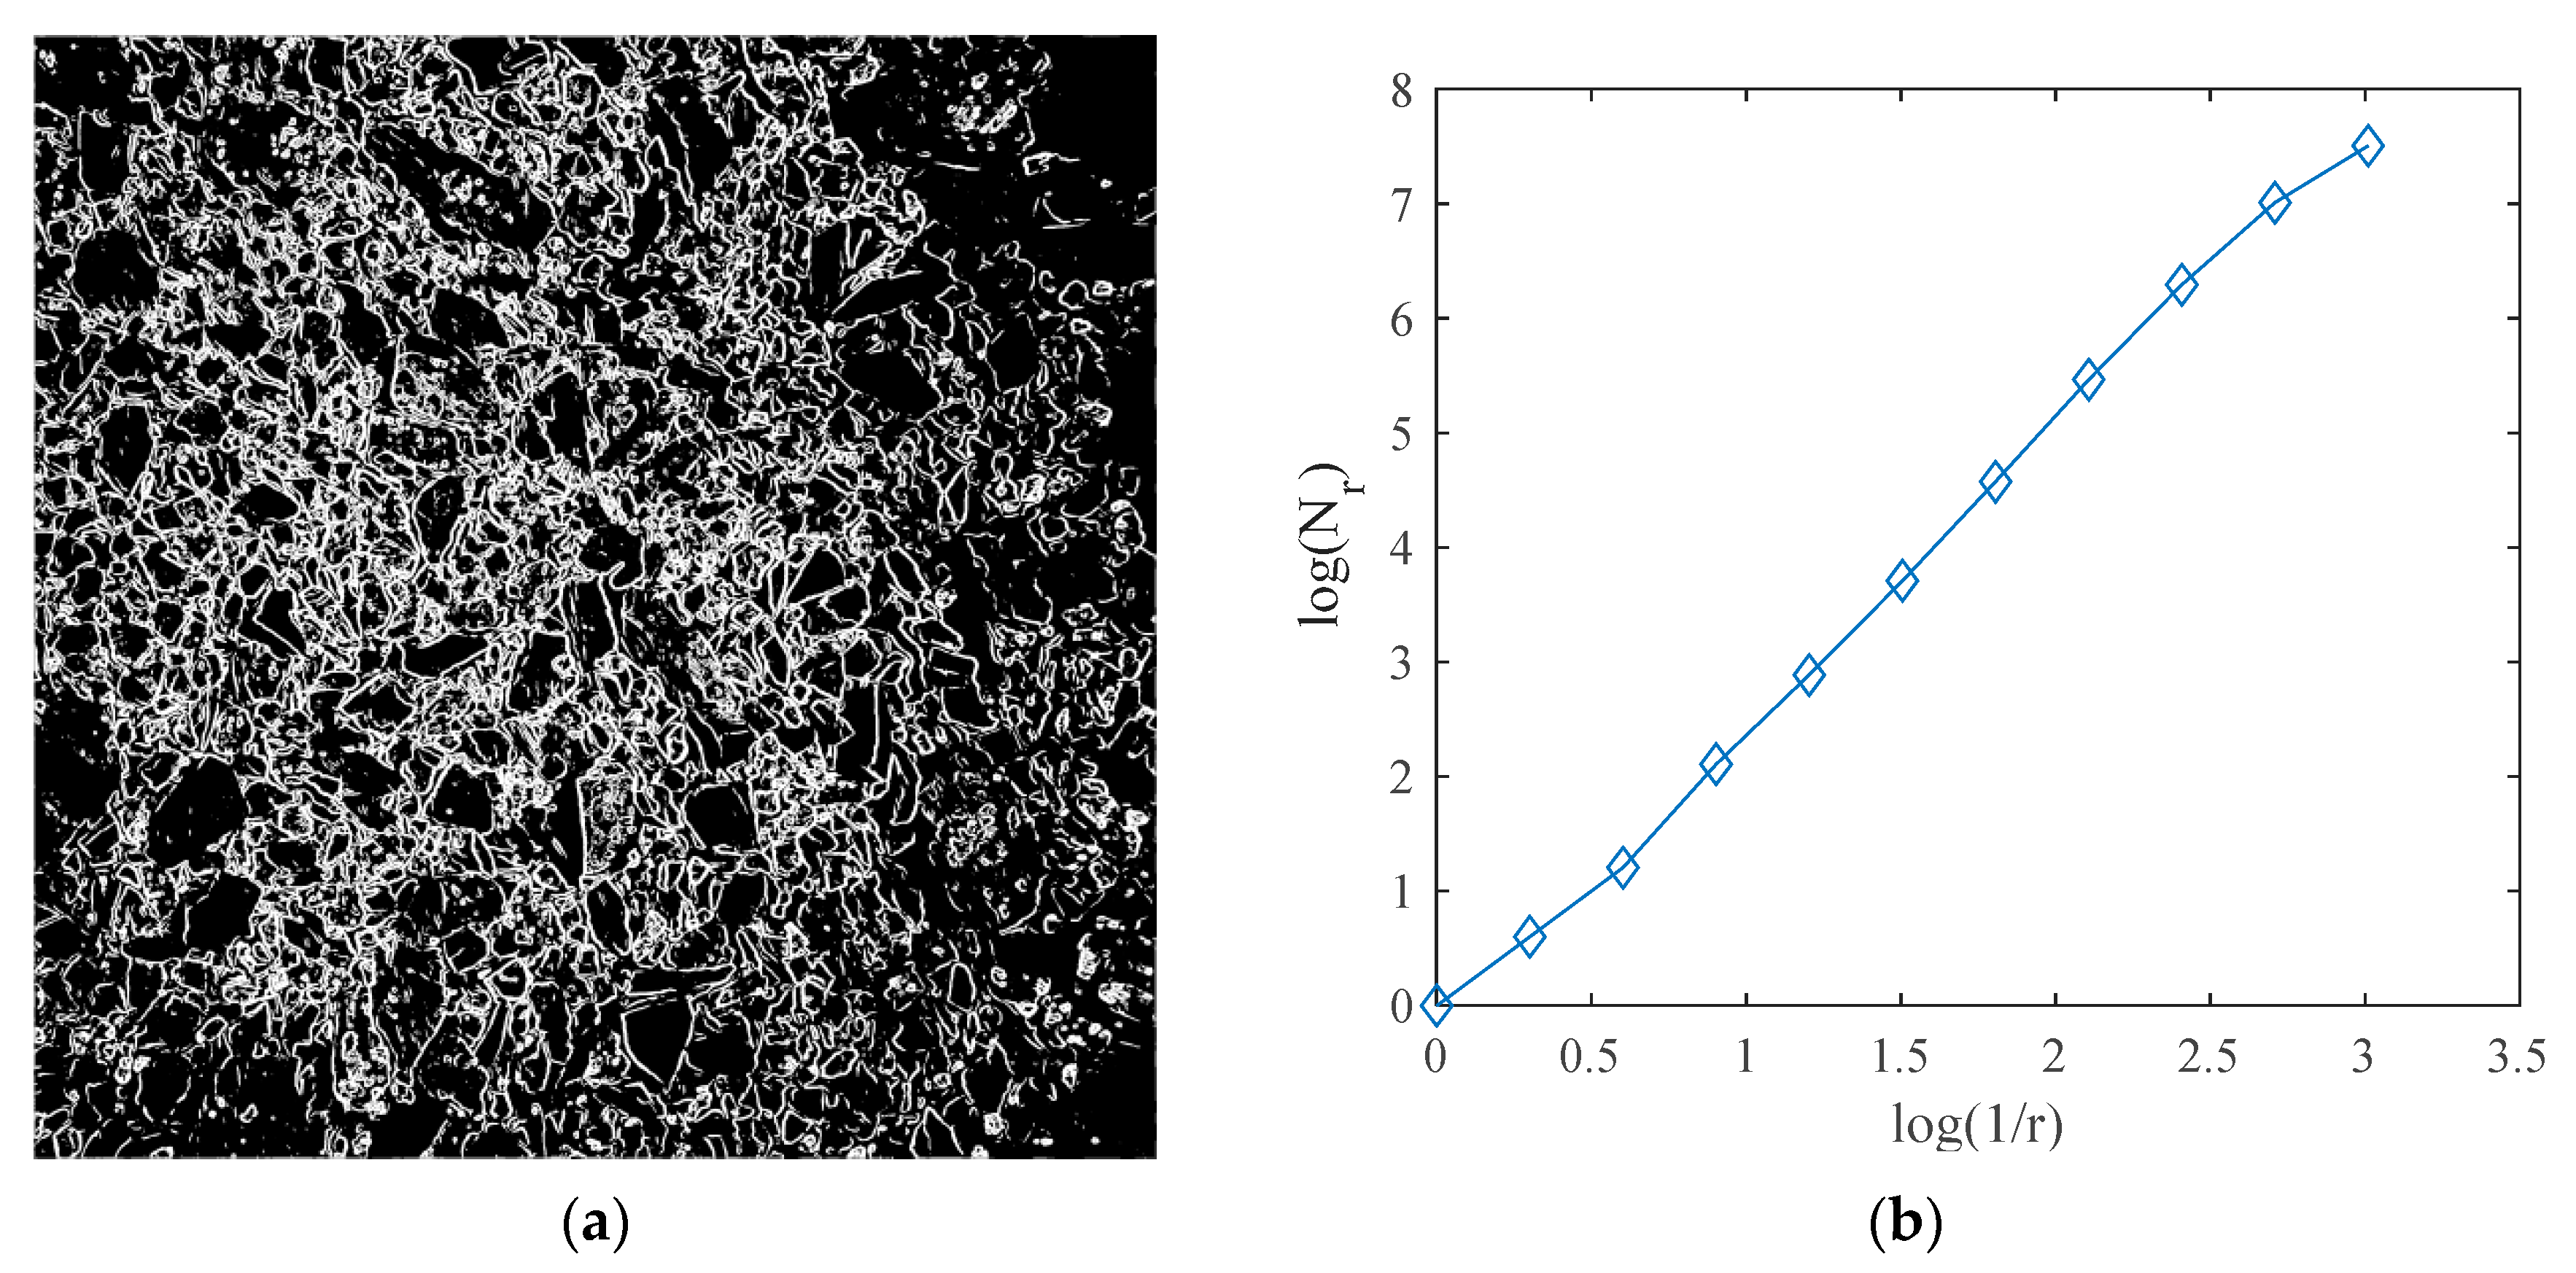
The fractal box dimension can be calculated in measure r by Equations (1)–(4). Subsequently, we can estimate D, the fractal dimension, from the least square linear fit of log(Nr) against log(1/r).
Figure 3 is the least-squares fitting curve of one coal-edge image, and the curve is approximately linear. This proves that fractals do exist in coal-edge images and that the fractal dimension can be a characteristic of coal images and coal PSD.
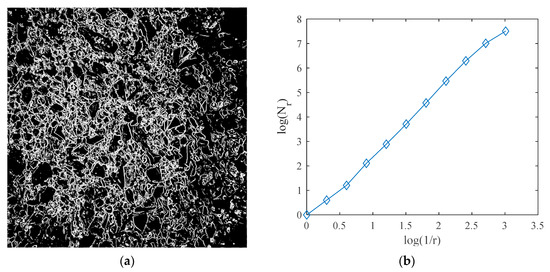
Figure 3.
The image fractal dimension of coal edge in different scale. (a) Original coal-edge image (b) Fractal dimension.
3.2. Wavelet Denoising, Average Filter, and Gauss Filter
The initial image of coal contains many details of the coal surface texture. If the initial image is plainly handled by an edge-processing algorithm without denoising and filtering, then the surface texture will grow into a large part of the edge pictures, and the fractal dimension will be difficult to calculate. Hence, this section aims to use image-preprocessing methods for sharper edge images. In this research, the denoising and filtering process has three steps.
Step 1: Wavelet transform is applied to denoised.
Step 2: Average filter.
Step 3: Gauss filter.
Donoho proposed the wavelet-denoising method [18,19,20], which enriches the theory and application of wavelets. The wavelet expansion for any one-dimensional discrete signal can be represented as
where ψ(t) is the wavelet function. Furthermore, the discrete signal is expanded in one wavelet series as
in which φ(t) is the wavelet scaling function. The coefficients can be calculated as follows, where the wavelet function and wavelet-scaling function are orthogonal:
In this paper, the Haar wavelet is adopted for image denoising, and its wavelet function and wavelet-scaling function are given by
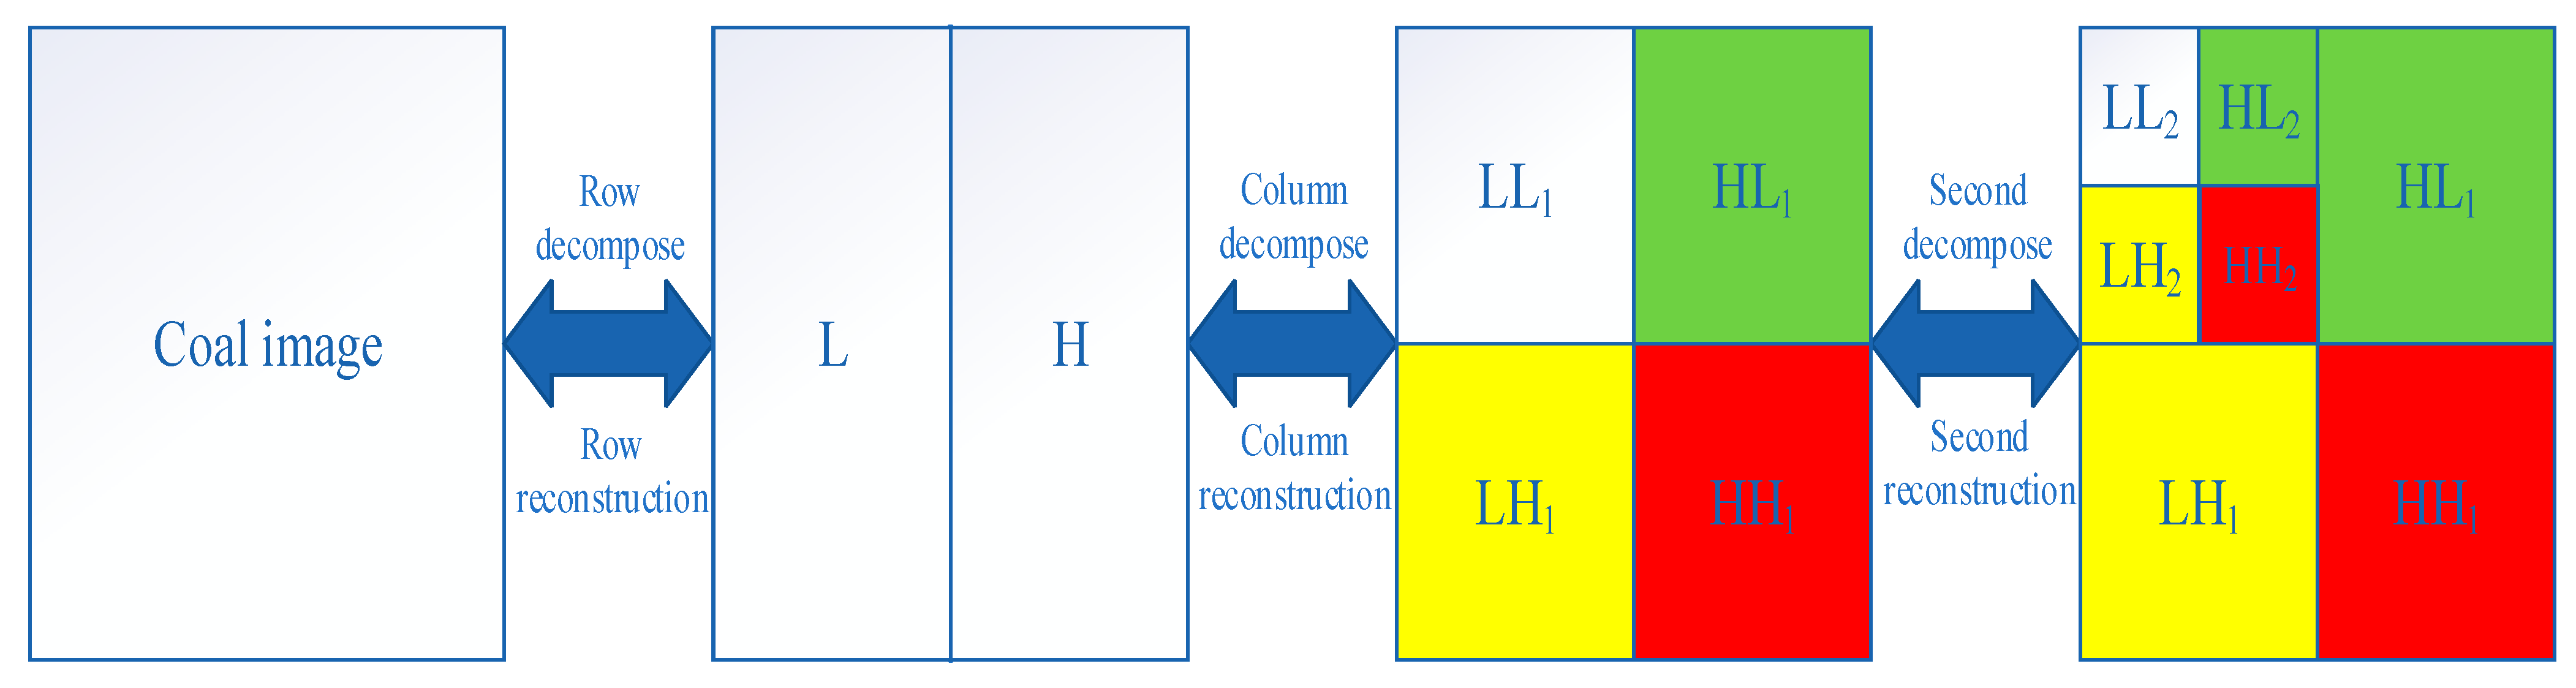
There are three steps for image denoising using wavelet transform. Step 1 is image gray matrix wavelet decomposition. The image gray matrix is composed of two-dimensional signals. First, each row of the image gray matrix is decomposed by a one-dimensional discrete wavelet transform (1D-DWT). The coefficients of the wavelet function represent the low-frequency component, whereas the coefficients of the wavelet-scaling function represent the high-frequency component. After the row decomposition, the column decomposition is applied in the same way, and four parts LL1, LH1, HL1, and HH1 are obtained, as demonstrated in Figure 4. There is one wavelet decomposition for the image. The next wavelet decomposition is applied based on the LL1 part, and parts LL2, LH2, HL2, and HH2 are obtained in the same way. The different wavelet coefficients of each series are obtained, and the decomposition process is completed by repeating this process. Step 2 is the thresholding operation. This step aims to process the wavelet-function and wavelet-scaling-function coefficients. In this study, the highest-frequency signal of the coal image is the interference signal because the coal surface texture produces a reflection spot. For this reason, the high-frequency wavelet coefficients are cut off or reduced. Step 3 is wavelet reconstruction. The signal is restructured using wavelet coefficients and functions that have been processed.
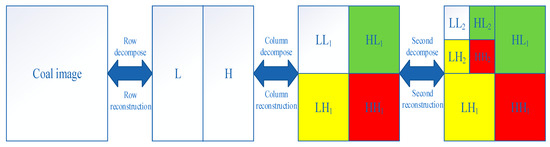
Figure 4.
The wavelet-transform steps for coal image.
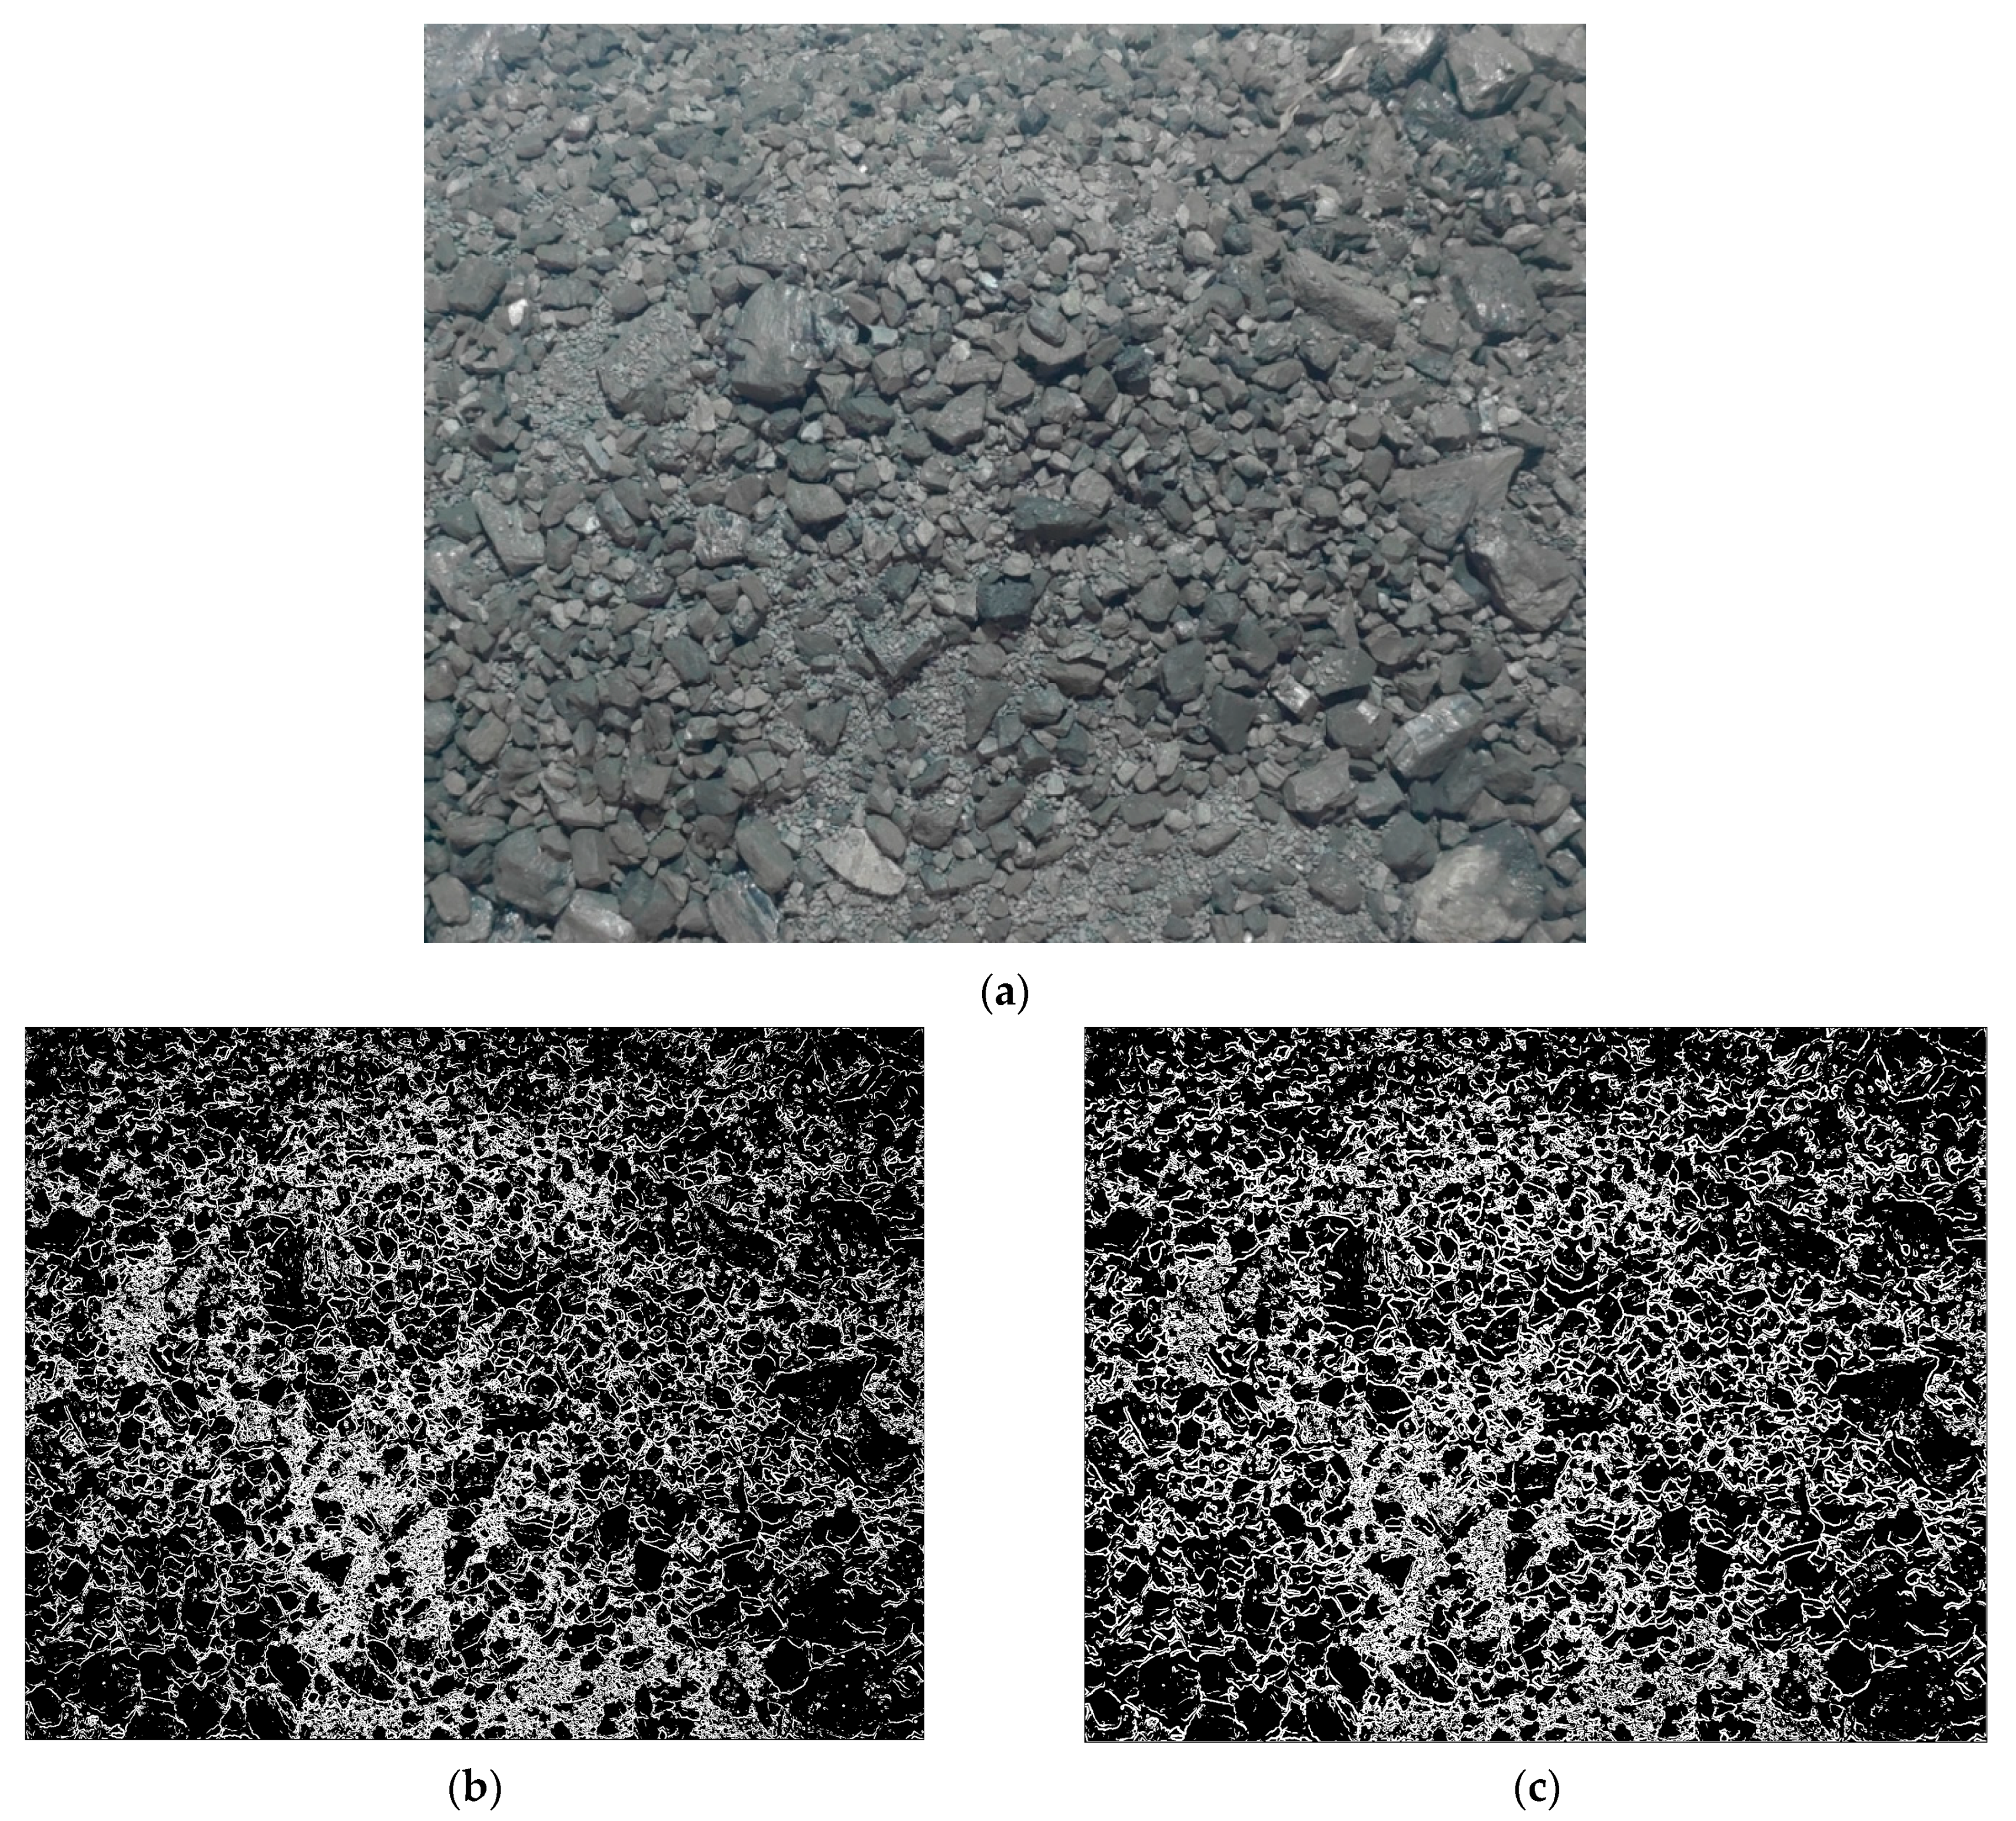
As demonstrated in Figure 5, the surface texture pixels and reflected light pixels of the denoised image are less than the original image. It is also apparent that the coal’s edge is much clearer, which will aid in calculating the fractal dimension.

Figure 5.
Edge image of coal with and without wavelet denoising. (a) Original coal image; (b) edge image without wavelet denoising; (c) edge image with wavelet denoising.
The image-filtering algorithms depend on the different filtering templates. For N × N filtering templates, the filtered image grayscale G’ is given by
G(i,j) represents the original grayscale. M(i,j) represents the No.(i,j) element of the filtering template M. For the average filter, the element values of the N × N filtering template M are all 1/N2. It can also be observed that the coal’s edge is much more distinct, which will be advantageous when calculating the fractal dimension.
The (2k + 1) × (2k + 1) Gauss filtering template is represented as
where δ is the standard deviation of the Gaussian filter. The filtered gray image is obtained by using Equations (11) and (12).
3.3. Kirsch Operator for Image Edge Detection
This section aims to obtain the coal-edge image from the previous processed image, and we will assign a value to each pixel and use this value to compare the threshold for determining whether the pixel is an edge pixel. The Kirsch operator, which is an edge-detection algorithm proposed by R. Kirsch [21] applied eight 3 × 3 templates, representing eight directions, to convolve with an image grayscale matrix. The eight templates Kn (n = 1~8) are given by
A selected pixel grayscale and the eight nearby pixels form a 3 × 3 submatrix Gs, which is a part of the image grayscale, and the submatrix Gs is given by
Gs (2,2) is the selected pixel grayscale. Furthermore, the processed edge grayscale gK is represented as
All the elements of the image grayscale, processed by the Kirsch operator, form a new matrix Gk. At the moment, threshold T is applied to generate the edge of the coal image. Each element of Gk is compared with threshold T. If the element value is less than threshold T, the final pixel grayscale becomes 255 unless it becomes 0. This method yields the edge image of the original image as a result.
In this study, it is difficult to determine the threshold of the original Kirsch operator because the grayscale of coal is similar. Therefore, we utilized an enhanced Kirsch operator to improve the grayscale of the processed edge for simpler threshold decisions. In this method, the processed edge grayscale is given by
4. Results and Discussion
4.1. The Fractal Dimension at Different Heights for Coal Particles
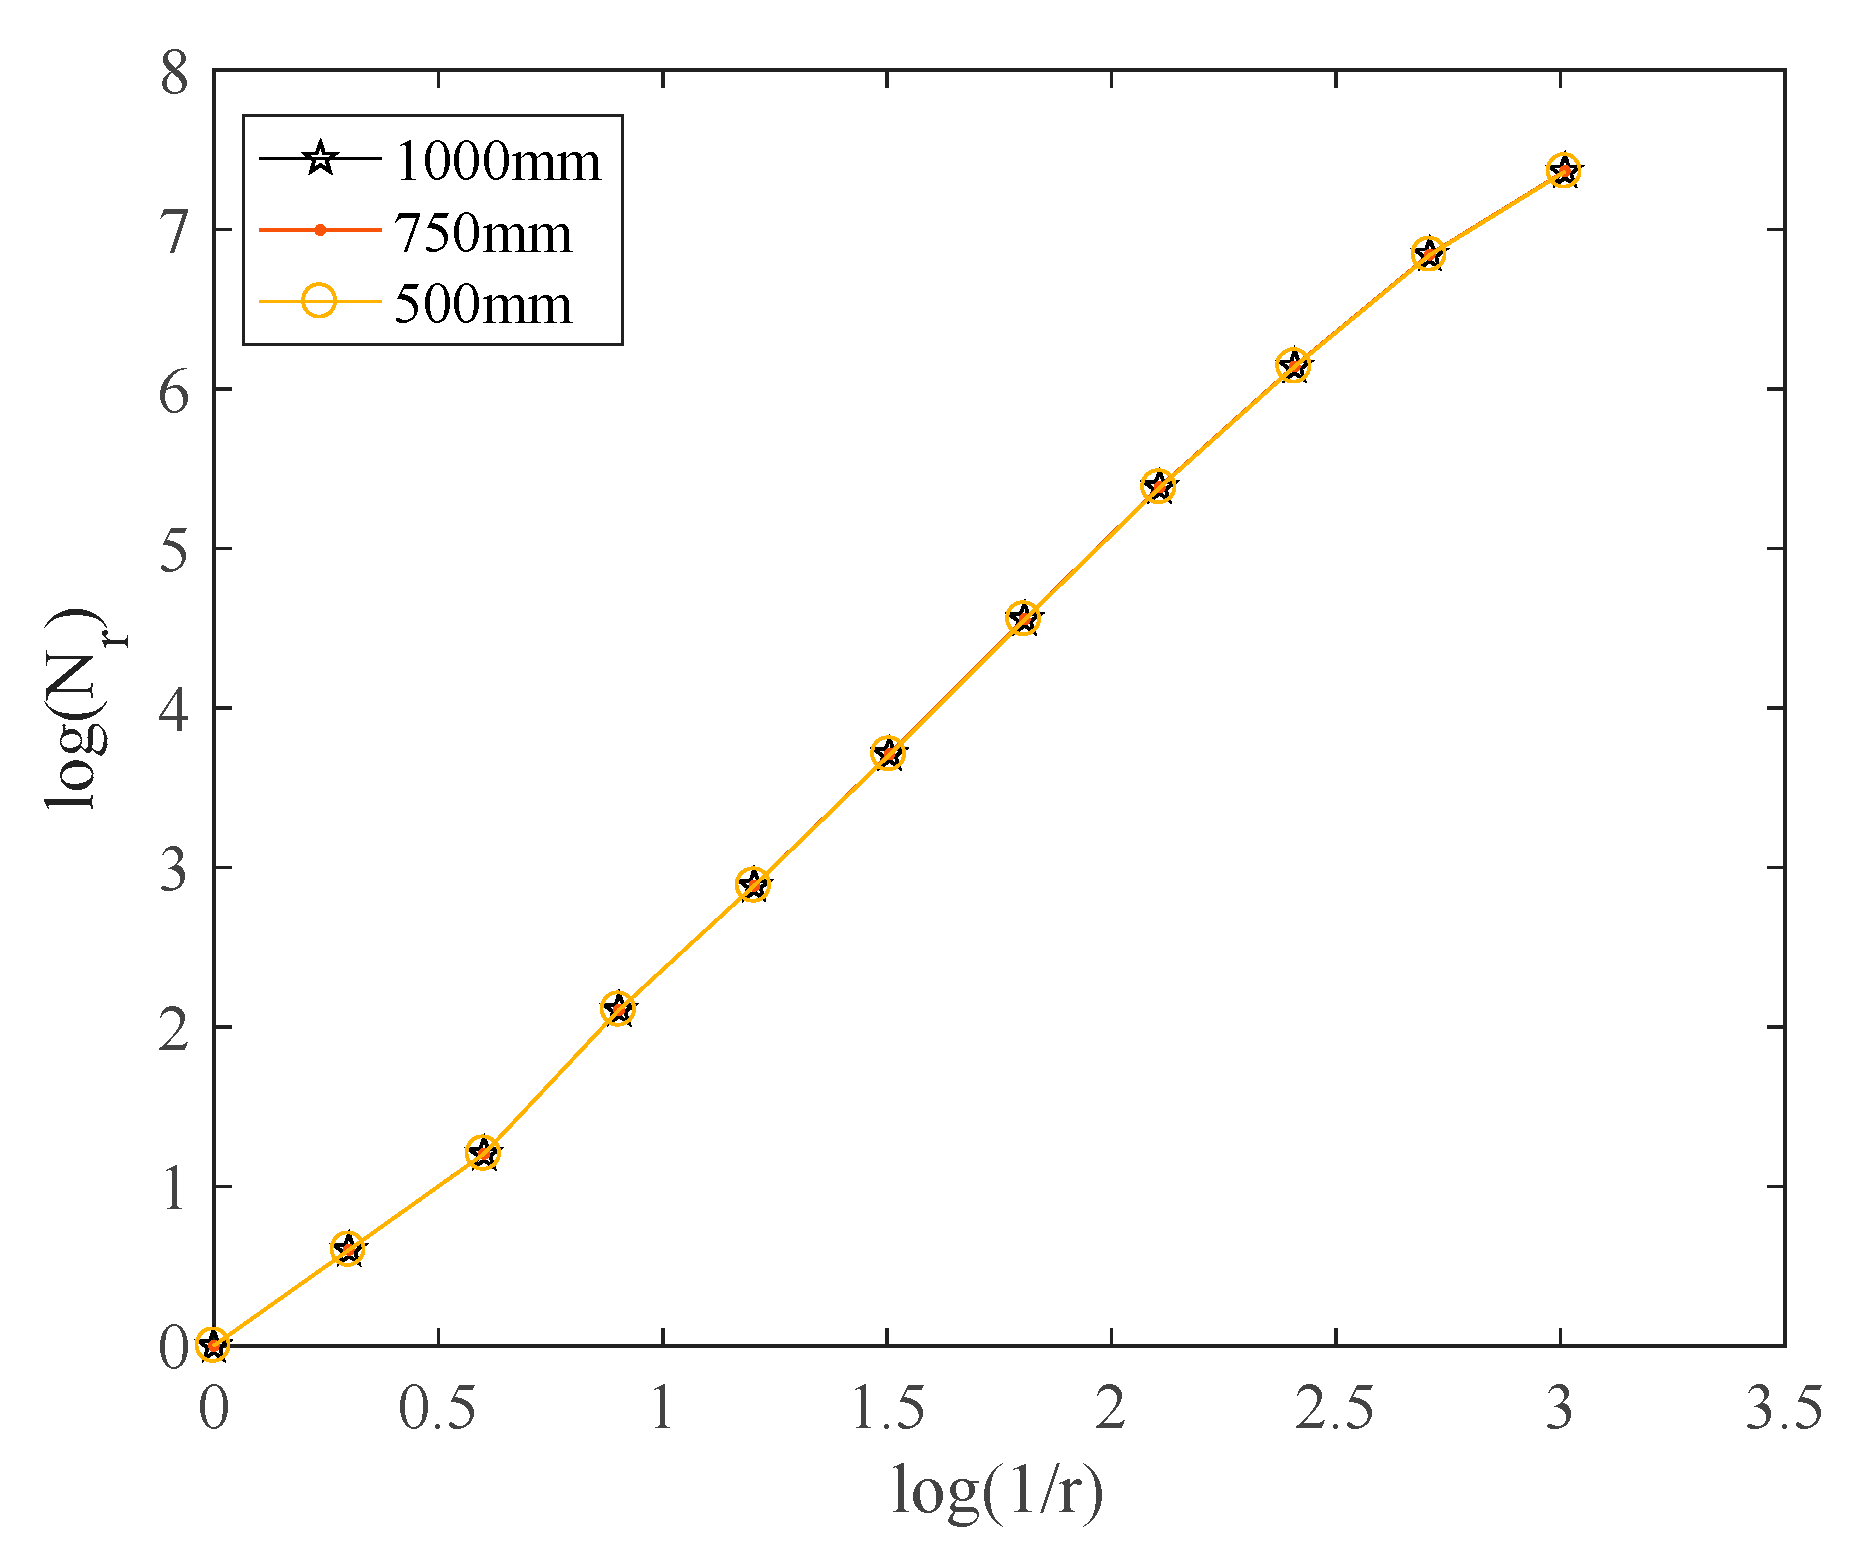
The fractal dimension of edge photos at different scales is approximately equal to the above fractal theory. Essentially, snapping at contrasting heights is the same as sampling at different scales. Therefore, we took photos of the coal heaps, for which the PSD is 9~13 mm, from three divergent heights to calculate the fractal dimension as Figure 6 shows. Figure 7 shows the fractal dimension at divergent heights of the 6~9 mm coal particles. The curves of the fractal dimensions are similar, and the fractal dimensions are 2.5613, 2.5621, and 2.5617. It proves that the snap height has little effect on the fractal dimension and the edge images of coal particles have definite fractal behavior.
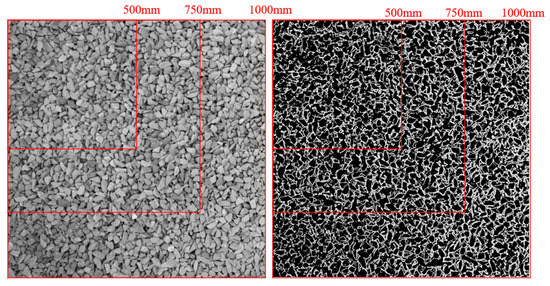
Figure 6.
Images of 6–9 mm coal particles.
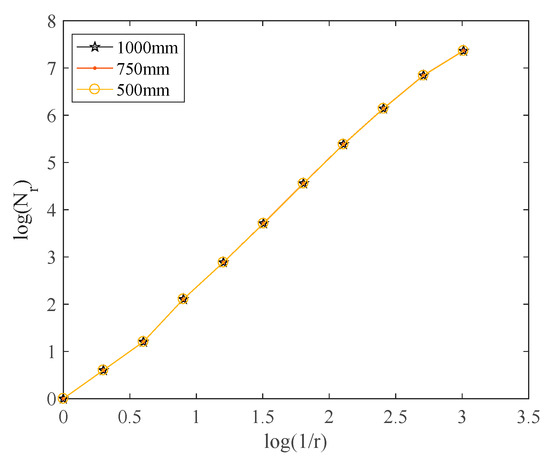
Figure 7.
Fractal dimensions at different heights.
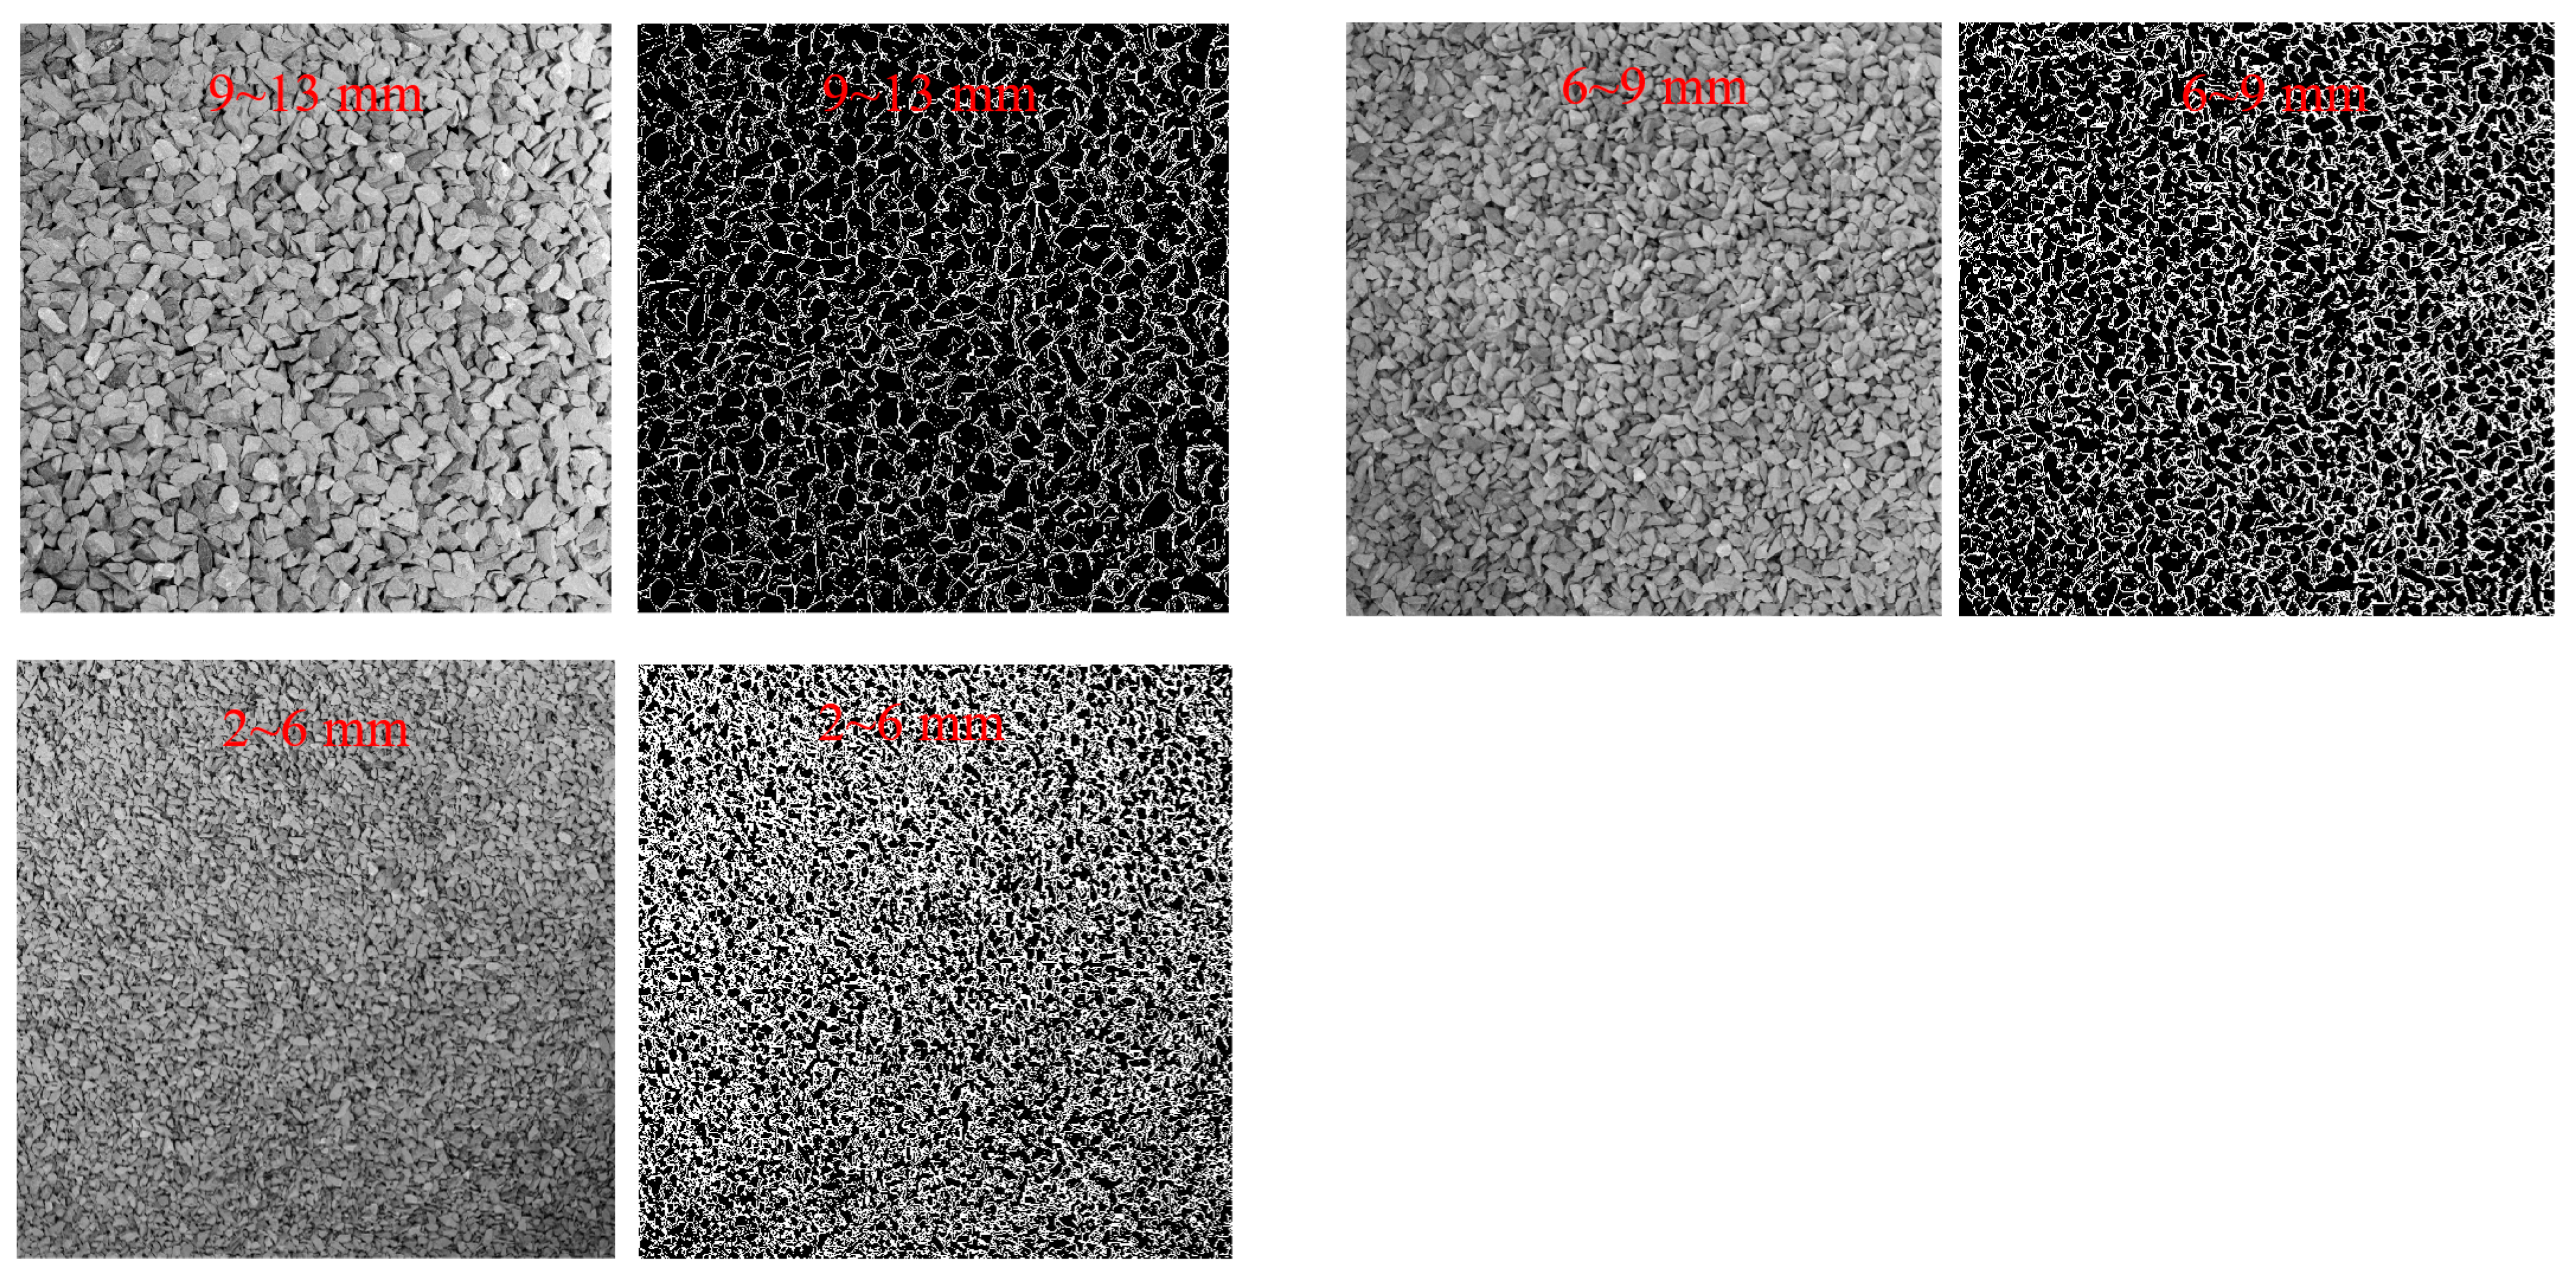
4.2. The Fractal Dimension of Common Coal Particle Sizes
The deep screening of small particles has become a major problem with the development of coal dry screening. Hence, coal particles with 2~6, 6~9, and 9~13 mm are selected for comparing the fractal dimension. Figure 8 displays the images and the edge images of those coal particles. The fractal dimensions of 2~6, 6~9, and 9~13 mm particles are 2.6393, 2.5841, and 2.5617. The fractal dimension gradually increases with the decrease in particle size as a consequence of the small particles having more complex edge images. This phenomenon provides the basis for using fractal dimension to detect the change in the particle size distribution.
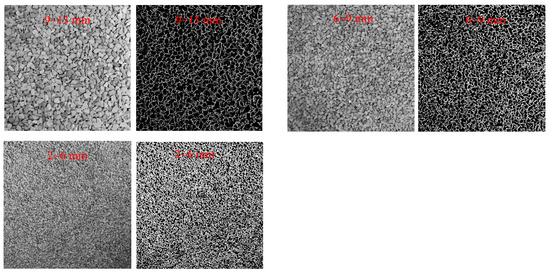
Figure 8.
Images of different coal particle sizes.
4.3. The Relation between Fractal Dimension and Screening Efficiency
In the practical coal-screening process, the size fraction is dissimilar because of the divergent production and excavation situations. In this study, the coal particle size fraction shown in Table 1 is fabricated for representative purposes.

Table 1.
Coal particle size fraction before screening.
In this paper, the screening efficiency is used to evaluate the screening performance and is given by Equation (17), correspondingly [22,23]
where η is the screening efficiency (%), α is the content of fine particles in feed (%), β is the content of fine particles in the undersized product (%), and θ is the content of fine particles in the oversized product (%).
For the purpose of studying the possibility of the fractal method, the relationship between the image fractal dimension and screening efficiency is revealed. Multiple groups of images screened with differing efficiencies serve as proxies for more precise fractal dimensions.
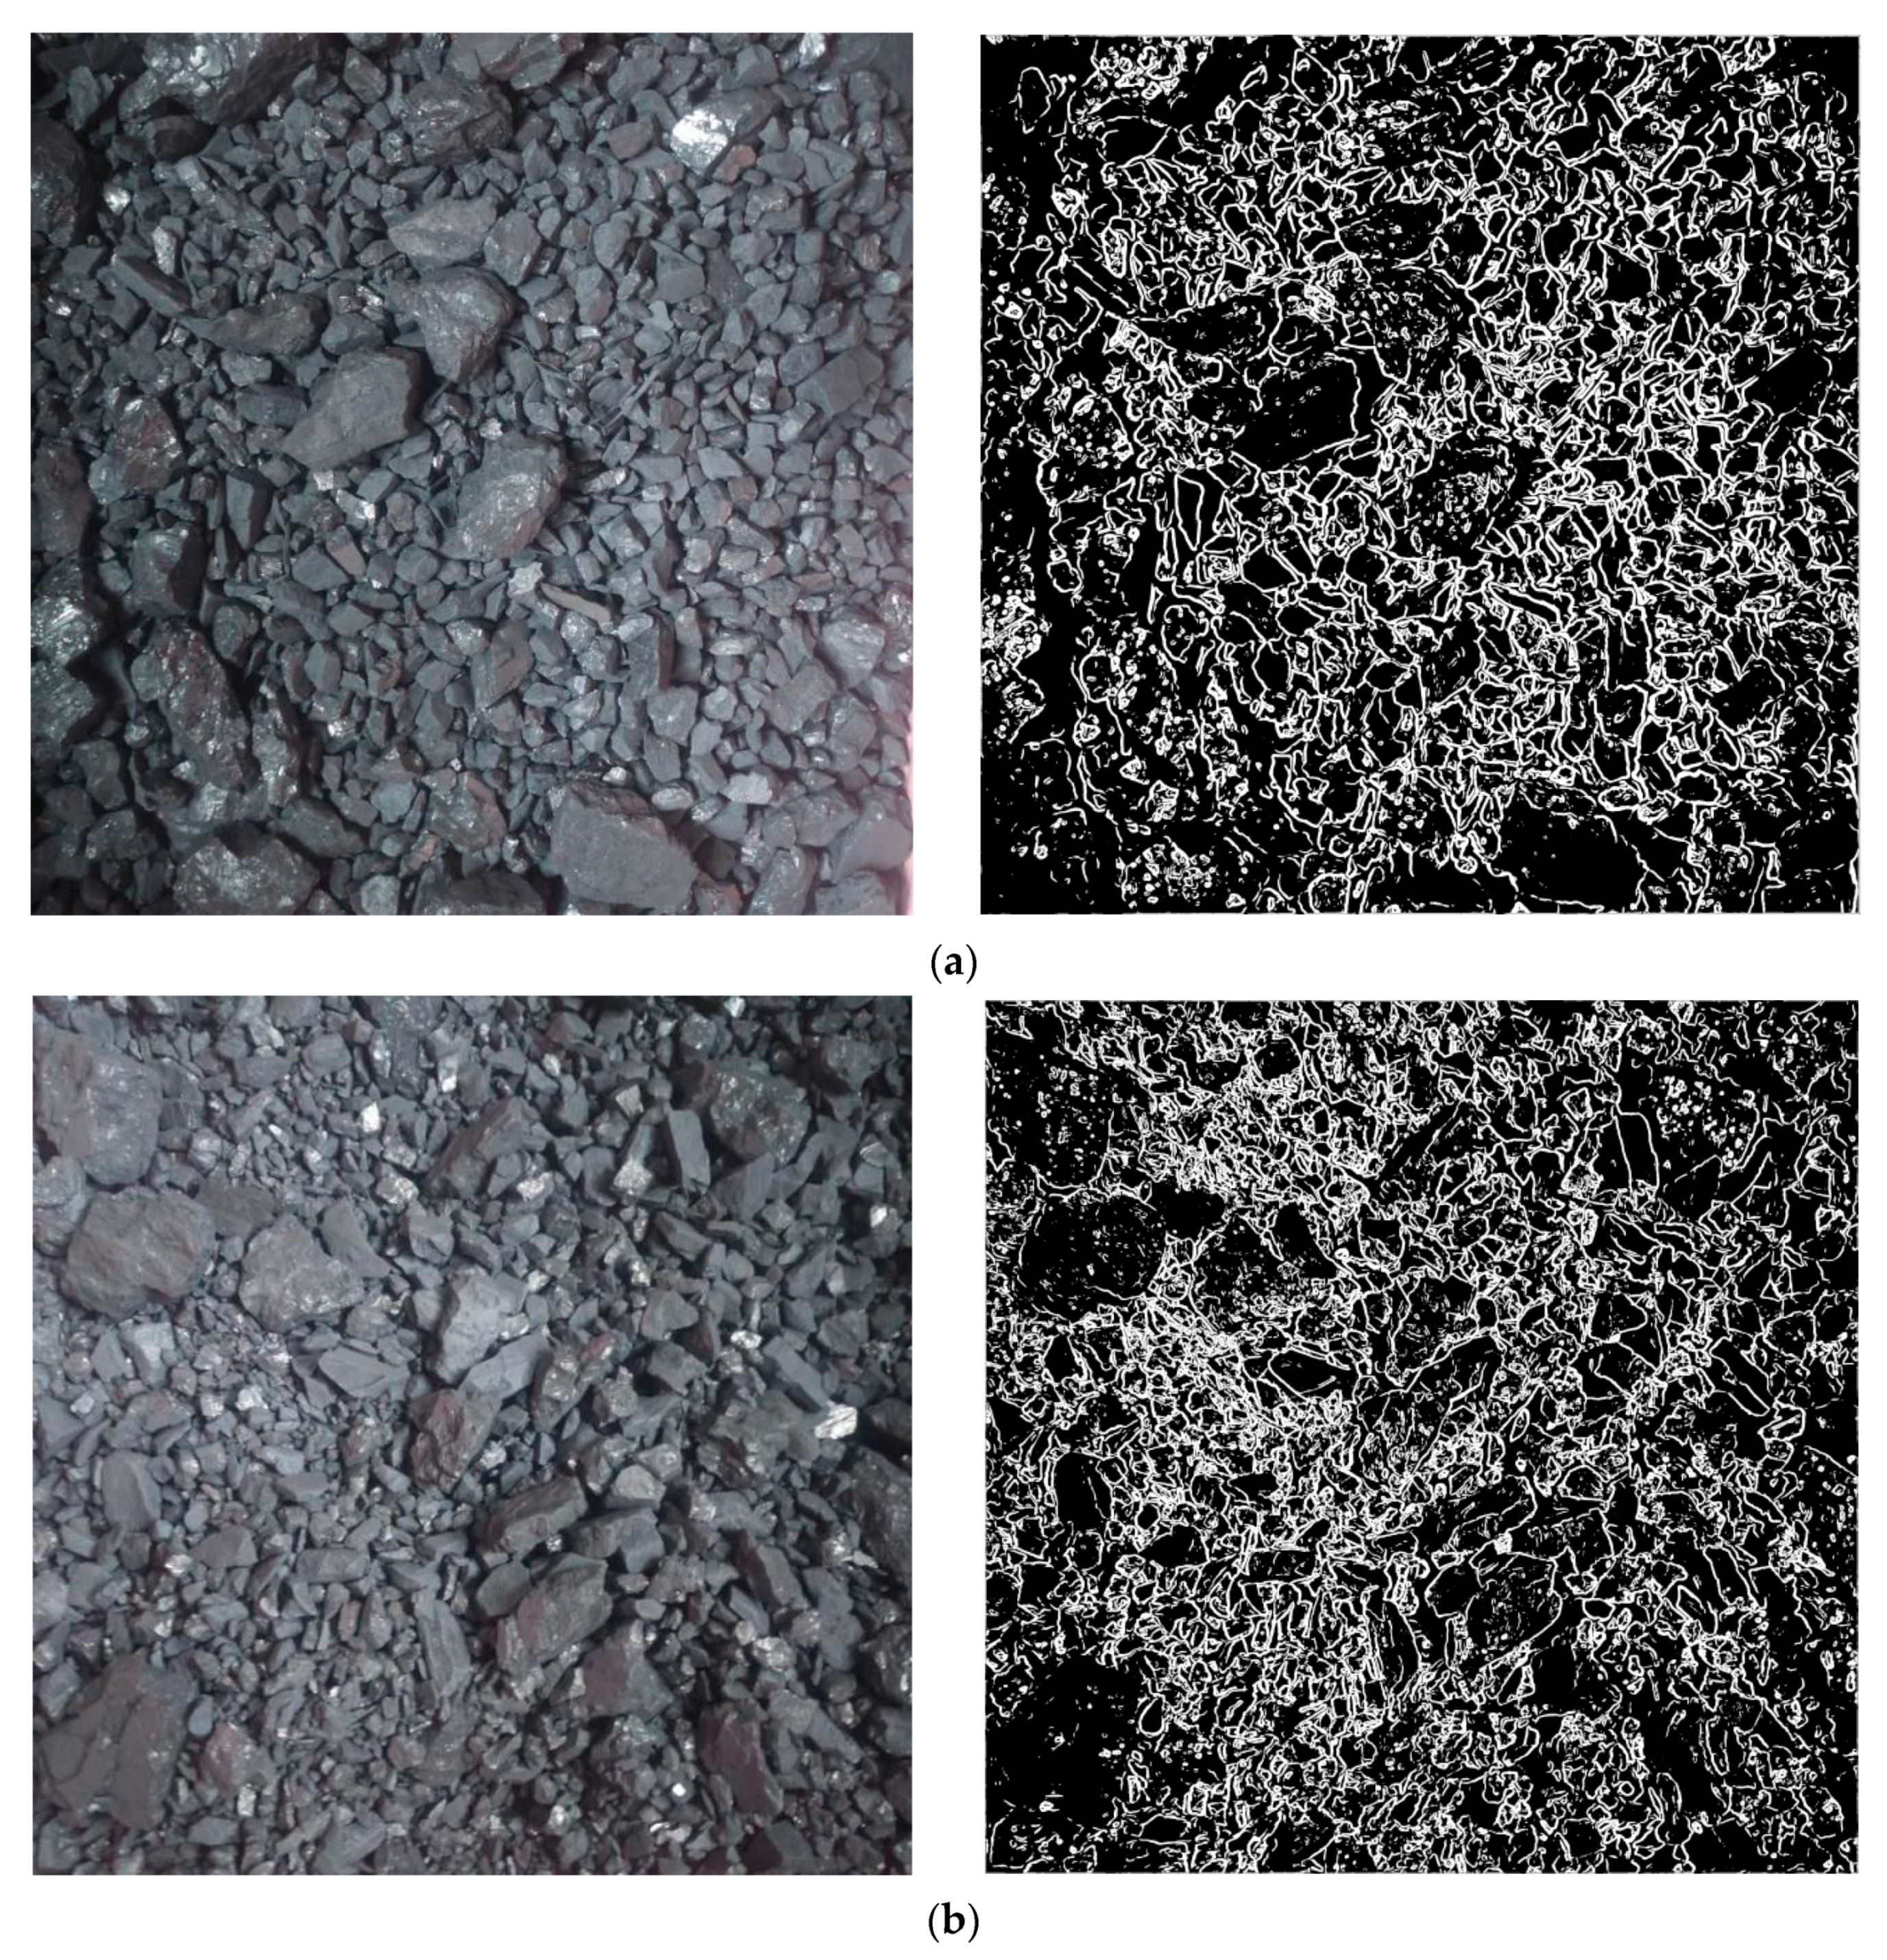
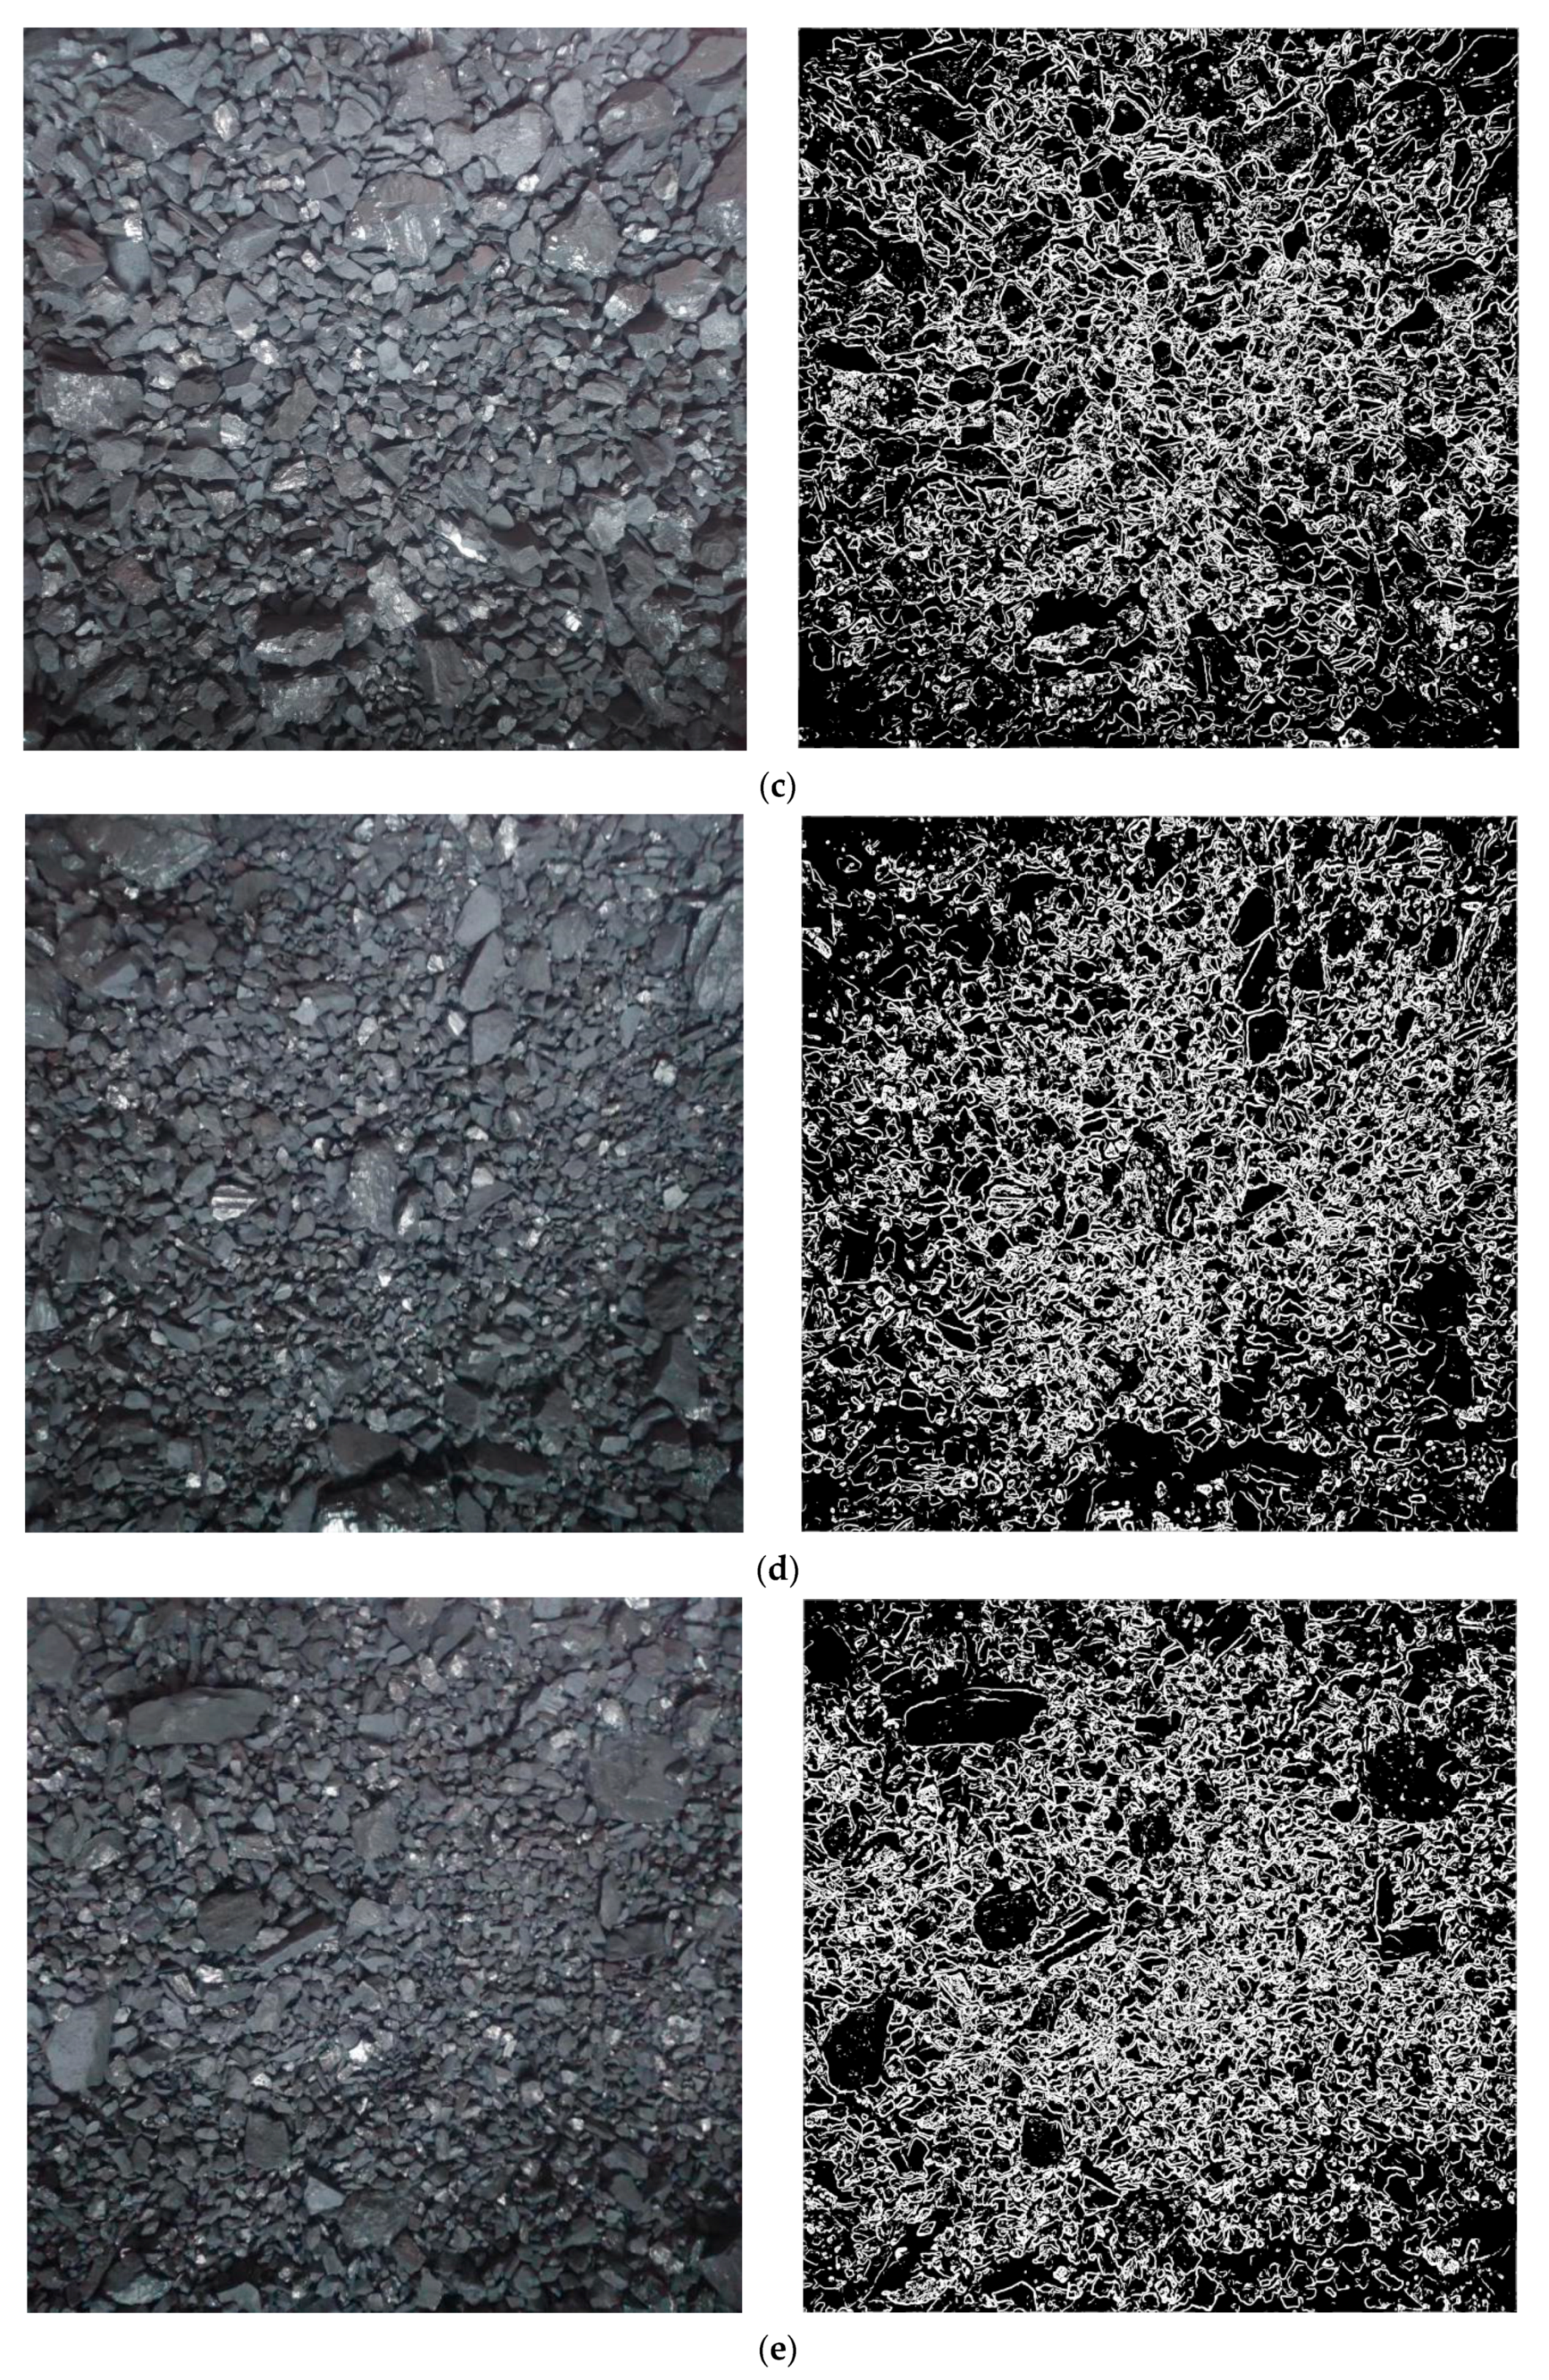
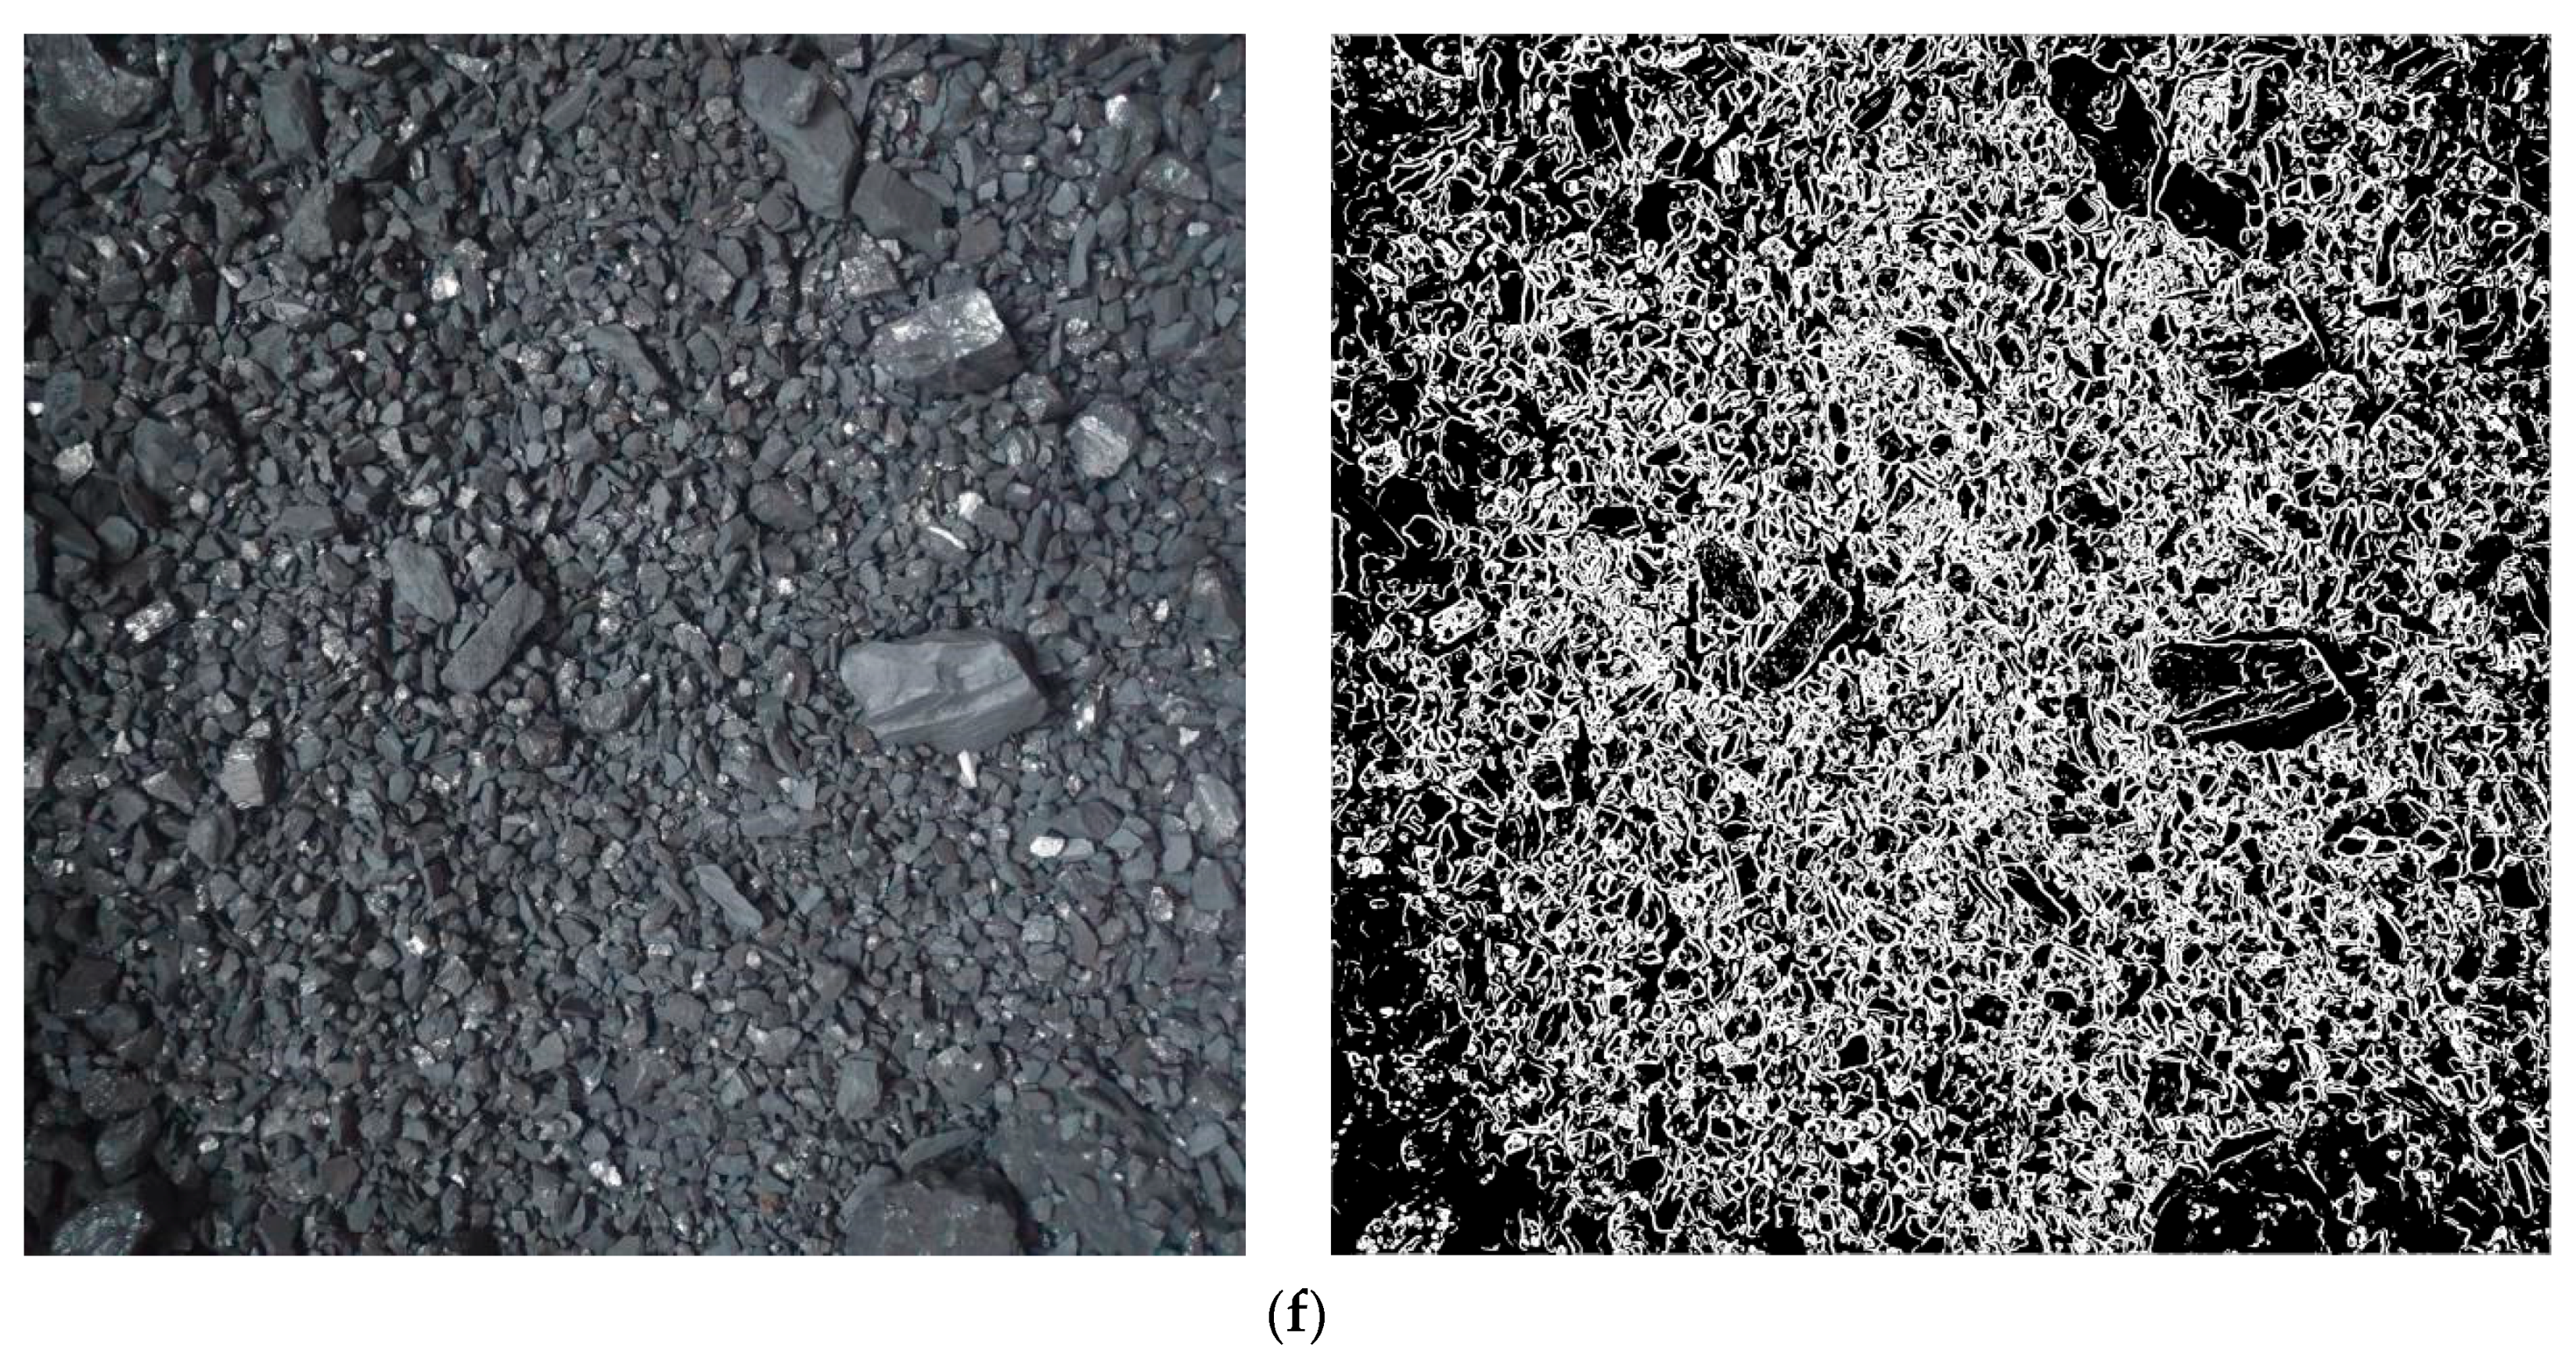
Figure 9 demonstrates images of coal under different screening efficiencies and edge images after image processing. As the screening efficiency increases, the proportion of fine particles in the sieve decreases, while the proportion of large particles increases dramatically. The form of the edge image is that the proportion of large-particle coal is increasing. Additionally, the complexity of the graphic outline is simplified. Because the fractal dimension is the same at different scales or different heights, the fractal dimension changes with the complexity of the edge image. Hence, the fractal dimension can be adopted as an indicator of coal particle size distribution and can be employed as a measure of screening efficiency on the side. Due to coal accumulation, varying light-source conditions, the uneven height of coal on the conveyor belt, and other factors, it is challenging to measure the precise particle size distribution of coal on site using the method described in the literature. In addition, in the field situation, the measurement of the particle size distribution is of little significance, but it is significant to detect the working status and efficiency of the vibrating screen in real time.
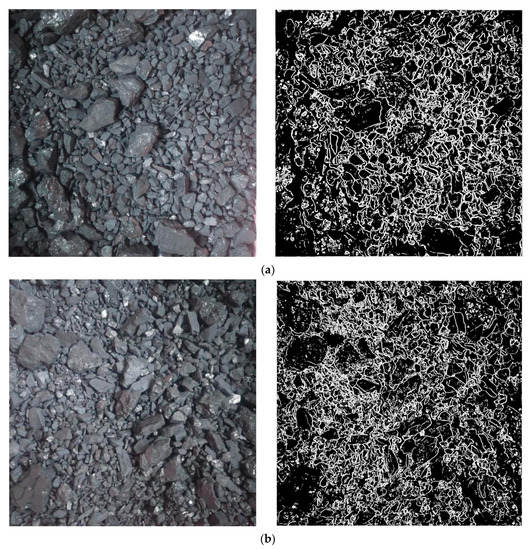
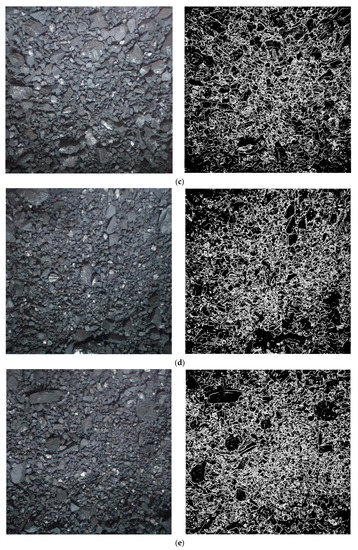
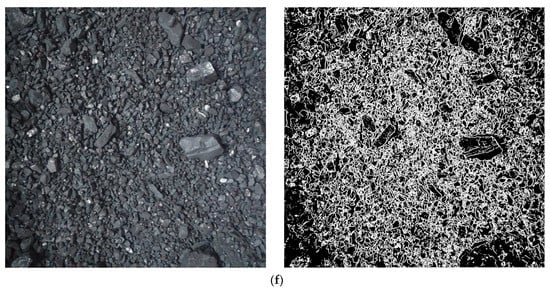
Figure 9.
Different coal-edge image under different coal-screening efficiencies. (a) 100% screening efficiency; (b) 80% screening efficiency; (c) 60% screening efficiency; (d) 40% screening efficiency; (e) 20% screening efficiency; (f) coal image before screening.
For the weighted mean of the fractal dimension, multiple groups of coal-edge images are produced. Figure 10 indicates that as the screening efficiency increases, the fractal dimension of coal gradually decreases in a similar linear manner, and the slope ratio at the beginning and the end of the curve is lower than the slope in the middle part. In general, the fractal dimension of a two-dimensional edge image is between 2 and 3, so when it approaches 2 or 3, the curve will become smooth. When the fractal dimension is closer to the median of 2 and 3, it will be simpler to distinguish. Different fractal dimensions of the edge image are caused by the presence of small particles on the sieve following sieving. To a certain extent, the fractal dimension can show the proportion of small particles on the sieve. The larger the fractal dimension is, the smaller the particles are on the sieve. When the screening efficiency reaches 100%, the fractal dimension becomes 2.5454. With the decrease in the screening efficiency, the nearly linear change in the fractal dimension reaches 2.6223. Due to the fact that the fractal dimension decreases monotonically with the screening efficiency, which is indicative of good discrimination, it is possible to predict the screening efficiency based on the coal-edge fractal dimension. In on-site production, the particle size distribution after crushing the same production line is roughly uniform. Whilst the on-site particle size distribution does not agree with the experiment, since the coal PSD is similar after crushing, the mapping relationship between the fractal dimension and the sieving efficiency can be determined through the preliminary calibration, and finally achieved through the real-time detection of the coal sieving.
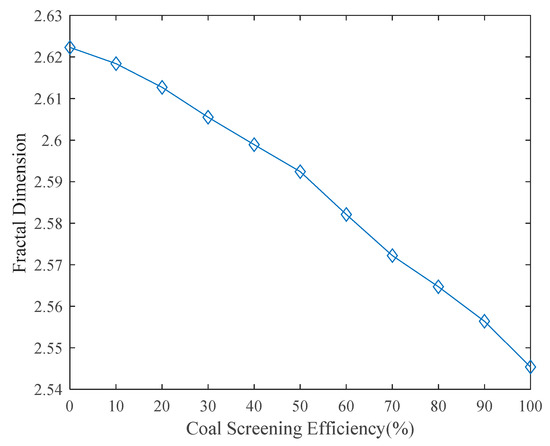
Figure 10.
Relation of coal-screening efficiency and fractal dimension for coal-edge images.
5. Conclusions
An algorithm was developed for extracting the edge image of coal particles. We found that the fractal behaviour exists in the edge image of coal particles by comparing the fractal dimension of the coal-edge image from different heights. Ulteriorly, we made clear that the smaller the particle size of coal, the higher the fractal dimension of the coal image by analysing the fractal dimension of coal particles with different particle size compositions. Therefore, fractal dimensions can be employed to detect the screening efficiency of the same production line. Along with a fractal method to describe coal-screening efficiency and coal PSD indirectly based on image processing is proposed. The results proved that the fractal dimension of the coal-edge image becomes smaller with the increase in the screening efficiency; the maximum and minimum fractal dimensions are 2.6223 and 2.5454. Therefore, our detection method greatly reduces the difficulty of real-time screening efficiency detection and opens a new idea. Although we have developed an image-processing technology using fractal dimension to measure screening efficiency, the reliability of this method still depends on more experiments to verify, and this technology cannot directly obtain the PSD of coal.
In the future, it is worthwhile to investigate the relationship between fractal dimension and coal particle size distribution (PSD), and this method has the potential to be applied to the screening of other ores.
Author Contributions
Data curation, D.H.; Formal analysis, D.H.; Funding acquisition, C.L.; Methodology, D.H. and C.L.; Resources, D.H.; Software, D.H.; Writing—original draft, D.H.; Writing—review & editing, D.H. All authors have read and agreed to the published version of the manuscript.
Funding
This research was funded by the National Natural Science Foundation of China [51775544] and Xuzhou XCMG Mining Machinery CO.LTD [2020050049-07].
Institutional Review Board Statement
Not applicable.
Informed Consent Statement
Not applicable.
Data Availability Statement
Data are contained within the article.
Conflicts of Interest
The authors declare no conflict of interest.
References
- Kopacz, M.; Kryzia, D.; Kryzia, K. Assessment of sustainable development of hard coal mining industry in Poland with use of bootstrap sampling and copula-based Ponte Carlo simulation. J. Clean. Prod. 2017, 159, 359–373. [Google Scholar] [CrossRef]
- 2019 Statistical Bulletin of the National Economic and Social Development of the People’s Republic of China, National Bureau of Statistics of China. Available online: https://www.stats.gov.cn/tjsj/zxfb/202002/t20200228_1728913.html (accessed on 28 February 2020).
- Liao, C.W.; Tarng, Y.S. On-line automatic optical inspection system for coarse particle size distribution. Powder Technol. 2009, 189, 508–513. [Google Scholar] [CrossRef]
- Igathinathane, C.; Pordesimo, L.O.; Columbus, E.P.; Batchelor, W.D.; Sokhansanj, S. Sieveless particle size distribution analysis of particulate materials through computer vision. Comput. Electron. Agric. 2009, 66, 147–158. [Google Scholar] [CrossRef]
- Ulusoy, U.; Igathinathane, C. Particle size distribution modeling of milled coals by dynamic image analysis and mechanical sieving. Fuel Processing Technol. 2016, 143, 100–109. [Google Scholar] [CrossRef]
- Zhang, Z.L.; Yang, J.G. Online analysis of coal ash content on a moving conveyor belt by machine vision. Int. J. Coal Prep. Util. 2017, 37, 100–111. [Google Scholar] [CrossRef]
- Abhik, M.; Debashish, C.; Kousik, B.; Arpan, H. Development of a mass model in estimating weight-wise particle size distribution using digital image processing. Int. J. Min. Sci. Technol. 2017, 27, 435–443. [Google Scholar]
- Zhang, Z.L.; Yang, J.G.; Ding, L.H.; Zhao, Y.M. An improved estimation of coal particle mass using image analysis. Powder Technol. 2012, 229, 178–184. [Google Scholar] [CrossRef]
- Engin, I.C.; Maerz, N.H. Size distribution analysis of aggregates using lidar scan data and an alternate algorithm. Measurement 2019, 143, 136–143. [Google Scholar] [CrossRef]
- Liu, H.Y.; Sun, Z.Y.; Li, W.; Huyan, J.; Guo, M.; Hao, X.L. Evaluating angularity of coarse aggregates using the virtual cutting method based on 3D point cloud images. IEEE Access 2020, 8, 143241–143255. [Google Scholar] [CrossRef]
- Yang, J.H.; Chen, S.J. An online detection system for aggregate sizes and shapes based on digital image processing. Mineral. Petrol. 2017, 111, 135–144. [Google Scholar] [CrossRef]
- Liao, C.W.; Yu, J.H.; Tarng, Y.S. On-line full scan inspection of particle size and shape using digital image processing. Particuology 2010, 8, 286–292. [Google Scholar] [CrossRef]
- Patil, D.R.; Jadhav, S.D.; Mungale, A.; Kalekar, A.S.; Dubal, D.P. Fractal granular BiVO4 microspheres as high performance anode material for Li-ion battery. Mater. Lett. 2019, 252, 235–238. [Google Scholar] [CrossRef]
- Yin, T.T.; Liu, D.M.; Cai, Y.D.; Zhou, Y.F.; Yao, Y.B. Size distribution and fractal characteristics of coal pores through nuclear magnetic resonance cryoporometry. Energy Fuels 2017, 31, 7746–7757. [Google Scholar] [CrossRef] [Green Version]
- Chu, H.Q.; Ren, F.; Zheng, Z.M.; Gu, M.Y. Study on granularity distribution of powder by fractal models. Fractals-Complex Geom. Patterns Scaling Nat. Soc. 2017, 25, 1740009. [Google Scholar] [CrossRef] [Green Version]
- Pedrycz, W.; Bargiela, A. Fuzzy fractal dimensions and fuzzy modeling. Inf. Sci. 2003, 153, 199–216. [Google Scholar] [CrossRef]
- Sarkar, N.; Chaudhuri, B.B. An efficient differential box-counting approach to compute fractal dimension of image. IEEE Trans. Syst. Man Cybern. 1994, 24, 115–120. [Google Scholar] [CrossRef] [Green Version]
- Donoho, D.L. De-noising by Soft-Thresholding. IEEE Trans. Inf. Theory 1995, 42, 613–627. [Google Scholar] [CrossRef] [Green Version]
- Donoho, D.L.; Johnstone, I.M. Ideal Spatial Adaptation by Wavelet Shrinkage. Biometrika 1994, 88, 425–455. [Google Scholar] [CrossRef]
- Donoho, D.L.; Johnstone, I.M. Ideal denoising in an orthonormal basis chosen from a library of bases. C. R. Acad. Sci. 1994, 319, 1317–1322. [Google Scholar]
- Kirsch, R.A. Computer determination of the constituent structure of biological images. Comput. Biomed. Res. 1971, 4, 315–328. [Google Scholar] [CrossRef]
- Jiang, H.S.; Qiao, J.P.; Zhou, Z.G.; Zhao, Y.M.; Yang, Y.Z.; Duan, C.L.; Luo, Z.F.; Cai, L.H.; Wang, S.; Pan, M. Time evolution of kinematic characteristics of variable-amplitude equal-thickness screen and material distribution during screening process. Powder Technol. 2018, 336, 350–359. [Google Scholar] [CrossRef]
- Wang, W.N.; Duan, C.L.; Jiang, H.S.; Yu, S.J.; Zhou, Z.G.; Qiao, J.P.; Zhao, Y.M.; Pan, M. Mechanism of overcoming plugging and optimization of parameters for rigid-flexible coupled elastic screening of moist fine coal. Powder Technol. 2020, 376, 113–125. [Google Scholar] [CrossRef]


Publisher’s Note: MDPI stays neutral with regard to jurisdictional claims in published maps and institutional affiliations. |
© 2022 by the authors. Licensee MDPI, Basel, Switzerland. This article is an open access article distributed under the terms and conditions of the Creative Commons Attribution (CC BY) license (https://creativecommons.org/licenses/by/4.0/).