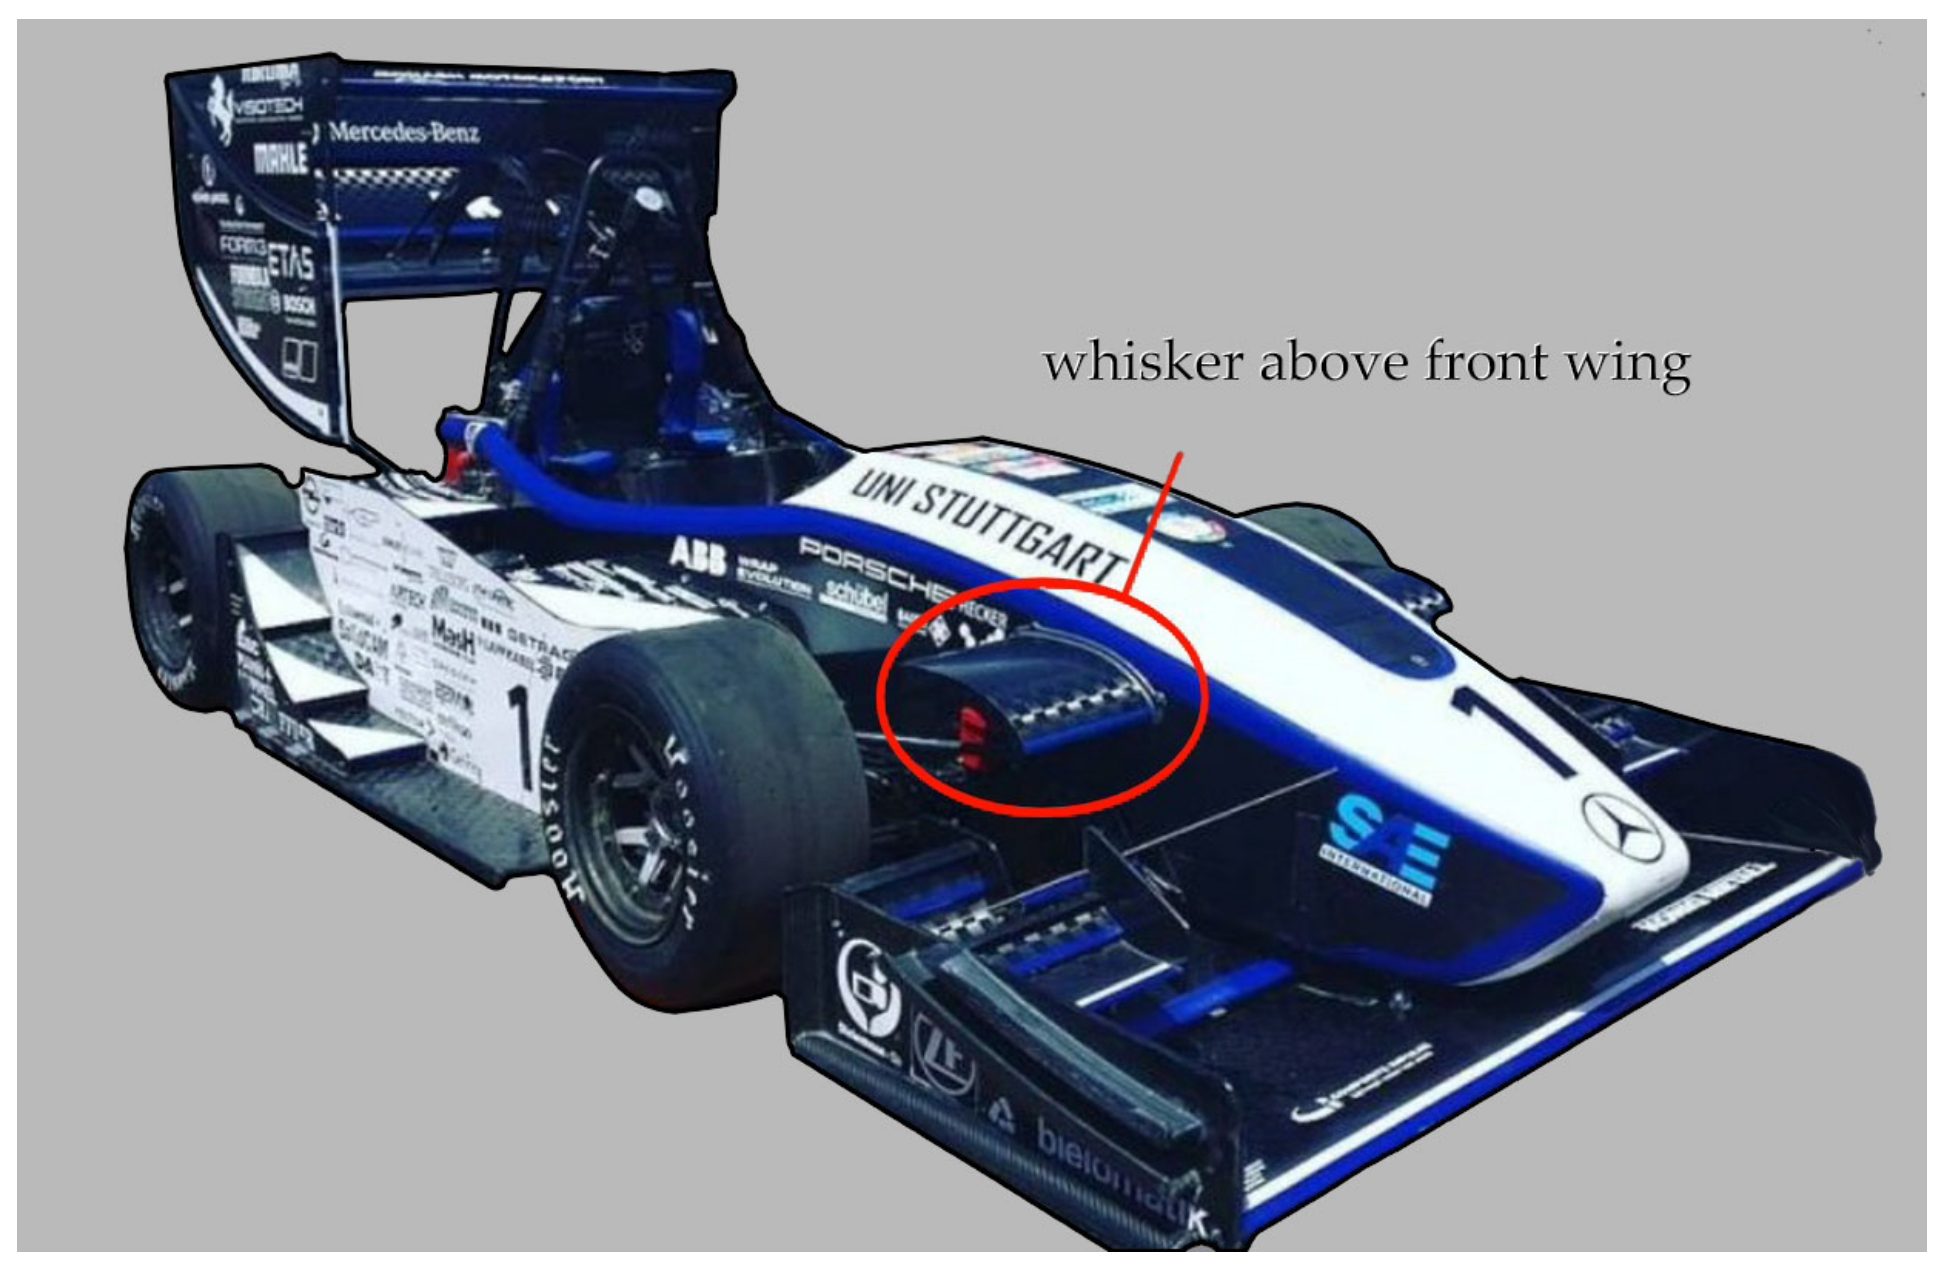
Article

Efficiency Enhancement Design Approach in the Side Wing of a FSAE Car Utilizing a Shutter-Like Fairing Structure

College of Automotive Engineering, Jilin University, Changchun 519041, China
*
Author to whom correspondence should be addressed.
Appl. Sci. 2022, 12(13), 6552; https://doi.org/10.3390/app12136552
Submission received: 16 June 2022 / Revised: 25 June 2022 / Accepted: 27 June 2022 / Published: 28 June 2022
(This article belongs to the Section Mechanical Engineering)

Abstract

:

Featured Application

As a new aerodynamic kit, the notion of a Shutter-like fairing structure can be used in various types of FSAE car with a side wing to improve aerodynamic efficiency of the side wing.

Abstract

Aerodynamical design is one of the critical technologies in race car engineering, and favorable race car aerodynamics is supposed to provide sufficient negative lift force and keep the center of pressure in the vicinity of center of mass. Taking the Formula Society of Automotive Engineers (FSAE) cars as an example, side wing structure is frequently adopted for better grip in the mid-back of short wheelbase, open wheel race cars. This research designs a shutter-like fairing structure and utilizes it to weaken the vorticity and reinforce the pressure of side wing flow field. The sensitivity of side wing aerodynamic efficiency to shutters’ key parameters is analyzed, and optimized shutters’ key parameters for a prototype FSAE race car are obtained through computational fluid dynamics simulations. Results indicate that over 10% enhancement in side wing aerodynamic efficiency can be achieved by applying optimized shutters.

1. Introduction

Aerodynamical design is one of the key parts in the development of racing cars. Its main objectives include providing sufficient negative lift force for racing cars, reducing aerodynamic drag as much as possible, and maintaining a reasonable center of pressure (CoP).
Diffuser is the main mechanism to provide negative lift force for high-level formula racing cars with long wheelbase and cars with closed wheel arches. Taking Formula One racing cars as an example, the baseplate and diffuser contribute to approximately 50% of the negative lift to the whole vehicle. The acting point of the aerodynamic force of the diffuser is close to the mass center of the whole vehicle, which helps the car to obtain a more favorable CoP. However, the structures, such as tire and front wing, tend to result in unpalatable jet or turbulence for the short wheelbase open wheel race cars represented by formula SAE (FSAE) cars, thereby causing an adverse impact on the performance of diffuser [1]. Therefore, the short wheelbase open wheel race cars tend to use side wing structure to provide negative lift force for the mid-back of the vehicle.
The performance of side wing depends on the pressure difference between its upper and lower surfaces. Although the airflow on the lower surface is usually less blocked, the upwash of the airflow by the front wing and the turbulence of the airflow through the front suspension system often make the working conditions above side wing extremely bad, and the flow field above side wing presents the characteristics of low pressure and turbulence. Therefore, combining the turbulence in front of side wing and increasing the pressure on the upper surface of side wing are the first choices to improve side wing efficiency.
A whisker is a type of positive lift-producing device that is widely used in FSAE car design. It is usually a pair of upright airfoils without endplates installed behind or above the front wing and controls the tire wake by generating wingtip vortex. Thus, the upwash of front wing can obtain downward kinetic energy and out-shuffle to enhance the performance of side wing and mainly improve the rear wing. CoP can be adjusted backward to accommodate a more radical front wing design. Figure 1 demonstrates the first pair of whiskers used on the FSAE car of Rennteam Uni Stuttgart.
A whisker can be arranged in various positions: a larger wingtip vortex can be produced if installed above the nosecone, better protection can be achieved if it is installed in front of the front suspension, and better comprehensive performance can be attained if it is installed above the front suspension. Different installing positions are designed for different functions.
Designs, such as a whisker, mainly focus on global optimization. However, few studies are conducted on the improvement of side wing. Thus, devices specifically designed for side wing flow field, such as the shutter-like fairing structure in this study, are needed to improve the working condition of side wing.
Louvres widely used in F1 and other high-speed racing cars are different from shutters mentioned in this study, and their mechanisms are extremely different. The former uses the high pressure in front of it and the airfoil fins to generate vortex opposite to that produced by rear wing to reduce the induced drag of the rear wing and increase the negative lift in a small range. The latter combines the turbulent flow and increases the pressure behind. The most obvious distinction between the two devices is that the high- and low-pressure zones are in the inversed position of the other. Figure 2 shows the TUfast racing car EB018, which is equipped with louvres rather than a shutter-like fairing structure, and it is also the first FSAE car to do so.
The shutter-like fairing structure was first used for rotating air supply machinery, such as fans and air conditioners. Its main function is air flow guidance. This structure is used to send the high-energy turbulent flow generated by the impeller to the required direction and alleviate the adverse influence of low-pressure turbulence to a certain extent. However, it has not been applied in FSAE racing.
This study focuses on the shutter-like fairing structure, as shown in Figure 3, which is installed between the front wheel and side wing, as shown in Figure 4. The key parameters of shutters are optimized through computational fluid dynamics (CFD) simulation to optimize the side wing flow field, and the optimization of side wing efficiency on the premise of relatively small impact on the air flow of other aerodynamic kits is achieved.

2. Analysis of Side Wing Flow Field

The main sources of negative lift for most racing cars are aerodynamic kits, such as front wing and rear wing, which can provide up to 70–80% of the overall negative lift [2]. However, the penalty of the huge negative lift of front and rear wings is due to the relatively long longitudinal distance between them and the center of mass, and any imbalance of front and rear negative lift produces serious pitching moment. Therefore, the longitudinal position of the front and rear wings is often subject to the demand of balancing pitching moment.
The front wing is usually designed to control air flow to out-shuffle for enabling the rear wing to obtain more undisturbed air flow. However, out-shuffled air flow will “overhead” the flow field of side wing and place the side wing in the low-pressure turbulent flow field. As shown in Figure 5a, the yellow-green volume represents the space where the surface pressure is less than 0 (PA), and the blue-green area in Figure 5b denotes the area where the vorticity is between 75 and 150 (/s). The flow is more chaotic and difficult to harness compared with an undisturbed case. The side wing is placed in this low-pressure turbulent flow field.
The low-pressure turbulent flow field is a turbulent region with low pressure compared with the reference pressure at infinite distance and significantly increased vorticity compared with undisturbed state. It is used for qualitative description without strict threshold definition. The low-pressure turbulent flow field will make a huge negative impact on the performance of any aerodynamic kits exposed to it. This negative effect can be suppressed by increasing the air pressure or reducing the vorticity. In the research of Qiong Nan et al. [3], they found that the diffuser efficiency can be greatly improved by increasing the number of channels and restraining the bottom cross flow.
As shown in the surface pressure of wings in Figure 5a, pressure on the upper surface of side wing is significantly lower than that of the front wing and rear wing. In contrast, the negative pressure area on the lower surface of side wing is still an important source of the negative lift, although it is lower than that of the front and rear.
At present, three technical routes are used for racing cars to increase the negative lift: negative lift wing technology, diffuser technology, and ground effect technology [4]. The side wing or sidepod can install a negative lift wing and can effectively increase the underbody area. Thus, reasonable design of the bottom shape can achieve better ground effect. Lightweight diffusers can be installed on side wings to deliver negative pressure to the rear wheels for reducing the aerodynamic drag of the rear wheels. Therefore, the side wing can make the front and rear of the whole vehicle more compact and can provide considerable negative lift with minimal cost of aerodynamic pitching moment.
As shown in Figure 6, CFD simulation is performed on a prototype car after canceling the front wing and front wheel. Under the incoming flow of 15 m/s, the negative lift of its side wing reaches −253.43 N. More simulation boundary conditions can be found in Section 4 “Establishment of CFD Model”.
With other simulation conditions remain unchanged in the low-pressure turbulent flow field behind the front wing, front wheel, and suspension linkages, the effective negative lift of side wing is only −88.627 N, which is relatively different from the predicted result, and is only 34.5% of the ideal situation without front wing and front wheel. The data of grid sensitivity analysis can be found in Section 4.4.

3. Mechanism of the Shutter-like Fairing Structure

The shutter-like fairing structure (shutters) is an aerodynamic device with parallel flakes (fins) at certain intervals and is usually used for turbulence reduction and airflow guidance. The fins of shutters can block the airflow perpendicular to the chord direction but allow for the spanwise airflow to diffuse, so that the airflow that passed the shutters will have a certain directionality. Shutters are placed between the front suspension and side wing to sort the turbulence in front of the side wing and increase the pressure above it.

3.1. Shutters’ Key Parameters

The key parameters of shutters include the fin shape (airfoil, flat plate, herringbone, bending plate, etc. [5,6,7,8,9]), angle of attack of fin, maximum thickness, chord length of fin, average interval, and blocking ratio [10]. The relevant parameters are shown in Figure 7.
In Figure 7, the free flow coming from the left side is denoted by u , α represents the fin’s angle of attack, δ is the maximum thickness of fin, L indicates the chord length of fin, Δ symbolizes the average interval, and n is the number of fins (not shown in Figure 7). The blocking ratio p   is used to describe the proportion of space taken by the fins, which is expressed as Equation (1).
p = δ cos α Δ × 100 % .

3.2. Shutters’ Characteristics and Working Mechanism

Shutters are characterized by their ability to guide flow and reduce flow dimension, which is similar to the mechanism of a polarizer. The air flow passing through the shutters shows a strong tendency of vorticity reduction and pressure enhancement due to these characteristics. As shown in Figure 8, the finite span airfoil induces significant wingtip vortices under the incoming flow velocity of 15 m/s. The vorticity decreases significantly, the air flow pressure increases, and the flow field changes from a low-pressure turbulent one to a favorable one after passing through the airfoil cross-section fins of shutters shown in Figure 7.
Fins on two ends of the shutters and fins in the center area are not equivalent in function. The ideal number of fins is n = . Although the fins in the center are cross-sectioned airfoils, they mainly play a guiding role due to the influence of adjacent fins. On the contrary, fins at the top and bottom ends show the characteristics of a single airfoil, resulting in unfavorable positive lift, which can completely offset the improvement of side wing efficiency. The addition of top and bottom endplates effectively reduces the adverse effects caused by fins on the ends.
At a certain incoming flow velocity, the performance of shutters deteriorates if the distance between fins is far, that is, the blocking ratio p is less than a certain threshold. The threshold is also different in accordance with the cross-sectional shape of fins because the interaction between the fins disappears, and a single fin is exposed in free flow. When the arrangement of fins is extremely dense and p is larger than a certain threshold, the blocking effect decreases sharply, resulting in the degradation of shutters’ performance. Therefore, the blocking ratio p has an optimal value under a given free flow velocity.

4. Establishment of CFD Model

Commercial code Star CCM+ is utilized in all simulation cases below, and parameter settings are description for Star CCM+.

4.1. Governing Equation and Turbulence Model

The average speed of a FSAE racing car is about 50 km/h, and 15 m/s velocity for free flow is taken as a calculation condition, which is less than Mach 0.3. Therefore, a 3D, isothermal, and incompressible viscous flow model under low Reynolds number is adopted. The governing equation used in the calculation is the homogenized turbulent Navier–Stokes equation.
· ρ v ¯ = 0 · ρ v ¯ v ¯ = f b · p ¯ I + · T + T t ,
where ρ is the air density, v ¯ denotes the time average speed, f b is the volume force per unit mass, p ¯ is the time averaged pressure, I   represents a unit tensor, and T t is the Reynolds stress term, which is unknown; thus, T t should be further modeled.
If merely consider the agreement between CFD simulation and actual wind tunnel test results, the standard k–ω turbulence model (SKO) is the best choice [11]. However, a realizable k–ε two-layer turbulence model (RKE 2L) is selected to both ensure the accuracy of calculation and to save computing resources, since RKE 2L has better convergence speed and relatively high accuracy even compared with SKO.
The model of T t is called turbulence model, and in RKE 2L, the transport equation of turbulent kinetic energy k in steady state is
· ρ k v ¯ = · μ + μ t σ k k + P k ρ ε ε 0 + S k ,
and the transport equation of Dissipation rate ε is
· ρ ε v ¯ = · μ + μ t σ ε ε + 1 T e C ε 1 P ε C ε 2 f 2 ρ ε T e ε 0 T 0 + S ε ,  
where   μ is the dynamic viscosity; μ T is the turbulent viscosity; σ k , σ ε , C ε 1 , and C ε 2 are coefficients that could be modified according to different fluid media; P k and P ε are generative items; f 2 is the damping function ;   s k and S ε are custom source items; ε 0 represents ambient turbulence value in the custom source items; T e is the large eddy time scale; and t 0 is specific time scale correspond to ε 0 .

4.2. Establishment and Simplification of Computer-Aided Design (CAD) Model

The initial CAD model for CFD simulation adopts a prototype car, as shown in Figure 9a. Considering that this study focuses on the optimization of side wing flow field, the rear suspension linkage behind the side wing has minimal influence on it, the rear suspension is simplified, and the front suspension is retained, as shown in Figure 9b. The driver and helmet are simplified, the rim is transformed into a solid cylinder, the appendices fixed on the main ring are omitted, and the other details related to aerodynamics are retained as much as possible.

4.3. Mesh Operation of CFD Model

For the selection of computational domain, the method of establishing a virtual wind tunnel is referred to [12]. A 25 m × 5 m × 5 m virtual wind tunnel is established by setting the vehicle length (≈7 m) in front of the vehicle and the vehicle length (≈18 m) behind the vehicle to 3 and 8 times, respectively. On the premise of saving computing resources, the selection of computational domain is convenient for later verification in a real wind tunnel.
The meshing method affects the simulation accuracy and the convergence of the calculation results. All examples in this study uniformly use a trimmed mesher because its time consumption is shorter, and the convergence speed of simulation utilizing a trimmed mesh is faster. The average convergence is about 1.5 times faster than that of tetrahedral mesh to maintain the same accuracy in results, and the number of meshes can be reduced to less than 3 times that of the latter [13]. In addition to the detailed densification of side wing flow field, the body part and vehicle wake zone are roughly densified. The growth rate of the volume mesh is set to moderate to make the grid size transition even, and the final effect is shown in Figure 10.
Mesh operation and other simulation steps are fixed in the form of macro programs to avoid the error caused by carelessness-induced setting deviations, save operation time in the user interface, realize automatic batch simulation, and provide the possibility to explore more designs.

4.4. Grid Sensitivity Analysis

The sensitivity analysis results are obtained by simulation to determine the appropriate overall size of mesh, as demonstrated in Table 1.
With the mesh refinement, the accuracy of physical quantity solution increases, but the convergence speed decreases. When the mesh base size is greater than 0.75, an error of float point overflow starts to occur due to poor volume mesh quality in narrow spaces, and the physical quantities fluctuate greatly. On the flip side, after the basic size of the grid is reduced to 0.25 m, the number of convergence steps exceeds 2000 steps, which actually reaches more than 3000 steps, and the time consumption increases geometrically (after 3055 steps, the fluctuation of lift of vehicle with in 100 iterations starts to be smaller than 2%, and before 3055 steps, other judging values including side wing lift and side wing drag have already reached the same convergence standard of an 100 steps fluctuation smaller than 2%). Therefore, 0.5 m is selected as the basic size of the grid in balance of accuracy and convergence speed.

4.5. Convergence of Results

Each iteration tends to converge in about 700 steps. All examples take a maximum of 1000 steps as the stop criterion to prevent accidents. Among all results, the fluctuation in the last 100 steps is less than 0.1 N (accounting for 0.3% of the case without implementing shutters), which is considered to be convergent. Figure 11 shows the iteration results of one group of simulation, where the negative lift of the side wing only (red) and the overall negative lift of the side wing plus shutters (green) become stable near a certain value and no longer fluctuate.

5. Design of Shutters Based on Side Wing Efficiency

The original benchmarking data of shutter geometry optimization are obtained in the grid sensitivity analysis of Section 4.4 under the basic size of 0.5 m. Specifically, the original negative lift of side wing is −88.6270 N, the original drag is 28.9974 N, and the lift of whole vehicle is −462.26 N. In the simulation, the evaluation is mainly based on the optimization objectives of side wing efficiency indexes, including side wing lift, side wing drag, overall lift, and overall drag.
Since we are focusing on the aerodynamic efficiency enhancement as well as negative lift reinforcement, we take the parameters of L / D   (lift of side wing divided by drag of side wing) and side wing lift as two objectives to optimize. Therefore, a performance index I p e r f m , i is defined in Equation (5) in directing the process of optimization.
I p e r f m ,   i = 1 2 L i D i L 0 D 0 + L i L 0 1 × 100 % ,
where I p e r f m , i is the performance index for each part. Subscript 0 indicates the value from prototype car; thus, L / D and L 0 / D 0   are the side wing lift divided by side wing drag of each simulation case and prototype car simulation, respectively (see data in Table 1, line “base size = 0.5 m”). Besides, taking the practically tantamount importance of lift value and L / D , weights of both parameters are set as 1 / 2 .
Moreover, to considerate both enhancement on side wing alone and effect on side wing + shutters as a whole, a performance index I p e r f m used in optimization is defined in Equation (6).
I p e r f m = I p e r f m , s + I p e r f m , a 2 ,
where I p e r f m , s means performance index of side wing, while I p e r f m , a means that of side wing and shutters as a whole. We simply choose an equal importance 1 / 2 for both indexes.

5.1. Optimization of Shutters’ Geometry

5.1.1. Fin Shape

The commonly used fins in aerodynamics are airfoil fins. Considering the chaotic flow field of side wing, an airfoil may not fully perform its role, so a simplified airfoil (flat plate type and bending plate type) is considered. Four representative fin shapes are preliminarily selected: bending plate, flat airfoil (BABIC), flat plate, and thick airfoil (ch10).
BABIC is chosen as a representative of flat airfoil since it is one of the usual airfoils used in low-speed glider, and has the trait of curved middle line, which allows for a smoother diversion of air flow. Ch10 is selected as a representative for thick airfoil since it is one of the 3 most used airfoils in negative lift wing for FSAE cars [14]. Fin shapes are shown in Figure 12, and other parameters are preliminarily kept the same. The parameters are shown in Table 2, and the simulation results are shown in Table 3.
The leading edge fin has a trailing edge that is directly in front of the leading edge of side wing. The function of fins is verified at this special position. Other groups all have six fins, except for group B in Figure 12, which has five fins and lacks the leading edge fin. Other quantities are controlled in the same manner, except for the change in relevant parameters of the airfoil. In Table 3, overall indicates the combination of a side wing and shutters in front of it.
The results show that the flat airfoil leads to the largest increase in the lift of side wing, the smallest increase in the drag of side wing, and the largest overall lift (overall refers to the combination of “side wing + shutters”), and the overall drag is moderate. Therefore, the flat airfoil is the best shape among the several fin shapes considered at present. Given that the computational resources of a student formula team are limited, exploring a profusion of flat airfoil subtypes is difficult.
The presence or absence of leading edge fins has a significant impact on results. The bending plate ( n = 6 ) group with leading edge fins is better than the bending plate ( n = 6 ) group without leading edge fins in terms of side wing lift and overall lift. All the simulations below retain the design of leading edge fins.

5.1.2. Optimization of Chord Length

The fin chord length is optimized on the base of the shape of flat airfoil fin. Flat airfoils with chord length L = 30, 60, 90, and 150 mm are selected for simulation. The CAD models of shutters are shown in Figure 13. Other parameters remain the same as those listed in the row of flat airfoil in Table 2. The chord length, maximum thickness δ, and blocking ratio p are changed correspondingly. The latter two increase with the increase in chord length. The simulation results are shown in Table 4, and the growth analysis is shown in Figure 14.
In Figure 13d, aerodynamic kits shall not intrude the exclusion area due to formula restrictions of the contest [15]. If the leading edge fin is retained when L = 150 mm, then it will interfere with the front wheel. Thus, the leading edge fin is merely cancelled in this group. The endplate shape is changed correspondingly with different chord lengths. However, the shape of endplate is not set as a distinct parameter due to the complexity of describing it by using regularized methods and the limitation of our computational resources.
As shown in Figure 14, the blue lines denote the relative increase rate of the aerodynamic lift of each configuration, the red lines indicate the relative increase in drag, the dotted lines represent the side wing itself, and the solid lines represent the combination of side wing and shutter data. With the increase in chord length, the lift of side wing and the overall lift increase first and then decrease, and the drag decreases. With the increase in chord length, the effect of turbulence alleviation is better, but the lift of shutters increases more significantly, thereby reducing the efficiency of side wing behind it. The optimal chord length is selected as 90 mm, and the maximum thickness of the corresponding airfoil is 6.5 mm.

5.1.3. Optimization of Fin’s Angle of Attack

Five groups of angles of attack—2°, 6°, 8°, 10°, and 12°—are selected for simulation to explore the influence of the angle of attack on the effect of shutters and to improve the high-pressure area on the upper surface of side wing. The other parameters corresponding to the flat airfoil data in Table 2 remain unchanged. The simulation results are shown in Figure 15.
The meaning of each curve in Figure 15 is the same as that in Figure 14. The simulation results show that with the increase in wing attack angle, the wing lift gradually increases, and the resultant force of wing and shutters’ negative lift first increases and then decreases. The side wing drag decreases with the increase in angle of attack, but the overall drag is mostly unchanged. Under the free inflow of 15 m/s and assuming that the ambient temperature is 20 °C, the characteristic length is chosen as fin chord length L   = 90 mm, and the Reynolds number R e = 91,216 . The flow velocity at the actual shutters is lower, and the Reynolds number should be smaller. In accordance with the Profili airfoil library data, the 2D airfoil (BABIC) is about to reach a stall state at approximately   α = 9° when R e = 90,000 , and the fins in front of the actual side wing may have a larger stall angle. The simulation results show that 8° is the best angle of attack of fin. When the angle of attack is greater than 10°, the fin stalls, and the aerodynamic drag of shutters increases rapidly. The specific data can be found in Table 5.

5.1.4. Optimization of Shutters’ Width

The preliminary feasibility verification simulations show that for the prototype car, the shutters’ width B is positively related to the improvement of side wing efficiency, that is, the shutters are widened laterally as far as possible within the allowable range of rules, which is until the connecting line between the front and rear wheel centers on the same side [15], and the best effect can be attained. However, the calculation example of this study shortens the shutters’ CAD model to the vertical plane formed by the inner connecting line of the front and rear wheels due to the stiffness and manufacturability of shutters, as shown in Figure 16. The purpose of this process is to expand the shutters’ endplate within the allowable range of the rules for improving its aerodynamic efficiency.

5.1.5. Optimization of Blocking Ratio

When the blocking ratio p is close to 1, shutters, similar to a thick plate of porous media, enhance the ability to combine the turbulent flow. However, a larger drag is generated in the rear, and the overall effect worsens. When the blocking ratio is close to 0, the fins become a thin plate, the stiffness of the device is reduced, the interaction between the fins is weakened, and the shutters fail. Therefore, an optimal blocking ratio should be determined, and the optimal blocking ratio is distinctive for different fin shapes. The analysis of blocking ratio under the flat airfoil fin shape with L = 90 mm is performed.
Additional simulations are conducted on four cases with the number of fins n = 4, 5, 6, and 8 under the same gross height of 220 mm, showing in Figure 17. All the previous data about the flat airfoil form a dataset of 20 groups.
The maximum thickness δ and gross height are eliminated because they are dependent to other parameters, such as n and fin shape. The chord length L , angle of attack α , number of fins n , average interval Δ , and blocking ratio p are the independent parameters, and the total negative lift of side wing and shutters are taken as dependent variables. Multivariate regression models with various kernel functions are trained in MATLAB, and the training results show that support vector machine with quadratic kernel (quadratic SVM) has the smallest root mean square and the best fitting degree in this simulation results dataset, with R 2 = 0.84 . Kernel function of quadratic SVM is
K x i , x j = a x i T x j + b 2 ,
where a , b are coefficients to train, x i , x j can be any data point with the same dimension from the same dataset, and the details of quadratic SVM and quadratic kernel can be found in [16]. This regression model can predict the influence of variables above on the overall negative lift. With other four parameters remain unchanged, and the blocking ratio p is modified and re-predicted to obtain its influence on I p e r f m . The prediction result is shown in Figure 18.
The results show that when other conditions remain unchanged, I p e r f m first increases and then decreases with the increase in blocking ratio, and the negative lift decreases rapidly when p > 30 % . This time, the shutters are equivalent to a thick plate, which blocks the air flow. The optimal blocking ratio for flat airfoil shutters is between 10 and 20%. Given that the chord length L and fin shape are determined, 17.7 is selected as the temporal optimal blocking ratio with simulated I p e r f m = 9.77 .

5.1.6. Optimization of Gross Height

The gross height is changed by increasing or decreasing the number n of fins to explore its influence on the results. Five cases ( n = 4, 5, 6, 7, 8) are selected for simulation. The shutters cannot be 500 mm higher than the ground due to rule restrictions [15], so the maximum number of fins is eight. The simulation results are shown in Figure 19.
The results show that with the increase in fin number n , the gross height increases, the overall drag increases, and the increase range shows an upward trend. The side wing drag increases first and then decreases; that is, the side wing drag decreases correspondingly, and the lift drag ratio L / D of side wing itself is mostly unchanged with the decrease in side wing lift. The average interval Δ = 35 mm is selected via comparing I p e r f m . The gross height of 220 mm and the number of fins n  = 6 are determined to be the best.

5.2. Optimization Results of Shutter Parameters

Performing simulations on all combinations of parameters is impossible due to the limited computational resources. The optimal value of each parameter obtained by the above control variable method is selected as the best value of the overallselection, and the combination of the optimal parameters are considered to bethe optimal. The structural parameters of shutters with the best effect afteroptimization for the prototype racing car are shown in Table 6.

6. Simulation Analysis and Performance Comparison (Discussion)

6.1. Shutters’ Influence on Side Wing

The shutter-like fairing structure with the optimized parameters in Table 6 is used under the condition of 15 m/s incoming flow velocity. When the overall negative lift of side wing and shutters increases by 8.5 N (9.7%), the negative lift of side wing increases by 15.61 N (17.6%), the negative lift of the whole vehicle increases by 26.4 N (5.7%), the drag of the whole vehicle increases by 1.136 N (0.51%), the efficiency of side wing increases by 10.1%, and the efficiency of the whole vehicle increases by 4.78%, as shown in Table 7. The comparison of effects before and after the use of shutters can be found in Figure 20, Figure 21 and Figure 22.
As shown in Figure 20, in the original plan, a jet of vortex above the side wing generated by passing through the front suspension linkage is weakened rapidly after installing the shutters, and its influence on the side wing and side wing flaps is weakened. With the decrease in vorticity, the pressure rises, thereby increasing the high-pressure area in the middle of the upper surface of side wing and the upper surface of side wing flaps. The average pressure is similar, but the high-pressure area increases, as shown in Figure 23. The shutters improve the low-pressure turbulent flow field above the side wing. Specifically, the part close to the side wing surface (including the upper and lower wing surfaces) is transformed into an ordinary flow field, and the average vortex on the upper surface of side wing is reduced from more than 125/s to less than 50/s. The change in flow field of the side wings is extremely small, as shown in Figure 21. Figure 22 shows the velocity vector diagram at the 400 mm offset section of the longitudinal symmetry plane, revealing the role of the leading edge fins and other fins.
As shown in Figure 22, the free flow of the leading edge fin of the side wing is smoothly divided into upper and lower parts. The air flow obviously accelerates after passing through the shutters, from less than 4 m/s to about 10 m/s after installing the shutters, thereby filling the speed vacuum area above the upper surface of side wing of the original one. On the one hand, this change greatly reduces the negative pressure area on the upper surface of the front part of side wing. On the other hand, it guides more air to flow under the side wing, strengthening the negative pressure area below the side wing. The two sides work together to enhance the overall negative lift.

6.2. Shutters’ Influence on Other Aerodynamic Kits

6.2.1. Influence on Front Wing and Rear Wing

The existence of shutters increases the negative lift of the front wing by 14.84 N (8.9%), the drag by 1 N (3%), the negative lift of the rear wing by 5.28 N (2.9%), and the drag of the rear wing by 1.34 N (1.48%).
As indicated in Figure 21, the vorticity behind the front wing declines because of the blocking and diversion effect of shutters. Although the downer part of the wake raised by the front wing is guided downward by the shutters, more vortices go up, resulting in a larger overall upwash angle of the front wing wake. Specifically, the blocking effect of shutters is transmitted to the right behind the front wing and contribute to the increase in the up-washing angle, resulting in a slight raise in the positive pressure area on the upper surface of the front wing. In accordance with the principle of force and reaction force, the upwash angle and the negative lift of the front wing increase. The low vorticity area behind the front wing plays a suction role, which further increases the negative pressure area below the front wing. The upper and lower parts work together, leading to the enhancement of negative lift of the front wing.
The increase in front wing negative lift is mainly caused by the blocking effect of shutters. When the shutters’ blocking ratio p = 100%, that is, when the shutters become a thick plate, the blocking effect reaches its climax, the lifting of the front wing is the largest, and the effect of shutters is seriously reduced.
The shutters have minimal interference on the flow field of rear wing, but the increased air flow on the upper surface of side wing increases the air flow raised by the side wing flaps. The slight increase in vorticity under the rear wing is attributed to the side flap, and the increase in vorticity weakens the negative pressure area under the main wing and flaps of rear wing. The loss of rear wing negative lift caused by the wake of shutters can be effectively avoided by reasonably designing a guide device.

6.2.2. Influence on Diffuser

The negative lift of the diffuser increases by 5 N (15.7%), and the drag decreases by 0.16 N (8%), which greatly improves the efficiency of the diffuser. This increase is due to the increase in the air flow under the vehicle with the addition of the leading edge fins of shutters. The effect of the back part of diffuser is mostly the same as that of the original car. The position on the diffuser where the negative lift increases overlap that of the shutters, that is, the interconnecting area of the lowest pressure zone on the downer surface of shutters, as shown in Figure 23. It is located directly beneath the center of mass, and the increase in negative lift will not cause additional pitching moment. Detailed data can be found in Table 7.

6.2.3. Overall Influence on the Whole Vehicle

Although the shutters increase the negative lift of the side wing itself, front wing, and diffuser, the overall effect still increases the forward pitching moment to the vehicle centroid by 14 Nm (67%), which is one of the adverse effects brought by the shutters. This adverse effect must be reduced by increasing an upper beam wing above the rear wing or adding whiskers to cooperate with the shutters. The aerodynamic performance of the whole vehicle will approach the ideal condition. An upper beam wing must be increased to offset the adverse forward pitching moment, and the CoP must be moved backward compared with the original car to improve the handling performance.
As shown in Figure 24, the race car installed with upper beam wing and whiskers simultaneously (group C) in accordance with the above ideas is simulated and is compared with the original car (group A) and the car with optimized shutters (group B). The results are shown in Table 8.
C L of the prototype racing car is enhanced from 2.61 to 2.76, C D is improved from 1.25 to 1.26, and the forward displacement of CoP is controlled within 59 mm after adding the shutters and optimizing the design. In accordance with the above idea, the pitching moment is reduced by 3.9 N (23%), and the forward displacement of CoP is perfected to 6.5 mm after adding the upper beam wing above the rear wing and the whisker at the same time, thereby proving the feasibility of this solution. The selection of the parameter design of upper beam wings without a whisker will be thoroughly introduced in the next article.

7. Conclusions

Under the influence of the front wing, front wheel, and front suspension system, the flow field around the side wing presents the characteristics of low pressure and high vorticity, which are unfavorable to the improvement of pressure on the upper surface of side wing. The negative lift of side wing of the prototype racing car is only 34.5% of that without the front wing and front wheel. However, the shutter-like fairing structure (shutters) can reduce this adverse effect by reducing the vorticity and increasing the pressure of air flow passing through it.
The variation of the key parameters of shutters has a great impact on the side wing efficiency. Flat airfoil fins have the best effect on improving the efficiency of side wings. The side wing efficiency increases with the chord length L , angle of attack α , blocking ratio p , and gross height, demonstrating a trend of increase at first and then decrease. In the regular range, the inner wing efficiency increases monotonically with shutter width B . The key parameters of optimized geometrical shutters are flat airfoil (BABIC), chord length L   = 90 mm, angle of attack α = 8°, average interval   Δ = 35 mm, and number of fins ( n = 6 -piece configuration), including the leading edge fins.
The optimized shutters can improve the side wing efficiency ( L / D ) by 10.1%, the whole vehicle efficiency by 4.78%, the front wing efficiency by 5.59%, and the diffuser efficiency by 9.51%. However, the rear wing efficiency is reduced by 1.98%. The increase in negative lift at the front and the decrease in negative lift at the rear caused by the shutters increase the hazardous pitching moment and move the CoP forward. However, this problem can be solved by reasonably setting the whisker and the upper beam wing of rear wing, and further improvement of aerodynamic performance of the vehicle can be achieved.

Author Contributions

Conceptualization, X.Q. and H.Z.; software, X.Q. validation, X.Q. and D.W.; formal analysis, X.Q., D.W. and Y.O.; investigation, Y.O.; resources, Y.O.; data curation, X.Q. and Y.O.; writing—original draft preparation, X.Q.; visualization, X.Q.; supervision, D.W. All authors have read and agreed to the published version of the manuscript.

Funding

This research received no external funding.

Institutional Review Board Statement

Not applicable.

Informed Consent Statement

Not applicable.

Data Availability Statement

The data presented in this study are available on request from the first author or corresponding author.

Acknowledgments

The authors would like to thank Formula Student Team Gspeed of Jilin University, College of Automotive Engineering. Besides, Liu, Z.K in Jilin University College of Automotive engineering modeled the prototype CAD FSAE car, Wang, B.N. and Cheng, H.X. offered help in CFD simulation. Thank them all for their contribution.

Conflicts of Interest

The authors declare no conflict of interest.

References

  1. Feng, H.C.; Zhang, Z.N.; Li, Y.; Li, Q.; Niu, X.F. Design of Aerodynamic Package for FSAE Racing Car. In Proceedings of the China Society of Automotive Engineering Annual Conference and exhibition, Shanghai, China, 27–29 October 2020; pp. 3137–3142. [Google Scholar]
  2. Liang, D.H.; Liu, Z.K.; Qi, X.J.; Li, Z.H.; He, S.L.; Fu, L.T.; Wang, D. A Field Function Approach for the External Flow Simulation of a Steady-state Cornering FSAE Car. In Proceedings of the Annual Meeting of China Society of Automotive Engineering(8), Shanghai, China, 19–21 October 2021; pp. 3299–3304. [Google Scholar]
  3. Nan, Q.; Ying, B.S.; Wu, J.J.; Yao, J.Y. Effect Study of Rear Diffuser on Aerodynamic Characteristics of Formula SAE Racing Car. Mech. Des. Manuf. 2019, 10, 72–79. [Google Scholar]
  4. Pan, X.W. Analysis and Optimization of Some Racing Car on Aerodynamic Characteristics. Master’s Thesis, Hunan University, Hunan, China, 2009. [Google Scholar]
  5. Tian, X.H.; Li, L.J.; Tong, M.W.; Qi, B. CFD study on the air side performance of an automobile louvered-fin type heat exchanger. J. Tianjin Univ. Technol. 2007, 23, 63–66. [Google Scholar]
  6. Li, T.K.; Huang, Y. Numerical simulation analysis of structural parameters of shutters fins. J. Guizhou Univ. Nat. Sci. Ed. 2022, 39, 51–56. [Google Scholar]
  7. Ma, R.F. Numerical Simulation of Air Flow over Louvered Fin in Domestic Air-conditioning Heat Exchangers. Master’s Thesis, Huazhong University of Science and Technology, Wuhan, China, 2009. [Google Scholar]
  8. Suo, W.C.; Bi, X.P.; LV, L.D. Numerical Simulation of Airflow and Structure Optimization for Shutters of Tracked Vehicles. J. Ordnance Eng. 2010, 31, 887–891. [Google Scholar]
  9. Zhang, L.; Zhao, Z.Y.; Wu, X.H.; Ding, C.; Gong, Y.; Lv, Y.L. The Investigation of Heat Transfer Performance and Fluid Flow in Louvered Fins with Continuous Variable Angle of Attack. J. Eng. Thermophys. 2016, 37, 1935–1939. [Google Scholar]
  10. Zhou, P.; Zhang, J.; Li, T. Effects of Blocking Ratio and Mach Number on Aerodynamic Characteristics of the Evacuated Tube train. J. Int. J. Rail Transp. 2020, 8, 27–44. [Google Scholar] [CrossRef]
  11. Liu, Z.K.; Liang, D.H.; Fu, L.T.; Xu, Y.D.; Zhang, Y.Z.; Wang, D. Correlational Analysis Between Turbulence Models Based on CAD Simulation and Wind Tunnel Experiment Results. In Proceedings of the Annual Meeting of China Society of Automotive Engineering, Shanghai, China, 27 October 2020; pp. 3218–3223. [Google Scholar]
  12. Zhang, Y.C.; Zhang, Z.; Li, J. Virtual wind tunnel test based on computational fluid dynamics. J. Jilin Univ. Eng. Technol. Ed. 2010, 40, 90–94. [Google Scholar]
  13. CDAJ-China Information Technology (Shanghai) Co., Ltd. Technology department Star-CCM+ tips. Comput. Aided Eng. 2010, 19, 2.
  14. Sun, W. The Design of Low-speed Racecar Inverted Wings Based on CFD. Master’s Thesis, Hunan University, Hunan, China, 20 May 2016. [Google Scholar]
  15. Formula SAE. 2021. Available online: http://www.formulastudent.com.cn/c574 (accessed on 25 April 2022).
  16. Sánchez, A.V.D. Advanced Support Vector Machines and Kernel Methods. Neurocomputing 2003, 55, 5–20. [Google Scholar] [CrossRef]
Figure 1. Design for controlling the side air flow using a whisker.
Applsci 12 06552 g001
Figure 2. Louvres used on the endplate.
Applsci 12 06552 g002
Figure 3. Example of shutter-like fairing structure.
Applsci 12 06552 g003
Figure 4. Installation position of shutter-like fairing structure (orange). In our implementation, the shutters are installed between the front wheel and side wing leading edge to combine the low-pressure turbulent airflow above the side wing.
Applsci 12 06552 g004
Figure 5. Distribution of low-pressure area and turbulence of the whole vehicle. (a) Side wing is exposed to the relatively low-pressure zone; (b) side wing is subjected to air flow with high vorticity.
Applsci 12 06552 g005
Figure 6. Simulation model after canceling the front wheel and front wing.
Applsci 12 06552 g006
Figure 7. Key parameters of a shutter-like fairing structure.
Applsci 12 06552 g007
Figure 8. Impact of shutter-like fairing structure on 3D flow field. (a) High vorticity of wingtip vortex is reduced significantly by passing through the shutters; (b) low-pressure condition in the vortex is improved because of the reduction in vorticity.
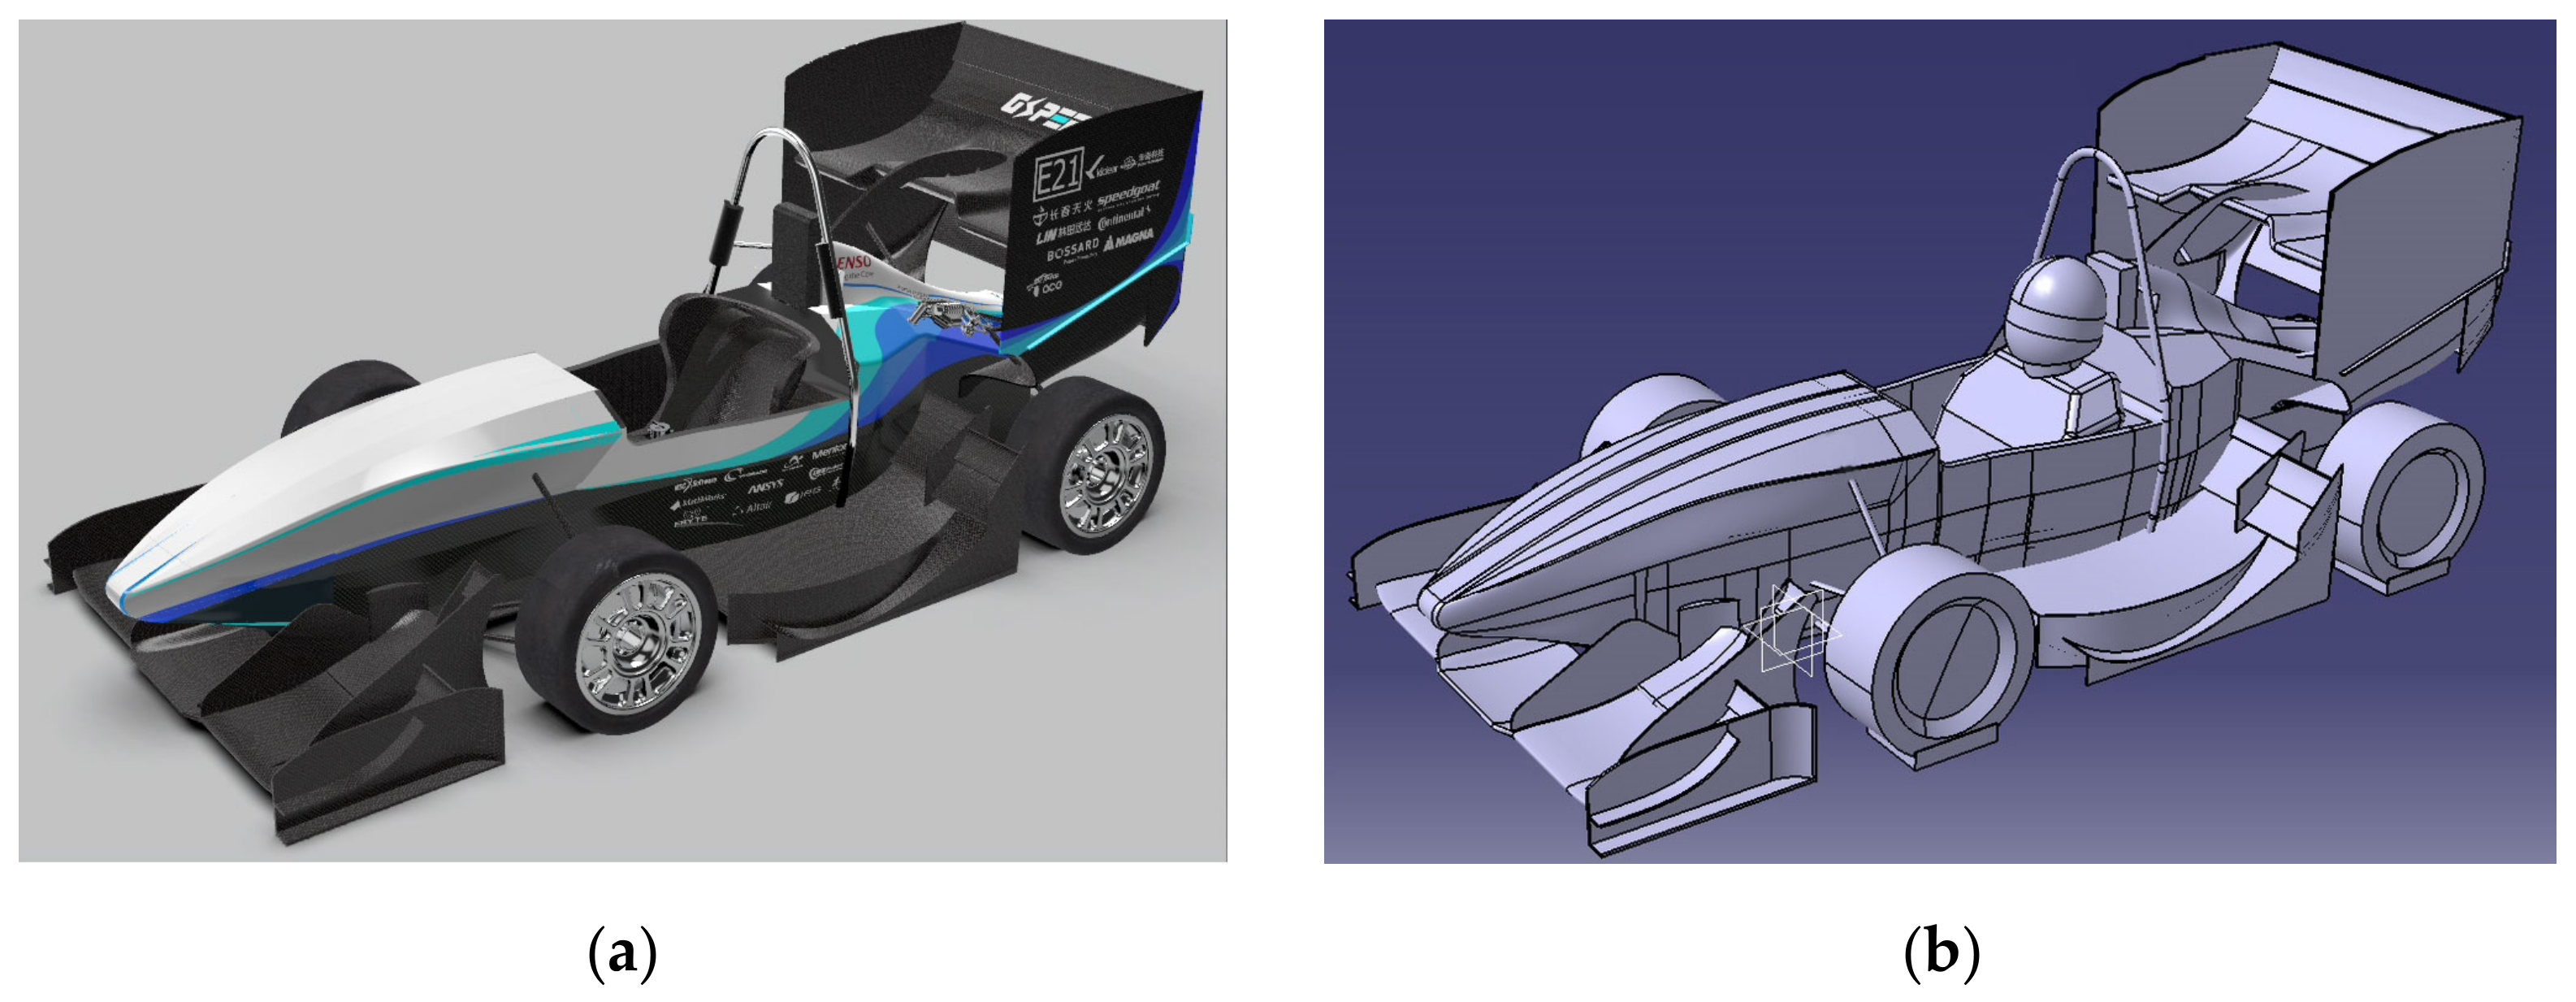
Applsci 12 06552 g008
Figure 9. Comparison between the original CAD model (left) and simplified one (right). (a) Original CAD model includes considerable details that are mostly meaningless for CFD simulation, such as powertrain inside monocoque and some small electronic devices; (b) simplified model contains merely aerodynamic kits, monocoque, and some other indispensable parts, such as the driver and front suspension.
Applsci 12 06552 g009
Figure 10. Mesh operation results and three different zones (body, wake, side wing) that are densified.
Applsci 12 06552 g010
Figure 11. Convergence of lift results on a side wing only compared with a side wing and shutters.
Applsci 12 06552 g011
Figure 12. CAD model of different shutters with distinct fin shape. (a) Shutters with blending plate fin ( n = 6 , with leading edge fin, explained in the next paragraph). (b) Shutters with blending plate fin ( n = 5 , without leading edge fin). (c) Shutters with flap airfoil (BABIC) fin. (d) Shutters with flap plate fin. (e) Shutters with thick airfoil (ch10) fin.
Applsci 12 06552 g012
Figure 13. CAD models of different shutters with distinct fin chord length. (a) Shutters with chord length L = 30 mm. (b) Shutters with chord length L = 60 mm. (c) Shutters with chord length L = 90 mm. (d) Shutters with chord length L = 150 mm.
Applsci 12 06552 g013
Figure 14. Influence of chord length L to side wing aerodynamic performance.
Applsci 12 06552 g014
Figure 15. Influence of fin’s angle of attack α to side wing aerodynamic performance.
Applsci 12 06552 g015
Figure 16. Shutters’ width B is constrained by the inner side of vertical plane wheel.
Applsci 12 06552 g016
Figure 17. CAD models of additional simulation cases. (a) Shutters with number of fin n = 4. (b) Shutters with number of fin n = 5. (c) Shutters with number of fin n = 6. (d) Shutters with number of fin n = 8.
Applsci 12 06552 g017
Figure 18. Prediction of the influence of blocking ratio on I p e r f m of side wing with SVM regression model using quadratic kernel function, trained on the dataset with 20 simulation cases mentioned above.
Applsci 12 06552 g018
Figure 19. Gross height of shutters and its influence on side wing aerodynamic performance.
Applsci 12 06552 g019
Figure 20. Comparison of vorticity above the side wing. (a) Original condition, a jet of strong vortex is generated; (b) the strong jet is cut into two weaker parts after implementing the shutters.
Applsci 12 06552 g020
Figure 21. Comparison of vorticity at 400 mm offset section plane of vehicle longitudinal symmetrical plane. (a) Original condition, the vorticity above the upper surface of side wing is relatively high, that is, in a low-pressure turbulent condition; (b) the vorticity on the side wing upper surface is reduced significantly after implementing the shutters, indicating a transition to a more organized flow field.
Applsci 12 06552 g021
Figure 22. Comparison of velocity at 400 mm offset section plane of vehicle longitudinal symmetrical plane. (a) Original condition, the velocity at the front upper section of side wing is lower than 4 m/s; (b) the velocity above and below the side wing increases significantly after implementing the shutters.
Applsci 12 06552 g022
Figure 23. Surface pressure comparison of side wing.
Applsci 12 06552 g023
Figure 24. Prototype racing car with shutters, whisker, and rear upper beam wing (group C).
Applsci 12 06552 g024
Table 1. Grid sensitivity analysis results.
Base Size/mTotal Number of Cell/104Side Wing Lift/NSide Wing Drag/NLift of Vehicle/NConvergence after 1000 StepsConvergence after 2000 Steps
0.75106−98.991429.1466−468.235noyes
0.6189−91.993230.9724−470.751yesyes
0.5298−88.62728.9974−462.26yesyes
0.4466−89.280429.106−462.313noyes
0.251907−88.449228.6526−462.126nono
Table 2. Corresponding parameters in the simulation of fin shape optimization.
Fin ShapeChord Length L /mm Max Thickness δ /mm Angle of Attack of Fin α Number of Fin n /Piece Average Inertia Δ /mm Gross Height/mmBlocking Ratio p
blending plate90.00 3.00 6.00 635.00 220.00 8.20
blending plate90.00 3.00 6.00 535.00 185.00 8.10
flap plate90.00 3.00 6.00 635.00 220.00 8.20
flap airfoil90.00 6.50 6.00 635.00 220.00 17.70
thick airfoil90.00 11.00 6.00 635.00 220.00 30.00
Table 3. Simulation results of fin shape optimization (15 m/s).
Fin Shape I p e r f m   Side Wing Lift/NOverall Lift/NSide Wing Drag/NOverall Drag/N
blending plate (n = 6)6.75−101.183−96.043231.290831.8456
blending plate (n = 5)5.77−99.8378−94.836831.048631.596
flap plate5.81−99.9818−95.538231.21131.9524
flap airfoil9.03−103.89−96.642631.014231.5454
thick airfoil7.27−102.574−94.919631.186831.488
Table 4. Simulation results of fin chord length optimization (15 m/s).
Fin Chord Length L /mm I p e r f m Side Wing Lift/NOverall Lift/NSide Wing Drag/NOverall Drag/N
1508.41−103.247−92.136829.719430.2976
909.03−103.89−96.642631.014231.5454
608.07−102.814−95.966831.013231.548
305.78−100.294−94.773231.173431.7232
Table 5. Simulation results of the fin’s angle of attack optimization (15 m/s).
Fin’s Angle of Attack α I p e r f m Side Wing Lift/NOverall Lift/NSide Wing Drag/NOverall Drag/N
26.79−101.3344−95.084631.15431.3948
69.03−103.8904−96.642631.014231.5454
89.77−104.3266−97.151830.782831.5168
108.76−103.9956−95.528430.677631.5718
129.57−104.1764−95.312829.826631.53
Table 6. Refined shutters’ key parameters.
Fin ShapeChord Length L/mmAngle of Attack of Fin αNumber of Fin n/PieceAverage Interval Δ/mmGross Height/mmBlocking Ratio p/%
flat airfoil90.00 8.00 635.00 220.00 17.7
Table 7. Comparison of coefficients before and after implementing the shutters.
C L C L Change Rate/% C D C D Change Rate/%
front wing−4.81−5.248.900.960.993.1
rear wing−2.50−2.42−3.201.241.22−1.6
diffuser−2.82−3.2615.60.180.195.6
side wing−1.87−2.217.60.610.656.5
vehicle−2.61−2.765.701.251.260.51
Table 8. Simulation results of different groups.
GroupCLCDPitching Moment/NmForward Displacement of CoP/mm
A−2.611.25−20.90
B−2.761.26−34.959
C−2.851.28−16.2−6.5
Publisher’s Note: MDPI stays neutral with regard to jurisdictional claims in published maps and institutional affiliations.

