
Influence of Micro-Textures on Cutting Insert Heat Dissipation


 , , ,
, , , 

Abstract
:1. Introduction
2. System Design and Implementation
2.1. Concept
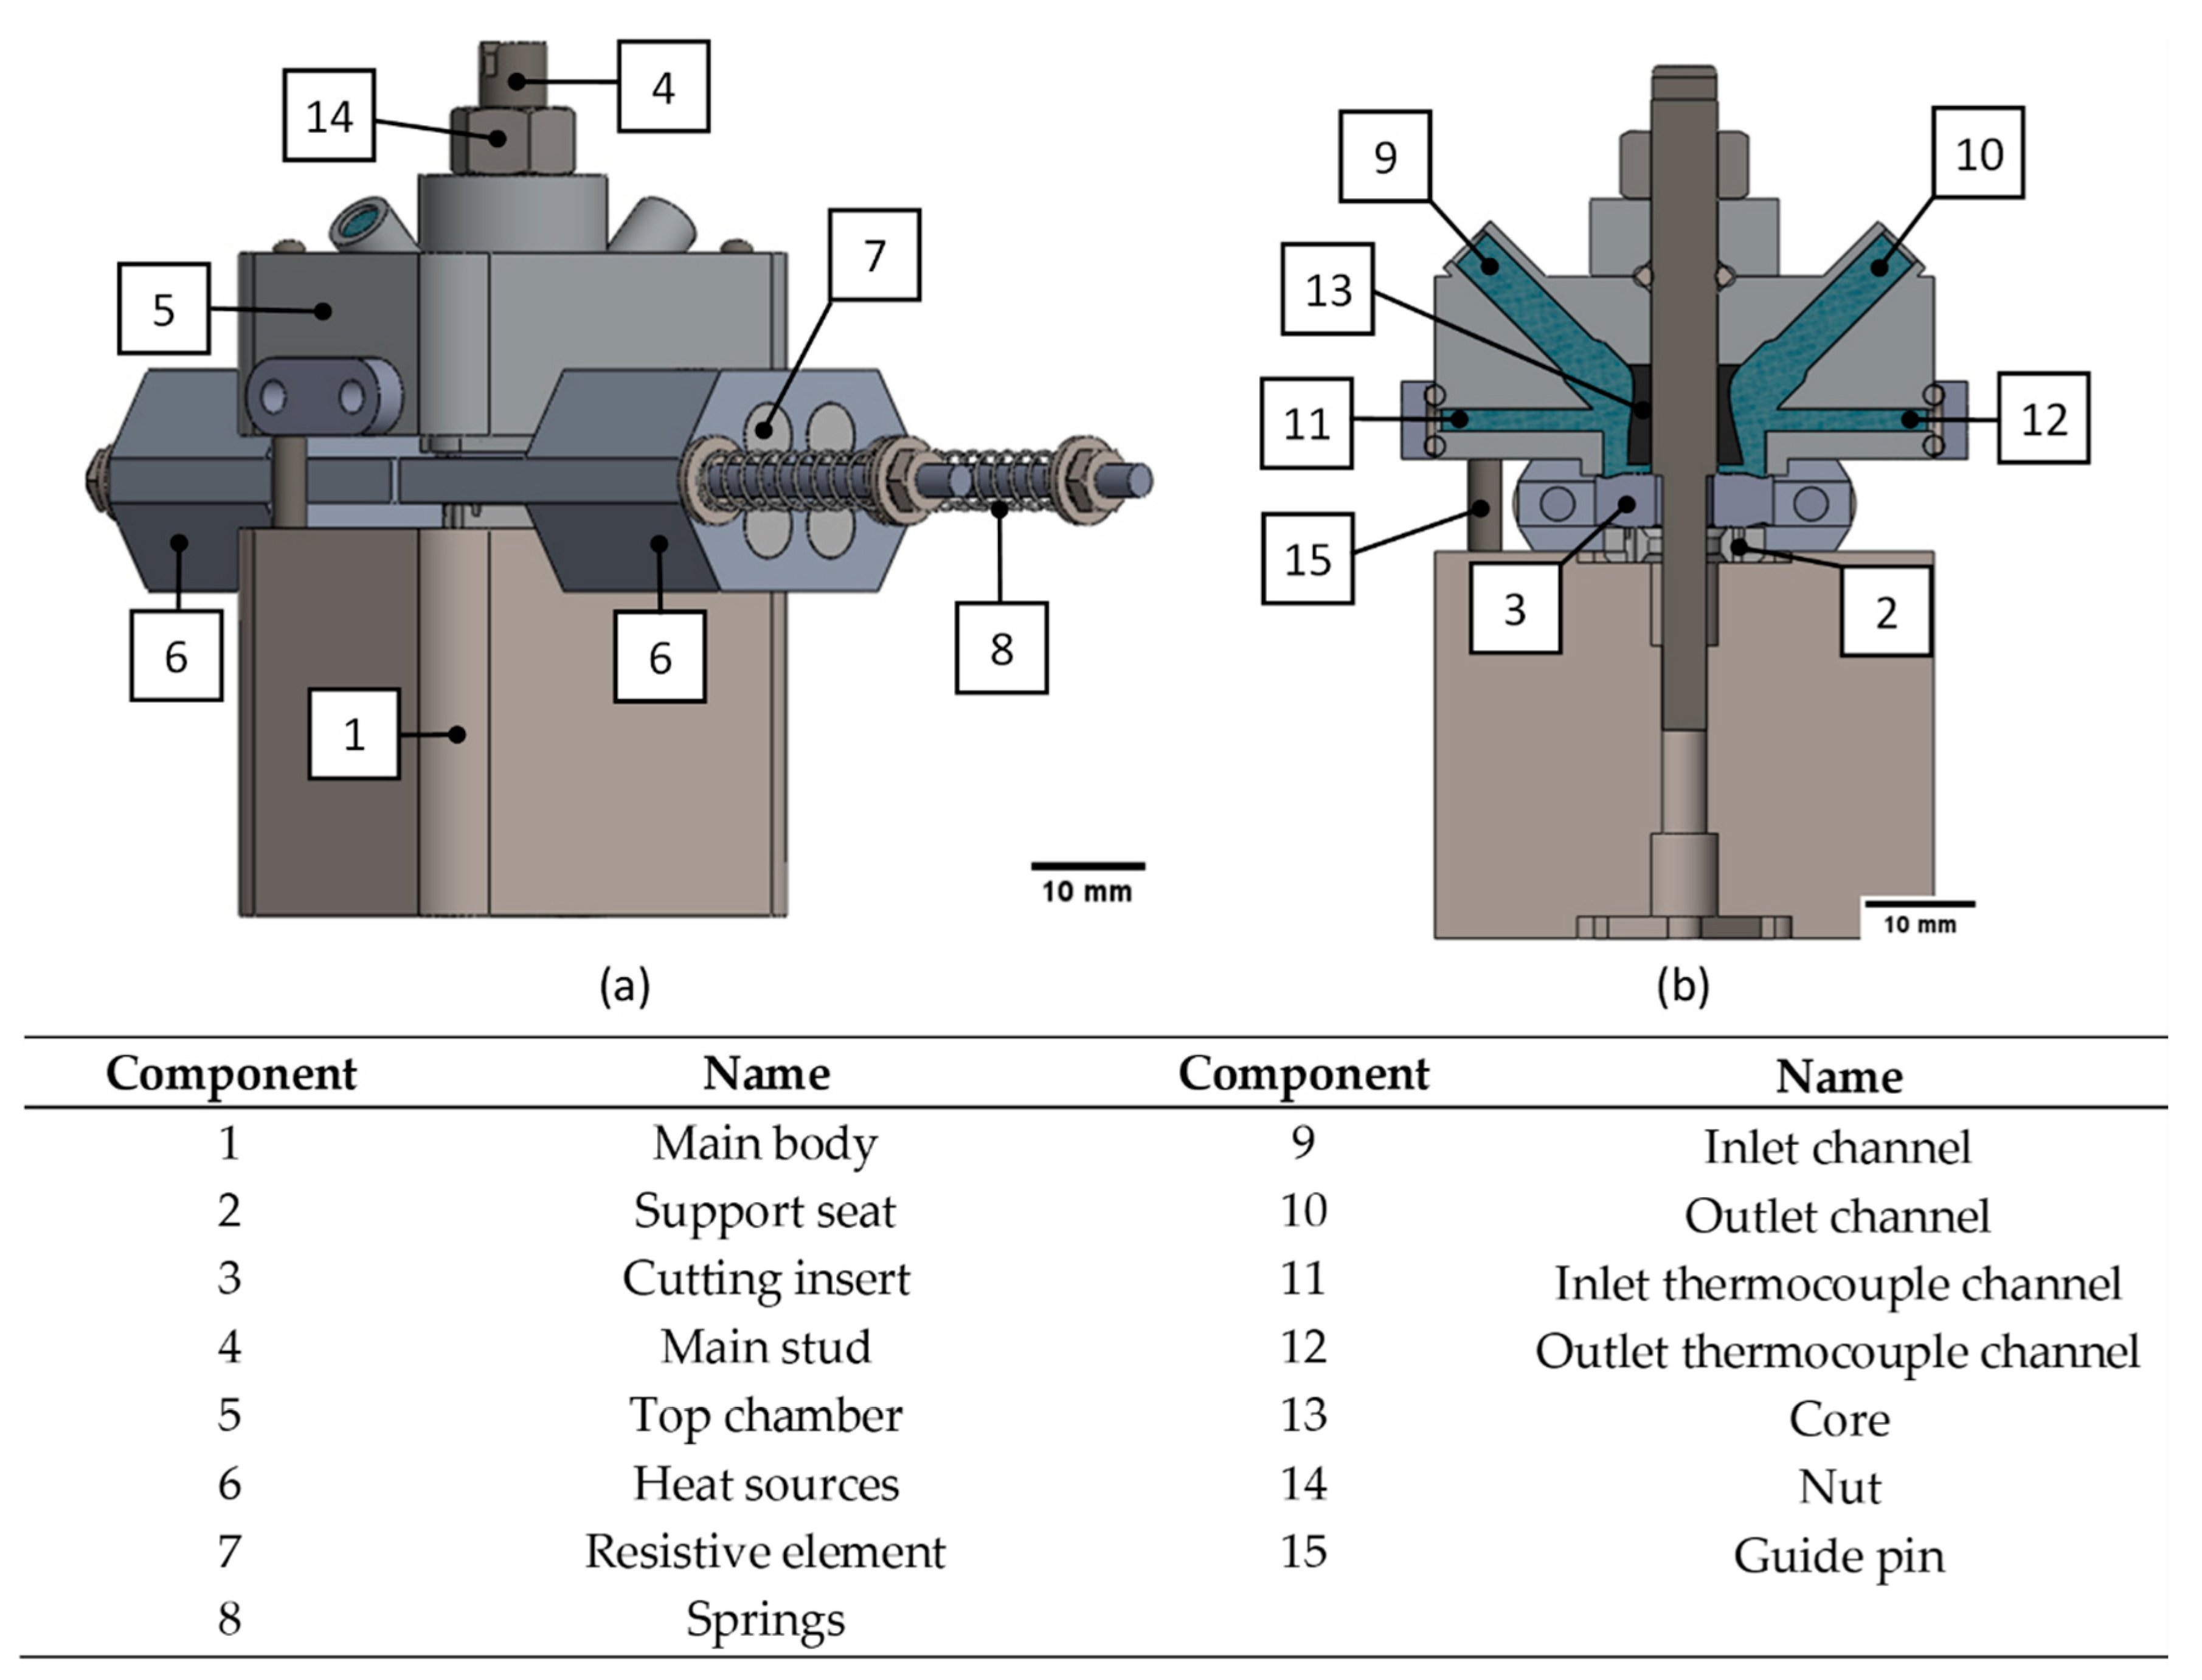
2.2. CAD Modelling
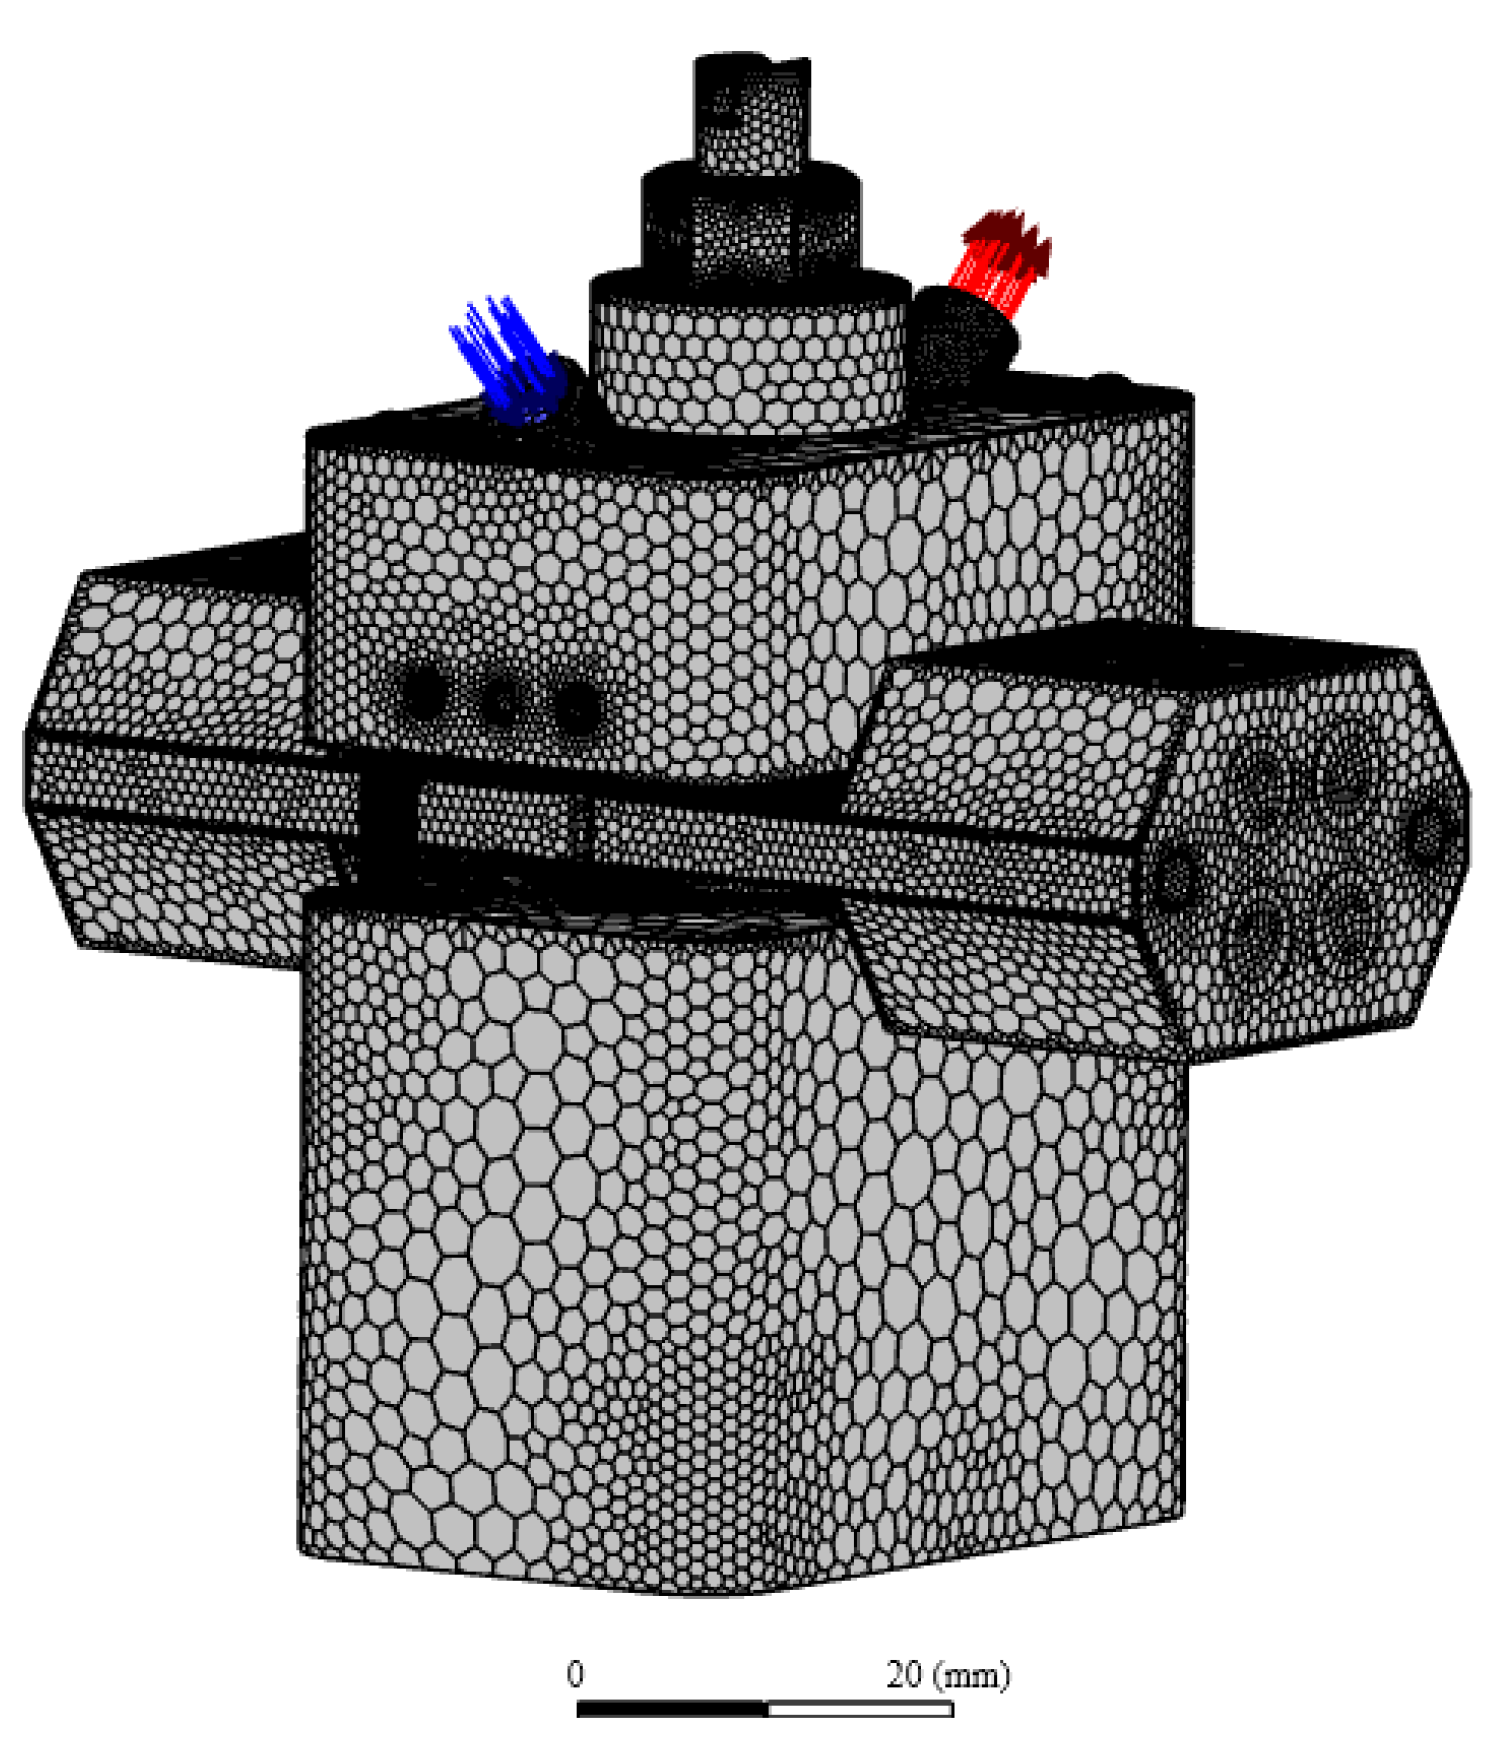
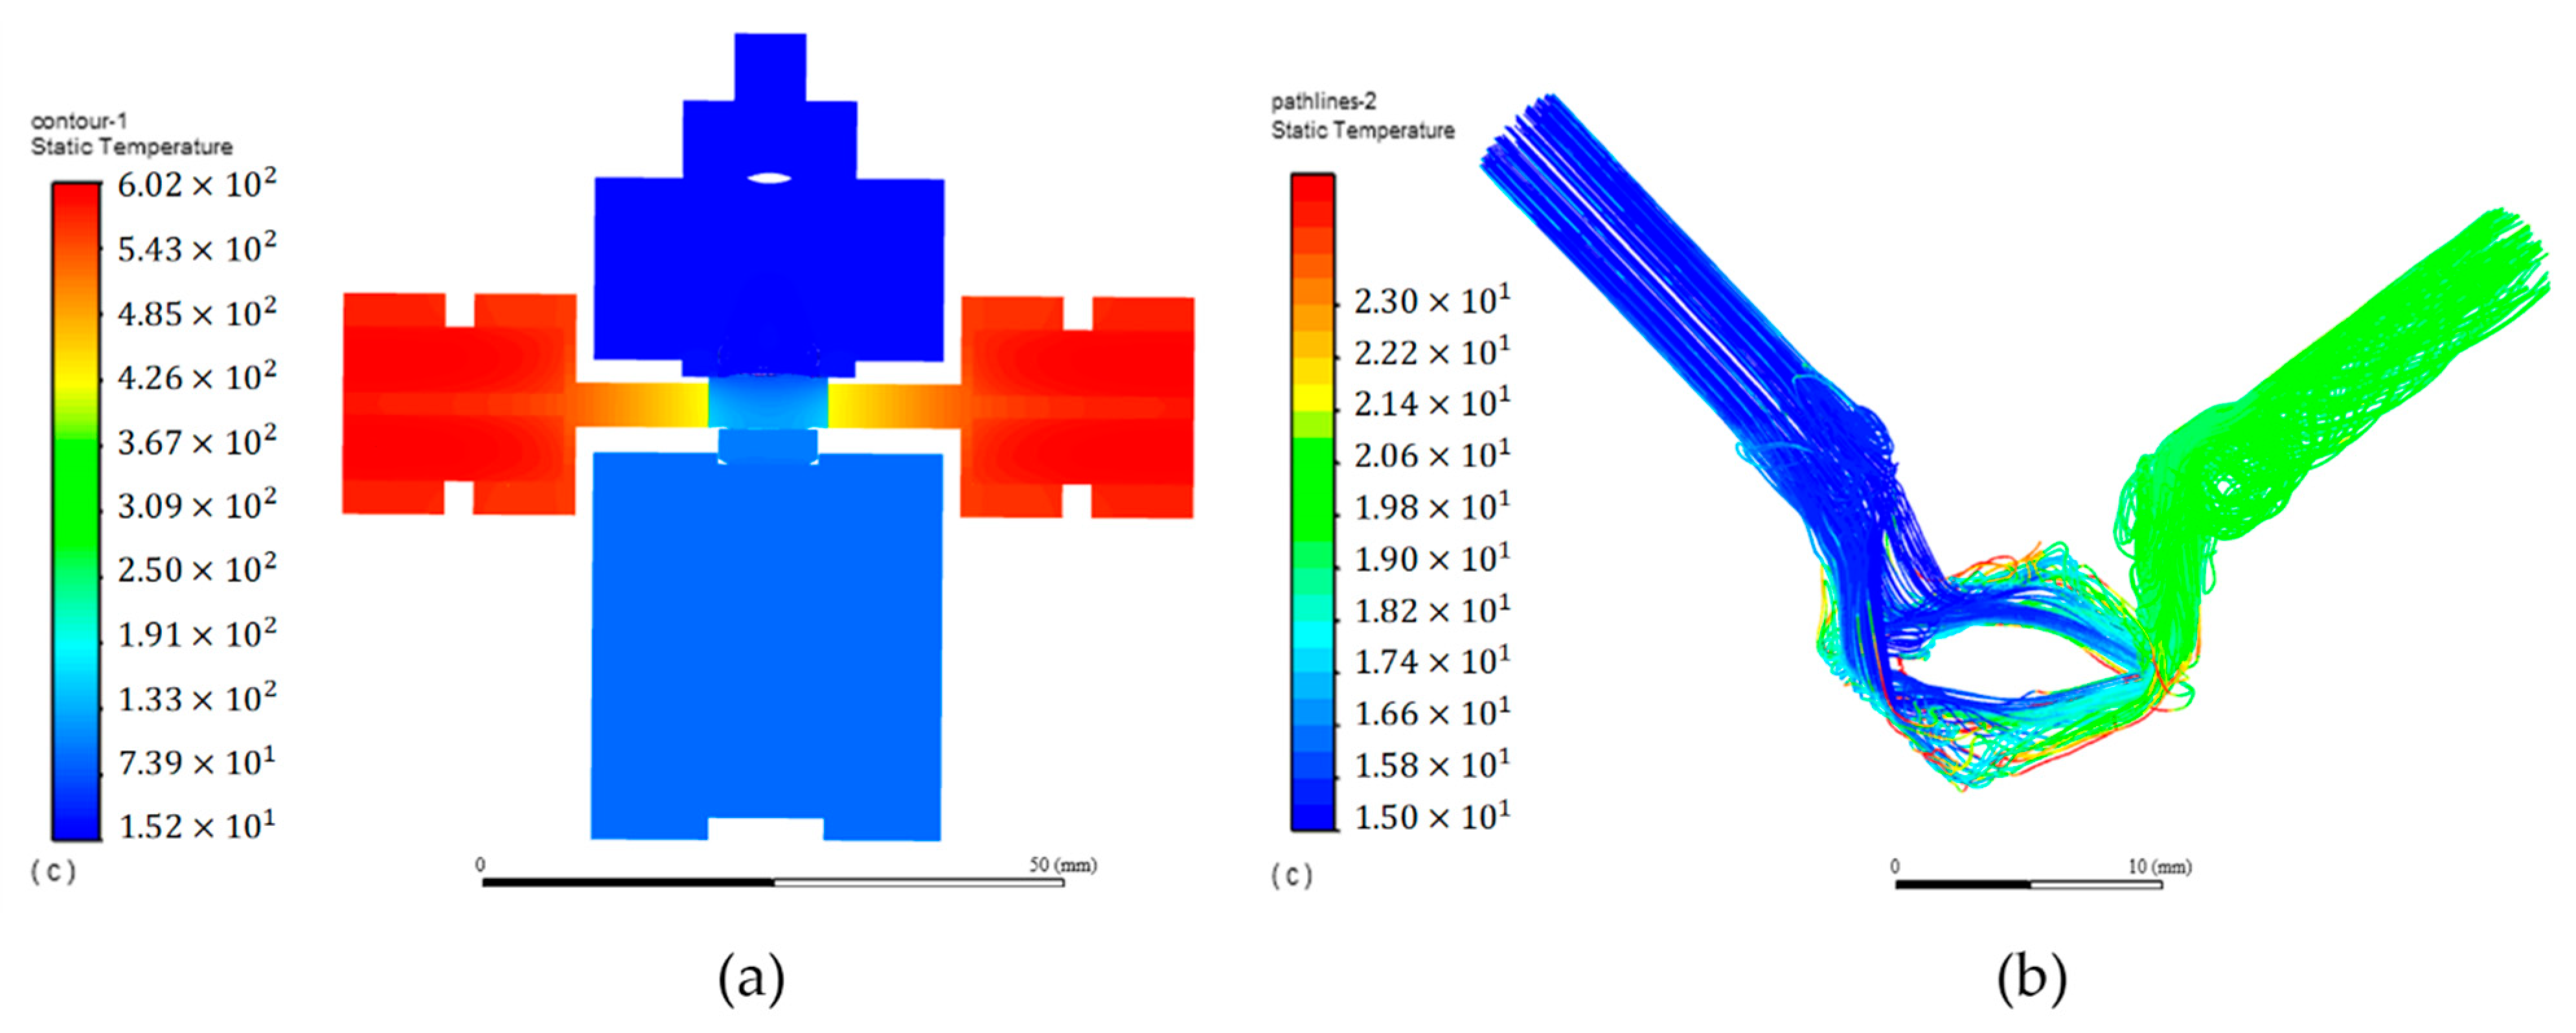
2.3. Numeric Study
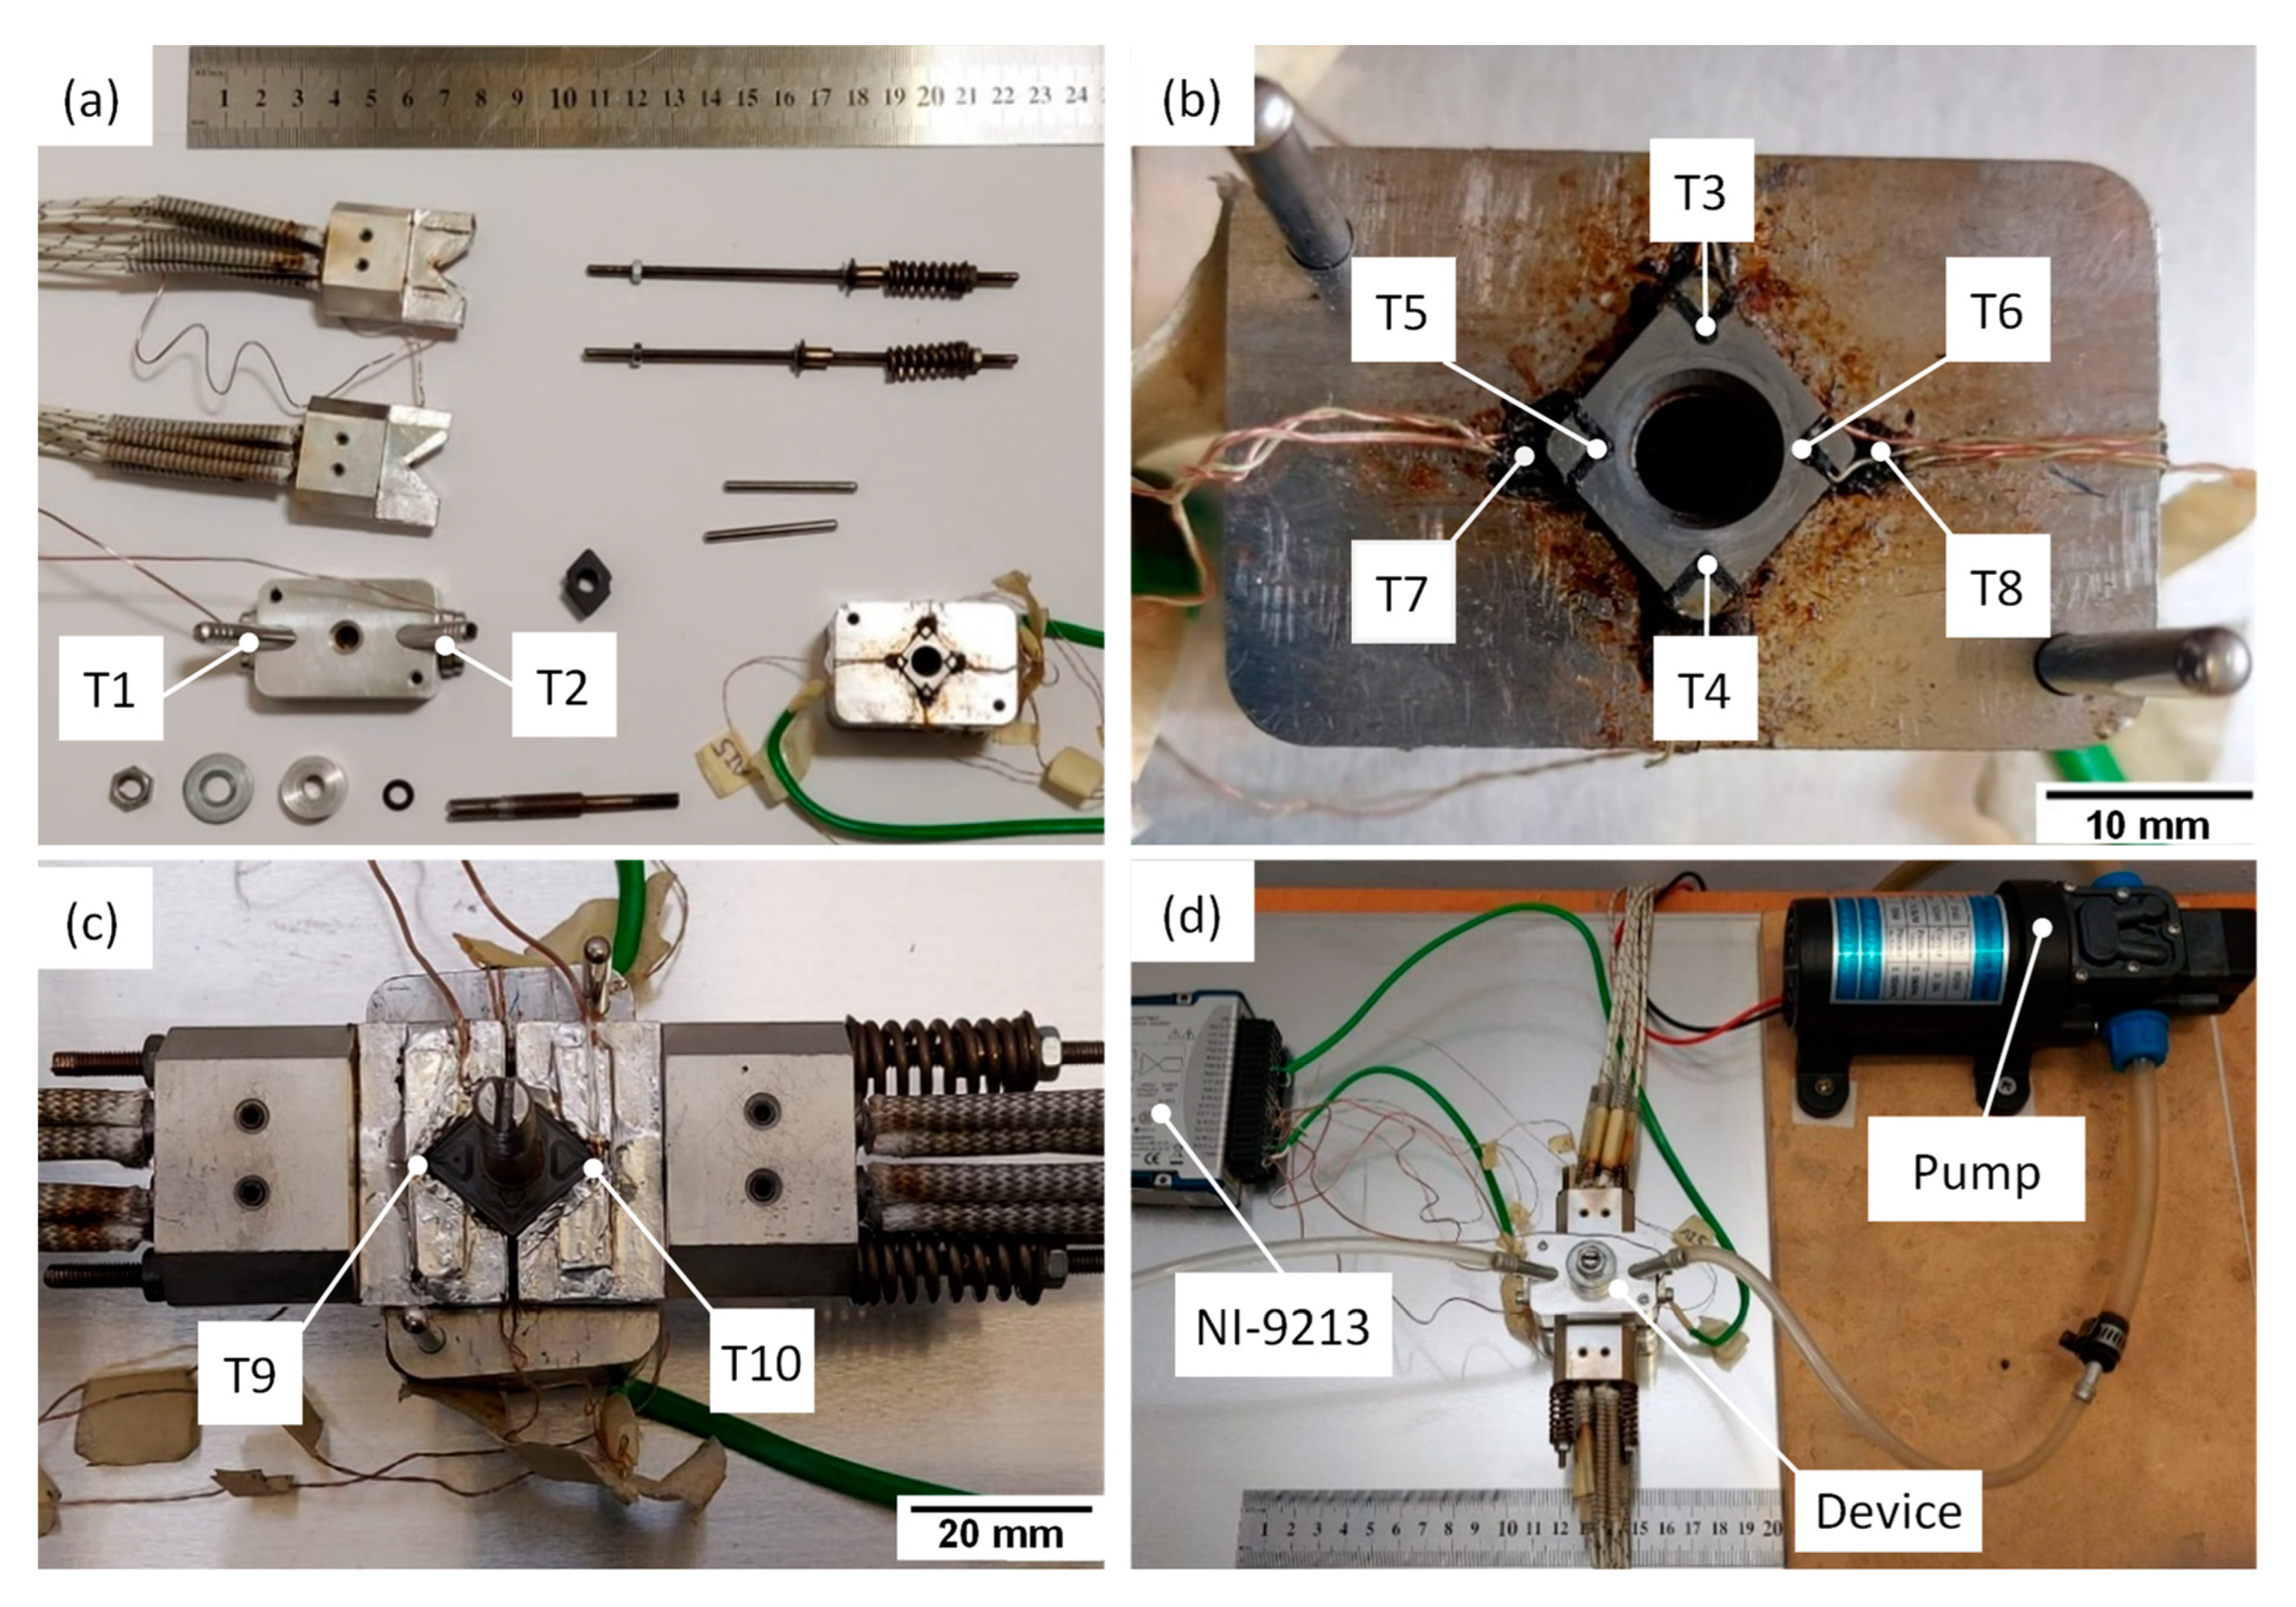
2.4. Experimental Device Description and Assembly
3. Experimental Study
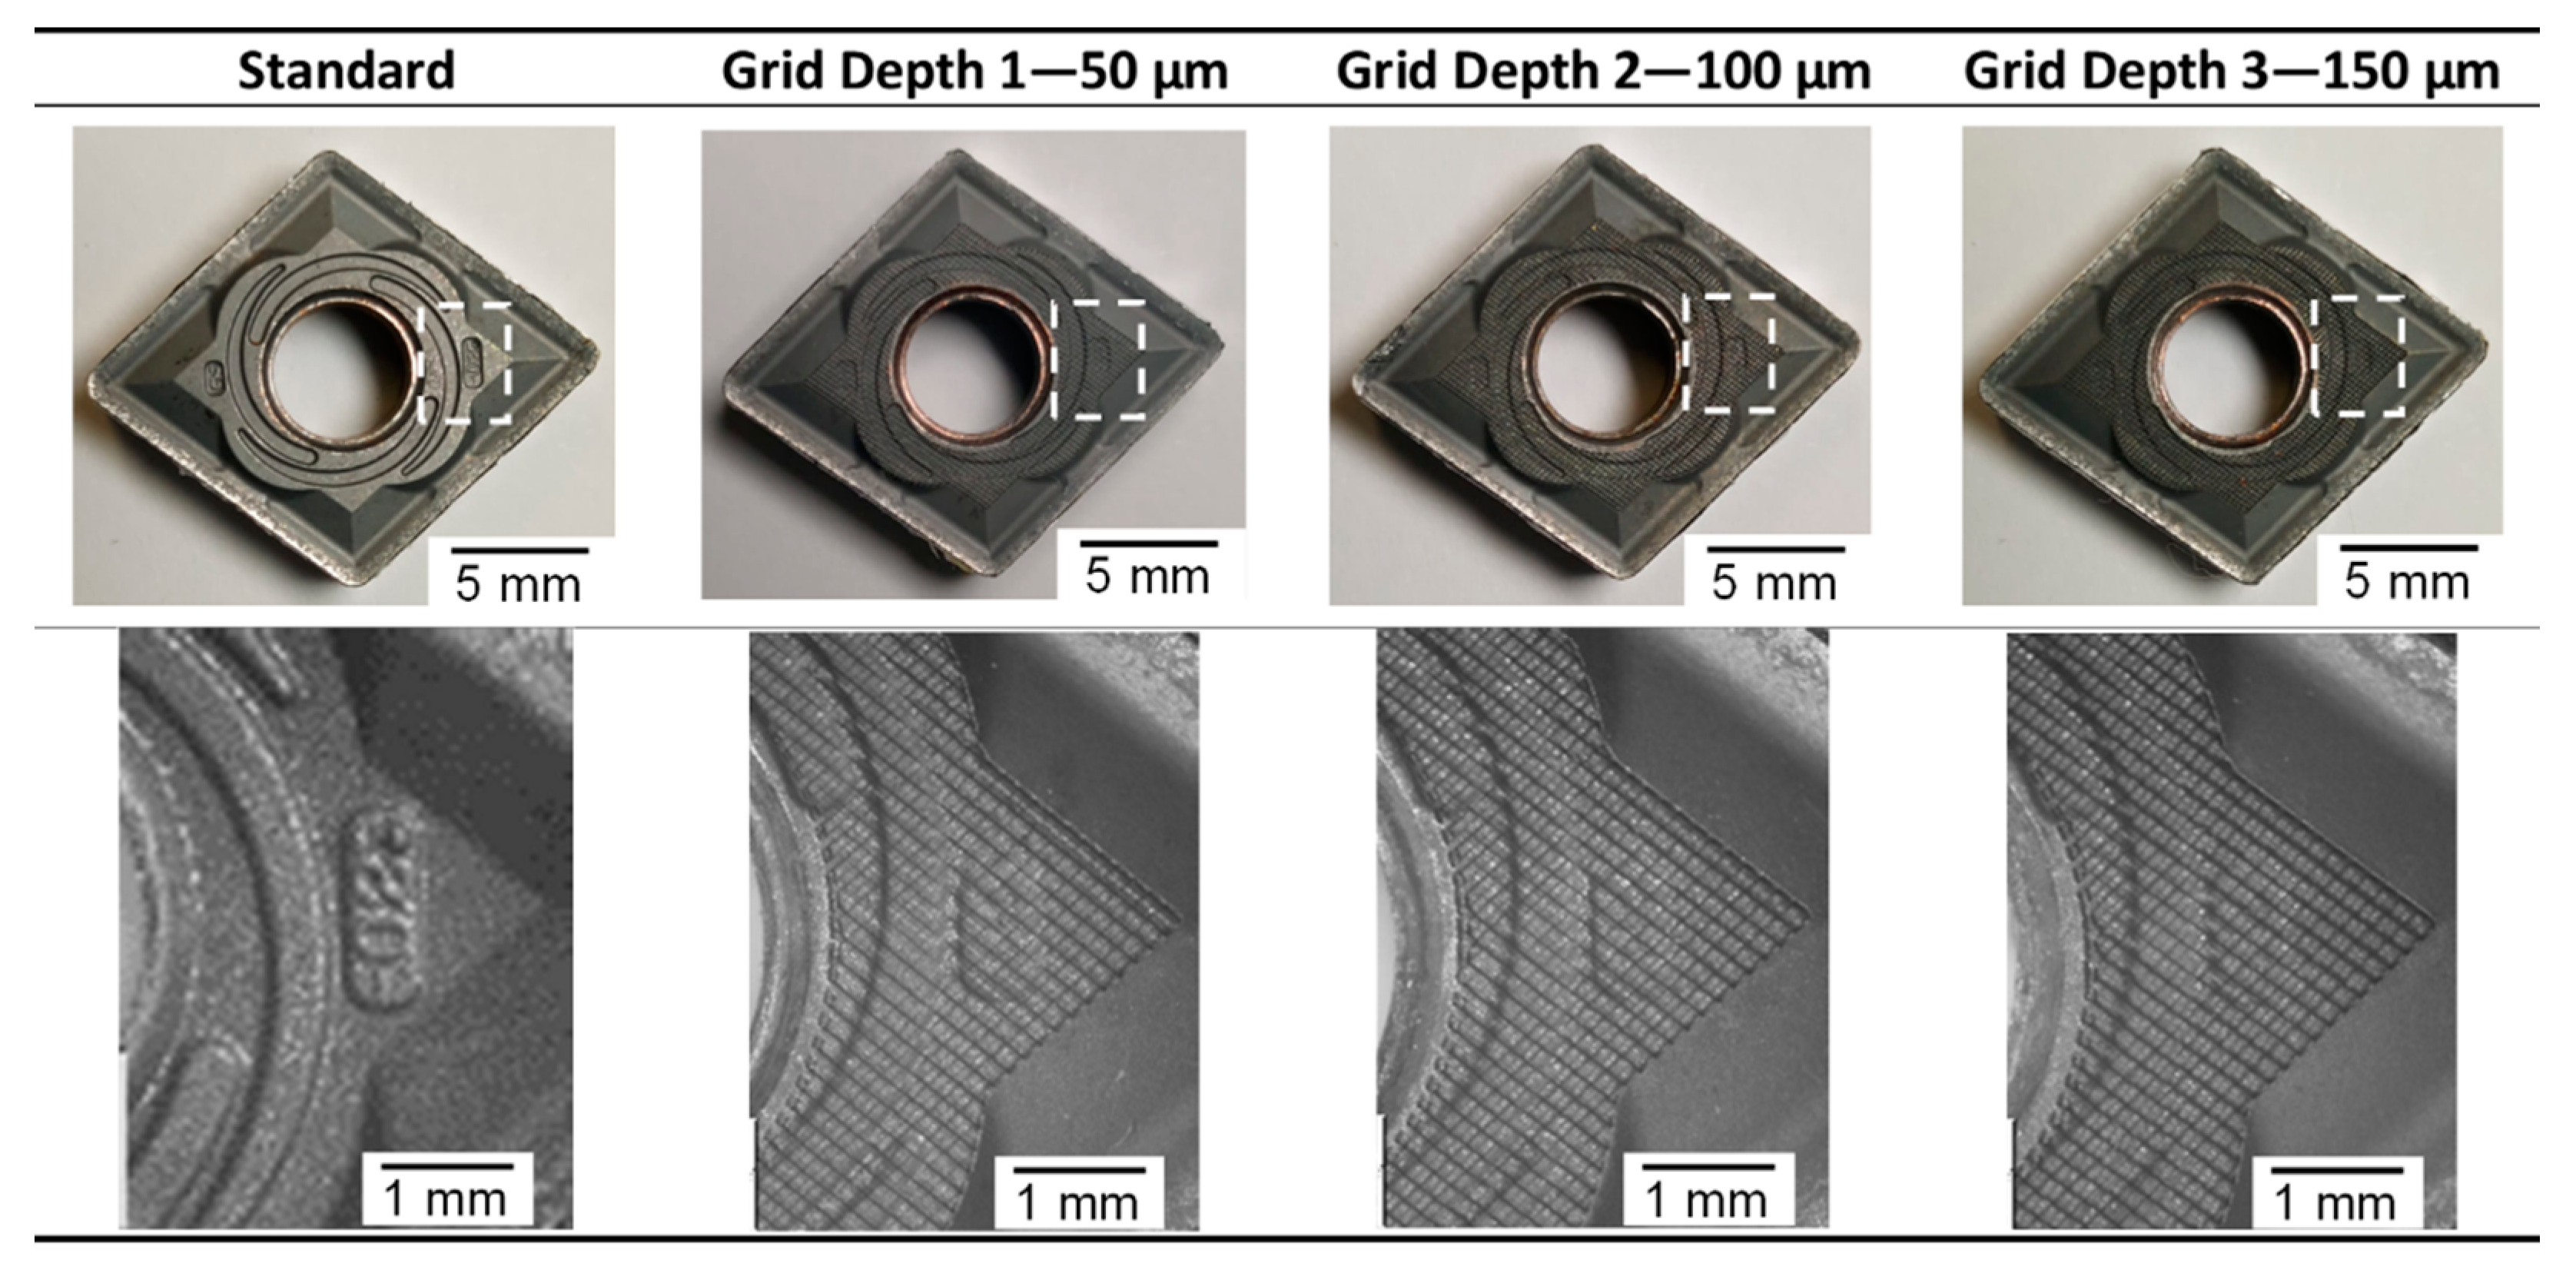
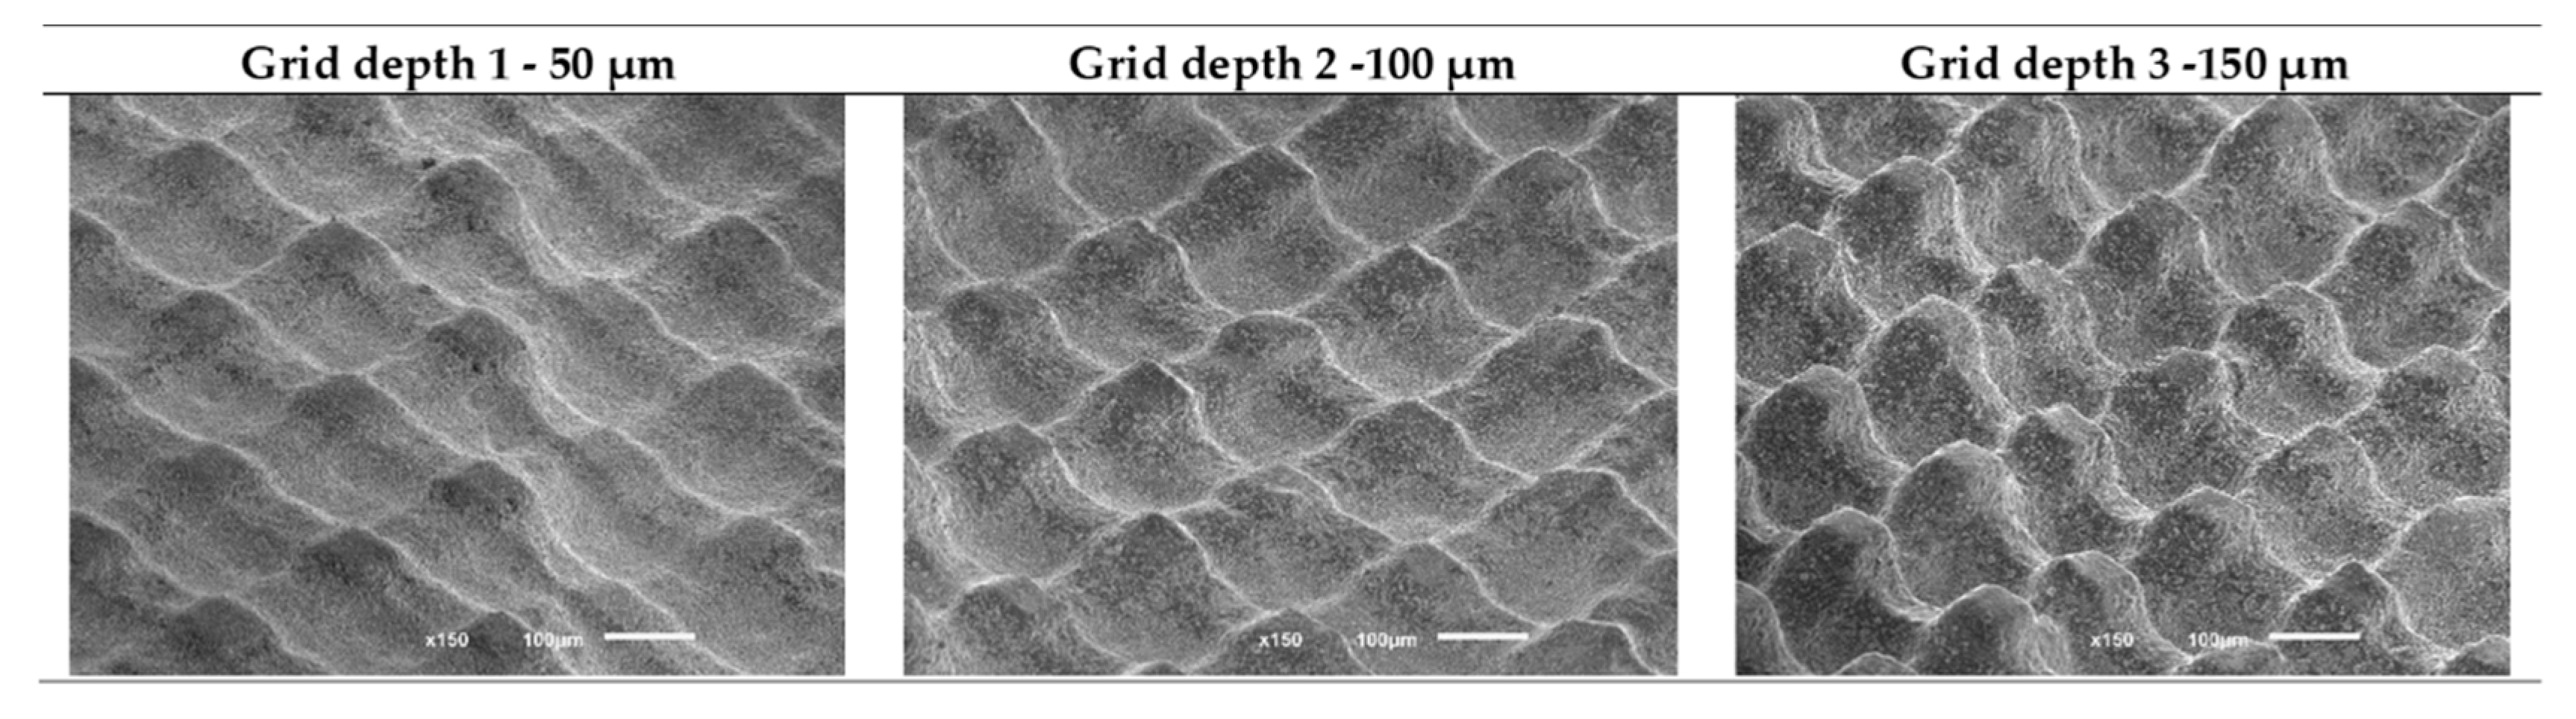
3.1. Surface Micro-Textures Implementation
3.2. Measurement Procedure
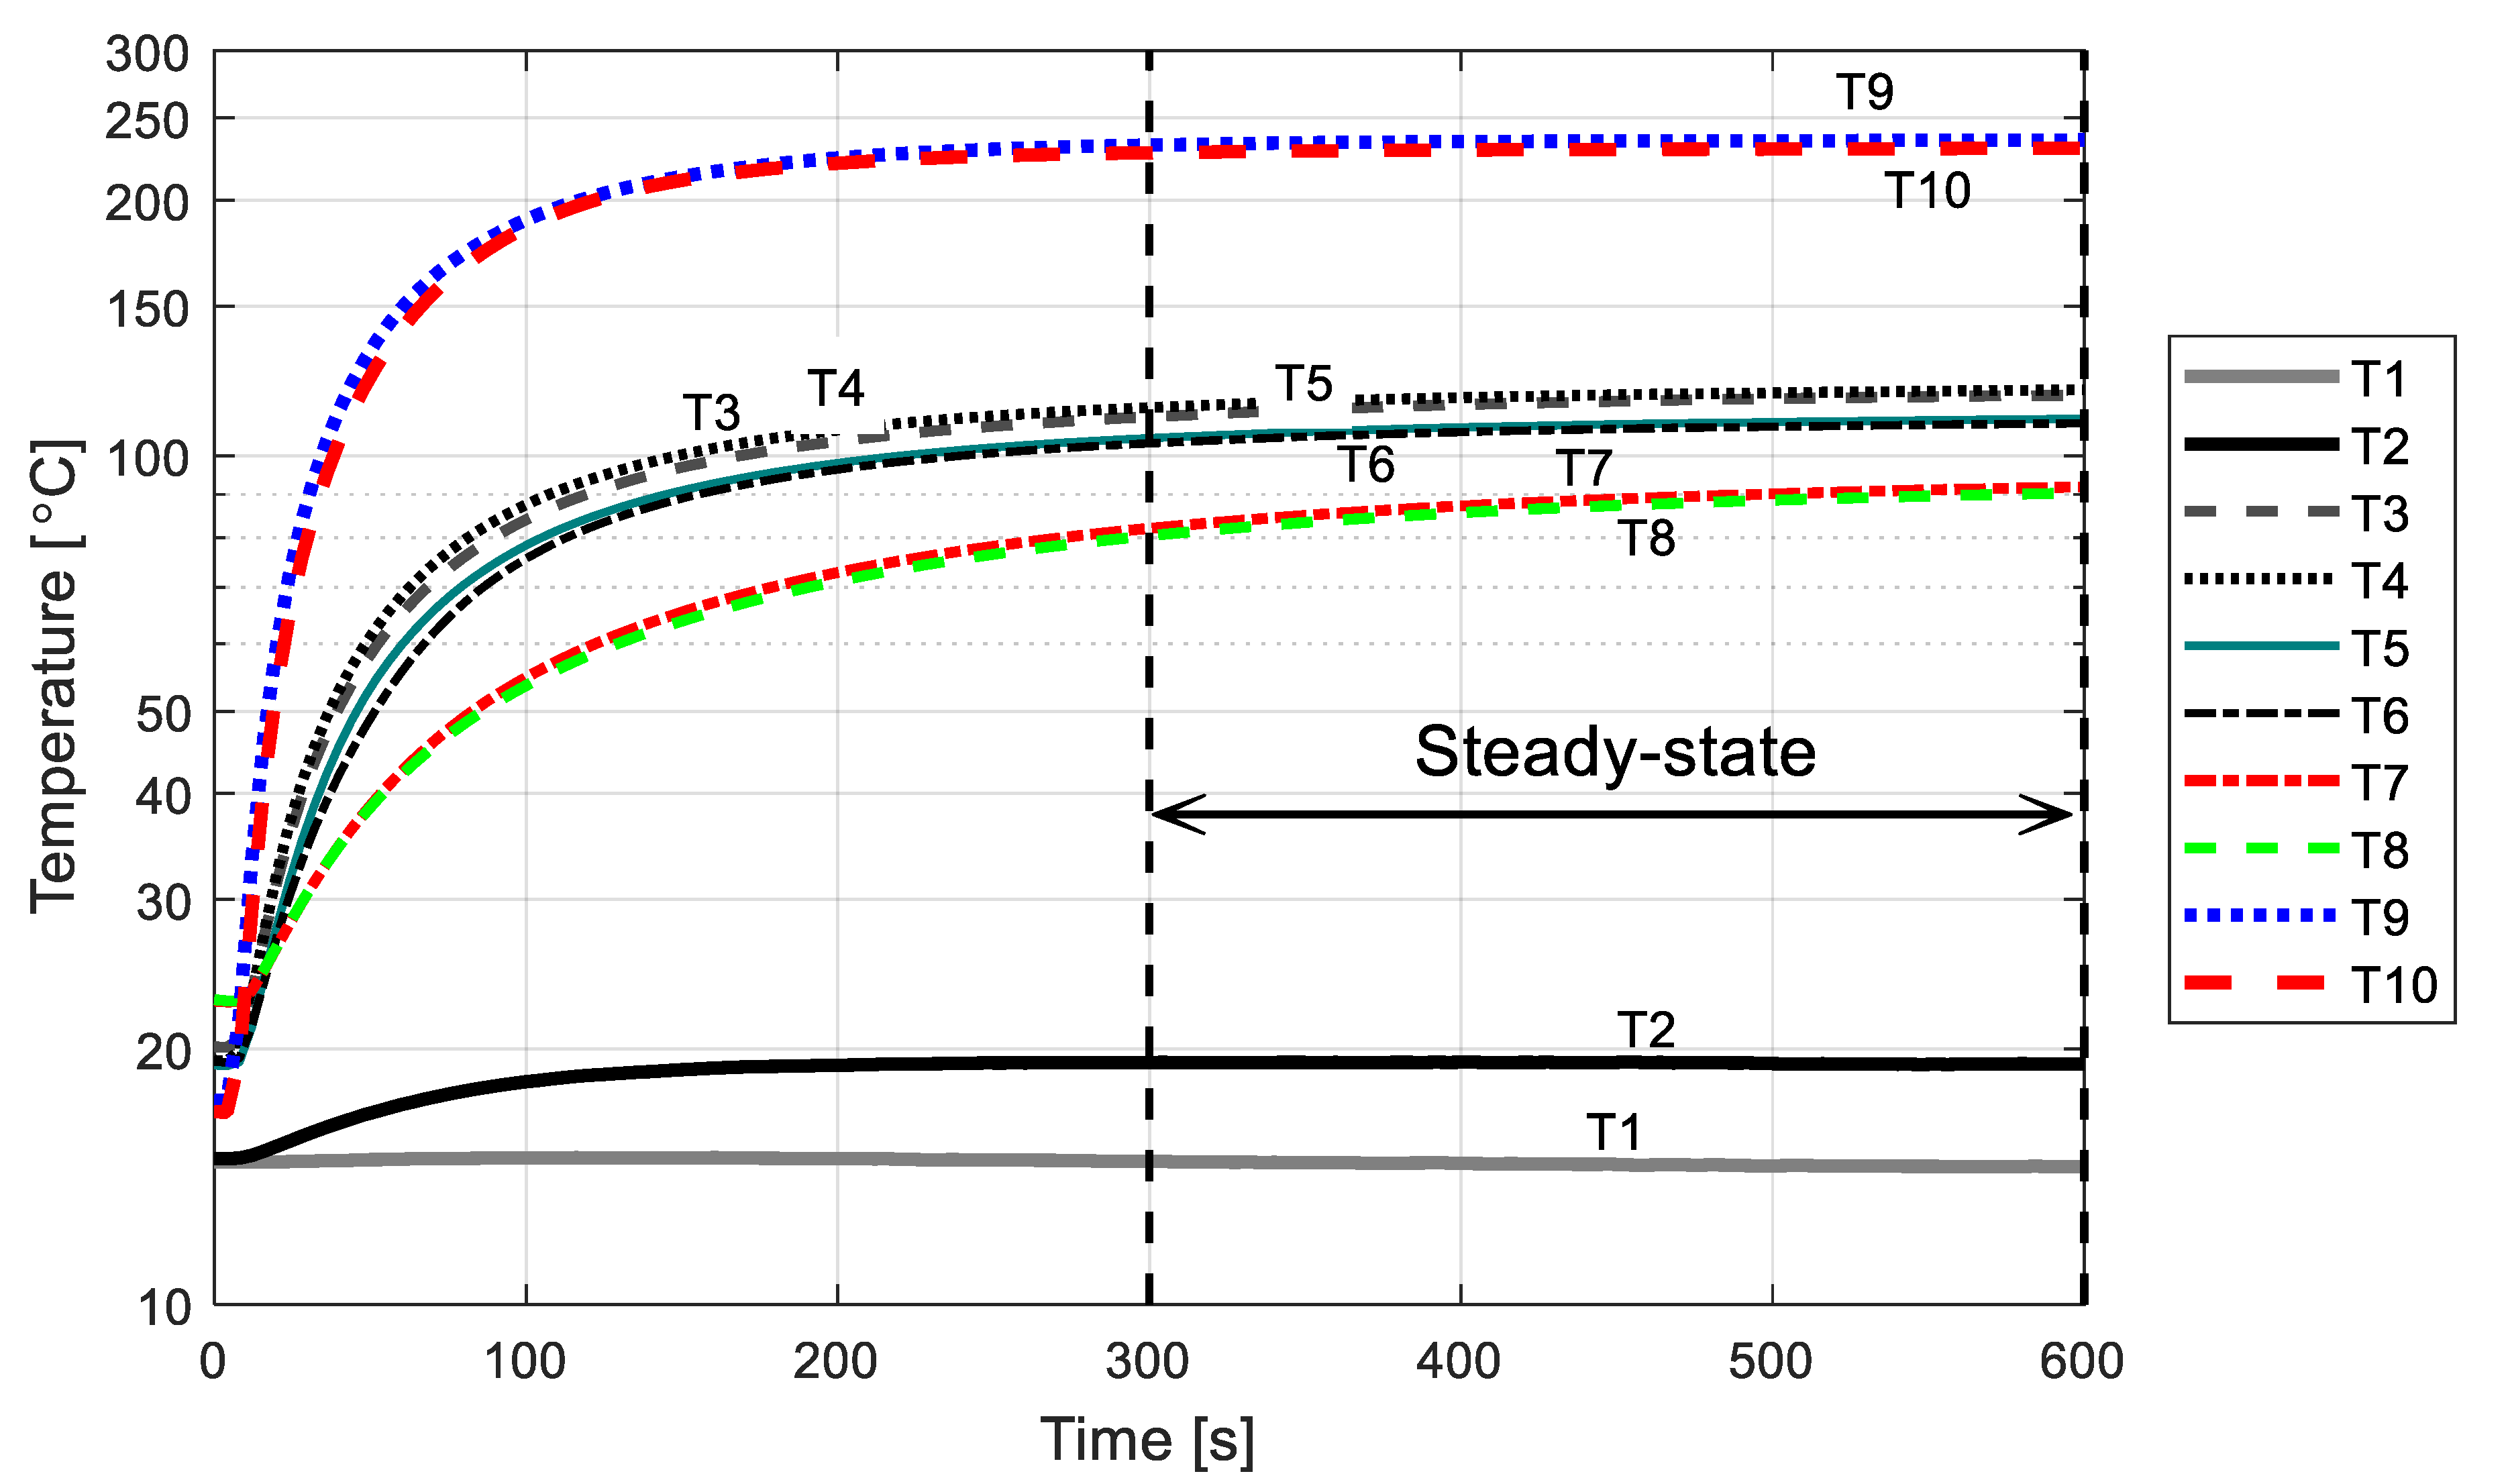
3.3. Experimental Device Validation
3.4. Heat Transfer Rate Results and Discussion
4. Conclusions
Author Contributions
Funding
Acknowledgments
Conflicts of Interest
References
- Kamperidou, V.; Barboutis, I. Lathe Tool—It’s Development from the Ancient Times to Nowadays; Faculty of Forestry, Zagreb University: Zagreb, Croatia, 2013; pp. 57–64. [Google Scholar]
- Tamil Alagan, N.; Zeman, P.; Hoier, P.; Beno, T.; Klement, U. Investigation of micro-textured cutting tools used for face turning of alloy 718 with high-pressure cooling. J. Manuf. Process. 2019, 37, 606–616. [Google Scholar] [CrossRef]
- Alagan, N.T.; Beno, T.; Hoier, P.; Klement, U.; Wretland, A. Influence of surface features for increased heat dissipation on tool wear. Materials 2018, 11, 664. [Google Scholar] [CrossRef] [Green Version]
- Alagan, N.T.; Beno, T.; Wretland, A. Investigation of Modified Cutting Insert with Forced Coolant Application in Machining of Alloy 718. Procedia CIRP 2016, 42, 481–486. [Google Scholar] [CrossRef]
- Panigrahi, R.R.; Panda, A.; Sahoo, A.K.; Kumar, R. Machining performance measures of high temperature heat resistant super alloys: A review. Mater. Today Proc. 2019, 18, 4524–4530. [Google Scholar] [CrossRef]
- Singh, J.; Gill, S.S.; Dogra, M.; Singh, R. A review on cutting fluids used in machining processes. Eng. Res. Express 2021, 3, 012002. [Google Scholar] [CrossRef]
- Obikawa, T.; Kamata, Y.; Asano, Y.; Nakayama, K.; Otieno, A.W. Micro-liter lubrication machining of Inconel 718. Int. J. Mach. Tools Manuf. 2008, 48, 1605–1612. [Google Scholar] [CrossRef]
- Chiou, R.Y.; Lu, L.; Chen, J.S.J.; North, M.T. Investigation of dry machining with embedded heat pipe cooling by finite element analysis and experiments. Int. J. Adv. Manuf. Technol. 2007, 31, 905–914. [Google Scholar] [CrossRef]
- Vicentin, G.C.; Sanchez, L.E.A.; Scalon, V.L.; Abreu, G.G.C. A sustainable alternative for cooling the machining processes using a refrigerant fluid in recirculation inside the toolholder. Clean Technol. Environ. Policy 2011, 13, 831–840. [Google Scholar] [CrossRef]
- Sharma, V.S.; Dogra, M.; Suri, N.M. Cooling techniques for improved productivity in turning. Int. J. Mach. Tools Manuf. 2009, 49, 435–453. [Google Scholar] [CrossRef]
- Sun, X.; Bateman, R.; Cheng, K.; Ghani, S.C. Design and analysis of an internally cooled smart cutting tool for dry cutting. Proc. Inst. Mech. Eng. Part B J. Eng. Manuf. 2012, 226, 585–591. [Google Scholar] [CrossRef]
- Sugihara, T.; Tanaka, H.; Enomoto, T. Development of Novel CBN Cutting Tool for High Speed Machining of Inconel 718 Focusing on Coolant Behaviors. Procedia Manuf. 2017, 10, 436–442. [Google Scholar] [CrossRef]
- Feng, Y.; Zhang, J.; Wang, L.; Zhang, W.; Tian, Y.; Kong, X. Fabrication techniques and cutting performance of micro-textured self-lubricating ceramic cutting tools by in-situ forming of Al2O3-TiC. Int. J. Refract. Met. Hard Mater. 2017, 68, 121–129. [Google Scholar] [CrossRef]
- Sharma, V.; Pandey, P.M. Recent advances in turning with textured cutting tools: A review. J. Clean. Prod. 2016, 137, 701–715. [Google Scholar] [CrossRef]
- Ribeiro, F.S.F.; Lopes, J.C.; Bianchi, E.C.; de Angelo Sanchez, L.E. Applications of texturization techniques on cutting tools surfaces—A survey. Int. J. Adv. Manuf. Technol. 2020, 109, 1117–1135. [Google Scholar] [CrossRef]
- Enomoto, T.; Sugihara, T.; Yukinaga, S.; Hirose, K.; Satake, U. Highly wear-resistant cutting tools with textured surfaces in steel cutting. CIRP Ann. Manuf. Technol. 2012, 61, 571–574. [Google Scholar] [CrossRef]
- Machado, A.R.; da Silva, L.R.R.; de Souza, F.C.R.; Davis, R.; Pereira, L.C.; Sales, W.F.; de Rossi, W.; Ezugwu, E.O. State of the art of tool texturing in machining. J. Mater. Process. Technol. 2021, 293, 117096. [Google Scholar] [CrossRef]
- Sugihara, T.; Enomoto, T. Improving anti-adhesion in aluminum alloy cutting by micro stripe texture. Precis. Eng. 2012, 36, 229–237. [Google Scholar] [CrossRef]
- Chen, Y.; Wang, J.; Chen, M. Enhancing the machining performance by cutting tool surface modifications: A focused review. Mach. Sci. Technol. 2019, 23, 477–509. [Google Scholar] [CrossRef]
- Liao, Z.; Xu, D.; Axinte, D.; M’Saoubi, R.; Thelin, J.; Wretland, A. Novel cutting inserts with multi-channel irrigation at the chip-tool interface: Modelling, design and experiments. CIRP Ann. 2020, 69, 65–68. [Google Scholar] [CrossRef]
- Fang, S.; Herrmann, T.; Rosenkranz, A.; Gachot, C.; Marro, F.G.; Mücklich, F.; Llanes, L.; Bähre, D. Tribological Performance of Laser Patterned Cemented Tungsten Carbide Parts. Procedia CIRP 2016, 42, 439–443. [Google Scholar] [CrossRef] [Green Version]
- Guimarães, B.; Silva, J.; Fernandes, C.M.; Figueiredo, D.; Carvalho, O.; Miranda, G.; Silva, F.S. Understanding drop spreading behaviour on WC-10wt%Co cutting tools—An experimental and numerical study. Colloids Surf. A Physicochem. Eng. Asp. 2022, 637, 128268. [Google Scholar] [CrossRef]
- Guimarães, B.; Fernandes, C.M.; Figueiredo, D.; Carvalho, O.; Silva, F.S.; Miranda, G. Effect of laser surface texturing on the wettability of WC-Co cutting tools. Int. J. Adv. Manuf. Technol. 2020, 111, 1991–1999. [Google Scholar] [CrossRef]
- Pang, M.; Liu, X.; Liu, K. Effect of wettability on the friction of a laser-textured cemented carbide surface in dilute cutting fluid. Adv. Mech. Eng. 2017, 9, 1–9. [Google Scholar] [CrossRef] [Green Version]
- Zhao, Y.; Lu, Q.; Li, M.; Li, X. Anisotropic Wetting Characteristics on Submicrometer-Scale Periodic Grooved Surface. Langmuir 2007, 23, 6212–6217. [Google Scholar] [CrossRef]
- Özel, T.; Biermann, D.; Enomoto, T.; Mativenga, P. Structured and textured cutting tool surfaces for machining applications. CIRP Ann. 2021, 70, 495–518. [Google Scholar] [CrossRef]
- Zhang, K.; Deng, J.; Xing, Y.; Li, S.; Gao, H. Effect of microscale texture on cutting performance of WC/Co-based TiAlN coated tools under different lubrication conditions. Appl. Surf. Sci. 2015, 326, 107–118. [Google Scholar] [CrossRef]
- Lei, S.; Devarajan, S.; Chang, Z. A study of micropool lubricated cutting tool in machining of mild steel. J. Mater. Process. Technol. 2009, 209, 1612–1620. [Google Scholar] [CrossRef]
- Kawasegi, N.; Sugimori, H.; Morimoto, H.; Morita, N.; Hori, I. Development of cutting tools with microscale and nanoscale textures to improve frictional behavior. Precis. Eng. 2009, 33, 248–254. [Google Scholar] [CrossRef]
- Sugihara, T.; Enomoto, T. Development of a cutting tool with a nano/micro-textured surface—Improvement of anti-adhesive effect by considering the texture patterns. Precis. Eng. 2009, 33, 425–429. [Google Scholar] [CrossRef]
- Sakkaki, M.; Sadegh Moghanlou, F.; Vajdi, M.; Pishgar, F.; Shokouhimehr, M.; Shahedi Asl, M. The effect of thermal contact resistance on the temperature distribution in a WC made cutting tool. Ceram. Int. 2019, 45, 22196–22202. [Google Scholar] [CrossRef]
- Kim, D.M.; Lee, I.; Kim, S.K.; Kim, B.H.; Park, H.W. Influence of a micropatterned insert on characteristics of the tool–workpiece interface in a hard turning process. J. Mater. Process. Technol. 2016, 229, 160–171. [Google Scholar] [CrossRef]
- Fang, Z.; Obikawa, T. Influence of cutting fluid flow on tool wear in high-pressure coolant turning using a novel internally cooled insert. J. Manuf. Process. 2020, 56, 1114–1125. [Google Scholar] [CrossRef]
- Kitagawa, T.; Kubo, A.; Maekawa, K. Temperature and wear of cutting tools in high-speed machining of Inconel 718 and Ti-6Al-6V-2Sn. Wear 1997, 202, 142–148. [Google Scholar] [CrossRef]
- Shu, S.; Cheng, K.; Ding, H.; Chen, S. An Innovative Method to Measure the Cutting Temperature in Process by Using an Internally Cooled Smart Cutting Tool. J. Manuf. Sci. Eng. 2013, 135, 061018. [Google Scholar] [CrossRef]
- Yao, B.; Sun, W.; Chen, B.; Yu, X.; He, Y.; Feng, W.; Wang, S. An Independent Internal Cooling System for Promoting Heat Dissipation during Dry Cutting with Numerical and Experimental Verification. Appl. Sci. 2017, 7, 332. [Google Scholar] [CrossRef] [Green Version]
- Yang, K.; Liang, Y.-C.; Zheng, K.-N.; Bai, Q.-S.; Chen, W.-Q. Tool edge radius effect on cutting temperature in micro-end-milling process. Int. J. Adv. Manuf. Technol. 2011, 52, 905–912. [Google Scholar] [CrossRef] [Green Version]
- Longbottom, J.M.; Lanham, J.D. Cutting temperature measurement while machining—A review. Aircr. Eng. Aerosp. Technol. 2005, 77, 122–130. [Google Scholar] [CrossRef]
- Komanduri, R.; Hou, Z.B. A review of the experimental techniques for the measurement of heat and temperatures generated in some manufacturing processes and tribology. Tribol. Int. 2001, 34, 653–682. [Google Scholar] [CrossRef]
- Ranjan, P.; Hiremath, S.S. Role of textured tool in improving machining performance: A review. J. Manuf. Process. 2019, 43, 47–73. [Google Scholar] [CrossRef]
- Çengel, Y.A.; Ghajar, A.J. Heat and Mass Transfer Fundamentals & Applications, 5th ed.; McGraw-Hill Education: New York, NY, USA, 2015; p. 1208. [Google Scholar]
- Kataria, R.; Kumar, J. Machining of WC-Co Composites—A Review. Mater. Sci. Forum 2015, 808, 51–64. [Google Scholar] [CrossRef]
- Guimarães, B.; Figueiredo, D.; Fernandes, C.M.; Silva, F.S.; Miranda, G.; Carvalho, O. Laser machining of WC-Co green compacts for cutting tools manufacturing. Int. J. Refract. Met. Hard Mater. 2019, 81, 316–324. [Google Scholar] [CrossRef]


| Component | Material | Mass Density [kg/m3] | Specific Heat [J/kg.K] | Thermal Conductivity [W/m.K] |
|---|---|---|---|---|
| Main body | AISI 1010 Steel | 7849.80 ± 50.00 | 442.63 ± 20.00 | 56.59 ± 6.00 |
| Top chamber | Aluminium 6082-t6 | 2699.80 ± 30.00 | 899.82 ± 18.00 | 171.97 ± 3.00 |
| Heat sources | Aluminium 6082-t6 | 2699.80 ± 30.00 | 899.82 ± 18.00 | 171.97 ± 3.00 |
| Cutting insert | WC-Co 90-10 | 14,550.00 ± 150.00 | 209.00 ± 4.00 | 89.50 ± 3.50 |
| Support seat | WC-Co 90-10 | 14,550.00 ± 150.00 | 209.00 ± 4.00 | 89.50 ± 3.50 |
| Main stud | AISI 1015 | 7849.80 ± 50.00 | 442.63 ± 20.00 | 52.02 ± 2.00 |
| Nut | AISI 1015 | 7849.80 ± 50.00 | 442.63 ± 20.00 | 52.02 ± 2.00 |
| Core | PET-G | 1339.10 ± 50.00 | 1199.00 ± 50.00 | 0.17 ± 0.0065 |
| Guide pin | AISI 304 Stainless Steel | 7954.30 ± 105.00 | 473.62 ± 20.00 | 14.92 ± 1.50 |
| Resistive element | AISI 304 Stainless Steel | 7954.30 ± 105.00 | 473.62 ± 20.00 | 14.92 ± 1.50 |
| Input Power [W] | T1 [°C] | T2 [°C] | ∆T [°C] | Mass Flow Rate [g/s] | Heat Transfer Rate [W] |
|---|---|---|---|---|---|
| 100 | 15.22 | 16.39 | 1.17 | 15.6 | 76.41 |
| 200 | 15.25 | 17.57 | 2.32 | 15.6 | 151.29 |
| 300 | 15.27 | 18.73 | 3.46 | 15.6 | 226.09 |
| 400 | 15.29 | 19.88 | 4.59 | 15.6 | 299.65 |
| Input Power [W] | T1 [°C] | T2 [°C] | ∆T [°C] | Mass Flow Rate [g/s] | Heat Transfer Rate [W] |
|---|---|---|---|---|---|
| 100 | 15.68 ± 0.11 | 16.89 ± 0.10 | 1.21 ± 0.01 | 15.64 ± 0.0481 | 79.16 ± 0.23 |
| 200 | 15.74 ± 0.11 | 18.04 ± 0.11 | 2.29 ± 0.01 | 15.58 ± 0.0337 | 149.67 ± 0.41 |
| 300 | 15.50 ± 0.35 | 18.91 ± 0.34 | 3.40 ± 0.01 | 15.57 ± 0.0144 | 221.87 ± 0.24 |
| 400 | 15.62 ± 0.32 | 20.19 ± 0.33 | 4.57 ± 0.01 | 15.64 ± 0.0481 | 299.16 ± 0.40 |
| Insert Model | Sample | T1 [°C] | T2 [°C] | ∆T [°C] | Mass Flow Rate [g/s] | Sample Heat Transfer Rate [W] | Insert Model Heat Transfer Rate [W] |
|---|---|---|---|---|---|---|---|
| Standard | 1 | 15.96 ± 0.58 | 20.47 ± 0.60 | 4.51 ± 0.01 | 15.89 ± 0.0538 | 300.16 ± 1.36 | 299.20 ± 0.84 |
| 2 | 15.90 ± 0.46 | 20.36 ± 0.46 | 4.46 ± 0.02 | 15.99 ± 0.0478 | 298.60 ± 0.84 | ||
| 3 | 16.65 ± 0.73 | 21.11 ± 0.72 | 4.46 ± 0.02 | 16.01 ± 0.0509 | 298.84 ± 0.69 | ||
| Grid depth 1 50 µm | 1 | 15.36 ± 0.35 | 19.85 ± 0.35 | 4.49 ± 0.01 | 15.94 ± 0.0108 | 299.69 ± 0.39 | 302.07 ± 2.44 |
| 2 | 14.19 ± 0.28 | 18.74 ± 0.29 | 4.55 ± 0.01 | 15.98 ± 0.0484 | 304.57 ± 0.42 | ||
| 3 | 16.95 ± 0.58 | 21.45 ± 0.56 | 4.50 ± 0.02 | 16.04 ± 0.0414 | 301.96 ± 0.58 | ||
| Grid depth 2 100 µm | 1 | 14.49 ± 0.31 | 19.08 ± 0.30 | 4.60 ± 0.02 | 15.95 ± 0.0771 | 307.00 ± 1.28 | 306.91 ± 2.44 |
| 2 | 15.33 ± 0.07 | 19.89 ± 0.06 | 4.55 ± 0.01 | 15.97 ± 0.0350 | 304.43 ± 0.89 | ||
| 3 | 18.05 ± 0.50 | 22.64 ± 0.48 | 4.58 ± 0.03 | 16.12 ± 0.0781 | 309.30 ± 0.76 | ||
| Grid depth 3 150 µm | 1 | 14.53 ± 0.26 | 19.18 ± 0.28 | 4.66 ± 0.02 | 15.96 ± 0.0292 | 311.11 ± 1.36 | 310.49 ± 4.13 |
| 2 | 15.69 ± 0.49 | 20.27 ± 0.48 | 4.58 ± 0.02 | 15.98 ± 0.0514 | 306.08 ± 0.12 | ||
| 3 | 14.76 ± 0.30 | 19.42 ± 0.29 | 4.66 ± 0.03 | 16.09 ± 0.0111 | 314.27 ± 0.54 |
Publisher’s Note: MDPI stays neutral with regard to jurisdictional claims in published maps and institutional affiliations. |
© 2022 by the authors. Licensee MDPI, Basel, Switzerland. This article is an open access article distributed under the terms and conditions of the Creative Commons Attribution (CC BY) license (https://creativecommons.org/licenses/by/4.0/).
Share and Cite
Rosas, J.; Lopes, H.; Guimarães, B.; Piloto, P.A.G.; Miranda, G.; Silva, F.S.; Paiva, O.C. Influence of Micro-Textures on Cutting Insert Heat Dissipation. Appl. Sci. 2022, 12, 6583. https://doi.org/10.3390/app12136583
Rosas J, Lopes H, Guimarães B, Piloto PAG, Miranda G, Silva FS, Paiva OC. Influence of Micro-Textures on Cutting Insert Heat Dissipation. Applied Sciences. 2022; 12(13):6583. https://doi.org/10.3390/app12136583
Chicago/Turabian StyleRosas, José, Hernani Lopes, Bruno Guimarães, Paulo A. G. Piloto, Georgina Miranda, Filipe S. Silva, and Olga C. Paiva. 2022. "Influence of Micro-Textures on Cutting Insert Heat Dissipation" Applied Sciences 12, no. 13: 6583. https://doi.org/10.3390/app12136583
APA StyleRosas, J., Lopes, H., Guimarães, B., Piloto, P. A. G., Miranda, G., Silva, F. S., & Paiva, O. C. (2022). Influence of Micro-Textures on Cutting Insert Heat Dissipation. Applied Sciences, 12(13), 6583. https://doi.org/10.3390/app12136583