Article

Analysis on Response of a Single Pile Subjected to Tension Load Considering Excavation Effects

Institute of Geotechnical Engineering, Southeast University, Nanjing 211189, China
*
Authors to whom correspondence should be addressed.
Appl. Sci. 2022, 12(13), 6717; https://doi.org/10.3390/app12136717
Submission received: 31 May 2022 / Revised: 23 June 2022 / Accepted: 30 June 2022 / Published: 2 July 2022

Abstract

:
With the development of urbanization, numerous excavations are carried out to facilitate the development of underground space. As a support for tunnel structures, uplift piles are often installed prior to tunnel excavation. The excavation inevitably causes disturbance to the soil below the excavation surface, changing the soil’s mechanical behavior and stress state significantly. However, there is still a lack of a method to evaluate the change in pile capacity due to excavation. This paper proposes a semi-analytical approach for estimating the change in load-settlement behavior of an uplift pile considering the effects of excavation. A hyperbolic model was adopted to simulate the nonlinear interaction of the pile–soil interface. The nonlinear shear-induced soil displacement outside the pile–soil interface is introduced to obtain a more realistic load-displacement behavior of the uplift pile. An effective iterative program was implemented based on the proposed semi-analytical approach. The comparisons between the results from the proposed methods, well-documented field tests, centrifuge tests, and other analytical methods showed that the proposed approach is suitable for analyzing an uplift pile considering excavation effects. A parametric study was conducted to investigate the effects of main soil properties on the pile capacity loss caused by excavation. The results showed that the soil friction angle and the ratio of the excavation depth to the pile effective length have a great influence on the loss in pile uplift capacity caused by excavation. However, the loss of pile uplift capacity caused by excavation is not affected by the soil’s shear modulus or Poisson’s ratio.

1. Introduction

With the development of urbanization around the world, the demand for extensive underground space utilization has increased dramatically in recent years. To meet these demands, deep excavations are widely used for the construction of geotechnical infrastructures such as tunnels [1], basements [2], bridge foundations [3], and launch shafts for piping [4]. Piles are often installed beneath these infrastructures to bear the uplift or compression loads. As excavation results in stress relief, principal stress rotation, and disturbance to soil [5,6,7,8], the shaft resistance of the piles will decrease [6,9,10]. Therefore, it is crucial to investigate the load-displacement behavior of piles subjected to uplift load in order to check the safety of the pile design.
In engineering applications, piles are often installed before basement and tunnel excavation, especially when using the bottom-up excavation method. Conventionally, the pile load-displacement behavior is evaluated by means of a load test conducted at the ground surface before excavation. Although the shaft resistance within the excavation depth is eliminated by the sleeve, the load test still overestimates the pile capacity due to the stress relief and excavation disturbance. Additionally, excavation beneath a pile-supported building to add basement space has become popular [11]. The bearing features of the pile after a new excavation are different from those before a new excavation [12]. The reasons for the change in pile load-displacement behavior after excavation are stress relief and heave-induced tension. Stress relief decreases the pile capacity and stiffness. Troughton and Platis [13] reported that the base resistance of a pile after excavation decreased by 20%, with a vertical effective stress reduction of 50%. Zheng et al. [14] found that the reduction in the pile capacity could be up to 45% with increasing excavation depth normalized by pile length. For piles under uplift load, Li et al. [15] found that the uplift capacity of the pile decreased by 9.84% with an excavation of 13 m. Tension force develops in a pile after excavation due to soil heave [16]. As the tension force develops, the shaft resistance is mobilized, and the shear stiffness at the interface decreases. Thus, the pile stiffness decreases due to the initial pile–soil slip.
Existing studies have mainly investigated the change in pile load-displacement behavior after excavation through model tests and numerical simulations. The change in pile capacity under compression and tension conditions has been investigated. However, there is still a lack of a method to evaluate the change in pile capacity due to excavation. Numerous methods have been proposed to evaluate the pile capacity [17,18,19,20]. The load transfer approach is a simple but efficient method to analyze the pile response under compression or uplifted load [21]. The load-transfer method incorporates the complex nonlinear pile–soil interaction behavior [22]. Many nonlinear load-transfer functions have been proposed to model the pile–soil interaction, such as the bilinear model [23], the exponential function model [24,25], the softening model [26] and the hyperbolic model [27]. For practical purposes, the hyperbolic model is commonly used in the load-transfer method to evaluate the pile response [17,27]. Consequently, the load-transfer method incorporating the hyperbolic load-transfer method is adopted.
This paper proposes a semi-analytical approach to evaluate the load-displacement behavior of a single uplift pile considering the effects of excavation. First, the pile response during the excavation unloading and pile loading stages was analyzed. The relationship between pile displacement and soil displacement was determined. Then, based on the load-transfer method, a semi-analytical approach incorporating excavation effects was proposed and implemented using an iterative algorithm. The proposed semi-analytical approach was validated by well-documented field tests, centrifuge tests, and other analytical methods. Finally, a parametric study was conducted to investigate the effects of main soil properties on the pile capacity loss with various pile lengths.

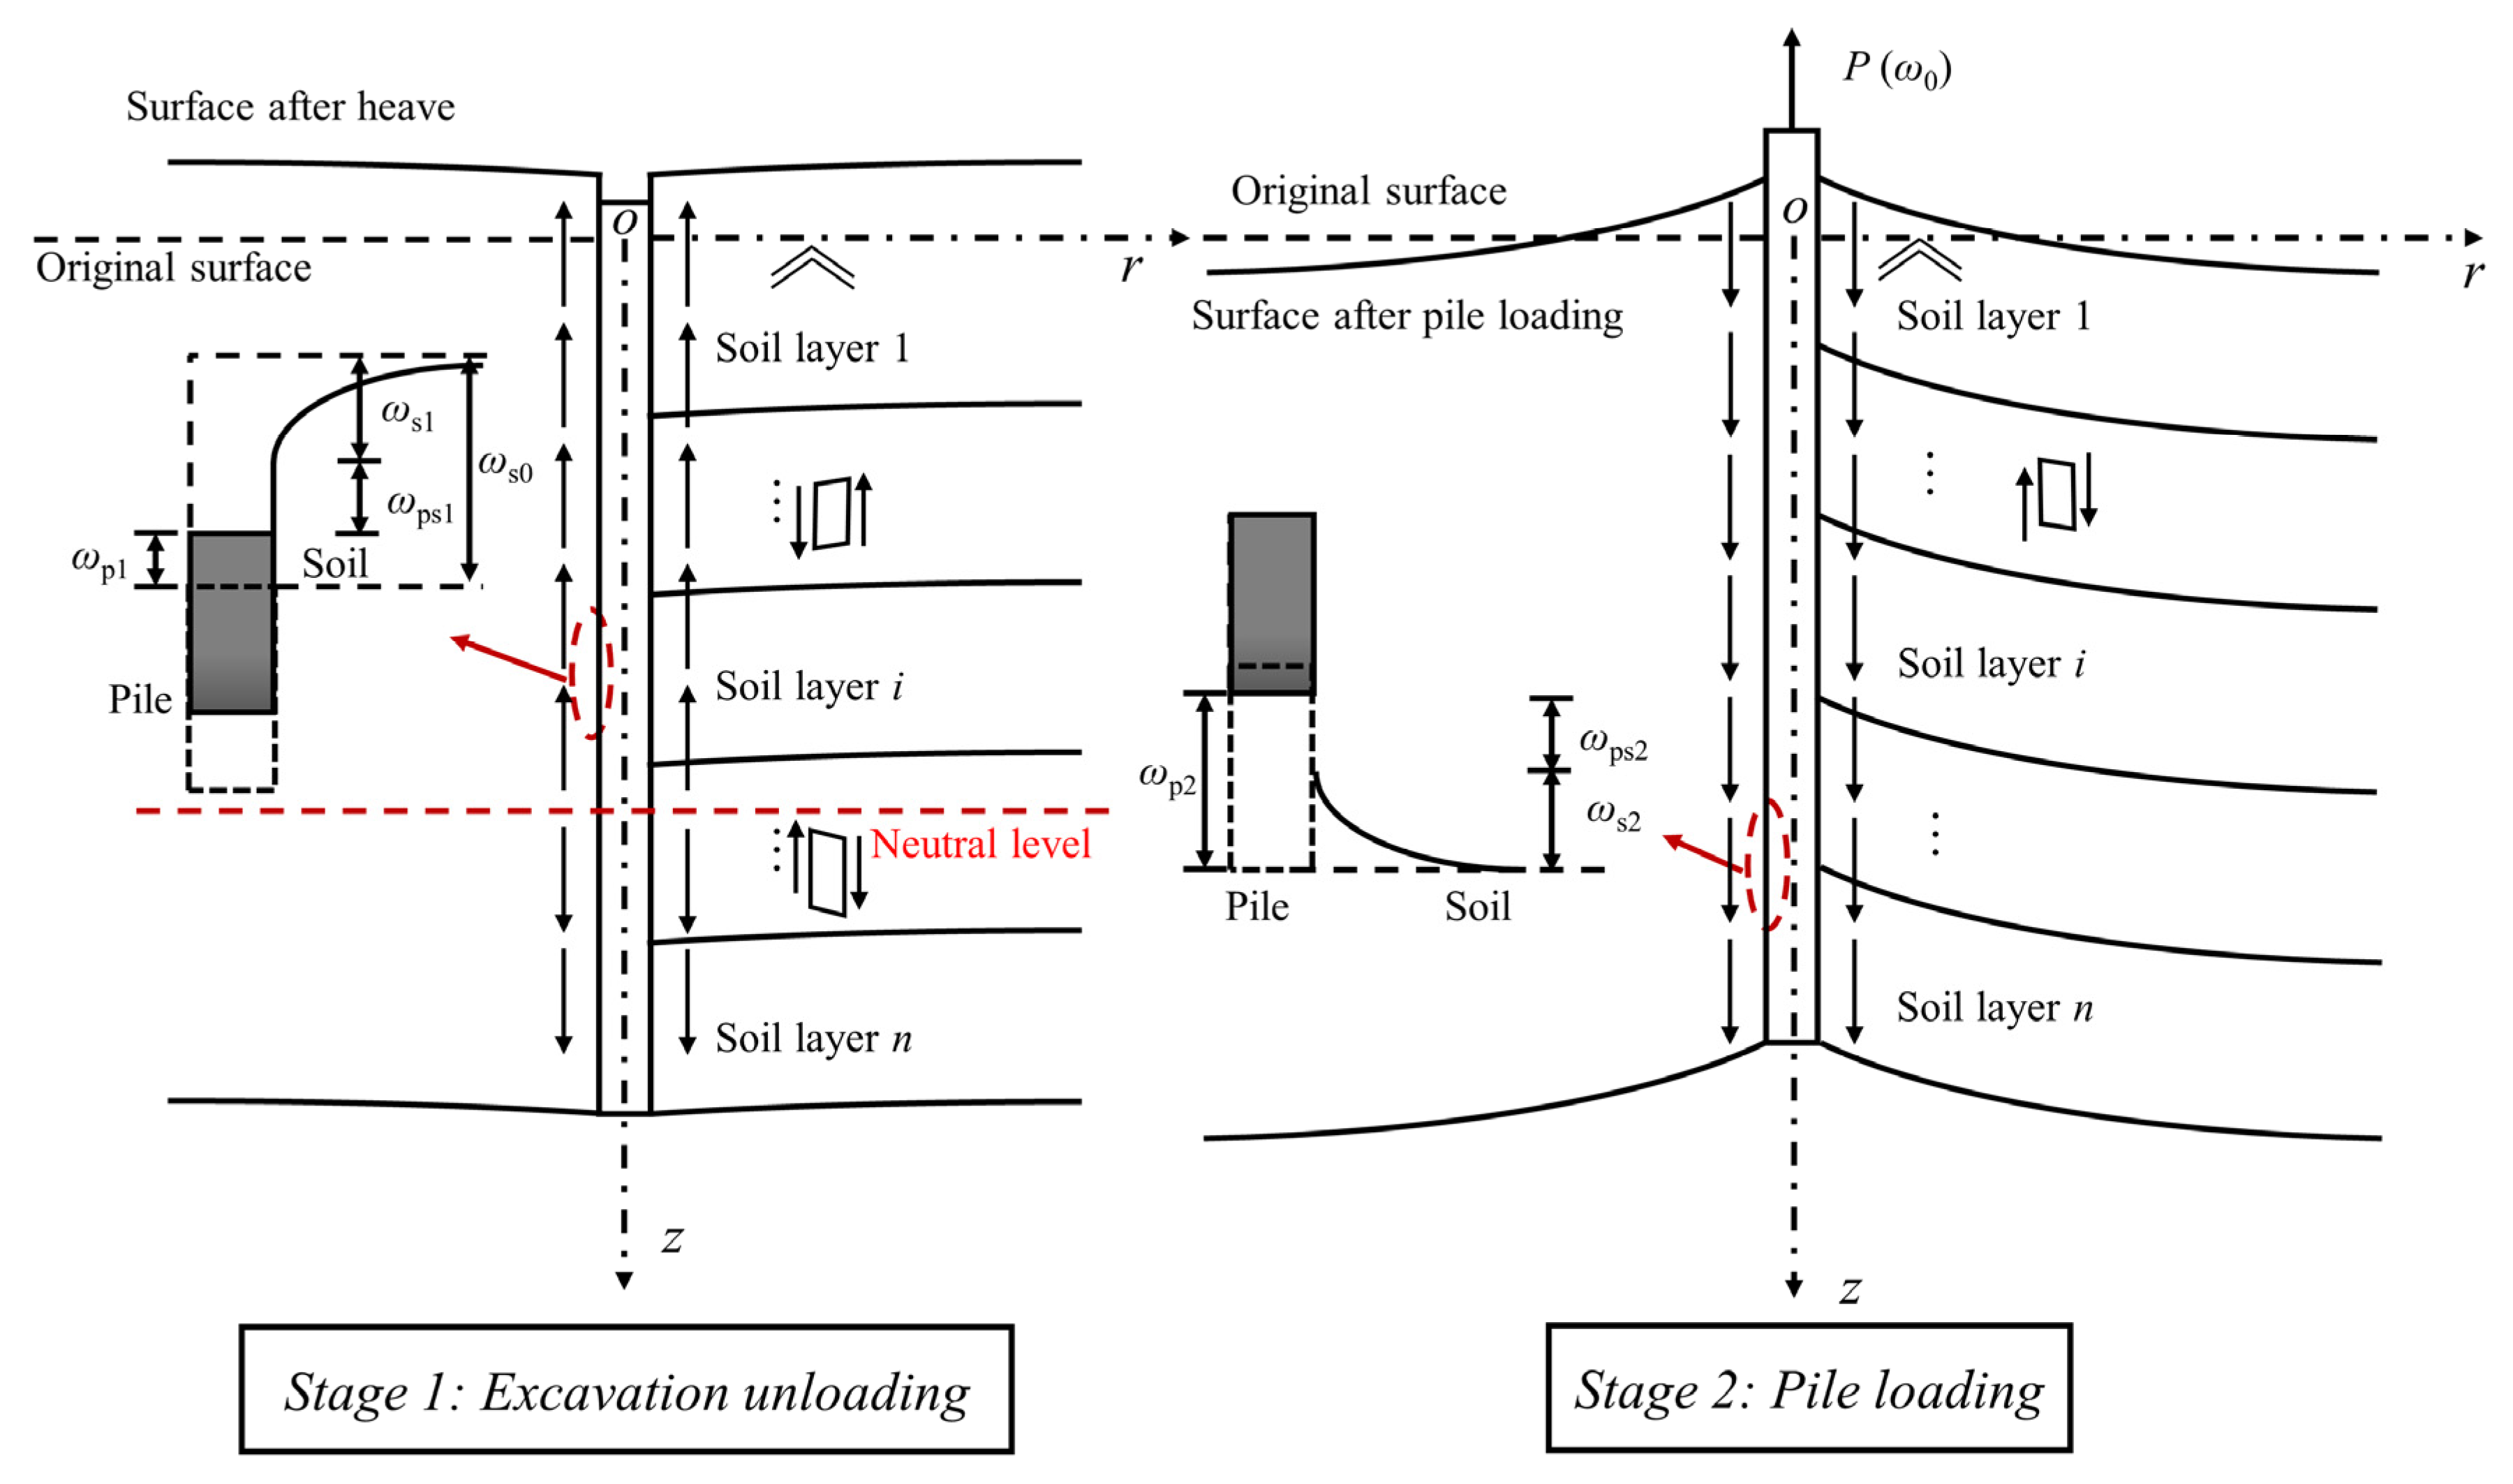
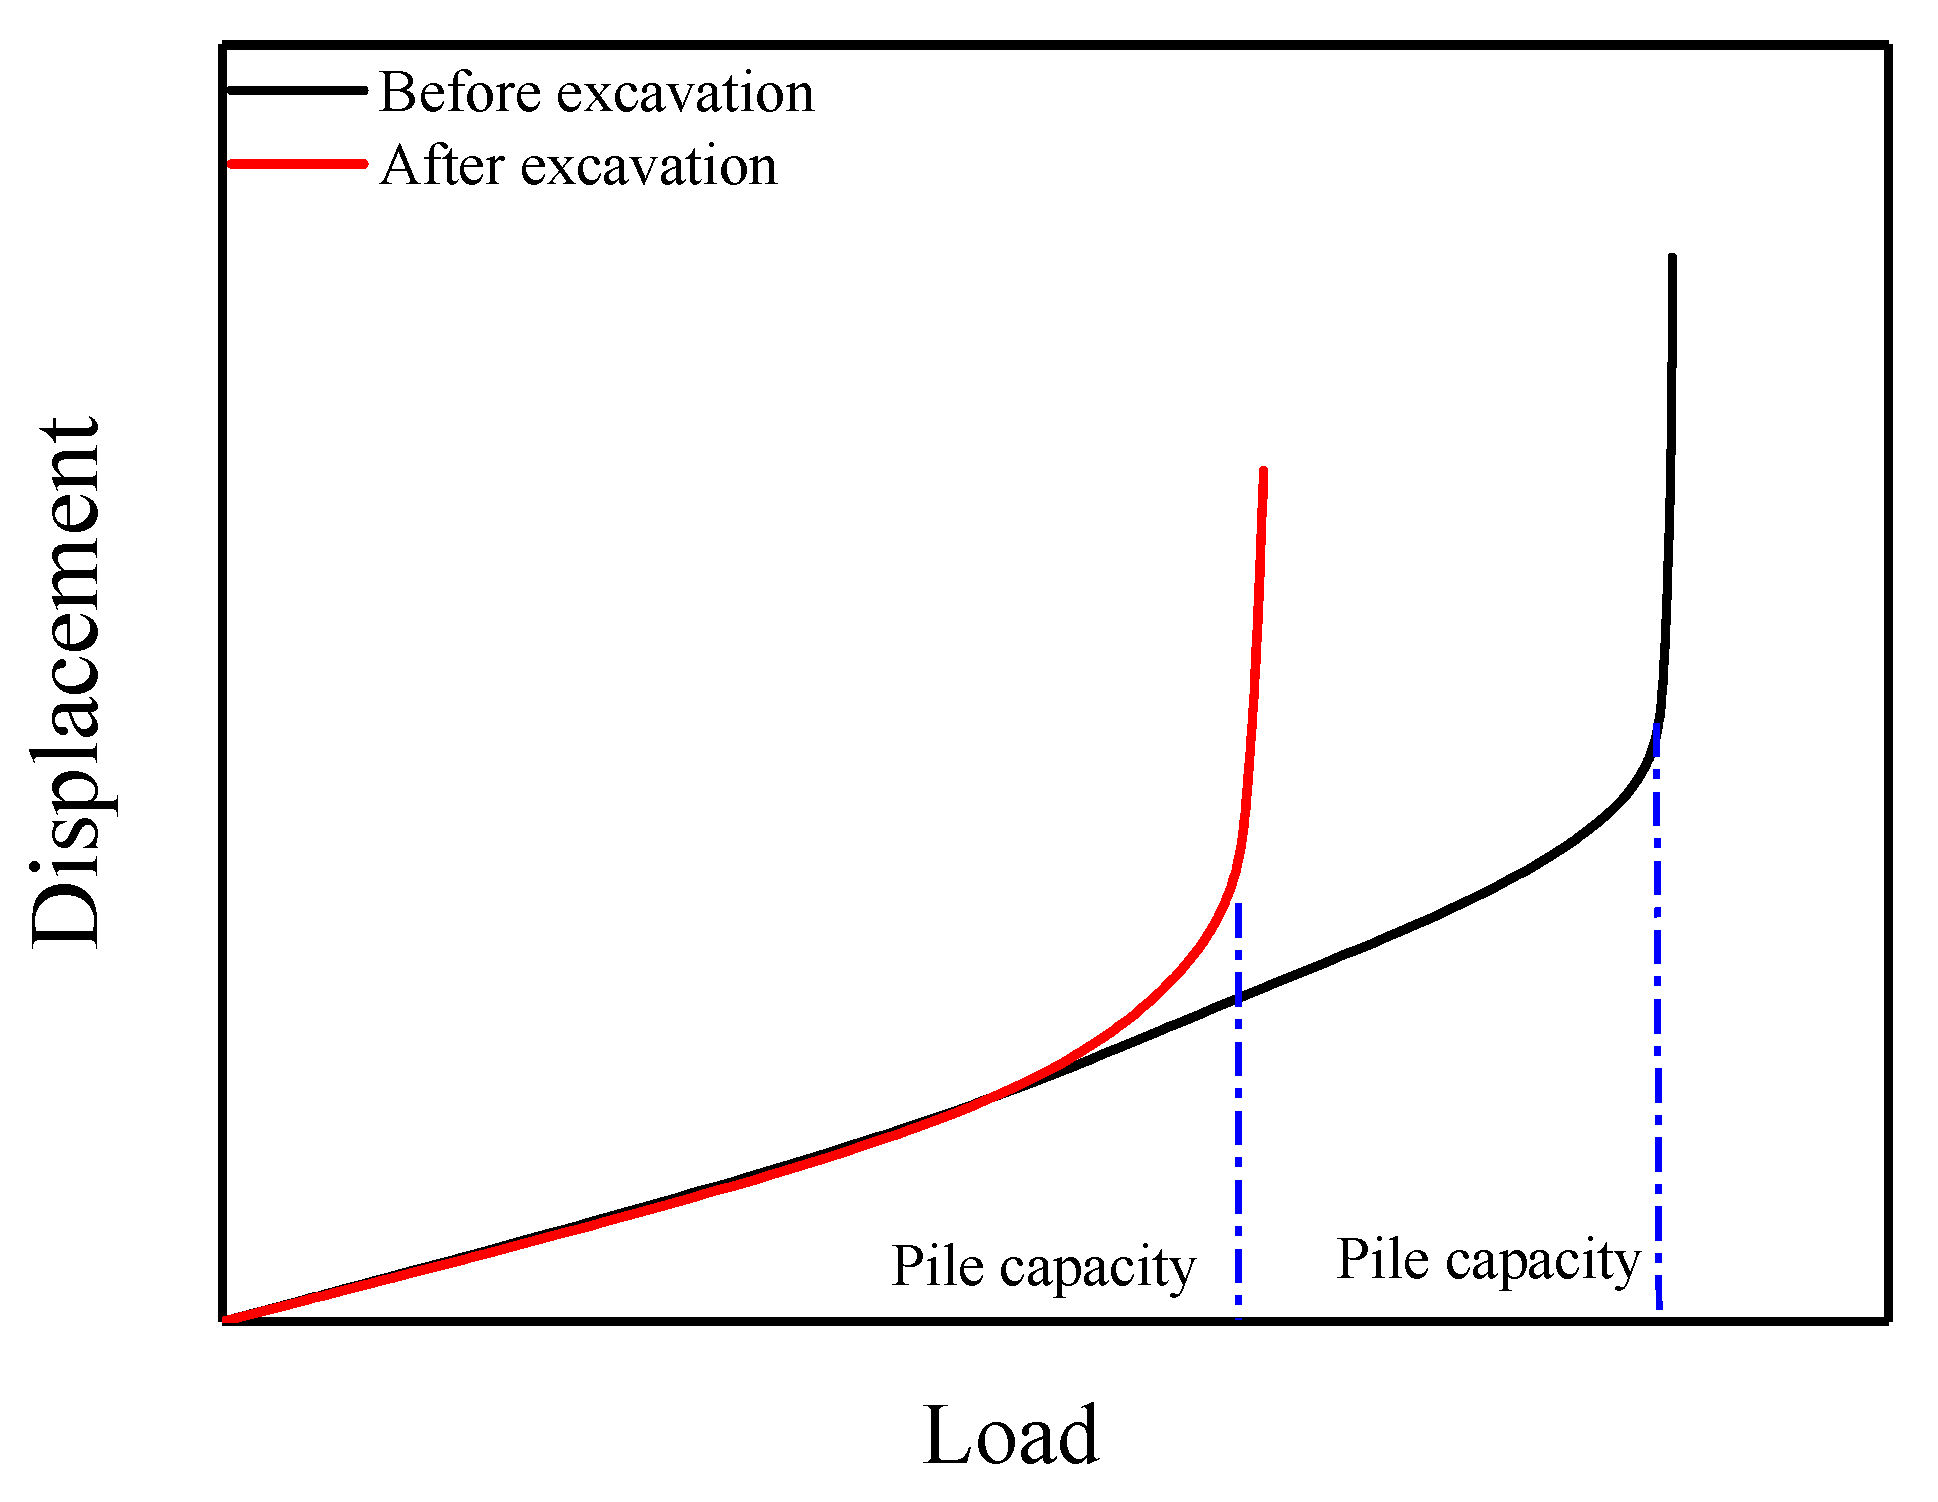
2. Pile Response after Excavation

Figure 1 shows the pile response considering excavation effects. The pile response analysis can be divided into two stages: the excavation unloading and pile loading stages. During the excavation unloading stage, the pile moves upward due to the basal heave. The neutral level, defined as the depth at which the shaft resistance changes from negative to positive, will emerge. Above the neutral level, the pile heave is smaller than the soil heave, resulting in positive shaft resistance. Nevertheless, the pile heave is larger than the soil heave, resulting in negative shaft resistance below the neutral level. Tension force will develop in a pile, and it has a peak value at the neutral level. The relative displacement ω s p 1 at the pile–soil interface is equal to soil greenfield heave displacement ω s 0 minus pile displacement ω p 1 and shear-induced soil displacement ω s τ 1 :
ω s p 1 = ω s 0 ω p 1 ω s τ 1
where subscript 1 represents the variables in the excavation unloading stage; ω s p is the relative displace between pile and soil; ω s 0 is the soil greenfield heave displacement. The greenfield soil displacement is defined as soil heave that occurs without the presence of a pile; ω p is the pile displacement; ω s τ is the shear-induced soil displacement. The shear-induced soil displacement ω s τ is defined as the soil displacement caused by the shear stress between the pile and surrounding soil.
During the pile loading stage, a tension load is applied on the pile head, and the pile will move upward. The positive shaft resistance above the neutral level will change to negative shaft resistance, and the negative shaft resistance below the neutral level will increase. Consequently, the neutral level will move upward and disappear during the loading stage, and negative shaft resistance will develop along with the pile. The relative displacement at pile–soil interface ω s p 2 is equal to the pile displacement ω p 2 plus pile–soil relative displacement at the excavation unloading stage ω s p 1 minus shear-induced soil displacement ω s τ 2 and residual pile–soil relative displacement S p caused by excavation unloading:
ω s p 2 = ω p 2 + ω s p 1 ω s τ 2 S p
where subscript 2 represents the variables in the pile loading stage; the pile displacement ω p only refers to the pile displacement caused by pile loading. S p is the residual pile–soil relative displacement. This represents the residual displacement after pile–soil interface unloading. The determination of the residual pile–soil relative displacement S p is shown in the following section.

3. Load-Transfer Model Considering Excavation Effects

3.1. Load Transfer Relationship of a Single Pile

Ignoring the weight of the pile and considering the vertical equilibrium condition of the pile element at depth z , the relationship between pile axial force P ( z ) and shaft resistance τ s p ( z ) can be expressed as:
τ s p ( z ) = 1 π d d P ( z ) d z
where τ s p is the shaft resistance on the elementary length d z ; z is the depth; d is the pile diameter; P is the pile axial force. The pile displacement at depth z can be determined as:
ω p ( z ) = ω p ( 0 ) 0 z P ( z ) E p A p d z
where ω p ( 0 ) is the pile head displacement; E p is the elastic modulus of pile; A p is the cross-section area of pile. Differentiating Equation (4), the relationship between pile displacement ω p ( z ) and pile axial force P ( z ) can be expressed as:
d ω p ( z ) = P ( z ) E p A p d z
Substituting Equation (5) into Equation (3), the load transfer differential equation of a single pile can be obtained as:
d 2 ω p ( z ) d z 2 π d τ s p ( z ) E p A p = 0
The load-transfer method evaluated the pile response by solving the load transfer differential equation of the single pile, i.e., Equation (6). Hence, the shaft resistance τ s p ( z ) should be determined to solve the load transfer differential equation. The shaft resistance τ s p ( z ) is related to relative displacement at pile–soil interface ω s p . According to Equations (1) and (2), the shear-induced soil displacement ω s τ , soil greenfield heave displacement ω s 0 , and residual pile–soil relative displacement S p should be determined to calculate the shaft resistance τ s p ( z ) .

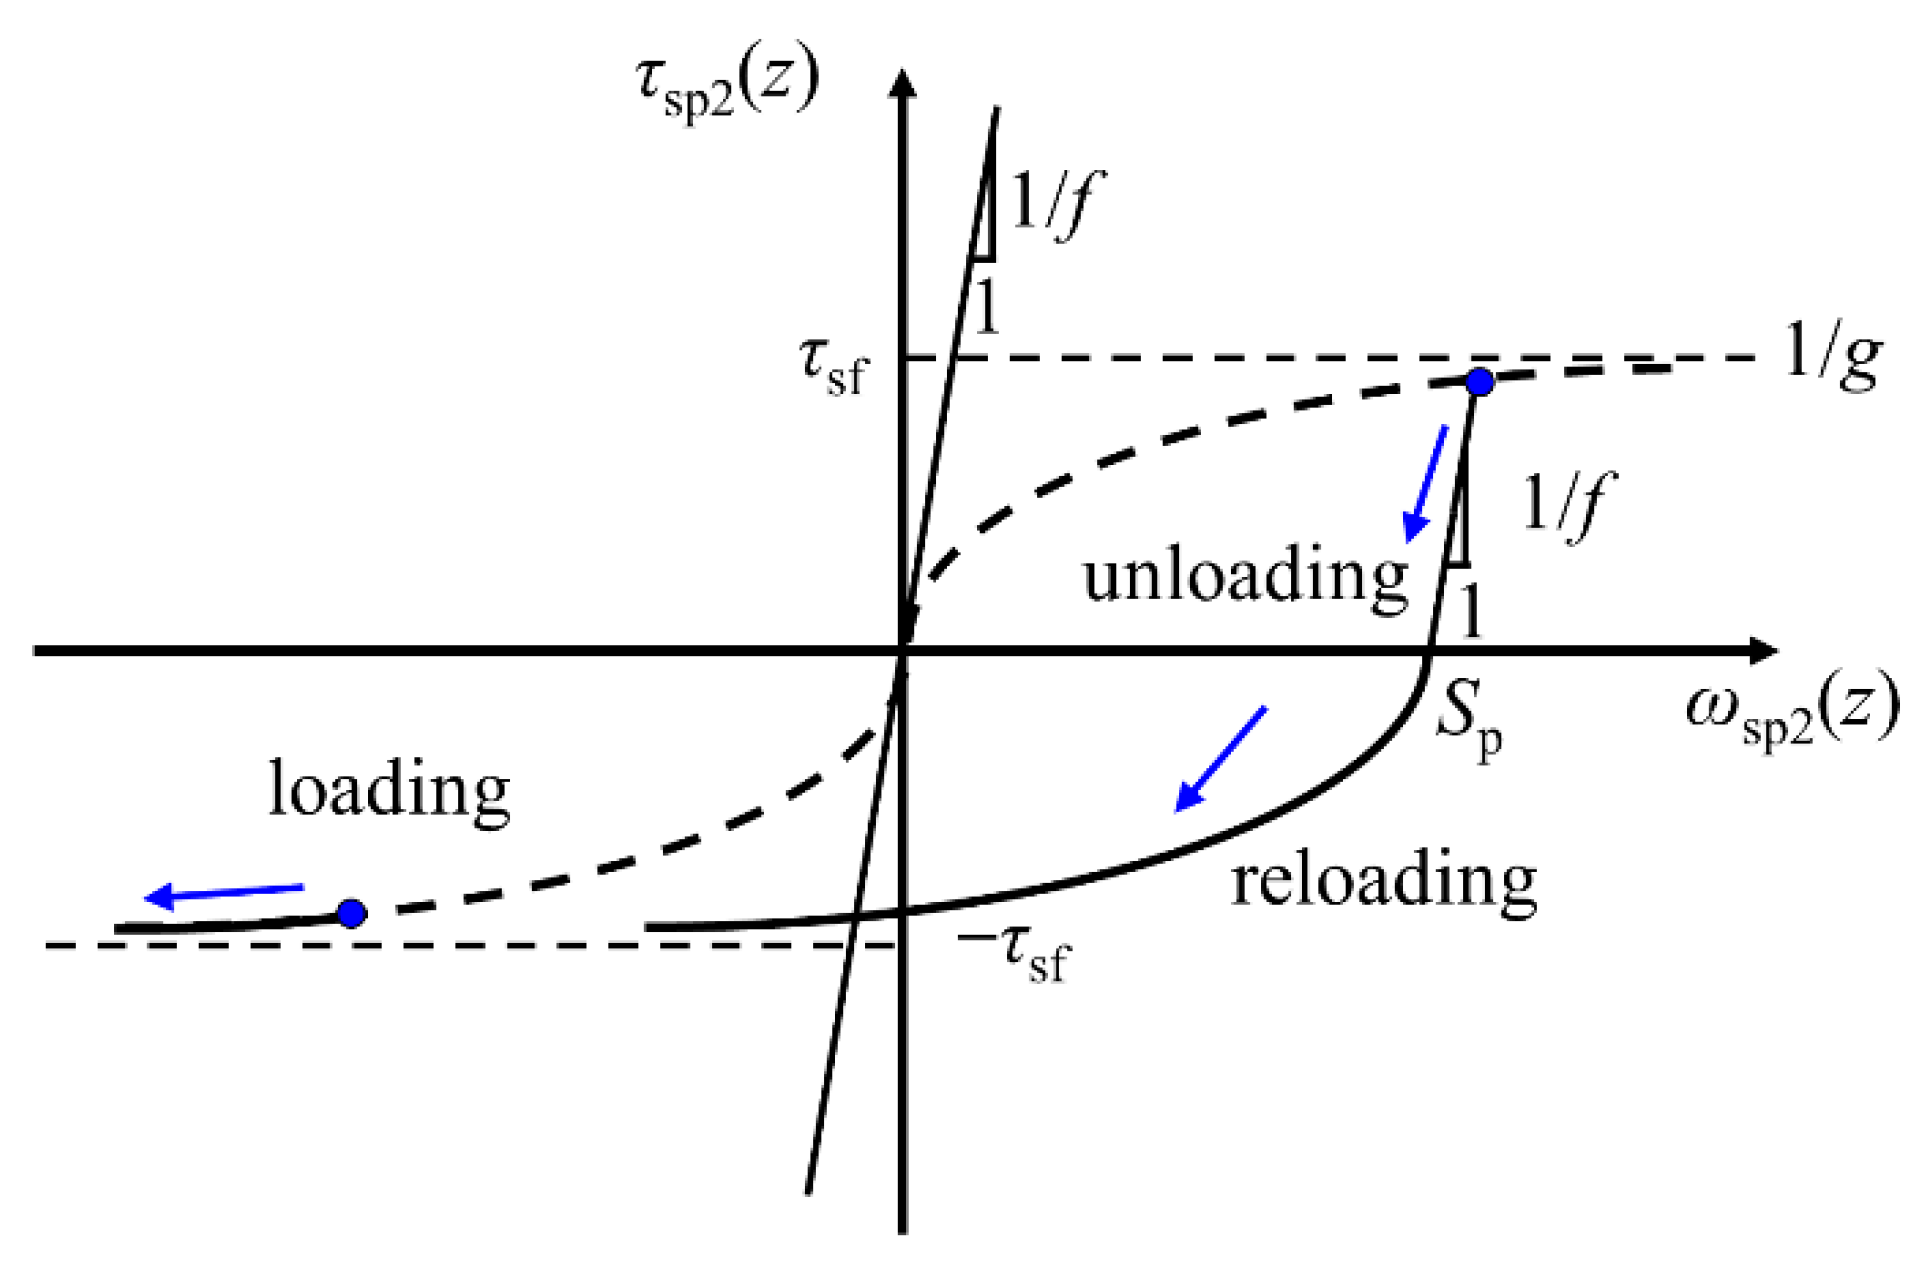
3.2. Nonlinear Shear Displacement of the Soil Outside the Pile–Soil Interface

The soil displacement outside the pile–soil interface is caused by shear stress between pile and soil. During excavation unloading and pile loading stage, the soil outside the pile–soil interface remains elastic. As recommended by Randolph and Worth [28], the elastic shear-induced soil displacement can be calculated by:
ω s τ = τ s p r 0 G s r 0 r m 1 r d r = τ s p r 0 G s ln ( r m r 0 )
where r 0 is the pile radius, G s is the shear modulus of surrounding soil. r m is the limiting radius where the shear strain induced by the pile can be negligible. For a pile in layered soils, the limiting radius r m can be determined as follows:
r m = 2.5 i = 1 n G s i h i G s m ( 1 i = 1 n ν s i h s i L p )
where G s i and ν s i are the shear modulus and Poisson’s ratio of i th soil layer, respectively. G s m is the maximum shear modulus of soils. h s i is the thickness of i th soil layer. L p is the pile length.

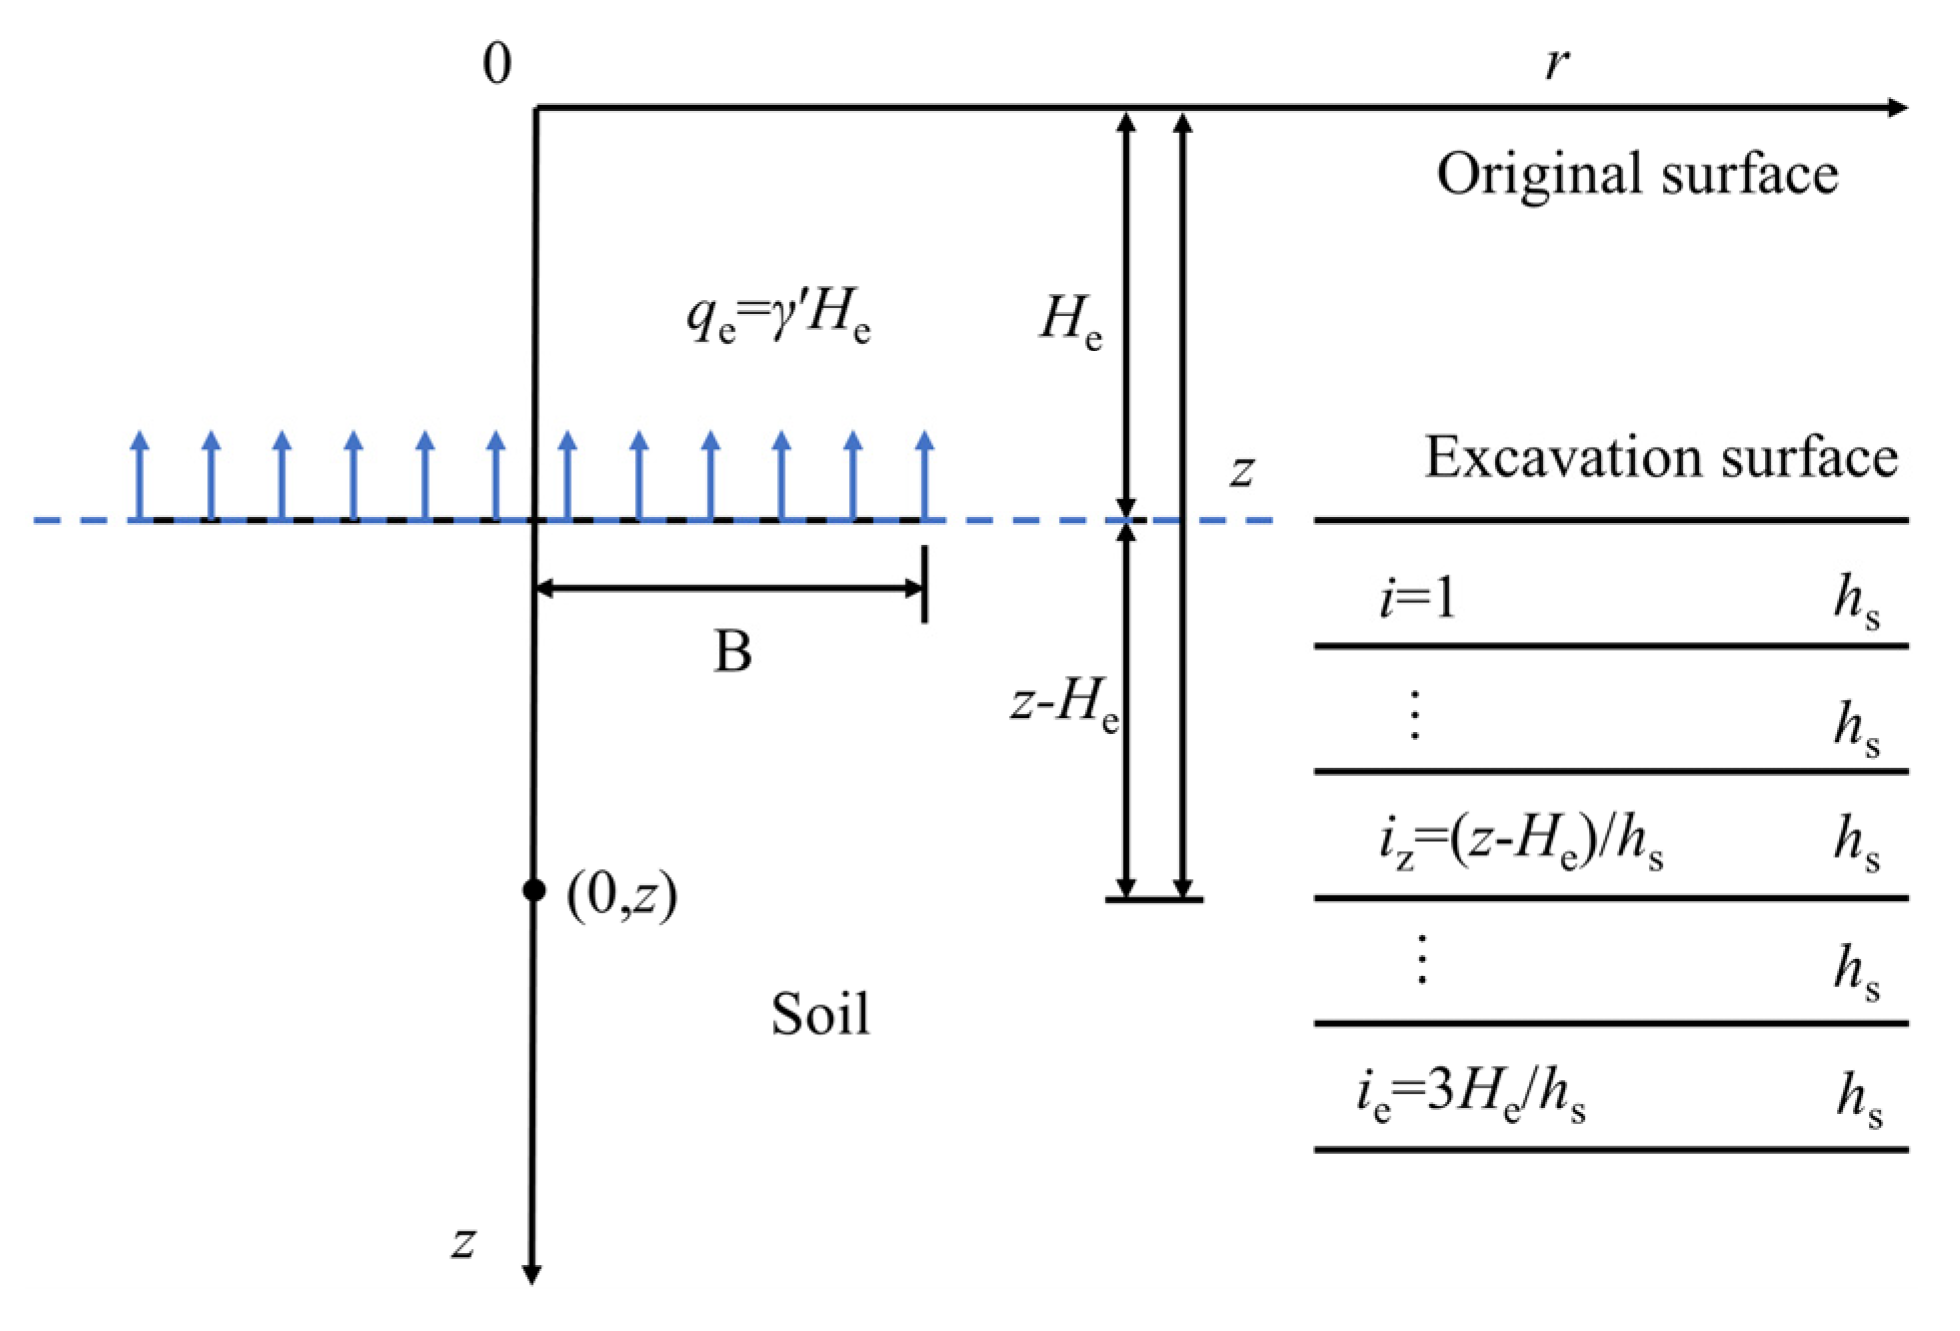
3.3. Greenfield Soil Heave Displacement

Figure 2 shows the schematic of the greenfield soil heave calculation. The source of bottom soil heave is excavation unloading due to removal of soil. Thus, the weight of excavated soil is applied upward at the excavation surface to calculate the soil heave. Considering the excavation depth, the Mindlin solution is adopted to calculate the unloading stress of soil with different depths. The unloading stress σ q e at depth z is given by:
σ q e = γ H e 4 π ( 1 v s ) { 2 ( 1 v s ) [ arctan B z H e + arctan B z + H e ] + B ( z H e ) B 2 + ( z H e ) 2 + B [ H e + ( 3 4 v ) z ] B 2 + ( z + H e ) 2 + 4 z B H e ( z + H e ) ( B 2 + ( z + H e ) 2 ) 2 }
where H e is the excavation depth; B is half of the excavation width, v s is the Poisson’s ratio of soil. The layered soil is divided into plenty of thin layers with the same thickness h s from the excavation surface to three times the excavation depth to calculate the soil heave deformation. The greenfield heave deformation of layered soil at depth z can be calculated using the one-dimensional deformation assumption:
ω s 0 ( z ) = i z i e σ q e , i E u r , i h s
where E u r is the unloading modulus of soil.

3.4. Load Transfer Relationship of Pile–Soil Interaction

The laboratory and field test results show that the nonlinear relationship between the pile–soil shear stress and the relative displacement at the pile–soil interface can be expressed as a hyperbolic or exponential function. Zhang et al. [29] carried out load tests on instrumented tension piles to investigate the reliability of the hyperbolic function to model the load transfer between pile shaft and surrounding soil. The results showed a close agreement between test results and predicted values estimated by the hyperbolic function in different soils. Thus, the hyperbolic function is adopted to model the behavior of the pile–soil interface, as shown in Figure 3. The hyperbolic function can be expressed as:
τ s p 1 = ω s p 1 f + g ω s p 1
where τ s p and ω s p are the shear stress at pile–soil interface and the corresponding pile–soil relative displacement, respectively; The f and g are model parameters. The parameter f represents the inverse of the initial tangent stiffness of the load-transfer curve, and g is the inverse of the asymptote of the load-transfer curve. The parameters f and g can be determined using Equations (12) and (13):
f = r 0 G s ln ( r m r 0 )
g = R s f τ s u
where r 0 is the pile radius; G s is the shear modulus of surrounding soil; r m is the limiting radius where the shear strain induced by the pile can be negligible; R s f is the failure ratio of shaft resistance, R s f = τ s u / τ s f ; τ s f is the pile shaft resistance at which the pile-soil relative displacement is infinity; τ s u is the ultimate pile shaft resistance. The ultimate pile shaft resistance τ s u is determined by the effective stress method. As suggested by Yang et al. [30], the ultimate pile shaft resistance τ s u can be calculated as:
τ s u = K 0 ( K K 0 ) σ v tan ( φ ( δ φ ) )
where K 0 is the lateral earth pressure coefficient at rest, which is determined by K 0 = ( 1 sin φ ) O C R sin φ , O C R is the overconsolidation ratio; φ is the constant-volume (or critical-state) effective friction angle of surrounding soil; δ is the friction angle of pile-soil interface; K is the lateral earth pressure coefficient; σ v is the effective overburden pressure. The ultimate pile shaft resistance τ s u is determined by effective stress analysis. Hence, both the cohesive and cohesionless soil can be modeled. The friction angle δ depends on the properties of the pile shaft and surrounding soil, and can be determined by shear box tests and empirical correlations. The later earth pressure coefficient K depends on several factors including soil stress state, pile geometry, pile installation method. The later earth pressure coefficient K is related to the lateral earth pressure coefficient at rest K 0 . The empirical correlations to determine later earth pressure coefficient K and friction angle of pile-soil interface δ are summarized in Table 1.
The overconsolidation ratio O C R is defined as the ratio of preconsolidation stress to effective overburden stress. Excavation will cause mechanical unloading for soils below the excavation surface. For the soil near the excavation surface, the overconsolidation ratio seems to be infinite due to the infinitesimal effective overburden stress. It is assumed that the lateral earth pressure coefficient K 0 of overconsolidated soil cannot be greater than the passive earth pressure coefficient K p . Consequently, the following relationship can be obtained:
K p = tan 2 ( 45 + φ / 2 ) = ( 1 sin φ ) O C R lim sin φ
where the O C R lim is the limit of the overconsolidation ratio, and can be derived from Equation (15):
O C R lim = [ 1 + sin φ ( 1 sin φ ) 2 ] ( 1 / sin φ )
The load-transfer behavior between pile and soil in the pile loading stage is more complicated than that in the excavation unloading stage. Figure 4 shows the load-transfer curve in the pile loading stage. The negative shaft resistance below the neutral level increases with increasing applied load. In contrast, positive shaft resistance above the neutral level decreases to zero and becomes a negative value. The variation of positive shaft resistance above the neutral level resembles the unloading and reloading processes. During the unloading process, it is reasonably assumed that the pile–soil relative displacement is elastic. The positive shaft resistance decreases linearly with the slope equal to the initial tangent stiffness of the original load-transfer curve 1 / f . Only the elastic pile–soil relative displacement can be recovered in the unloading process, and the residual pile–soil relative displacement S p exists before reloading. The load-transfer curve in the reloading process is similar to the original load-transfer curve with the same fully mobilized shaft resistance τ s f . A piecewise function can determine the residual pile–soil relative displacement S p :
S p = { 0 ω s p 1 < 0 ω s p 1 f τ s p 1 ω s p 1 > 0
The load-transfer curve in the pile loading stage consists of three segments: loading, unloading, and reloading. A piecewise function can describe these segments:
τ s p 2 = { ω s p 2 / ( f + g ω s p 2 ) ω s p 2 < 0 ω s p 2 / f ω s p 2 > 0

4. Difference Numerical Method to Solve the Load Transfer Model

4.1. Difference Scheme of Load-Transfer Method

By solving Equation (6), the pile response after excavation can be obtained. However, Equation (6) is a nonlinear second-order differential equation, and it is hard to obtain an analytical solution. Therefore, the load-transfer method combined with numerical difference is adopted in this paper. Firstly, the pile was discretized into n segments to facilitate the numerical analysis, as shown in Figure 5. The length of each segment is h = L / n . The nodes of each segment are numbered from the top to the base of the pile. Two virtual nodes, numbered -1 and n+1, are added to create boundary conditions. When n is large enough, linear axial force distribution can be assumed to simplify the analysis. In the excavation unloading stage, substituting Equation (1) into Equation (6), the load transfer differential equation of a single pile can be rewritten into:
d 2 ω p 1 , i d z i 2 λ 1 , i ( ω p 1 , i ω s 0 , i ω s τ 1 , i ) = 0 ,   i = 0 , 1 , 2 , , n
where λ 1 , i represents the secant stiffness of the pile–soil interface, λ 1 , i = π d τ s p , 1 i E p A p ω s p , 1 i . The second-order central difference formula is adopted to discretize the pile displacement ω p , 1 , which can be expressed as follows:
d 2 ω p 1 , i d z i 2 = 1 h 2 ( ω p 1 , i 1 2 ω p 1 , i + ω p 1 , i + 1 ) ,   i = 0 , 1 , 2 , , n
At the end of the excavation unloading, the pile head is free to move. Below the neutral level, the pile heave is larger than the soil heave. Hence, the pile base is not contacted with the soil, and the pile head is also free to move. The virtual nodes are used to determine the boundary conditions of the pile. The boundary conditions of the uplift piles can be described as:
ω p 1 , 1 = ω p 1 , 1
ω p 1 , n 1 = ω p 1 , n + 1
Equations (21) and (22) represent that the pile head and base are free to move. Substituting Equation (20) into Equation (19), the load transfer differential equation of a single pile in the excavation unloading stage can be written as:
K 1 ω p 1 = F 1
where ω p 1 is the node displacement vector of the pile in the excavation unloading stage; K 1 and F 1 are the node stiffness matrix and node force vector, respectively. The node stiffness matrix K 1 and node force vector F 1 are given in Appendix A.
The pile response in the pile loading stage is also evaluated by the load-transfer method. The discretization pattern shown in Figure 5 is adopted. The bound conditions are that the pile head displacement is known and the pile base is free to move:
ω p 2 , 0 = ω p 0
ω p 2 , n 1 = ω p 2 , n + 1
where ω p 0 is the pile head displacement. The load transfer differential equation of a single pile can be expressed as follows:
d 2 ω p 2 , i d z i 2 λ 2 , i ( ω p 2 , i + ω s p 1 , i ω s τ 2 , i S p , i ) = 0 ,   i = 1 , 2 , , n
λ 2 , i = π d τ s p 2 , i E p A p ω s p 2 , i ,   i = 1 , 2 , , n
The second-order central difference formula is also adopted to discretize the pile displacement ω p 2 , which can be expressed as follows:
d 2 ω p 2 , i d z i 2 = 1 h 2 ( ω p 2 , i 1 2 ω p 2 , i + ω p 2 , i + 1 ) ,   i = 0 , 1 , , n
Taking the pile displacement ω p 2 , i as the variable, the load transfer differential equation of a single pile can be rewritten as the matrix form:
K 2 ω p 2 = F 2
where ω p 2 is the node displacement vector of the pile; K 2 and F 2 are the node stiffness matrix and node force vector, respectively. The node stiffness matrix K 2 and node force vector F 2 are also given in Appendix A.

4.2. Iterative Algorithm for the Proposed Difference Scheme

Considering the interaction between shaft resistance and shear-induced soil displacement, Equations (23) and (24) comprise a system of nonlinear equations. An iterative updating procedure is adopted to solve Equations (23) and (24). The iterative updating procedure consists of the following steps:
(1)
Calculate the greenfield soil heave using Equation (9). Assume that the initial pile displacement and shear-induced soil displacement at each node are equal to zero.
(2)
Calculate the pile–soil relative displacement and pile shaft resistance of each node using Equations (1) and (11). As a consequence, the parameter λ 1 , i of each node could be determined.
(3)
Calculate the node stiffness matrix K 1 and node force vector F 1 . Update the pile displacement of each node by solving Equation (23).
(4)
Update the pile–soil relative displacement, the pile shaft resistance, and the shear-induced soil displacement of each node using the new pile node displacement. Then, update the parameter λ 1 , i of each node.
(5)
Update the node stiffness matrix K 1 and node force vector F 1 . The new pile displacement at each node can thus be obtained.
(6)
Repeatedly execute steps 4 and 5 until convergence is achieved.
(7)
Obtain the pile–soil relative displacement after excavation. Calculate the residual pile–soil relative displacement S p at each node. Assume that the initial pile displacement ω p 2 at each node is equal to the pile head settlement ω p 0 , and shear-induced soil displacement ω s τ 2 at each node is equal to zero.
(8)
Calculate the pile–soil relative displacement and pile shaft resistance of each node using Equations (2) and (18). Consequently, the parameters λ 2 , i of each node could be determined.
(9)
Calculate the node stiffness matrix K 2 and node force vector F 2 . Update the pile displacement of each node by solving Equation (29).
(10)
Update the pile–soil relative displacement, the pile shaft resistance, and the shear-induced soil displacement of each node using the new pile node displacement. Then, update the parameters λ 1 , i of each node.
(11)
Update the node stiffness matrix K 2 and node force vector F 2 . The new pile displacement at each node can thus be obtained.
(12)
Repeatedly execute steps 10 and 11 until convergence is achieved.
Following the above steps, the iterative procedure was implemented in the commercial software MATLAB. Executing the proposed approach only requires a few seconds in MATLAB, which demonstrates the proposed method is a practical and economical tool to evaluate the uplift pile load-displacement behavior considering excavation effects.

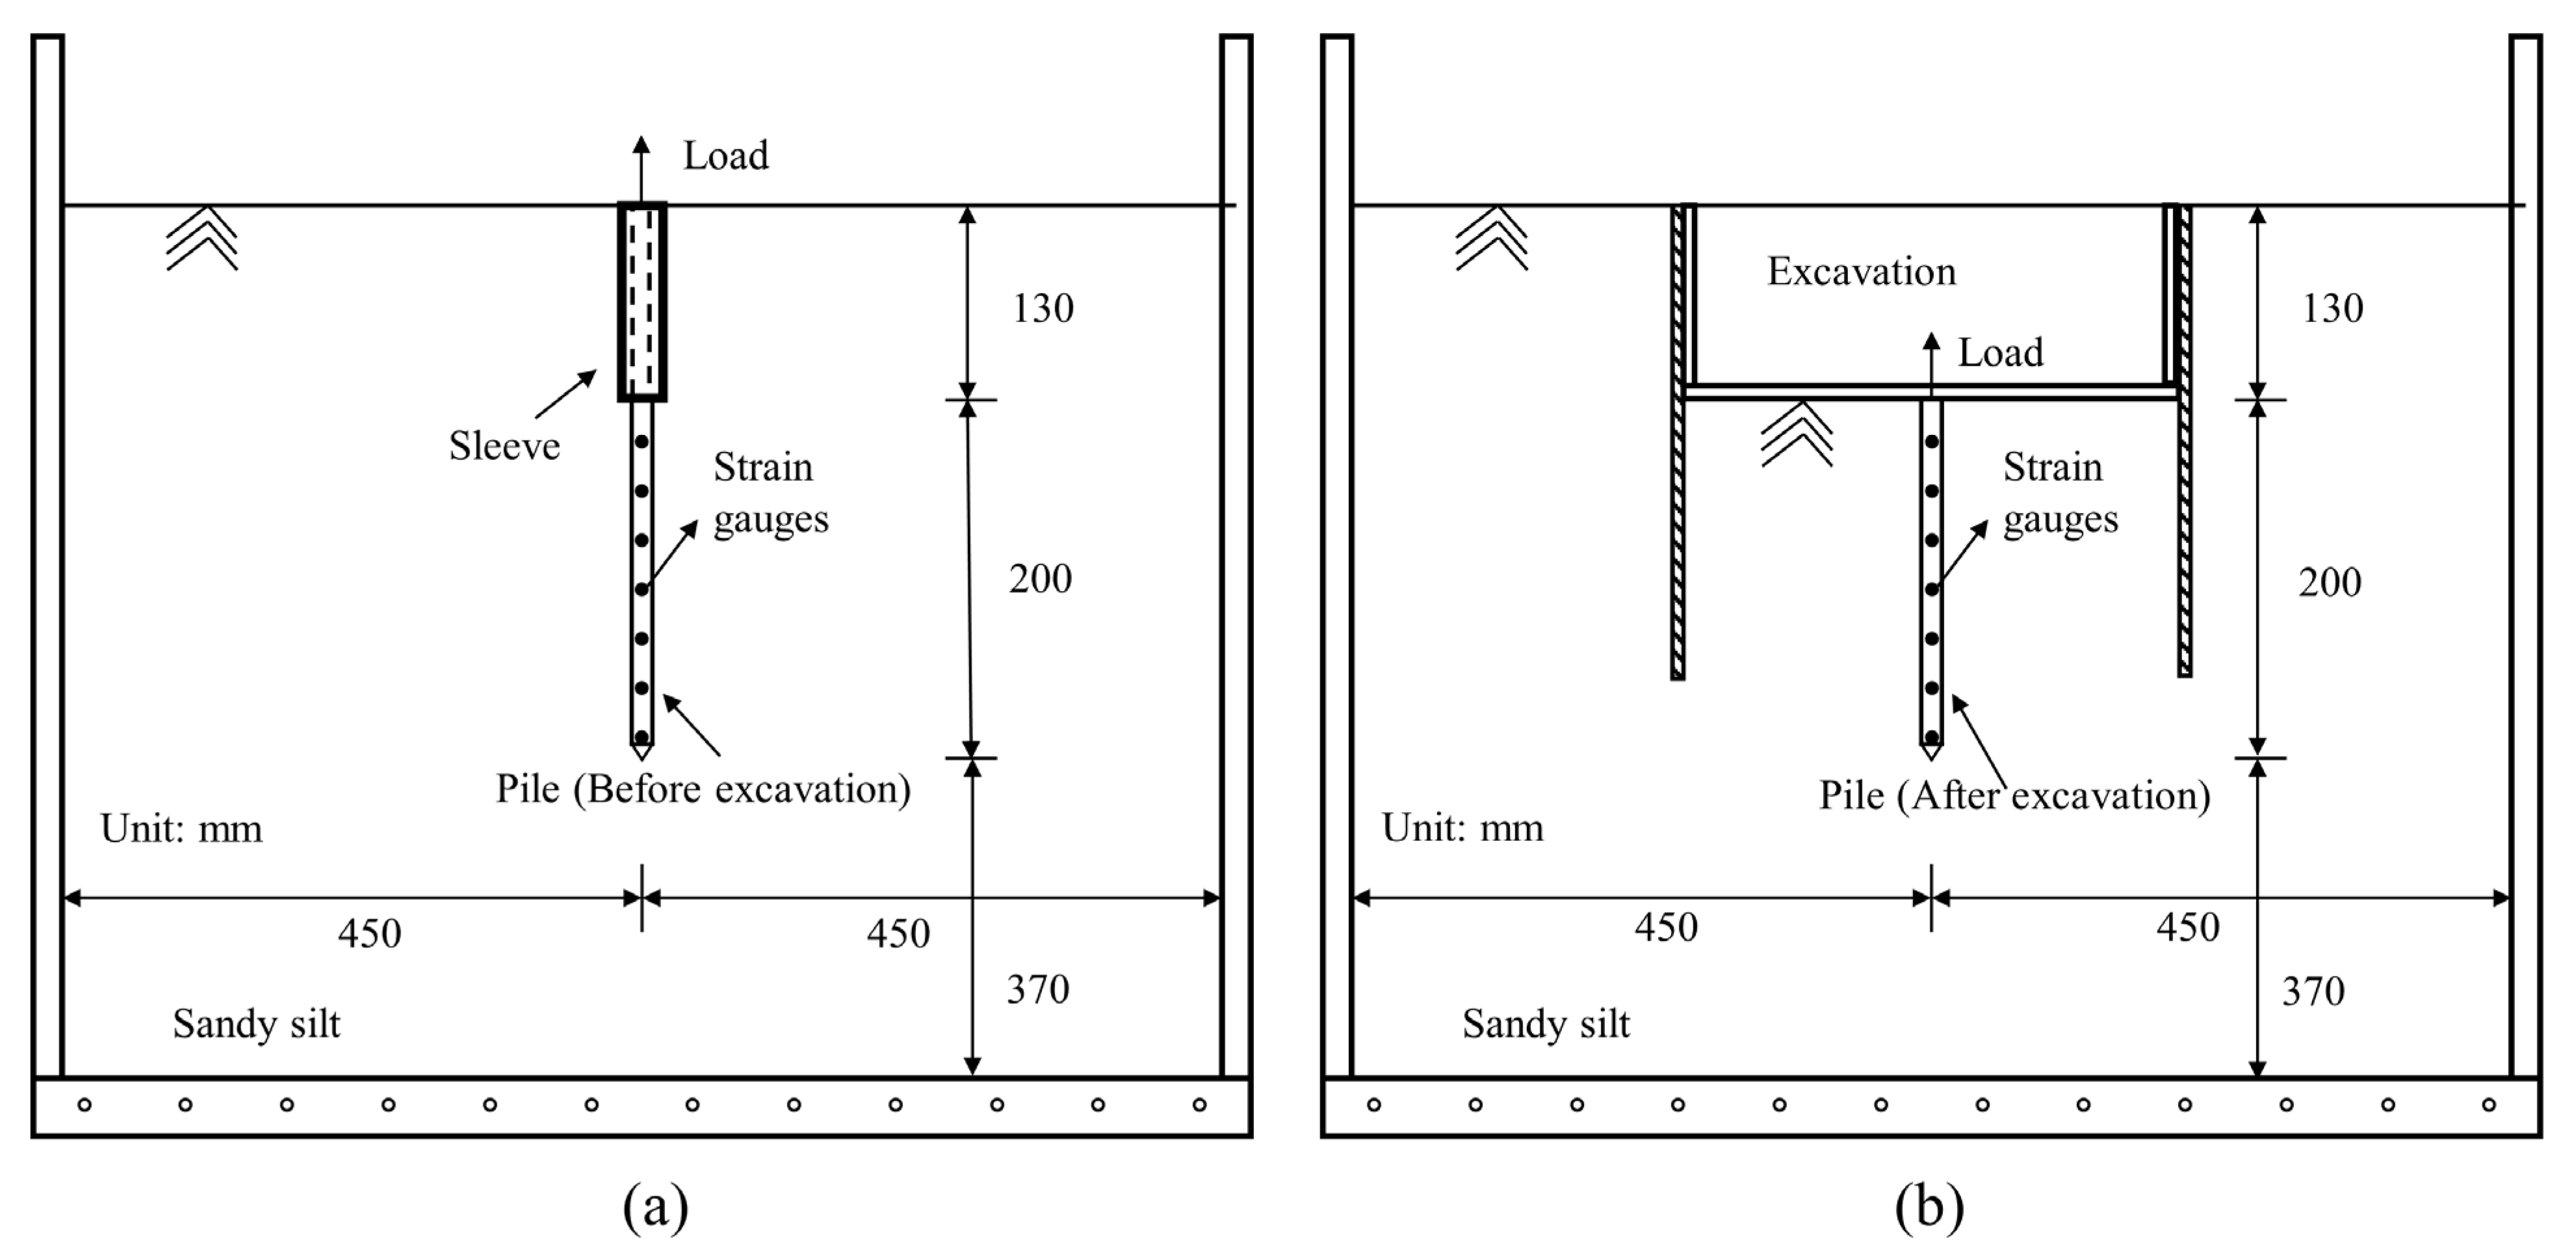
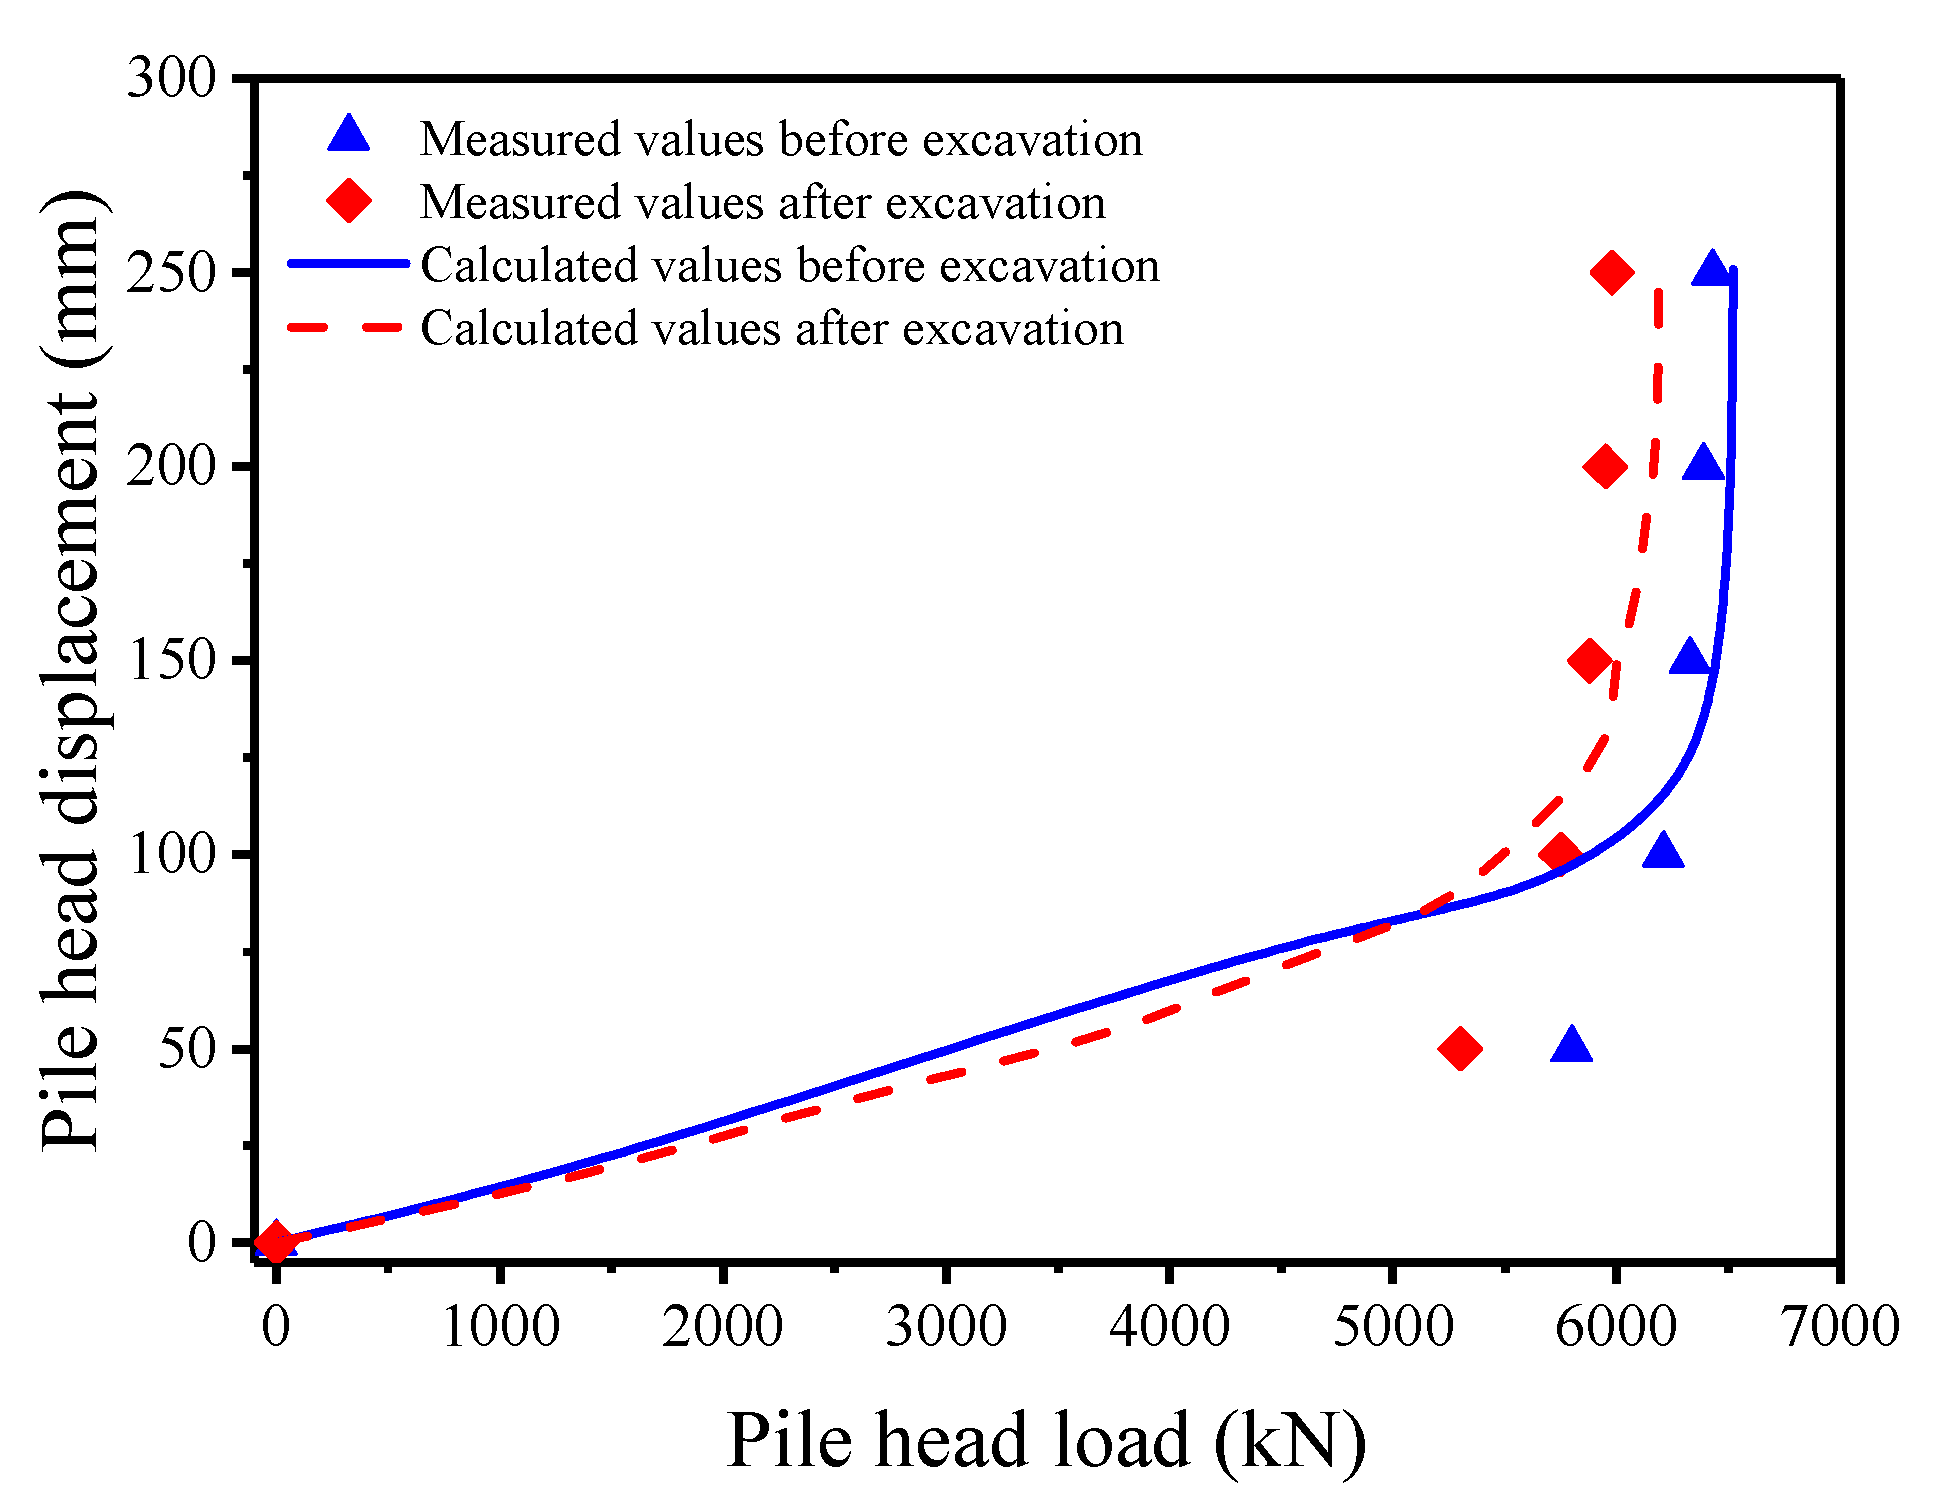
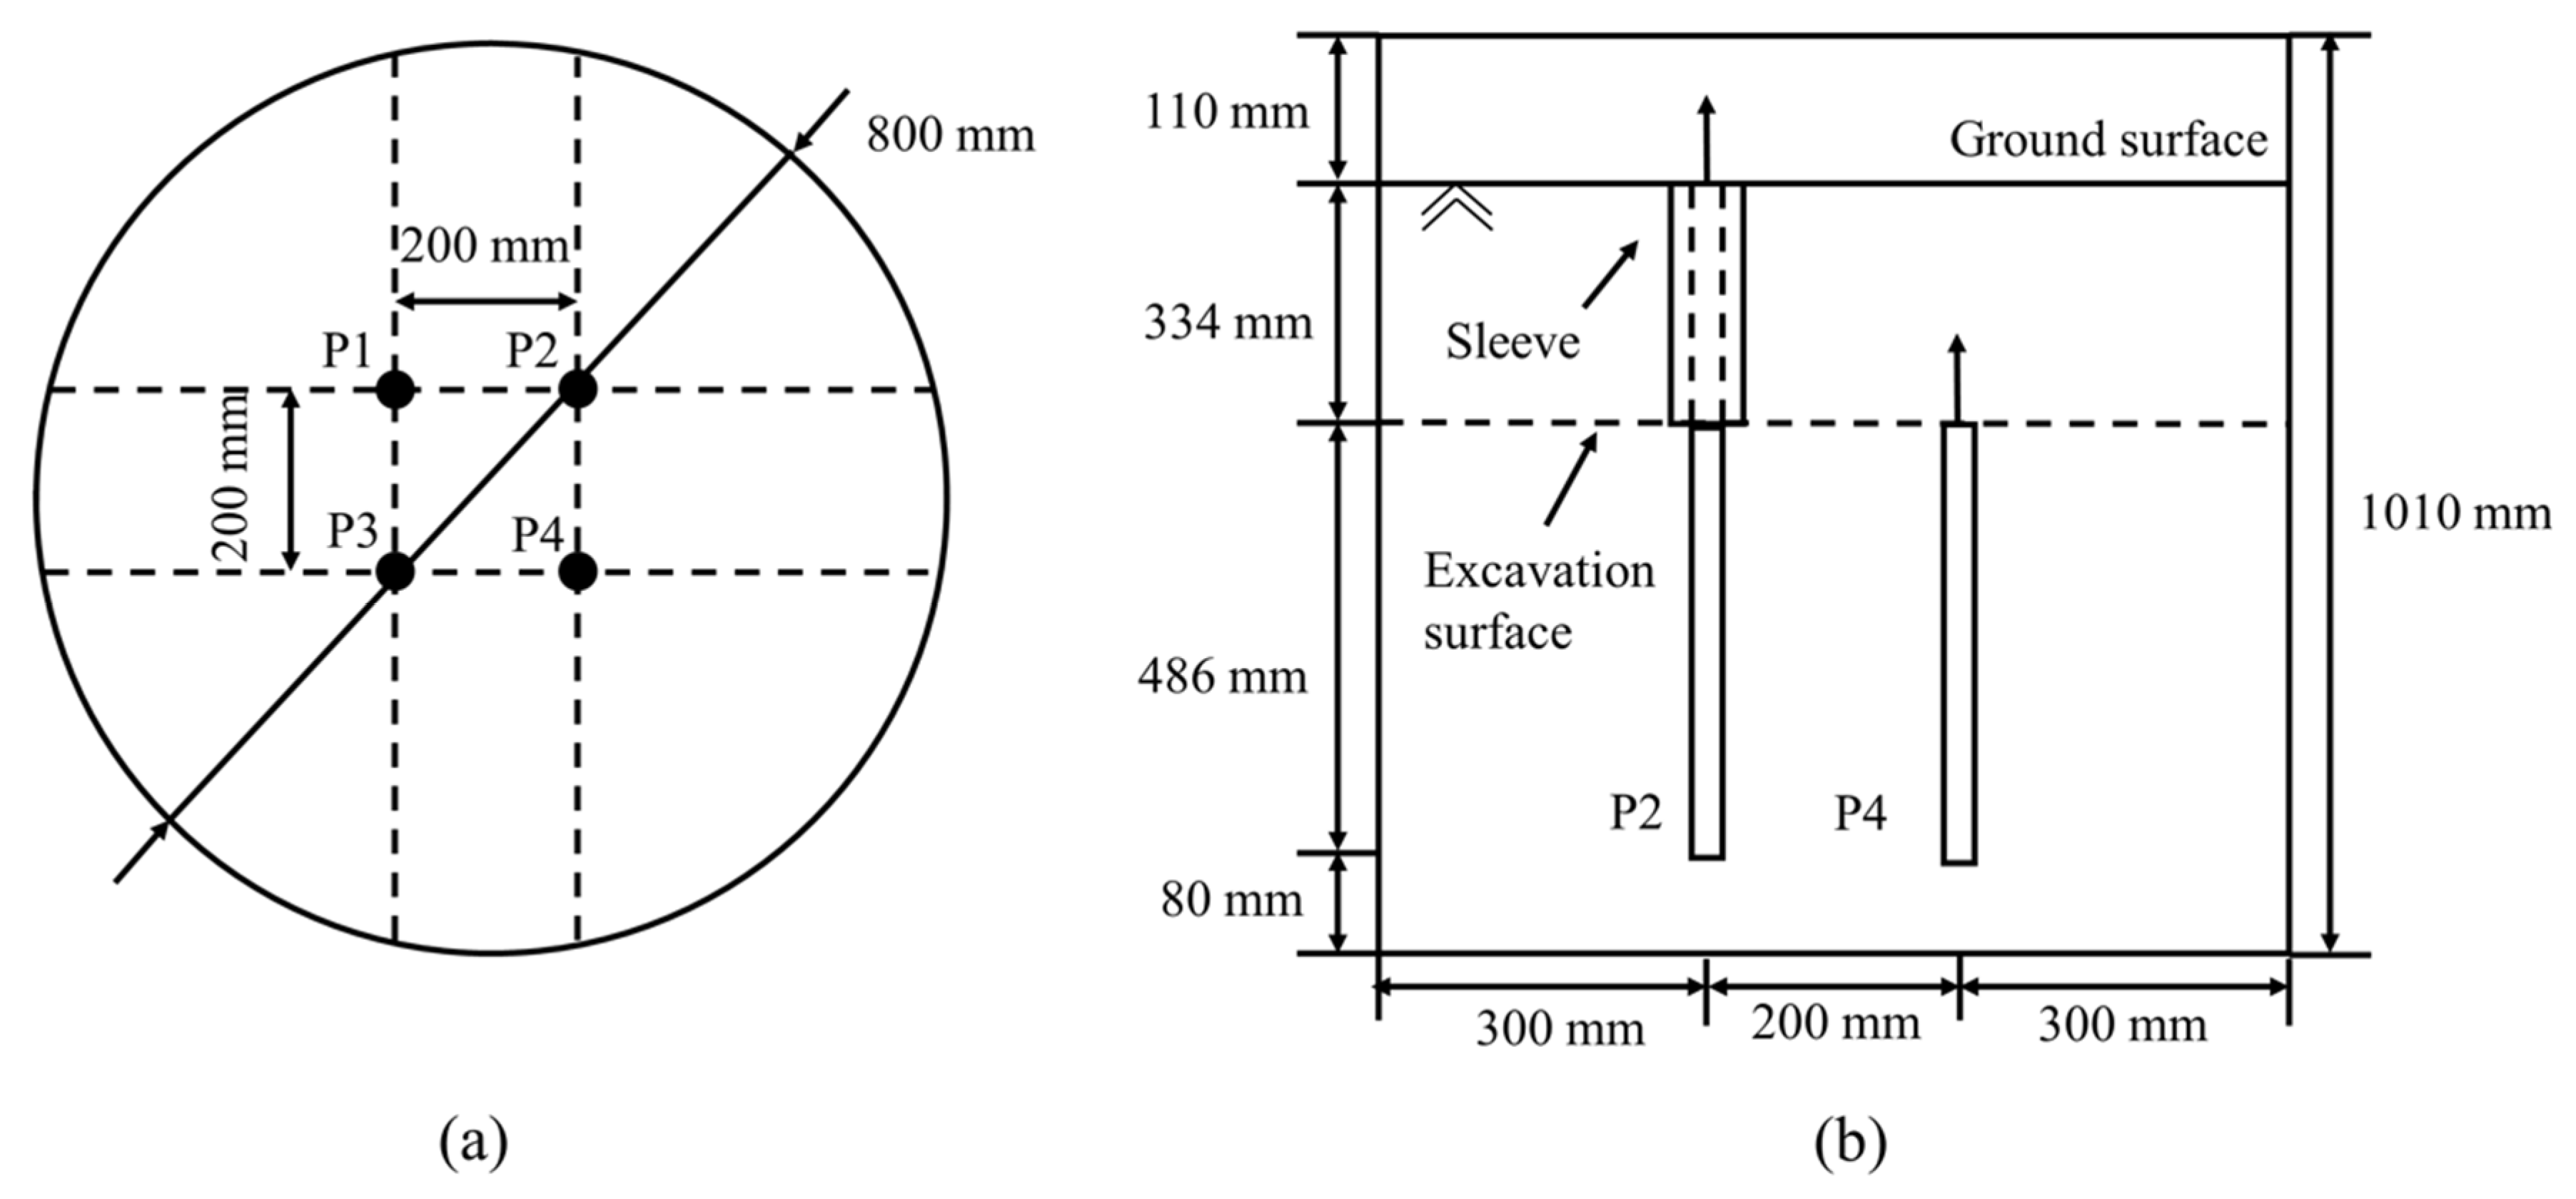
5. Validation of the Proposed Approach

To validate the proposed method, well-documented case histories were used. The results from the proposed method were compared with the data extracted from the case histories. The first two cases were pile load tests without excavation effects. The validations were conducted by executing steps 7 to 12 in Section 4.2 with the soil and pile parameters from the original papers. The pile–soil relative displacements were zero before loading. In cases three and four, the pile load-displacement curves before and after excavation were calculated using the proposed approach. For the pile load-displacement behavior before excavation, the calculation process is the same as that of cases one and two. For the pile load-displacement behavior after excavation, the validations were conducted by executing steps 1 to 12 in Section 4.2 with the soil, pile, and excavation parameters from the original papers.

5.1. Case One

Sowa [33] carried out full-scale tests on a reinforced concrete pile to investigate the load-displacement behavior of the pile under uplift condition. The pile was embedded in a thick fine sand layer overlain by a thin silty clay layer with a thickness of 1.2 m. The depth of the water table was 1.2 m.
The length and diameter of the concrete pile were 12 m and 0.53 m, respectively. The saturated soil unit weight was 18.4 kN/m3. Hence, the effective unit weight of the soil was set as 8.4 kN/m3. The Poisson’s ratio of the surrounding soil was 0.35. The average SPT blow counter was 11, and the effective friction angle was 30°. The shear modulus of the surrounding soil was 20 MPa, and the shear modulus of the pile was 30 GPa. For the proposed method, the ratio of lateral earth pressure coefficient K to lateral earth pressure coefficient at rest K 0 was set as 1.5. The friction angle of the pile–soil interface δ was 0.75 times the effective friction angle of the surrounding soil.
Figure 6 shows the comparison between the measured load-displacement curve and the calculated curve derived from the proposed approach. The calculated results from Goel and Patra [34] and Zhang et al. [30] are also presented in this figure. It can be seen in Figure 6 that when the load is less than 300 kN, the load-displacement curve derived from the proposed approach agrees well with the measured curve and the calculated results from Goel and Patra [34]. The results derived from Zhang et al. [30] underestimate the load. When the load is larger than 300 kN, the proposed approach and the approach of Zhang et al. [30] underestimate the load, while the approach of Goel and Patra [34] slightly overestimates the load. In general, there is a good agreement between the proposed approach, the measured values, and the calculated results from Goel and Patra [34] and Zhang et al. [30].

5.2. Case Two

Guerra [35] performed centrifugal tests to investigate the uplift pile response in dry FF sand with a centrifugal acceleration of 80g. The model pile made of aluminum had a length of 32 cm and a diameter of 3.2 cm. The elastic modulus of the model pile was 70 GPa. For the dry FF sand, the relative density D r was 85%, with the original porosity e 0 was 0.804. The unit weight γ was 14.87 kN/m3. According to the back-calculation [15], the interface mobilized friction angle δ was 39°. The ratio of lateral earth pressure coefficient K to lateral earth pressure coefficient at rest K 0 was determined by [36]:
K K 0 = C exp { D r 100 % [ 1.3 0.2 ln ( σ v 0 p a ) ] } F ( K 0 )
where D r is the relative density; σ v 0 is the effective overburden stress; p a is the atmospheric pressure; F ( K 0 ) is the function related to the lateral earth pressure coefficient at rest K 0 , F ( K 0 ) = exp ( 0.2 K 0 0.4 ) ; C is an empirical coefficient and can be adopted as 0.7 following the suggestion of Loukidis and Salgado [36]. The ratio of pile–soil interface friction angle δ to effective friction angle of soil was set as 1.
Figure 7 shows a comparison between the calculated load-displacement curve and the measured load-displacement curve. The calculated results from Lashkari [22] and Cui et al. [37] are also presented in Figure 7. In Figure 7, it can be seen that the calculated load-displacement curve is generally consistent with the measurements and the calculated results of Lashkari [22] and Cui et al. [37]. When the load is less than 2000 N, the proposed approach underestimates the load, while the approaches of Lashkari [22] and Cui et al. [37] overestimate the load. When the load is larger than 2000 N, the proposed approach and approaches of Lashkari [22] and Cui et al. [37] overestimate the loads.

5.3. Case Three

Li et al. [15] carried out centrifugal tests to investigate the uplift pile behavior change before and after excavation. Two aluminum hollow model piles were uplifted before and after excavation, as shown in Figure 8. The length, width, and height of the model box are 900 mm, 700 mm, and 700 mm, respectively. The length of the pile is 330 mm, with an outer diameter of 10 mm and a thickness of 2 mm. The centrifugal tests were conducted with an acceleration of 100 g. Thus, the excavation depth and diameter were 13 m and 30 m, respectively. The sandy silt collected from the changing island was used in the centrifugal tests. The physical and mechanical properties of sandy silt are summarized in Table 2. Two uplift pile load tests were carried out. For the uplift pile load test before excavation, the load test was carried out at the ground surface. The shaft resistance within the excavation depth was eliminated by a sleeve (Figure 8). For the uplift pile load test after excavation, the load test was carried out at final excavation surface.
Figure 9 shows a comparison between the tested and calculated pile load-displacement curve. When the load is less than 6000 kN, the proposed approach underestimates the load, while the proposed approach performed well in predicting pile load-displacement curves when the load is larger than 6000 kN. In the original paper, the soil shear modulus was not presented, and the constrained modulus was used in the proposed approach. Using the constrained modulus underestimates the initial stiffness of the pile–soil interface. Hence, the proposed approach underestimates the load when the load is less than 6000 kN. The ultimate bearing capacity of the uplift piles before and after excavation is 6210 kN and 5750 kN, respectively. Hence, the ultimate bearing capacity of the uplift piles was reduced by 7.4%, with an excavation depth of 13 m.

5.4. Case Four

Another centrifuge test was conducted to validate the proposed approach [38]. The centrifuge test was conducted with an acceleration of 100 g. A sketch of the centrifuge tests is shown in Figure 10. A circular excavation was modeled. The model box was a circular stainless box with a diameter of 800 mm and a height of 1010 mm, respectively. Four piles were used in the test. The aluminum piles, P1 and P2, were uplifted before excavation. The shaft resistance within the excavation depth was eliminated by a sleeve. Another two aluminum piles, P3 and P4, were uplifted after excavation of 334 mm. The diameter of the pile was 8 mm, and the effective length of the pile was 486 mm. The effective length was defined as the pile length below the excavation surface.
The soil used in the model test is sandy silt with a dry density of 1.53 g/cm3. The soil mechanical and physical properties are summarized in Table 3. After saturation of the soil, the piles P1 and P2 were uplifted with a loading speed of 1.2 mm/min. Then, the soil was excavated up to a depth of 334 mm, and the piles P3 and P4 were uplifted with the same loading speed.
Figure 11 shows a comparison of the load-displacement curves obtained by the centrifuge test and the proposed approach. Only the test results of piles P2 and P3 are presented, due to the symmetry. The numerical simulations conducted by Hu et al. [38] are also presented in this figure. It can be seen in the figure that the proposed approach performed well in predicting the load-displacement curves before and after excavation. The pile uplift capacity before and after excavation was 17,000 kN and 12,000 kN, respectively, showing a 29% capacity loss caused by the excavation.

6. Discussion

A parametric study was conducted to investigate the effect of main soil parameters on the change in pile capacity before excavation. Figure 12 presents the calculation model. The excavation depth and width were 15 m and 40 m, respectively. The pile diameter was set as 1 m, and the elastic modulus of the pile was 30 GPa. Soil effective unit weight was set as 8 kN/m3. The friction angle of the pile–soil interface was 0.9 times the effective friction angle of soil.
Table 4 shows the variables in the parametric study. The effects of the soil effective friction angle φ′, shear modulus Gs, and Poisson’s ratio on pile uplift capacity loss with three effective pile lengths were evaluated. Figure 13 presents the schematic of the determination of the uplift pile capacity. The pile uplift capacity is defined as the load corresponding to the sharp increase in pile displacement. Thereafter, the pile capacity can be obtained.

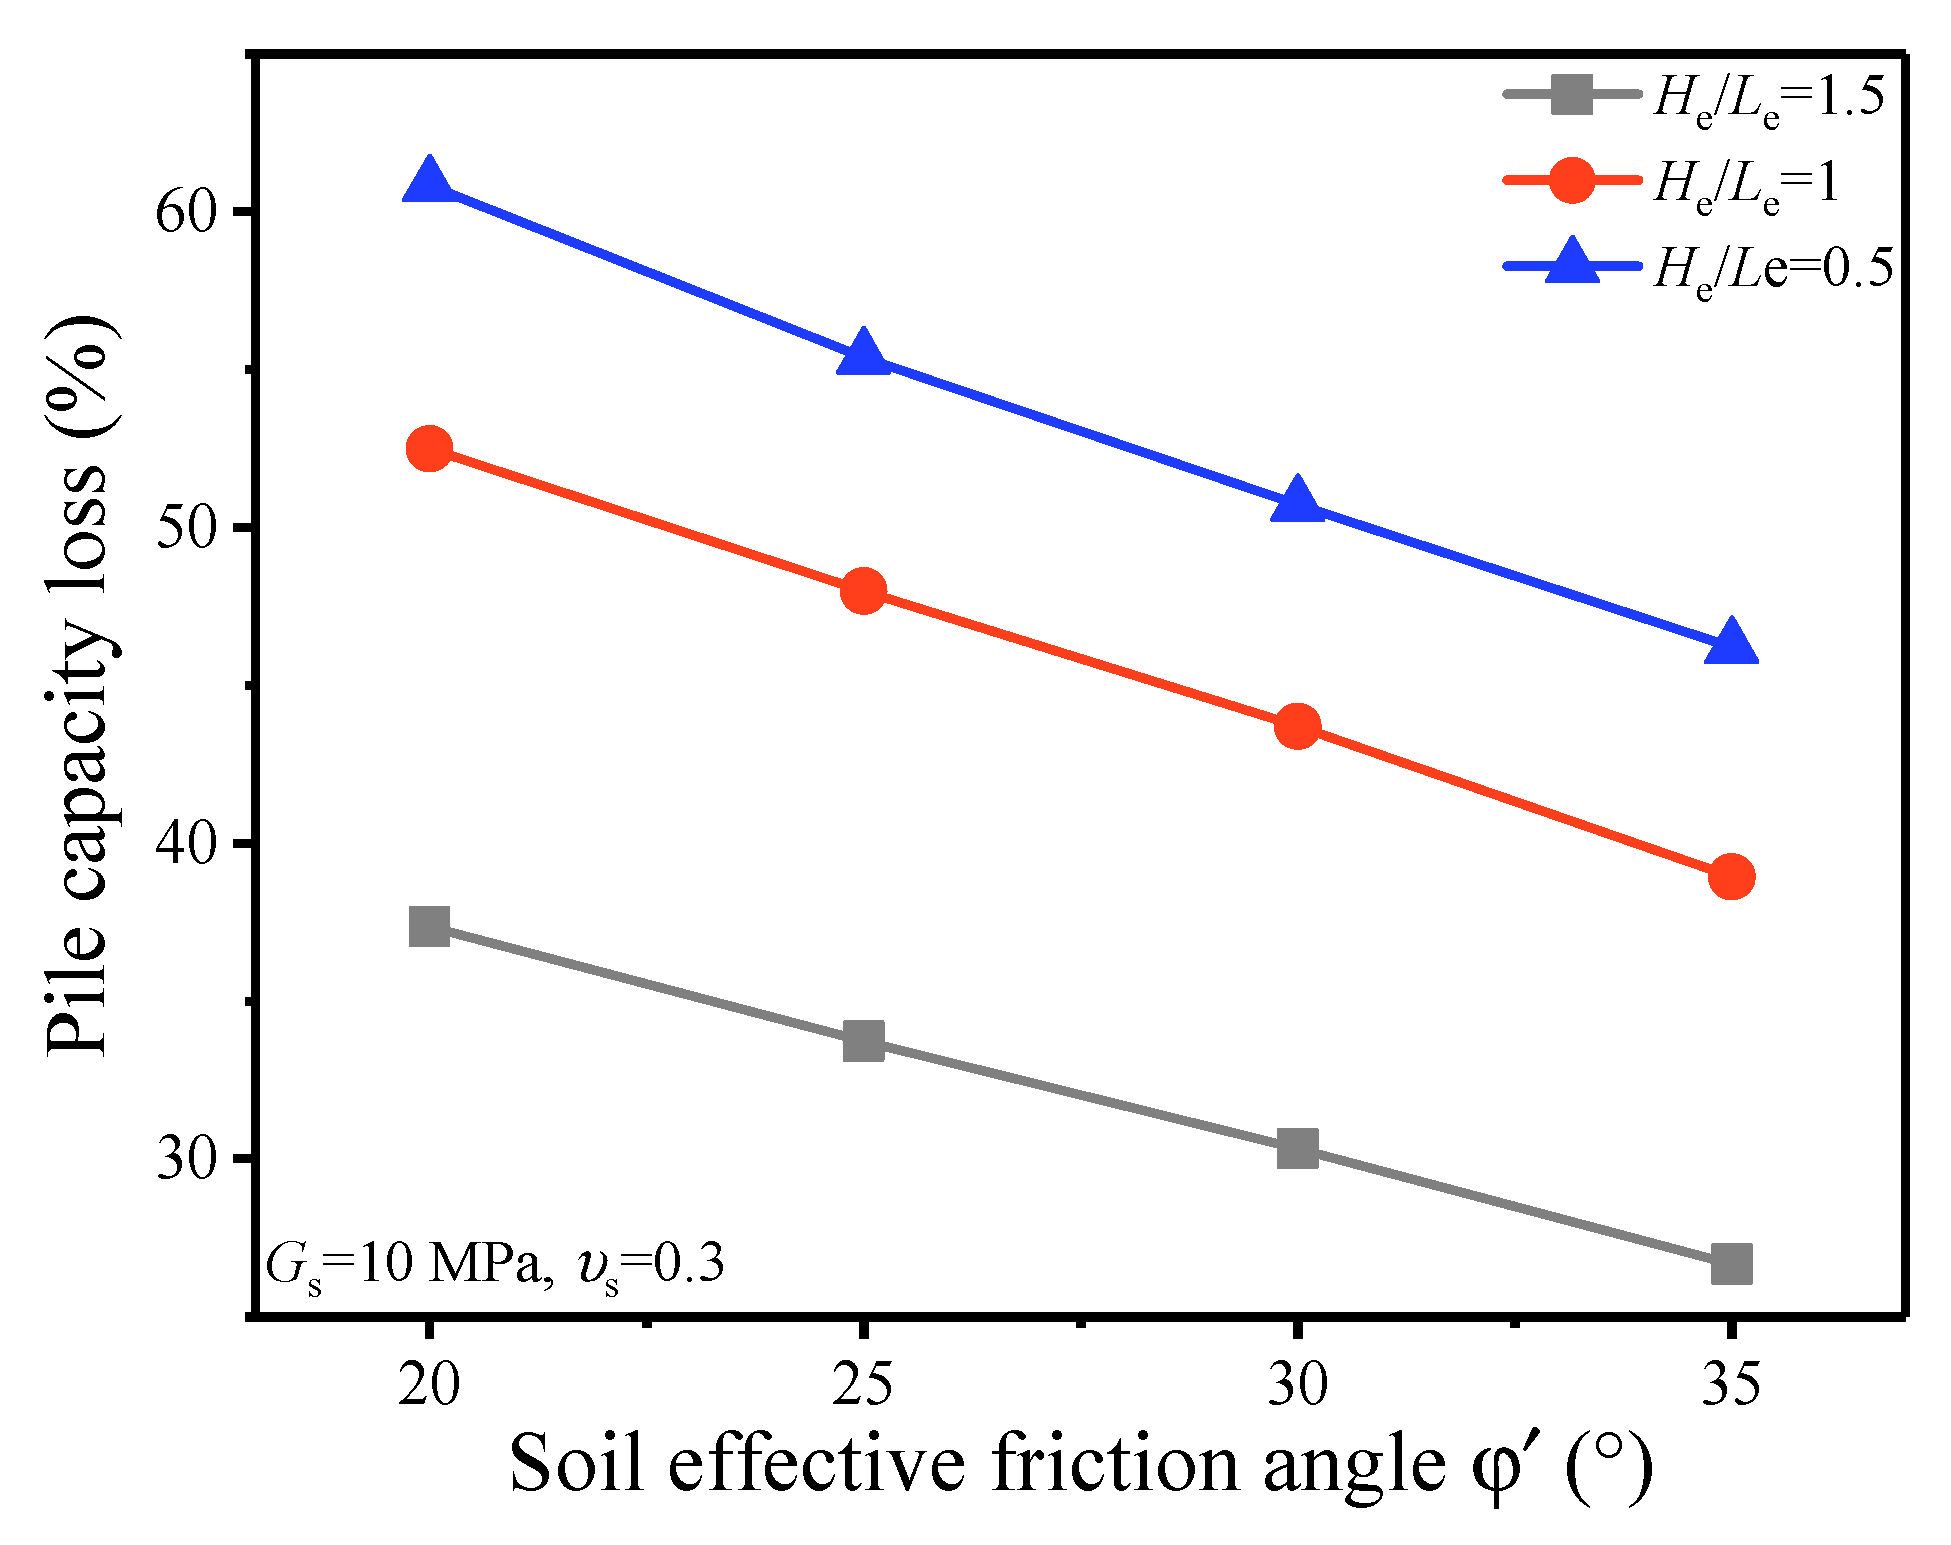
6.1. Effects of Soil Friction Angle on Change in Pile Capacity after Excavation

Figure 14 shows the relationship between pile uplift capacity loss and the soil effective friction angle φ′. It can be seen in this figure that the pile uplift capacity loss decreases linearly with the soil effective friction angle increases. When the effective pile length is equal to the excavation depth, i.e., He = Le, the pile capacity loss decreases from 52.5% to 38.9%, with the soil effective angle increasing from 20° to 35°. The ratio of the excavation depth to the effective pile length, i.e., He/Le, also has a significant effect on pile capacity loss. When the soil effective friction angle is 30°, the pile capacity loss increases from 30.3% to 50.7%, with the ratio of the excavation depth to the effective pile length decreasing from 1.5 to 0.5.

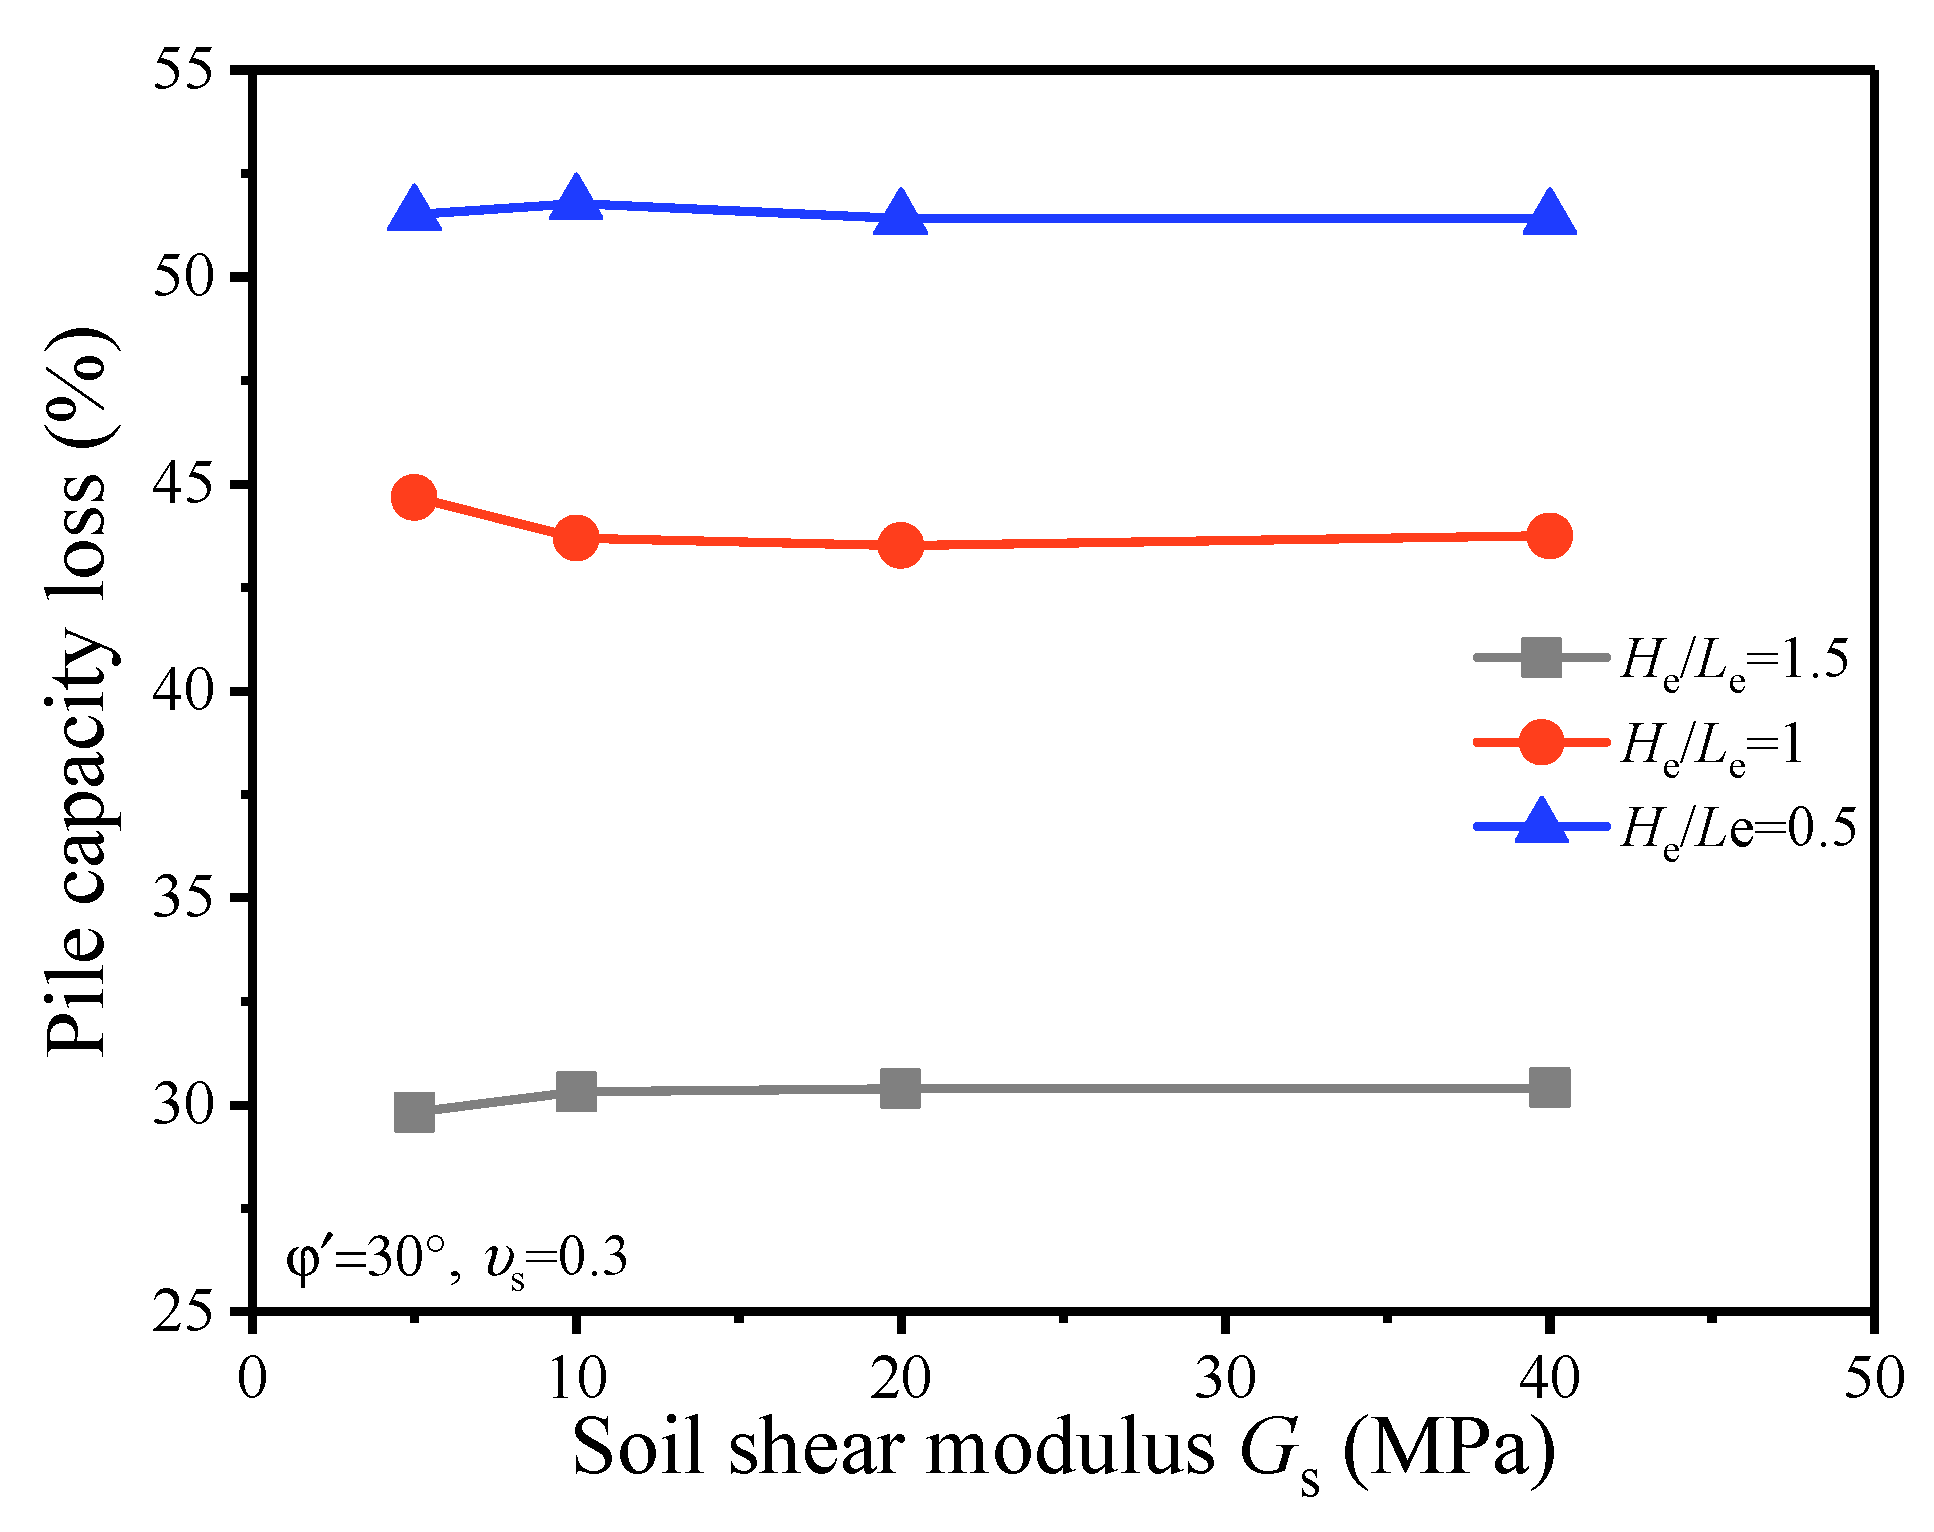
6.2. Effects of Soil Shear Modulus on Change in Pile Capacity after Excavation

Figure 15 shows the relationship between pile uplift capacity loss and the soil shear modulus Gs. It can be seen in this figure that the pile uplift capacity loss is not affected by the soil shear modulus. The soil shear modulus mainly affects the initial stiffness of the pile–soil interface, as shown in Figure 3. When the load increases to the uplift load, a sizeable pile–soil displacement occurs. Thus, the soil shear modulus hardly affects the pile capacity.

6.3. Effects of Soil Poisson’s Ratio on Change in Pile Capacity after Excavation

Figure 16 shows the relationship between pile uplift capacity loss and the soil Poisson’s ratio νs. It can be seen in this figure that the pile uplift capacity loss is not affected by the soil Poisson‘s ratio. Similarly, with decreasing ratio of the excavation depth to the effective pile length, the pile capacity loss increases.

7. Conclusions

This paper proposed a semi-analytical approach for evaluating the load-displacement behavior of a single uplift pile considering the effects of excavation. The proposed approach evaluated the pile–soil relative displacement caused by excavation before the uplifted load was applied. Thus, the effects of excavation were simulated. A hyperbolic model was used to model the nonlinear interaction of the pile–soil interface. The nonlinear shear displacement of the soil outside the pile–soil interface was introduced to obtain a more realistic load-displacement behavior of an uplift pile. Based on the proposed approach, an effective iterative program was implemented. Comparisons of the results derived from the proposed methods, well-documented field tests, centrifuge tests, and other analytical methods were presented to validate the proposed approach. A parametric study was conducted to investigate the effects of main soil properties on the pile capacity loss caused by the excavation. The main conclusions can be summarized as follows:
(1)
The comparisons between the results from the proposed methods, well-documented field tests, centrifuge tests, and other analytical methods showed that the proposed approach was suitable for analyzing an uplift pile considering excavation effects.
(2)
The soil friction angle has a great influence on the pile uplift capacity loss caused by the excavation. The pile capacity loss decreases linearly with increasing soil effective friction angle. When the effective pile length is equal to excavation depth, the pile capacity loss decreases from 52.5% to 38.9%, with the soil effective angle increasing from 20° to 35°.
(3)
The pile uplift capacity loss caused by the excavation is not affected by the soil shear modulus or Poisson’s ratio.
(4)
The pile uplift capacity loss caused by the excavation is related to the ratio of the excavation depth to the effective pile length. The pile capacity loss increases with the ratio of the excavation depth to the effective pile length decreases.
In this paper, the nonlinear shear displacement of the soil outside the pile–soil interface is considered. Nevertheless, the shear-induced soil shear modulus degradation and soil shear strength caused by principal stress rotation are not considered. Moreover, the proposed method is used for a single pile. A method used to evaluate the pile behavior change of pile groups after excavation should be developed. These shortcomings should be addressed in further study.

Author Contributions

Formula derivation, Z.L.; Data analysis, Z.L. and T.L.; Funding acquisition, S.L.; Project administration, S.L.; Writing—original draft, Z.L.; Writing—review and editing, Z.L. and K.W. All authors have read and agreed to the published version of the manuscript.

Funding

The research was financed by the National Natural Science Foundation of China (Grant No. 41972269), and the Jiangsu Provincial Transportation Engineering Construction Bureau (CX-2019GC02).

Institutional Review Board Statement

Not applicable.

Informed Consent Statement

Not applicable.

Data Availability Statement

Not applicable.

Conflicts of Interest

The authors declare no conflict of interest.

Appendix A

Expressions of matrixes in the semi-analytical approach.
K 1 = ( λ 1 , 0 h 2 2 2 1 λ 1 , 1 h 2 2 1 1 λ 1 , i h 2 2 1 1 λ 1 , n 1 h 2 2 1 2 λ 1 , n h 2 2 ) n + 1 × n + 1 F 1 = [ λ 1 , 0 h 2 ( ω s 0 , 0 + ω s τ 1 , 0 ) , , λ 1 , i h 2 ( ω s 0 , i + ω s τ 1 , i ) , , λ 1 , n 1 h 2 ( ω s 0 , n 1 + ω s τ 1 , n 1 ) , λ 1 , n h 2 ( ω s 0 , n + ω s τ 1 , n ) ] K 2 = ( λ 2 , 1 h 2 2 1 1 λ 2 , 2 h 2 2 1 1 λ 2 , i h 2 2 1 1 λ 2 , n 1 h 2 2 1 2 λ 2 , n h 2 2 ) n × n F 2 = [ λ 2 , 1 h 2 ( ω s p , 1 ω s τ 2 , 1 + S p , 1 ) ω 0 , λ 2 , 2 h 2 ( ω s p , 2 ω s τ 2 , 2 + S p , 2 ) , , λ 2 , i h 2 ( ω s p , i ω s τ 2 , i + S p , i ) , , λ 2 , n h 2 ( ω s p , n ω s τ 2 , n + S p , n ) ]
F 1 = [ λ 1 , 0 h 2 ( ω s 0 , 0 + ω s τ 1 , 0 ) , , λ 1 , i h 2 ( ω s 0 , i + ω s τ 1 , i ) , , λ 1 , n 1 h 2 ( ω s 0 , n 1 + ω s τ 1 , n 1 ) , λ 1 , n h 2 ( ω s 0 , n + ω s τ 1 , n ) ]
K 2 = ( λ 2 , 1 h 2 2 1 1 λ 2 , 2 h 2 2 1 1 λ 2 , i h 2 2 1 1 λ 2 , n 1 h 2 2 1 2 λ 2 , n h 2 2 ) n × n
F 2 = [ λ 2 , 1 h 2 ( ω s p , 1 ω s τ 2 , 1 + S p , 1 ) ω 0 , λ 2 , 2 h 2 ( ω s p , 2 ω s τ 2 , 2 + S p , 2 ) , , λ 2 , i h 2 ( ω s p , i ω s τ 2 , i + S p , i ) , , λ 2 , n h 2 ( ω s p , n ω s τ 2 , n + S p , n ) ]

References

  1. Xu, J.; Franza, A.; Marshall, A.M.; Losacco, N. Role of Footing Embedment on Tunnel-Foundation Interaction. J. Geotech. Geoenviron. Eng. 2021, 147, 06021009. [Google Scholar] [CrossRef]
  2. Cheng, K.; Xu, R.; Ying, H.; Gan, X.; Zhang, L.; Liu, S. Observed performance of a 30.2 m deep-large basement excavation in Hangzhou soft clay. Tunn. Undergr. Space Technol. 2021, 111, 103872. [Google Scholar] [CrossRef]
  3. Zadehmohamad, M.; Bazaz, J.B.; Riahipour, R.; Farhangi, V. Physical modeling of the long-term behavior of integral abutment bridge backfill reinforced with tire-rubber. Int. J. Geo-Eng. 2021, 12, 1–19. [Google Scholar] [CrossRef]
  4. Sun, Y.; Shen, S.; Xu, Z.; Xia, X. Prediction of lateral displacement of soil behind the reaction wall caused by pipe jacking operation. Tunn. Undergr. Space Technol. 2014, 40, 210–217. [Google Scholar] [CrossRef]
  5. Wrzesiński, G.; Lechowicz, Z. Testing of undrained shear strength in a hollow cylinder apparatus. Studia Geotech. Mech. 2015, 37, 69–73. [Google Scholar] [CrossRef] [Green Version]
  6. Wrzesiński, G. Anisotropy of soil shear strength parameters caused by the principal stress rotation. Arch. Civ. Eng. 2021, 67, 163–187. [Google Scholar]
  7. Wrzesiński, G.; Markiewicz, A. Prediction of Permeability Coefficient k in Sandy Soils Using ANN. Sustainability 2022, 14, 6736. [Google Scholar] [CrossRef]
  8. Taishan, L.; Songyu, L.; Guojun, C.; Kai, W.; Zan, L. Effect of Excavation Disturbance on Clayey Soil Mechanical Properties and Pile Capacity. Int. J. Geomech. 2022, 22, 5022003. [Google Scholar] [CrossRef]
  9. Feng, R.F.; Zhang, Q.Q.; Liu, S.W. Experimental study of the effect of excavation on existing loaded piles. J. Geotech. Geoenviron. Eng. 2020, 146, 04020091. [Google Scholar] [CrossRef]
  10. Zheng, G.; Peng, S.Y.; Ng, C.; Diao, Y. Excavation effects on pile behaviour and capacity. Can. Geotech. J. 2012, 49, 1347–1356. [Google Scholar] [CrossRef]
  11. Karimipour, A.; Farhangi, V. Effect of EBR- and EBROG-GFRP laminate on the structural performance of corroded reinforced concrete columns subjected to a hysteresis load. Structures 2021, 34, 1525–1544. [Google Scholar] [CrossRef]
  12. Zhang, Q.; Liu, S.; Feng, R.; Li, X. Analytical method for prediction of progressive deformation mechanism of existing piles due to excavation beneath a pile-supported building. Int. J. Civ. Eng. 2019, 17, 751–763. [Google Scholar] [CrossRef]
  13. Troughton-Ove, V.M. The effects of changes in effective stress on a base grouted pile in sand. In Piling and Deep Foundations, Proceedings of the International Conference on Piling and Deep Foundations, London, UK, 15–18 May 1989; CRC Press: Boca Raton, FL, USA; p. 445.
  14. Zheng, G.; Diao, Y.; Ng, C. Parametric analysis of the effects of stress relief on the performance and capacity of piles in nondilative soils. Can. Geotech. J. 2011, 48, 1354–1363. [Google Scholar] [CrossRef]
  15. Li, J.J.; Huang, M.S.; WANG, W.; Chen, Z. Centrifugal model tests on bearing capacity of uplift piles under deep excavation. Chin. J. Geotech. Eng. 2010, 32, 388–396. [Google Scholar]
  16. Lee, C.J.; Al-Tabbaa, A.; Bolton, M.D. Development of tensile force in piles in swelling ground. In Soft Soil Engineering; Lee, C.F., Lau, C.K., Ng, C.W., Kwong, A.K., Pang, P.L., Yin, J.H., Yue, Z.Q., Eds.; Routledge: Oxfordshire, UK, 2001; pp. 345–350. ISBN 90-265-1866-8. [Google Scholar]
  17. Zhang, Q.Q.; Li, S.C.; Liang, F.Y.; Yang, M.; Zhang, Q. Simplified method for settlement prediction of single pile and pile group using a hyperbolic model. Int. J. Civ. Eng. 2014, 12, 146–159. [Google Scholar]
  18. Wang, Z.; Xie, X.; Wang, J. A new nonlinear method for vertical settlement prediction of a single pile and pile groups in layered soils. Comput. Geotech. 2012, 45, 118–126. [Google Scholar] [CrossRef]
  19. Baziar, M.H.; Saeedi Azizkandi, A.; Kashkooli, A. Prediction of pile settlement based on cone penetration test results: An ANN approach. KSCE J. Civ. Eng. 2015, 19, 98–106. [Google Scholar] [CrossRef]
  20. Chung, S.-H.; Yang, S.-R. Numerical analysis of small-scale model pile in unsaturated clayey soil. Int. J. Civ. Eng. 2017, 15, 877–886. [Google Scholar] [CrossRef]
  21. Liu, S.W.; Zhang, Q.Q.; Cui, C.Y.; Feng, R.F.; Cui, W. A simplified approach for the response of pile groups composed of dissimilar piles. In Structures; Elsevier: Amsterdam, The Netherlands, 2021; Volume 34. [Google Scholar]
  22. Lashkari, A. A simple critical state interface model and its application in prediction of shaft resistance of non-displacement piles in sand. Comput. Geotech. 2017, 88, 95–110. [Google Scholar] [CrossRef]
  23. Zhang, Q.; Zhang, Z.-M.; He, J.-Y. A simplified approach for settlement analysis of single pile and pile groups considering interaction between identical piles in multilayered soils. Comput. Geotech. 2010, 37, 969–976. [Google Scholar] [CrossRef]
  24. Li, L.; Li, J.; Sun, D.; Gong, W. Semi-analytical approach for time-dependent load-settlement response of a jacked pile in clay strata. Can. Geotech. J. 2017, 54, 1682–1692. [Google Scholar] [CrossRef] [Green Version]
  25. Li, L.; Dong, L.; Lu, C.; Wu, W.; Wen, M.; Liang, R. Analysis of Bearing Characteristics of Energy Pile Group Based on Exponential Model. Energies 2021, 14, 6881. [Google Scholar] [CrossRef]
  26. Zhang, Q.; Zhang, Z.-M. A simplified nonlinear approach for single pile settlement analysis. Can. Geotech. J. 2012, 49, 1256–1266. [Google Scholar] [CrossRef]
  27. Kim, S.; Jeong, S.; Cho, S.; Park, I. Shear load transfer characteristics of drilled shafts in weathered rocks. J. Geotech. Geoenviron. Eng. 1999, 125, 999–1010. [Google Scholar] [CrossRef]
  28. Randolph, M.F.; Wroth, C.P. An analysis of the vertical deformation of pile groups. Geotechnique 1979, 29, 423–439. [Google Scholar] [CrossRef]
  29. Zhang, Q.; Zhang, Z.-M. Simplified calculation approach for settlement of single pile and pile groups. J. Comput. Civ. Eng. 2012, 26, 750–758. [Google Scholar] [CrossRef]
  30. Zhang, Q.-Q.; Li, S.-C.; Zhang, Q.; Li, L.-P.; Zhang, B. Analysis on Response of a Single Pile Subjected to Tension Load Using a Softening Model and a Hyperbolic Model. Mar. Georesour. Geotechnol. 2015, 33, 167–176. [Google Scholar] [CrossRef]
  31. Kulhawy, F.H.; Mayne, P.W. Manual on Estimating Soil Properties for Foundation Design; Technical report No. EPRI-EL-6800; Electric Power Research Institute: Palo Alto, CA, USA, 1990. [Google Scholar]
  32. Miller, G.A.; Lutenegger, A.J. Influence of pile plugging on skin friction in overconsolidated clay. J. Geotech. Geoenviron. Eng. 1997, 123, 525–533. [Google Scholar] [CrossRef]
  33. Sowa, V.A. Pulling capacity of concrete cast in situ bored piles. Can. Geotech. J. 1970, 61, 482–493. [Google Scholar] [CrossRef]
  34. Goel, S.; Patra, N.R. Prediction of load displacement response of single piles under uplift load. Geotech. Geol. Eng. 2007, 25, 57–64. [Google Scholar] [CrossRef]
  35. Guerra, L. Physical Modeling of Bored Piles in Sand. Ph.D. Thesis, Ferrara University, Ferara, Italy, 2010. [Google Scholar]
  36. Loukidis, D.; Salgado, R. Analysis of the shaft resistance of non-displacement piles in sand. Geotechnique 2008, 58, 283–296. [Google Scholar] [CrossRef] [Green Version]
  37. Cui, C.Y.; Wang, S.J.; Liu, Q.; Zhang, Y.L. An approach for response prediction of a single pile subjected to tension load considering modulus degradation of soil. Geotech. Geol. Eng. 2020, 38, 1195–1203. [Google Scholar] [CrossRef]
  38. Hu, Q.; Ling, D.S.; Kong, L.G.; Luo, Y.W.; Niu, M.; Chen, Z. Effects of deep excavation on uplift capacity of piles by centrifuge tests. Chin. J. Geotech. Eng. 2013, 35, 1076–1083. [Google Scholar]
Figure 1. Pile behavior during excavation unloading and pile loading.
Applsci 12 06717 g001
Figure 2. Schematic of basal heave calculation.
Applsci 12 06717 g002
Figure 3. Hyperbolic load-transfer curve for pile shaft during excavation unloading.
Applsci 12 06717 g003
Figure 4. Hyperbolic load-transfer curve for pile shaft during pile loading.
Applsci 12 06717 g004
Figure 5. Schematic of discretization of a pile for numerical difference analysis.
Applsci 12 06717 g005
Figure 6. Measured and calculated load-displacement curves of a single uplift pile ([30,33,34]).
Applsci 12 06717 g006
Figure 7. Comparison between calculated and centrifuge test results of a single pile ([22,35,37]).
Applsci 12 06717 g007
Figure 8. A sketch of the centrifuge model tests: (a) before excavation, (b) after excavation.
Applsci 12 06717 g008
Figure 9. Comparison between the calculated and centrifuge test results of an uplift pile before and after excavation.
Applsci 12 06717 g009
Figure 10. A sketch of the centrifuge tests: (a) plane view, (b) front view.
Applsci 12 06717 g010
Figure 11. Comparison between the results from finite element method, centrifuge test and the proposed approach before and after excavation.
Applsci 12 06717 g011
Figure 12. Calculation model for the parametric study.
Applsci 12 06717 g012
Figure 13. Schematic of the determination of the pile uplift capacity.
Applsci 12 06717 g013
Figure 14. Effects of soil effective friction angle on pile uplift capacity loss with various ratios of excavation depth to effective pile length.
Applsci 12 06717 g014
Figure 15. Effects of soil shear modulus on pile uplift capacity loss with various ratios of excavation depth to effective pile length.
Applsci 12 06717 g015
Figure 16. Effects of soil Poisson’s on pile uplift capacity loss with various ratios of excavation depth to effective pile length.
Applsci 12 06717 g016
Table 1. Suggested value of K / K 0 and δ .
Suggested ValuesPile-soil ConditionReference
K / K 0 = 0.7 1.2 Smooth steel pipe piles or concrete
piles (Small-displacement piles)
Kulhawy and Many [31]
K / K 0 = 1.0 2.0 Smooth steel pipe piles or concrete
piles (Large displacement piles)
Kulhawy and Many [31]
K / K 0 = 1.0 Driven or jacked open-ended steel pile piles, normally consolidated soilMiller and Lutenegger [32]
K / K 0 = 1.0 4.0 Driven or jacked open-ended steel pile piles, overconsolidated clayMiller and Lutenegger [32]
δ = ( 0.5 0.7 ) φ Smooth steel pipe piles or H-pilesKulhawy and Many [31]
δ = ( 0.8 1.0 ) φ Smooth concrete pilesKulhawy and Many [31]
Table 2. Physical and mechanical properties of sandy silt.
Water Content
(%)
Density
(kg·m−3)
Void RatioConstrained Modulus
(MPa)
Cohesion
(kPa)
Effective Friction Angle
(°)
9.8515400.953.921.0834.0
Table 3. Mechanical properties of sandy silt and parameters of pile–soil interface.
Pile–Soil Friction Angle
(°)
Unit Weight
(kN·m−3)
Coefficient of Earth PressureConstrained Modulus
(MPa)
Cohesion
(kPa)
Soil Friction Angle
(°)
1818.60.49481.730.6
Table 4. Variables in the parametric study.
He/LeνGs (MPa)φ′ (°)
0.5, 1, 1.50.2, 0.3 0.4 0.55, 10, 20, 4020, 25, 30, 35
Note: The unloading modulus of soil can be determined as: Eur = 2(1 + ν)Gs.
Publisher’s Note: MDPI stays neutral with regard to jurisdictional claims in published maps and institutional affiliations.

