Article

Experimental and Numerical Study of Pressure Drop Characteristics of Soybean Grain under Vertical Pressure

1
College of Civil Engineering, Henan University of Technology, Zhengzhou 450001, China
2
Henan International Joint Laboratory of Modern Green Ecological Storage System, Zhengzhou 450001, China
3
Henan Key Laboratory of Grain Storage Facility and Safety, Zhengzhou 450001, China
*
Author to whom correspondence should be addressed.
Appl. Sci. 2022, 12(14), 6830; https://doi.org/10.3390/app12146830
Submission received: 4 June 2022 / Revised: 29 June 2022 / Accepted: 4 July 2022 / Published: 6 July 2022
(This article belongs to the Section Agricultural Science and Technology)

Abstract

:
The vertical pressure lead to increased airflow resistance through the grain bulk, which affected the efficiency of ventilation and drying. The effects of vertical pressures at 50, 150, and 250 kPa on the pressure drop characteristics of soybeans were studied using experiment and numerical simulation. The random packing and different compression states for soybean packed beds were generated by the Discrete Element Method (DEM). The Discrete Element Method (DEM) and Computational Fluid Dynamics (CFD) were coupled to investigate the radial velocity and pressure drop of soybean bulk. The simulation results showed that the radial porosity had an oscillating distribution, and the radial average dimensionless velocity was consistent with the distribution trend of porosity. The increase in vertical pressure causes a decrease in porosity and an increase in local velocity. The PathFinder code was used as a supplementary method to calculate the pore path and pore characterization parameters, and the resistance coefficient term in the Forchheimer equation was determined. The compression of soybeans measured by the experiment mainly occurred within two hours after loading. The pressure drop of soybeans increased with the vertical pressure, with the average pressure drop at vertical pressures of 50, 150, and 250 kPa being 36%, 57%, and 92% higher than the uncompressed state (0 kPa). The pressure drop of soybeans calculated by the DEM-CFD method and the Forchheimer equation under different vertical pressures were in close agreement with the experimental results, and an average relative difference was found to be less than 10%. These results provide guidance for estimating the pressure drop of soybeans at different grain depths.

1. Introduction

Soybeans are mostly stored in bulk after harvesting, cleaning, and drying. Temperature and moisture in the grain storage ecosystem are principal factors affecting the security of grain storage. To ensure grain quality, grain bulk must be kept below a safe moisture level and temperature [1,2]. Effective aeration, temperature control, and humidity control measures are required promptly after monitoring abnormally high local grain temperatures. Aeration, the most commonly utilized method in grain storage technology, maintains the temperature in the grain bulk and avoids the temperature fluctuation caused by convection, grain metabolism, and insect and microbial growth [3,4]. In the grain bulk, the vertical pressure distribution is different due to the self-weight of grain. The grain is subjected to different levels of compression. The bulk density and porosity change with vertical pressure [5,6,7].
The process of aeration is to force external air into the grain bulk and thus reduce the grain temperature. However, airflow through the grain is hindered. Airflow resistance is the pressure drop per unit of grain depth due to friction and turbulence. Therefore, the fan power in the aeration system needs to overcome the airflow resistance through the grain bulk. Fans that are selected incorrectly lead to uneven cooling or increased aeration costs [8]. Specifying the airflow resistance through grain bulk is the basis of aeration system design.
Granular materials have creeping compression characteristics, which are more obvious under vertical pressure. As a typical porous medium, grain bulk has an irregular pore structure, making airflow characteristics more complex and variable [9]. Neethirajan et al. [10] found that the long axis of grain particles is more inclined in the horizontal direction after they enter the bin, which results in a higher porosity in the horizontal direction as compared to the vertical direction, leading to a difference in airflow resistance in the horizontal and vertical direction. Haque [11] showed that the bulk density and porosity change with the spatial position of the grain bulk, and the pressure drop considering the change in porosity will be higher than the value calculated by the Shedd equation. The pressure drop through grain bulk is greatly affected by the pore characteristics. For grain aeration technology, it is critical to determine the pressure drop through grain bulk under vertical pressure. Pressure drop in rice [12,13,14], wheat [15,16], soybeans [17], corn [18], rape [19], and other crops has been studied using a variety of variables such as airflow velocity, bed depth, moisture content, filling mode, and theoretical models of pressure drop calculation [20,21].
Khatchatourian et al. [22] found that since the grain is compacted with the increase in depth, the airflow velocity and pressure drop through the grain bulk change significantly with the heterogeneous pore structure. Kobus et al. [23] showed that the airflow resistance through oat grains increased with the external load and loading time. Haque et al. [24] and Cheng et al. [25] showed that the porosity decreased under vertical pressure, which increased the airflow resistance of the grain bulk and hindered the aeration operation. Yue et al. [26] verified that the pore structure in grain bulk is more complex and tortuous after compacting, resulting in higher airflow resistance.
Experimental and theoretical formula calculation methods are often used to study the pressure drop of the grain bulk, but there are few accurate and efficient numerical calculation models. Moses et al. [27] obtained a nonlinear model by the finite element method to study the airflow distribution in a three-dimensional grain-packed bed. Khatchatourian et al. [28] simulated the airflow distribution in the bin, after considering the inhomogeneity of porosity at different depths. But the above numerical calculation model cannot reflect the real pore structure distribution of packed grain particles. DEM, an efficient method to study the particle-packed structure in recent years, can construct the real-packed and compressed processes of particles [29]. The DEM-CFD coupling method, which has been widely used in biomass drying [30], chemical mass transfer [31], and nuclear reaction [32], can accurately simulate airflow and heat transfer processes in the packed bed.
In this research, an apparatus was designed to measure the airflow resistance through soybeans under vertical compression. Soybean pile units at different locations in grain silos were used as the research objects. The effects of the pressure drop characteristics of soybeans at 50, 150, and 250 kPa vertical pressures were studied through vertical compression and aeration tests. The DEM was used to simulate the random packing and compression process of soybeans, and the airflow velocity and pressure drop of soybeans at different vertical pressures were simulated and analyzed by the DEM-CFD method. The airflow path distribution and pressure drop equation coefficients were predicted based on the PathFinder code. The simulated and equation-calculated pressure drops were compared with experiments to verify their reliability.

2. Materials and Methods

2.1. Materials

The soybean used in this experiment was Zhonghuang 39, harvested in 2020. The soybean sample was filtered through a circular sieve to remove broken grains and foreign impurities. The initial moisture content of soybean samples was determined to be 12.8 ± 0.1% (w. b.) after drying at 103 °C for 72 h [33]. To determine the size characteristics of single soybean grains, 100 grains were randomly selected to measure their triaxial dimensions of length, width, and thickness. The geometric mean diameter was calculated using the procedure proposed by Aghbashlo [34]. The method of calculation is shown in Equation (1):
d p = 3 L p W p T p ( L p W p + L p T p + W p T p ) 1
where dp is the geometric mean diameter of the single soybean grain; Lp, Wp, and Tp are the length, width, and thickness of the soybean grain. The average diameter of soybean particles used in this experiment was dp = 7.24 mm.

2.2. Experimental Apparatus

In Figure 1, the experimental apparatus with the aeration and the compaction system measures the pressure drop and compression characteristics. The aeration system includes a test chamber, a centrifugal fan, and a PVC pipeline. The test chamber is cylindrical, made of transparent acrylic sheet, with a diameter of 100 mm. The bottom is connected to the perforated sheet and installed on the support table. The centrifugal fan (Model RYP-025, Shanghai Junjie mechanical equipment Co., Ltd., Shanghai, China) is controlled by a frequency inverter (Model ZK880, Zhengkong New Energy Co., Ltd., Zhejiang, China) to obtain different inlet velocities. The PVC pipeline connects the centrifugal fan to the test chamber and uses a flowmeter (model 6443-DN80, Testo, Sparta Township, NJ, USA) installed on it to measure the airflow. Static pressure at the pressure taps was measured using a digital micromanometer (model DP-5815, TSI, Shoreview, MN, USA). To minimize the loss of air pressure, all pipeline connections were sealed. The vertical pressure was applied to the grain by a perforated load sheet. The weights were loaded on a tray, and the vertical pressure was transmitted to the perforated load sheet through a lever. During the experiment, air flowed upward and the grain was compressed downward.

2.3. Experimental Procedure

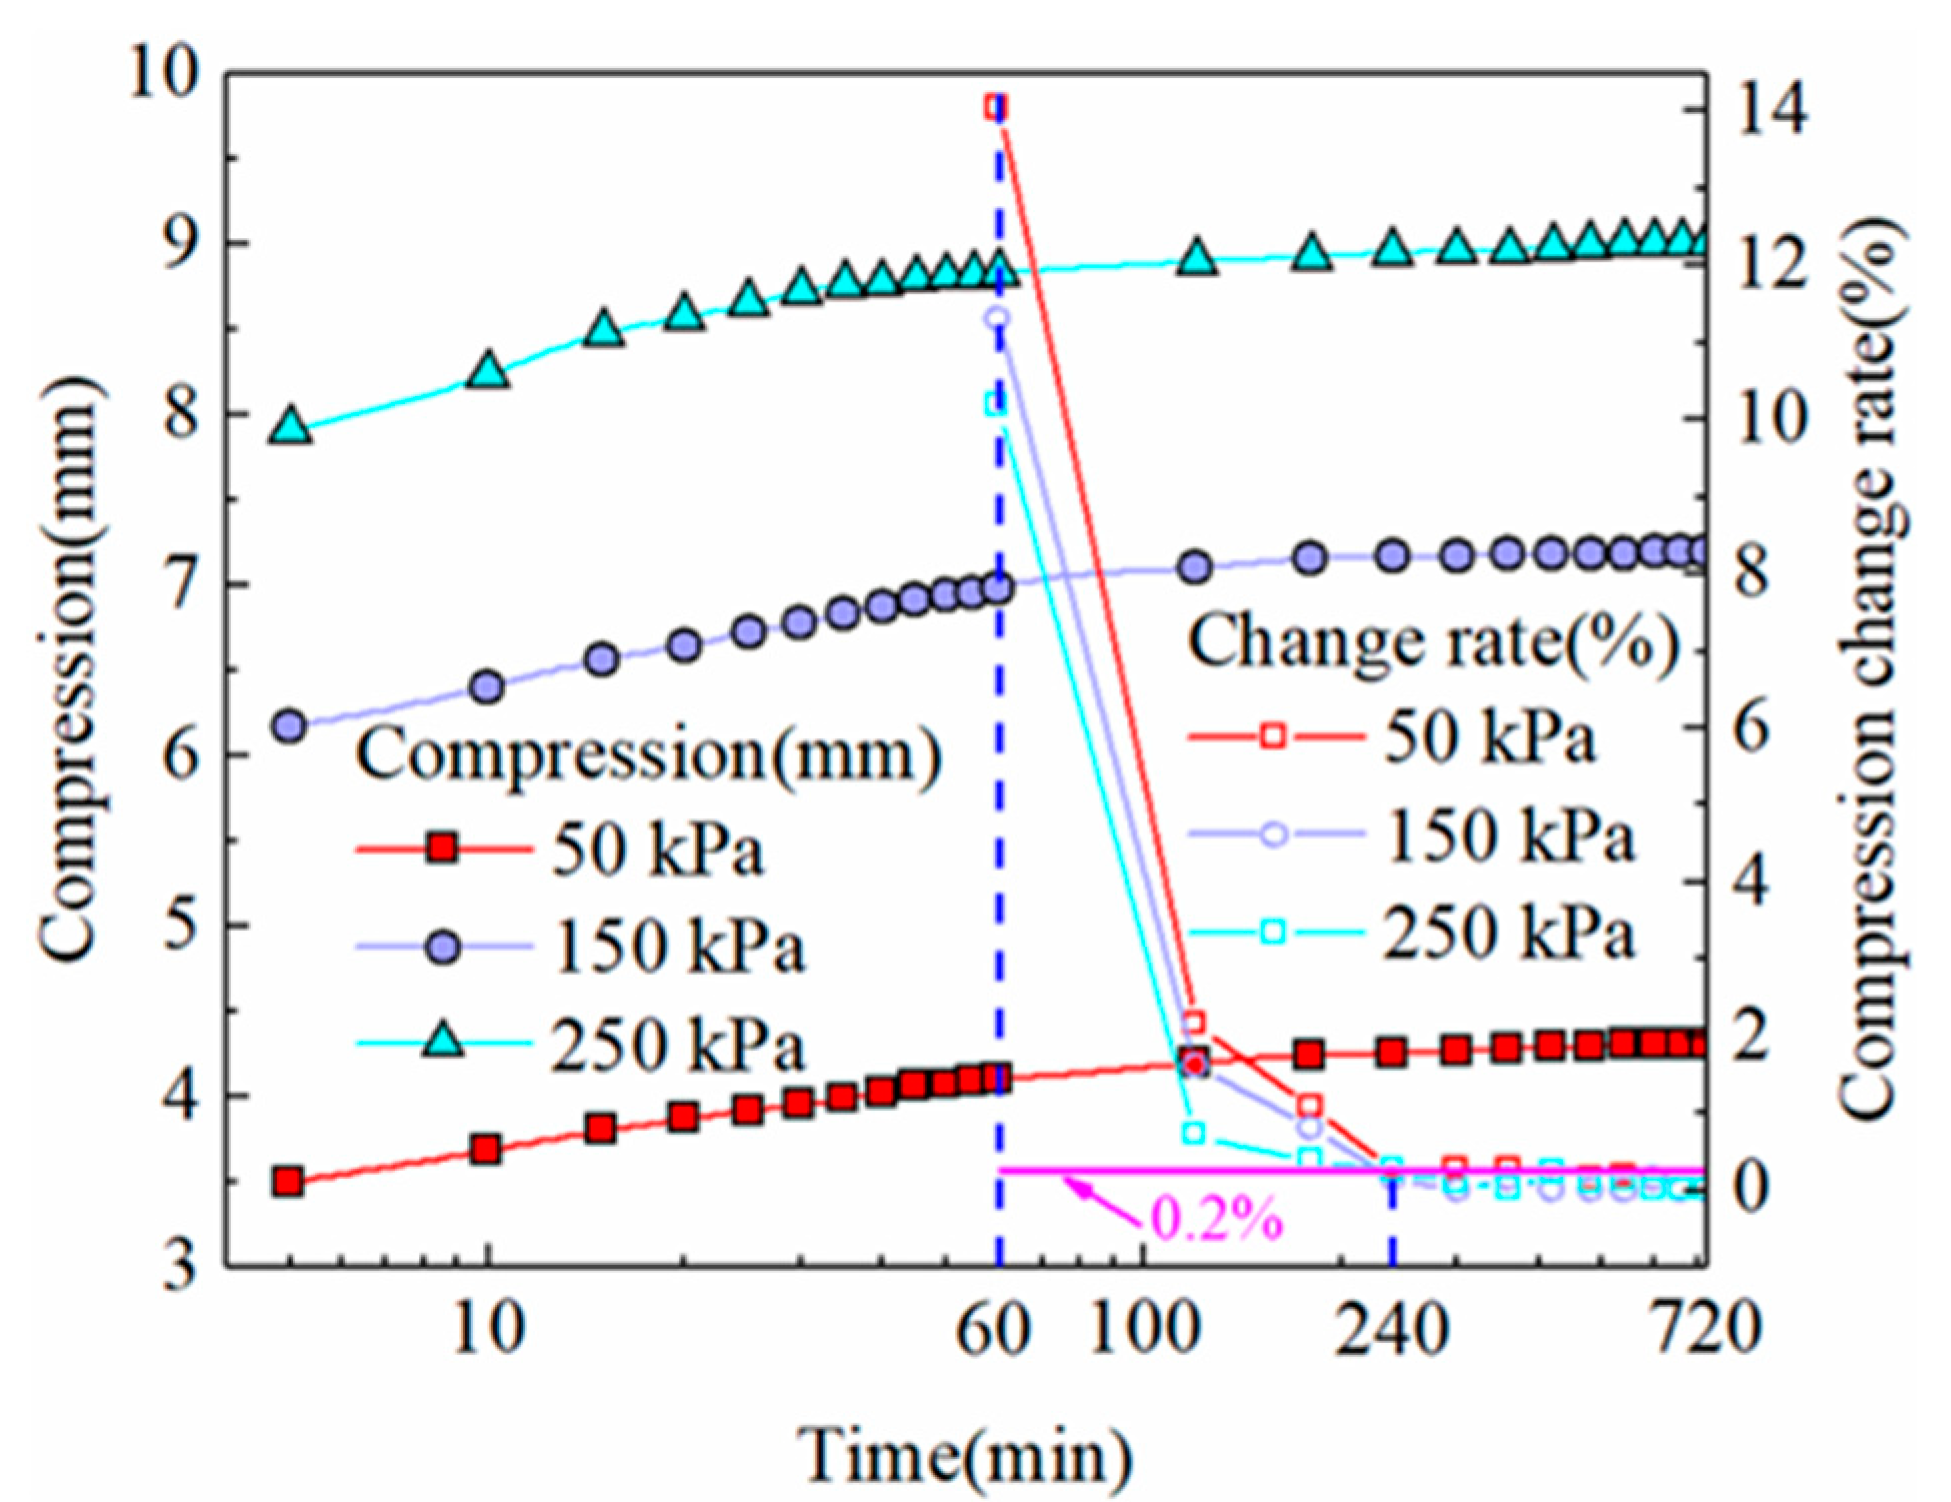
The soybean samples were dropped into the test chamber, and the grain surface was paved. The perforated loading sheet was placed on the grain surface. The loading rod was kept vertical, the lever was adjusted to horizontal, and the height of the packed grain section was recorded H = 75 mm. The pressure drop of the grain samples was measured without vertical pressure (0 kPa). The inlet velocity was set in a range of 0.02 to 0.6 m/s, and the static pressure at the pressure tap under different velocities was recorded. Tests were set up with three vertical pressures of 50, 150, and 250 kPa, and the displacement of the perforated loading sheet was obtained using a digital caliper every 5 min during the first hour after loading and every hour until the test was finished. Bulk grains show creep deformation under load, and grain compression reaches stability when the change in displacement is less than 0.2% of the total displacement [7,25]. The test measured the change in 12 h. After each set of compression tests was stabilized, the pressure drop under different vertical pressures was measured at the same inlet velocity as the uncompressed state (0 kPa).

3. Numerical Simulation Models and Methods

3.1. DEM Modeling

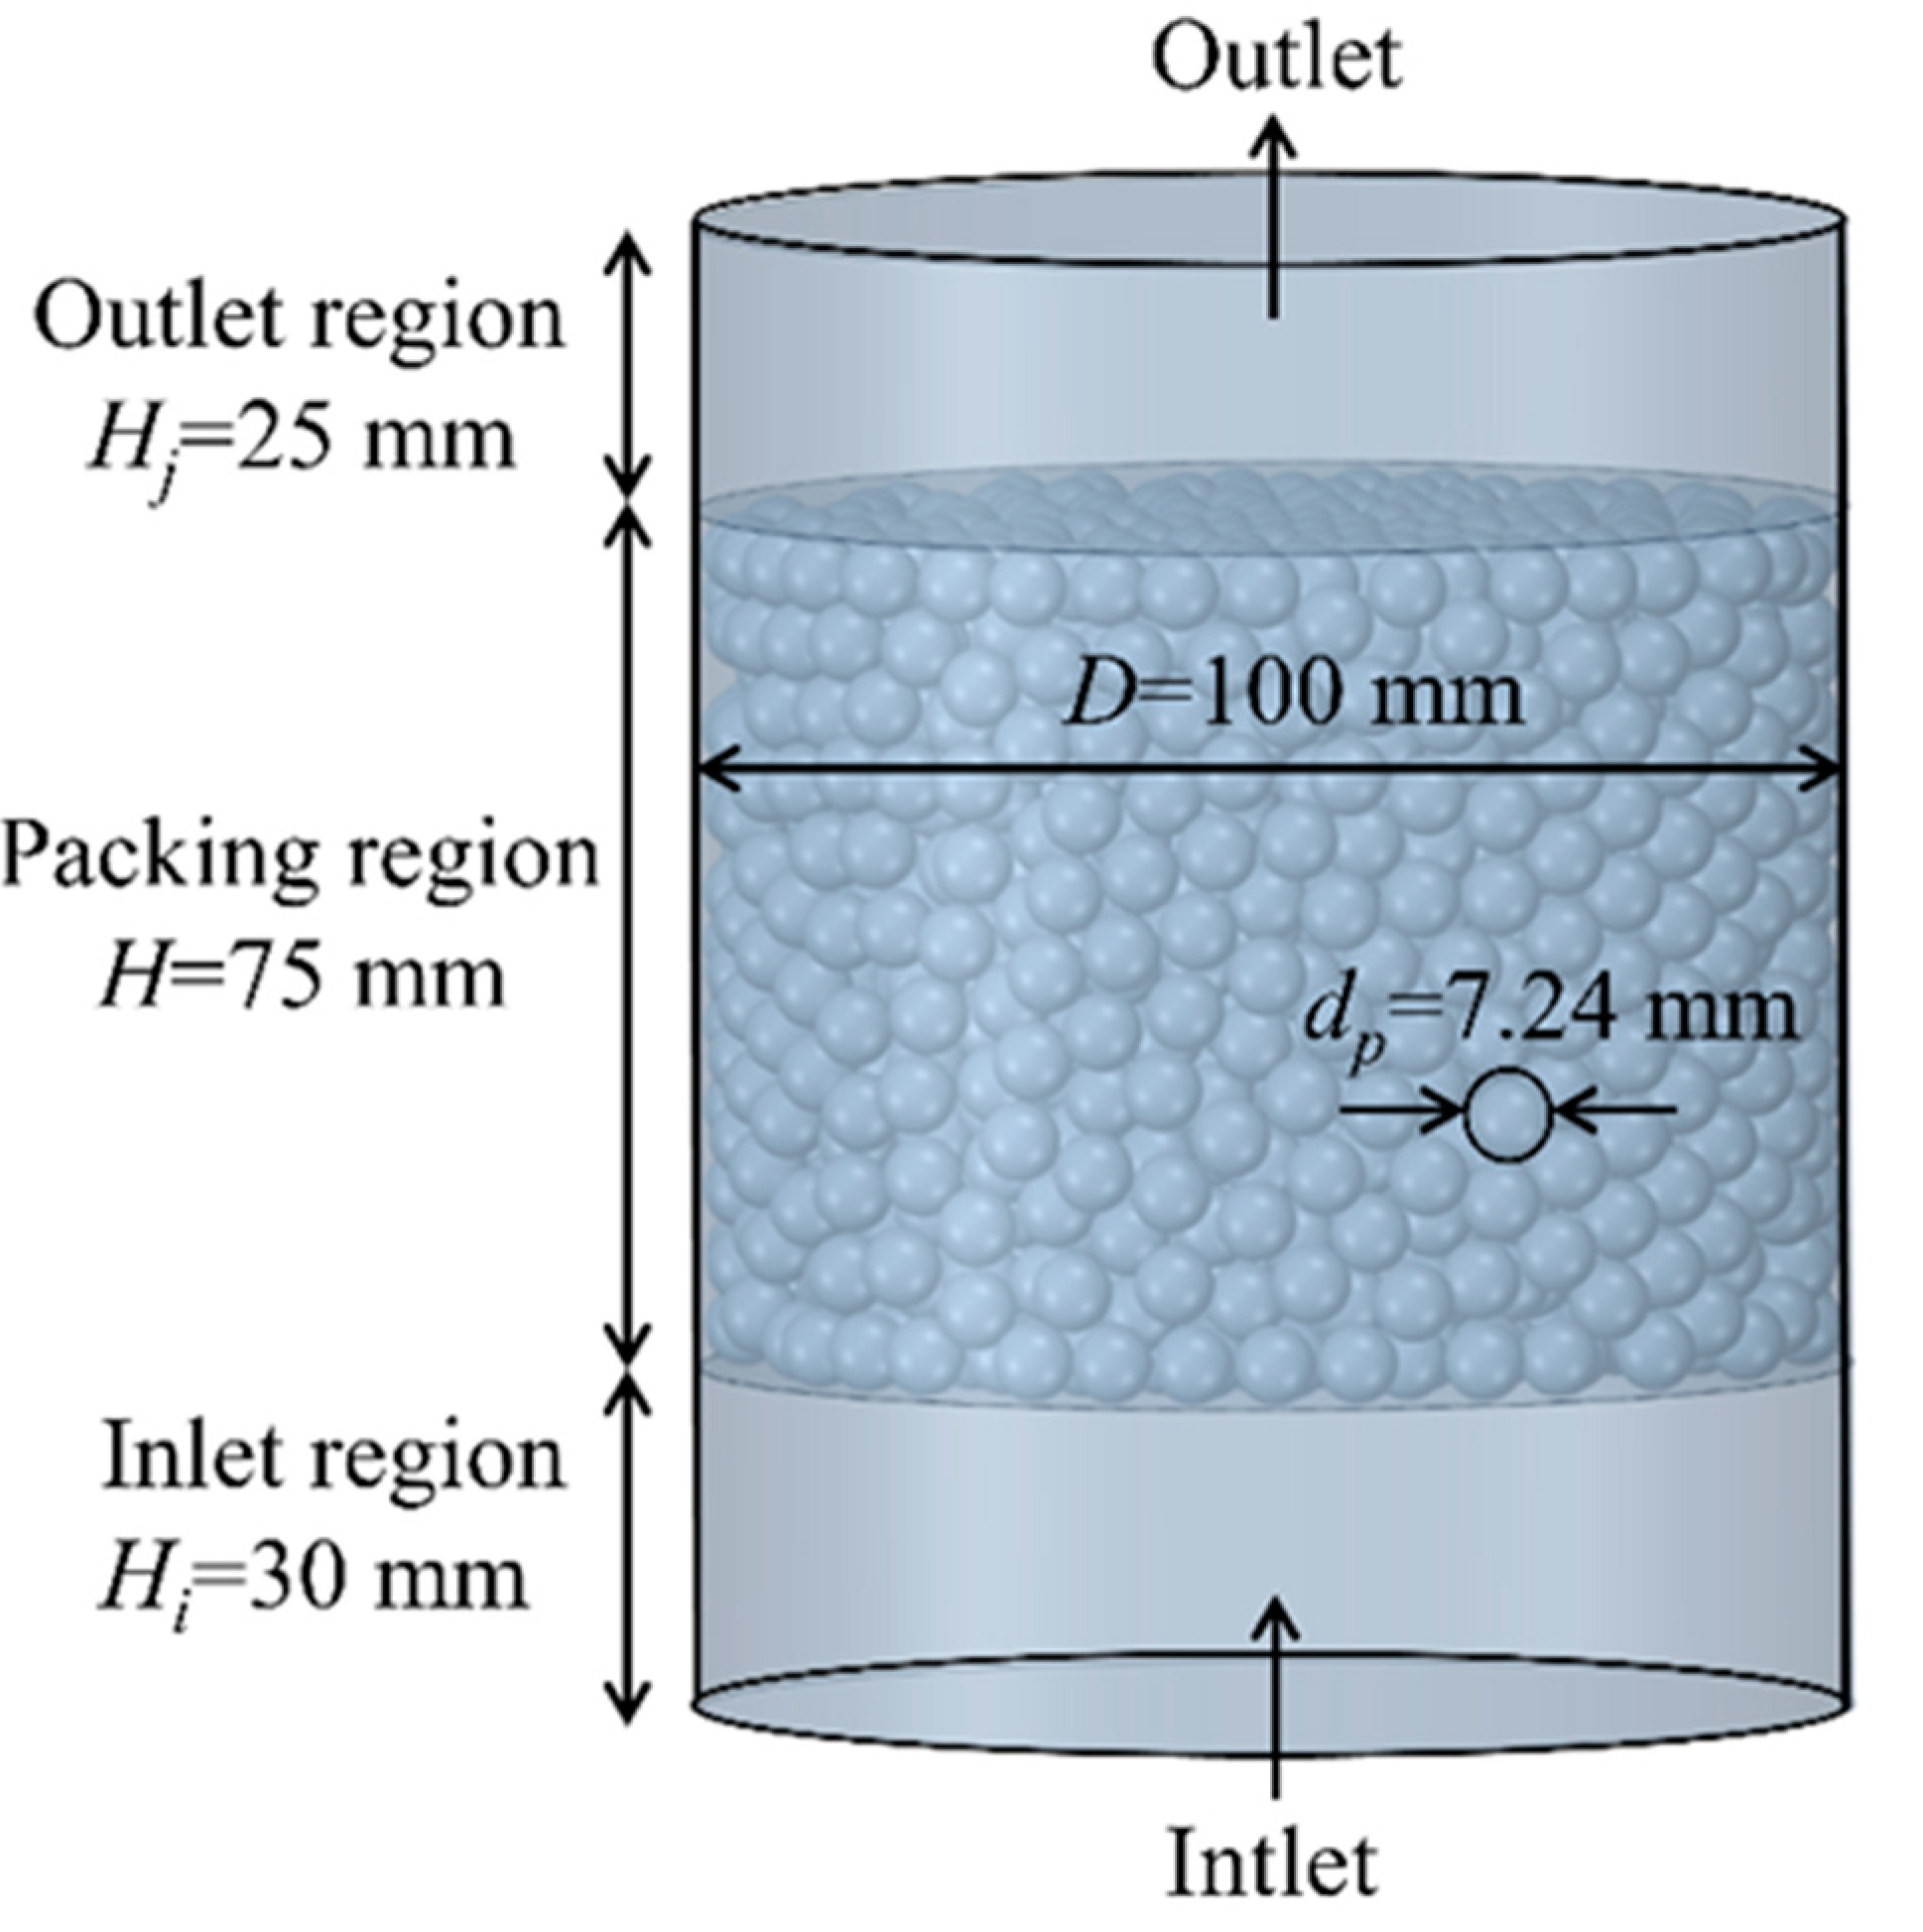
In this study, commercial software EDEM 2018 was used for particle stacking and vertical compression processes. During the DEM packing process, spherical particles with a diameter of 7.24 mm were generated at the top of the container and fell by gravity to form a cylindrical packed structure with a diameter of R = 100 mm and a height of H = 75 mm. The wall effect has less effect on the packing rate when the diameter ratio of packed bed to particle is more than 10 [35,36]. Based on the Hertz-Mindlin contact model, a total of 1815 particles were generated after considering the particle-particle and particle-wall interaction. The DEM packed structure modeling parameters are listed in Table 1 [37]. After the pack was constructed, a circular loading sheet was created on its upper surface and compressed downward at a constant speed, stopping when the downward movement of the loading sheet reaches the test displacement. The information of DEM gravity packing and compressed particles was exported, and then the Gambit software was used to reconstruct the geometric model of particles and the outer cylindrical wall of the packing section, setting the inlet region Hi = 30 mm and the outlet region Hj = 25 mm in the packing section to reduce the inlet and outlet effects. The geometric model of soybean particle packing is shown in Figure 2.

3.2. Mesh Generation

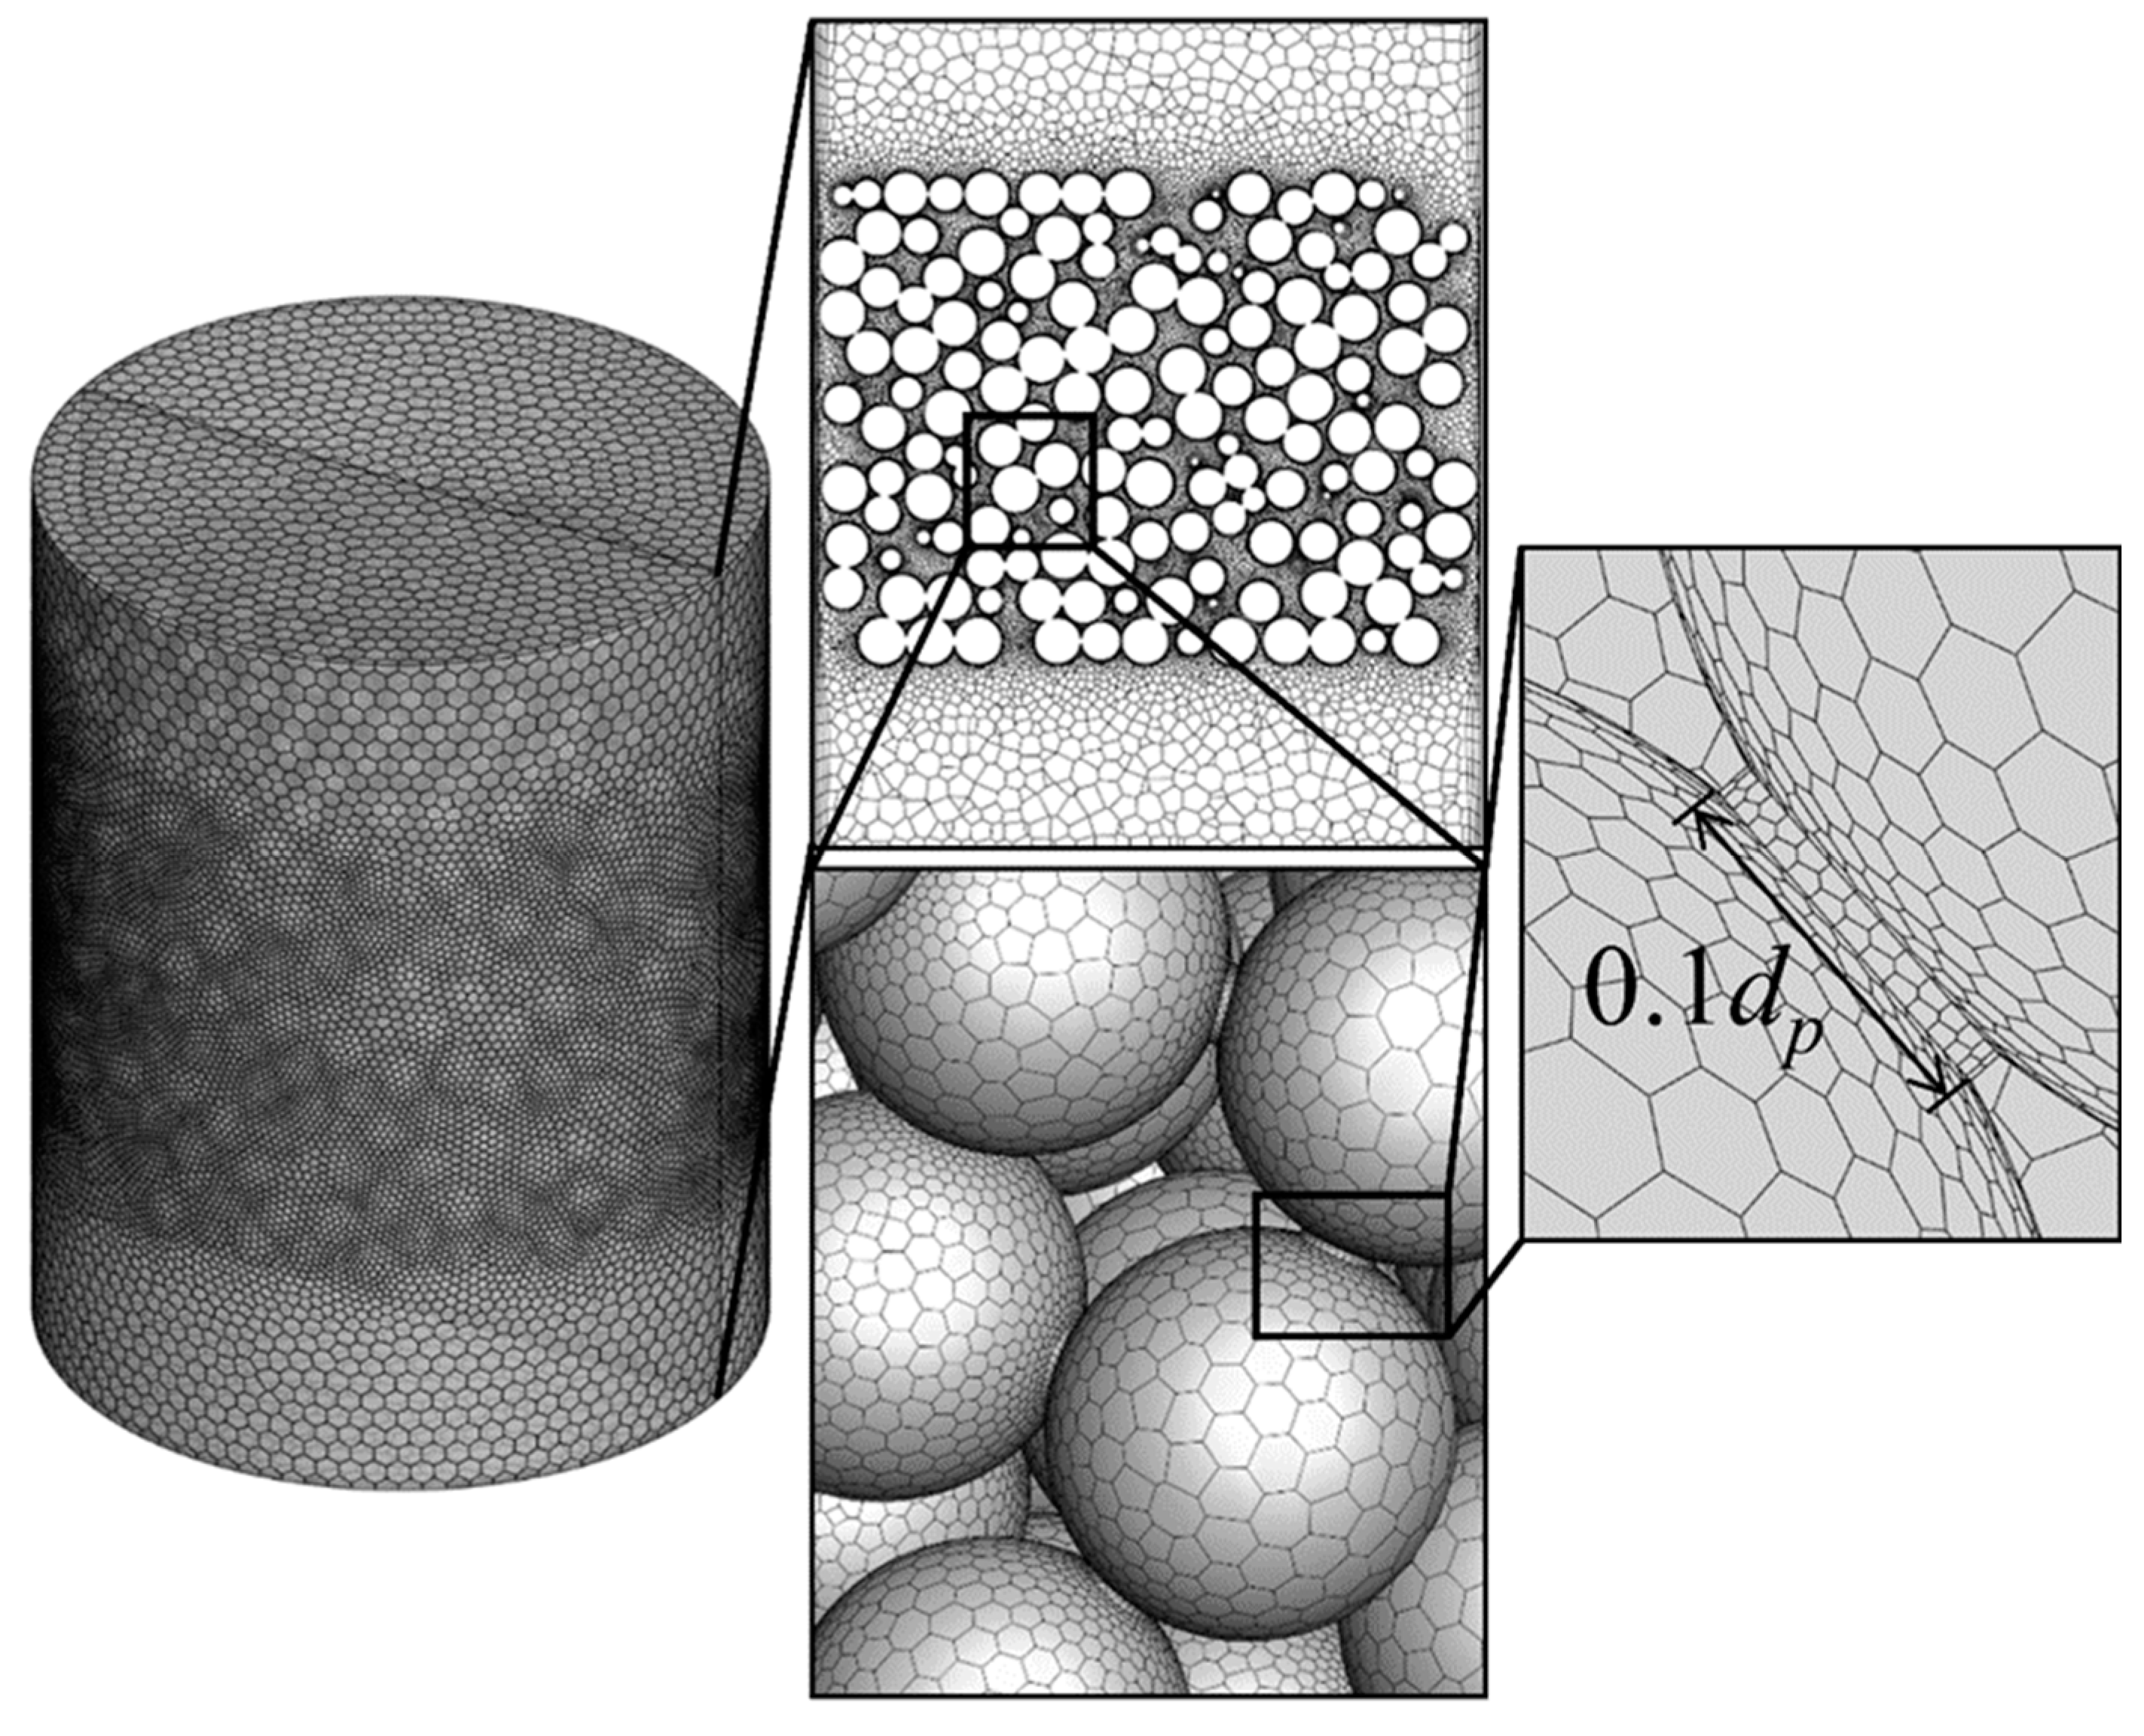
A self-developed scripting program was used to generate the constructed randomly packed particles and geometric models. The reconstructed spherical particles will have point contacts or narrow gaps between them, which is not suitable for mesh generation. When meshing directly, the grid cells near the contact points will have large skewness, making the simulation hard to converge and affecting the calculation accuracy, so the contact between the particles needs to be processed. The main existing treatment methods include decreased size, increased size, bridges, and caps [38]. The decreased size and increased size methods change the radius of the sphere, which changes the porosity of the packed bed. The bridges and caps methods only treat the contact points locally, ensuring the accuracy of the geometric model of the packed bed. In this study, we used the bridges method for contact treatments to simulate the airflow process more realistically, setting the diameter of the cylindrical bridge to 0.1 dp and increasing the diameter of the geometric by 1% [39]. Due to the complexity of the packed bed, the model was meshed using polyhedral in ANSYS Fluent Meshing and the maximum mesh size was set to 1/15 dp [40]. The particle surfaces and geometric cylindrical surfaces were set up with three boundary layers using the smooth transition method, and the boundary layer growth rate was 0.27. The mesh division and contact treatment are shown in Figure 3.

3.3. CFD Modeling

The commercial software ANSYS Fluent 18.2 was used to calculate and solve the pressure drop characteristics of the soybean packed bed. The inlet and outlet of the model were set as velocity inlet and pressure outlet boundaries, respectively, and the cylindrical wall surface and grain particle surface were set as nonslip velocity boundaries. Eisfeld et al. [41] provided an accurate definition of the flow in a fixed bed and showed that the flow in the bed is laminar when the particle Reynolds number Rep is less than 300. In this simulation, the inlet velocity was set to 0.02–0.6 m/s and the Rep was 10–297, so the laminar flow model was used for calculation. When solving the computational model, the energy equation is not considered, only the continuity equation (Equation (2)) and the momentum conservation equation (Equation (3)) of the fluid are solved.
ρ t + ( ρ v ) = 0
ρ ( v ) t + ρ v ( v ) = p + ( τ ¯ ) + ρ g
where ρ is the density of the fluid, kg/m3; v is the velocity vector, m/s; p is the static pressure, Pa; τ ¯ is the stress tensor; g is the gravitational acceleration, m/s2. τ ¯ is described as,
τ ¯ ¯ = μ [ ( v + v T ) ] 2 3 δ v
where μ is the dynamic viscosity of the air, kg/(m∙s); δ is the unit tensor.
The flow process was solved by the steady-state method. The coupled pressure-velocity solver used the SIMPLE algorithm, and the pressure terms were discretized using the PRESTO! format. The other equations were discretized in the second-order windward format, and the convergence residuals of all variables were set to 10−6 to obtain more accurate results.

4. Results and Discussion

4.1. Compression Characteristics

Due to the self-weight of the grain load, the vertical pressure distribution in the grain bin is uneven and the degree of compression of the grain is different [24]. According to the mass-volume relationship, the experimentally calculated average porosity was 0.43. Compaction changes the pore structure distribution of the grain pile, which affects the pressure drop characteristics through the soybean packed bed. Vertical pressure causes the soybean packed bed to compact, increasing the resistance to airflow through the grain bulk. The compression and compression change rate of soybean bulk at 50, 150, and 250 kPa vertical pressures are shown in Figure 4. The vertical pressure had a significant effect on the deformation of the soybean bulk. After the application of vertical pressure, the grain had a notable transient deformation, and the change rate of deformation decreased with increasing time. The amount of transient deformation increased with the vertical pressure. The compression was 97.6%, 98.2%, and 98.8% of the total compression after two hours of loading at 50, 150, and 250 kPa, respectively, which indicates that the total compression of the grains occurred mainly within two hours after loading. After 4 h, the compression change rate was reduced to less than 0.2%. The compressions under 50, 150, and 250 kPa pressures were 4.29 mm, 7.18 mm, and 8.98 mm, respectively.

4.2. Radial Voidage

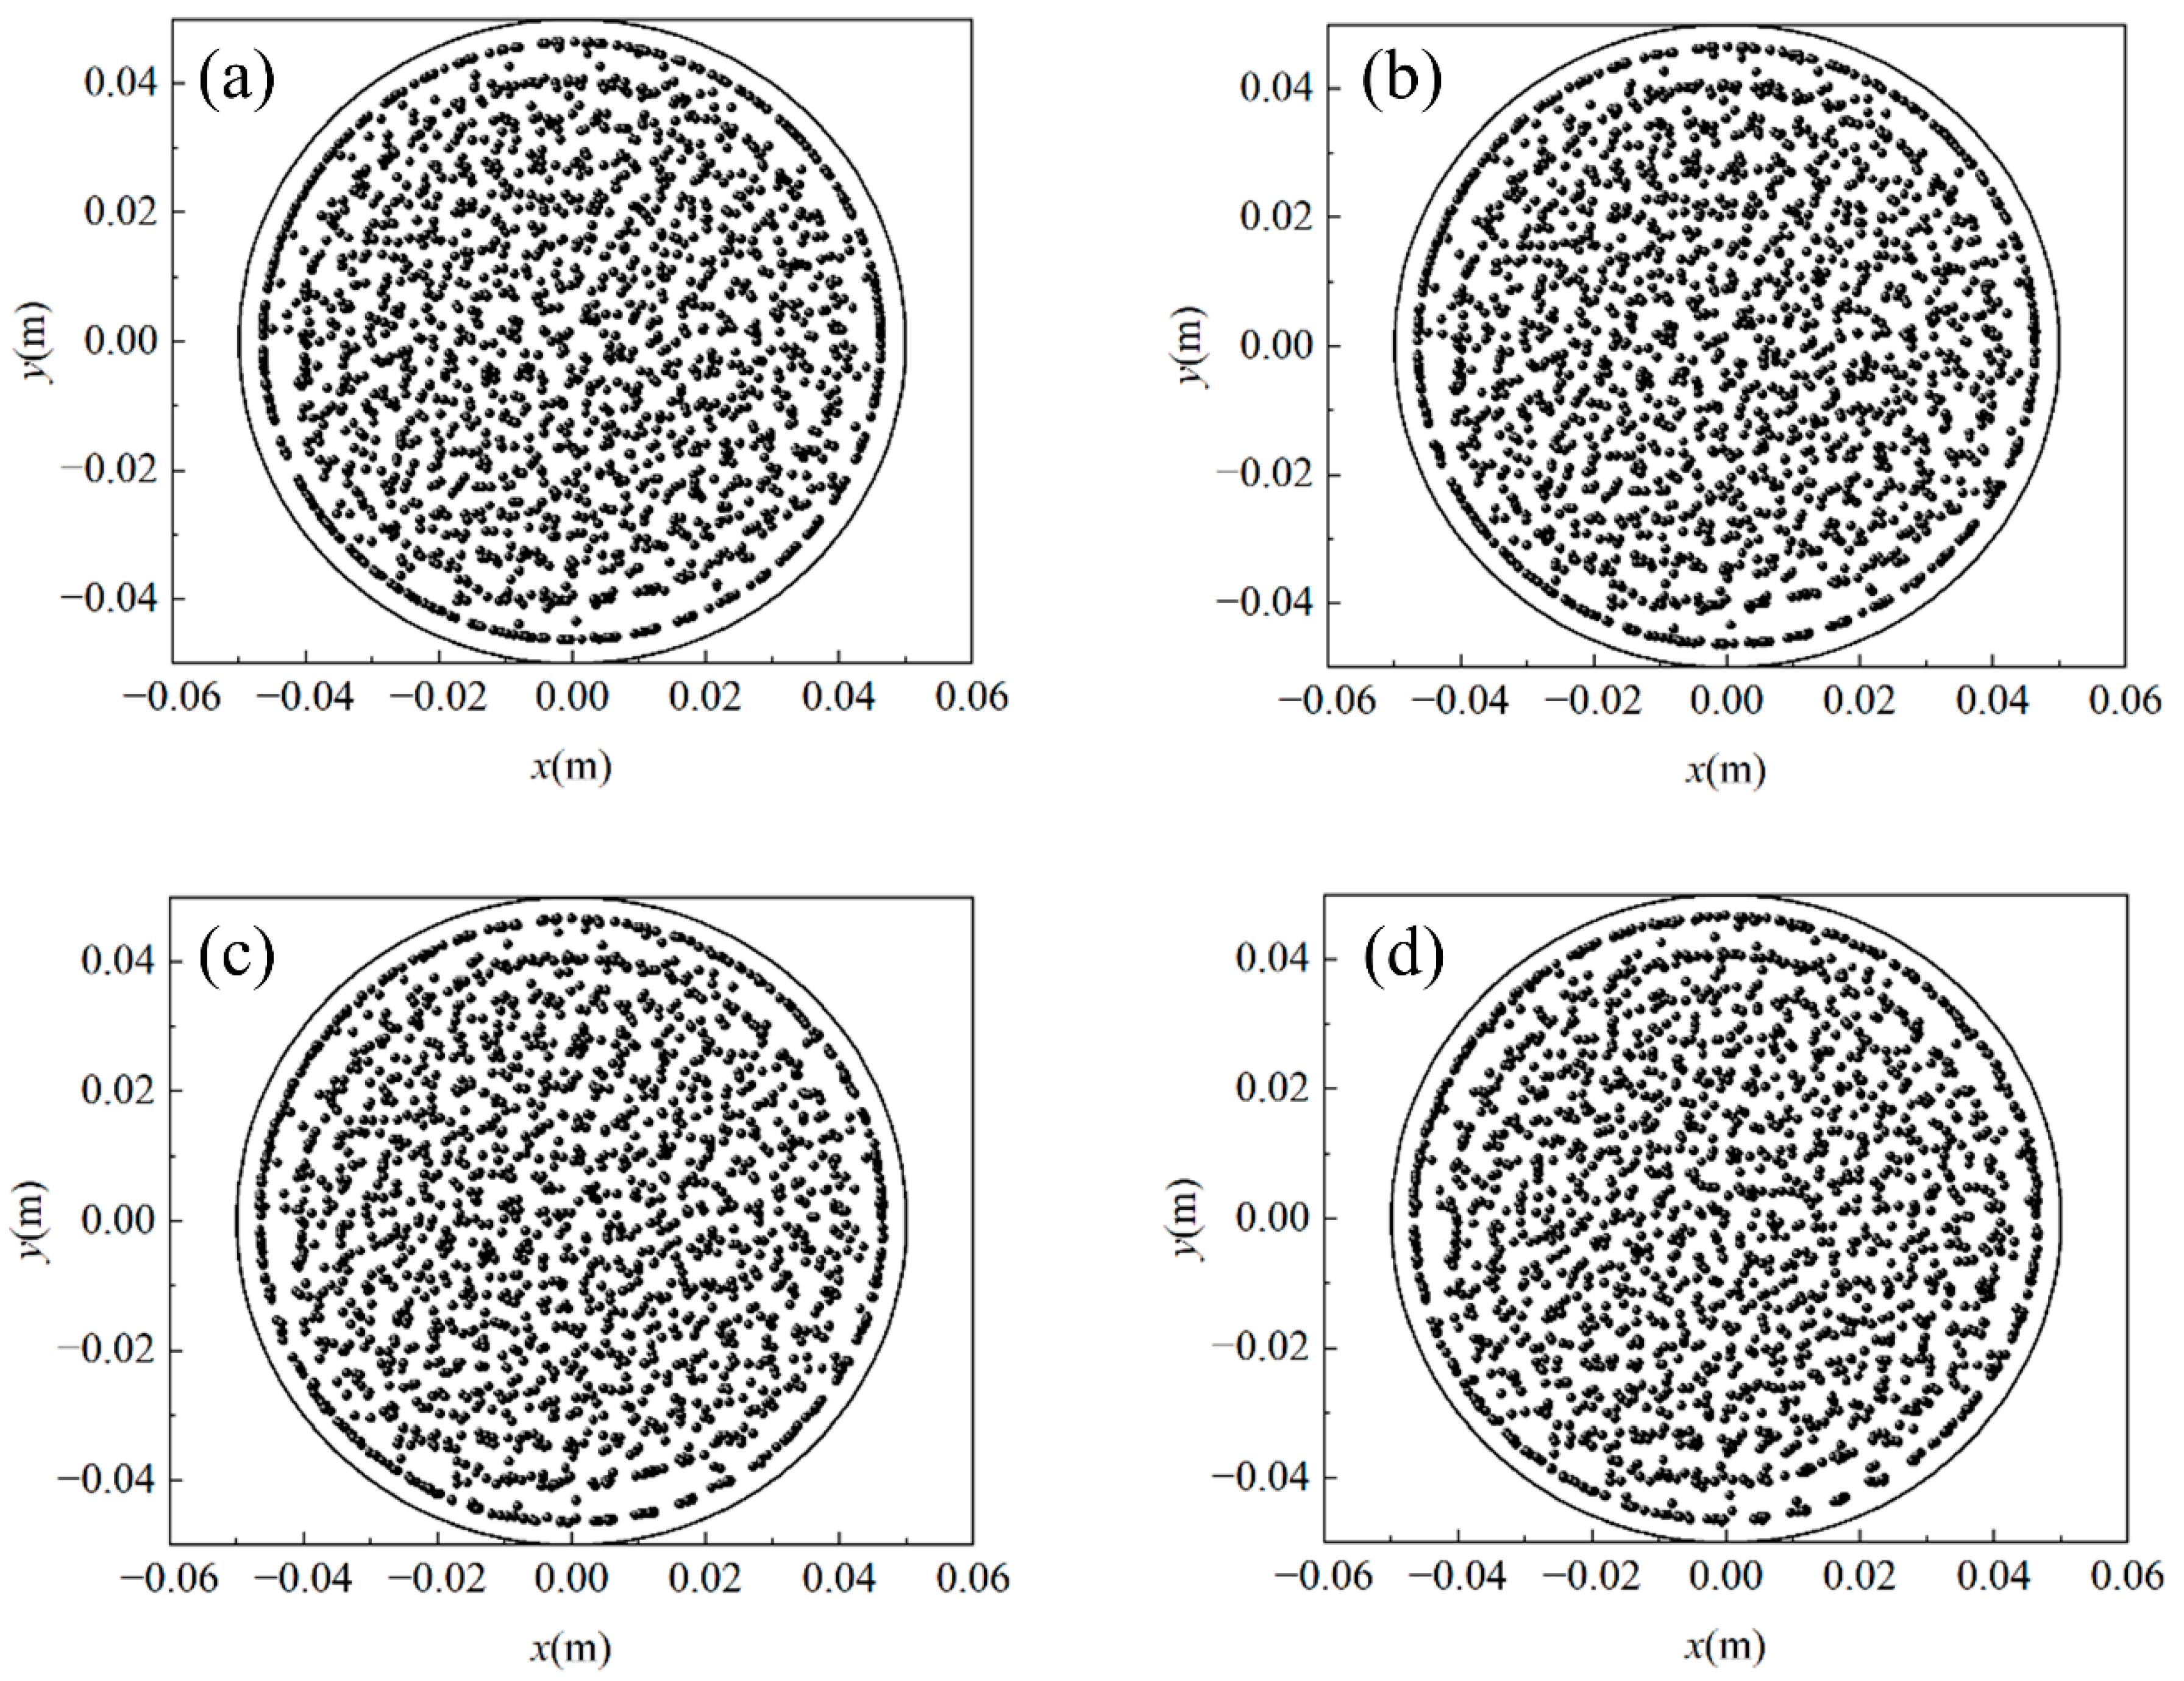
The distribution of the center coordinates of all particles in the X-Y plane is shown in Figure 5. It is found that the distribution of particle center coordinates is similar under different vertical pressures, and the center coordinates tend to be organized in circles in the vicinity of the cylindrical wall surface. The distance from the circle formed by the periphery particle coordinates to the cylindrical wall is approximately the same as the particle radius. The degree of random distribution of coordinates increased with distance from the cylindrical wall. The particle center coordinates are more dispersed in the X-Y plane as the vertical pressure increase.
The radial porosity distribution is an important indicator to verify the packing quality of the DEM. The pore distribution inside the packing structure links with the radial position under the constraint effect of the wall. The soybean packed bed is dense at the location of small radial porosity values. To verify the accuracy of the particle packing structure generated by DEM, the radial porosity distribution under different vertical pressures was compared with the results calculated by de Klerk. The empirical equation widely used to predict the radial porosity distribution in a cylindrical packed bed was derived by de Klery [42] experimentally, with the porosity being expressed as:
ε ( r ) = { 2.14 n 2 2.53 n + 1 , n 0.637 ε ¯ + 0.29 e 0.6 n × cos [ 2.3 π ( n 0.16 ) ] + 0.15 e 0.9 n , n > 0.637
where ε ( r ) is the radial porosity of the packed bed; n is the wall dimensionless distance; n = ( R r ) / d p ; r is the distance from the radial position of the packed bed to the central axis; dp is the particle radius; ε ¯ is the central porosity of the packed bed.
The particle-packed region is divided into multiple coaxial cylindrical surfaces along the radial direction. The porosity is the ratio of the fluid area intercepted by the cylindrical surface to the cylindrical area, and the calculation formula can be expressed as [43]:
ε ( r ) = A v o i d ( r ) 2 π r H
where Avoid(r) is the fluid area, m2; ε(r) is the radial porosity of the packed bed. Figure 6 shows that the radial porosity distribution of the packed bed calculated using DEM and de Klerk’s formula is in close agreement. The radial porosity distribution of the packed bed at different vertical pressures was similar, and the maximum radial porosity was about 1, near the cylindrical wall (n = 0), owning to the point contact between the cylindrical wall and the particle. The fluid area intercepted by the coaxial cylindrical surface was approximately the entire cylindrical area. With increasing dimensionless distance, the minimum radial porosity was 0.25 at about the distance of the particle radius from the cylindrical wall, which is the same location as the center coordinate distribution near the cylindrical wall. The radial porosity oscillates and decreases toward the center of the packed bed, with a smaller amplitude toward the center, eventually approaching the average porosity of the packed bed. From Figure 6, the porosity of the center of the packed bed in the uncompressed state (0 kPa) was ε ¯ 0.43 . The central porosity of the packed bed was 0.39, 0.36, and 0.35, respectively, in 50, 150, and 250 kPa compression states. The amplitude of radial porosity oscillation decreases with the increase in vertical pressure. The compression process increased the density of the packed bed and made the particle distribution continuous, which corresponds with the central coordinate distribution shown in Figure 5.

4.3. Velocity Distribution

The contours of velocity under different vertical pressures are shown in Figure 7. The airflow characteristics of packed beds are more noticeable at higher inlet velocities. The inlet velocity V0 = 0.6 m/s was chosen for the study. The velocity field distribution was similar under different vertical pressures. In the axial direction of the packed bed, the inlet airflow is in contact with the particles in the front part of the packed region. The particles form a barrier to the airflow, and a zero-velocity region exists at the back of the particles. In the packed region, the local velocity distribution shows a clear difference. In the outlet region, the airflow stagnates and backflows. The velocity near the cylindrical wall is higher than in other regions, with the local maximum velocity near the wall about 9 times the inlet velocity under 250 kPa vertical pressure. The velocity in the packed bed is not just dependent on the porosity size but also on the connectivity of the pore paths [26]. The particle distribution is more dispersed with the increase in vertical pressure, which improves the internal pore connectivity and causes the velocity to increase.
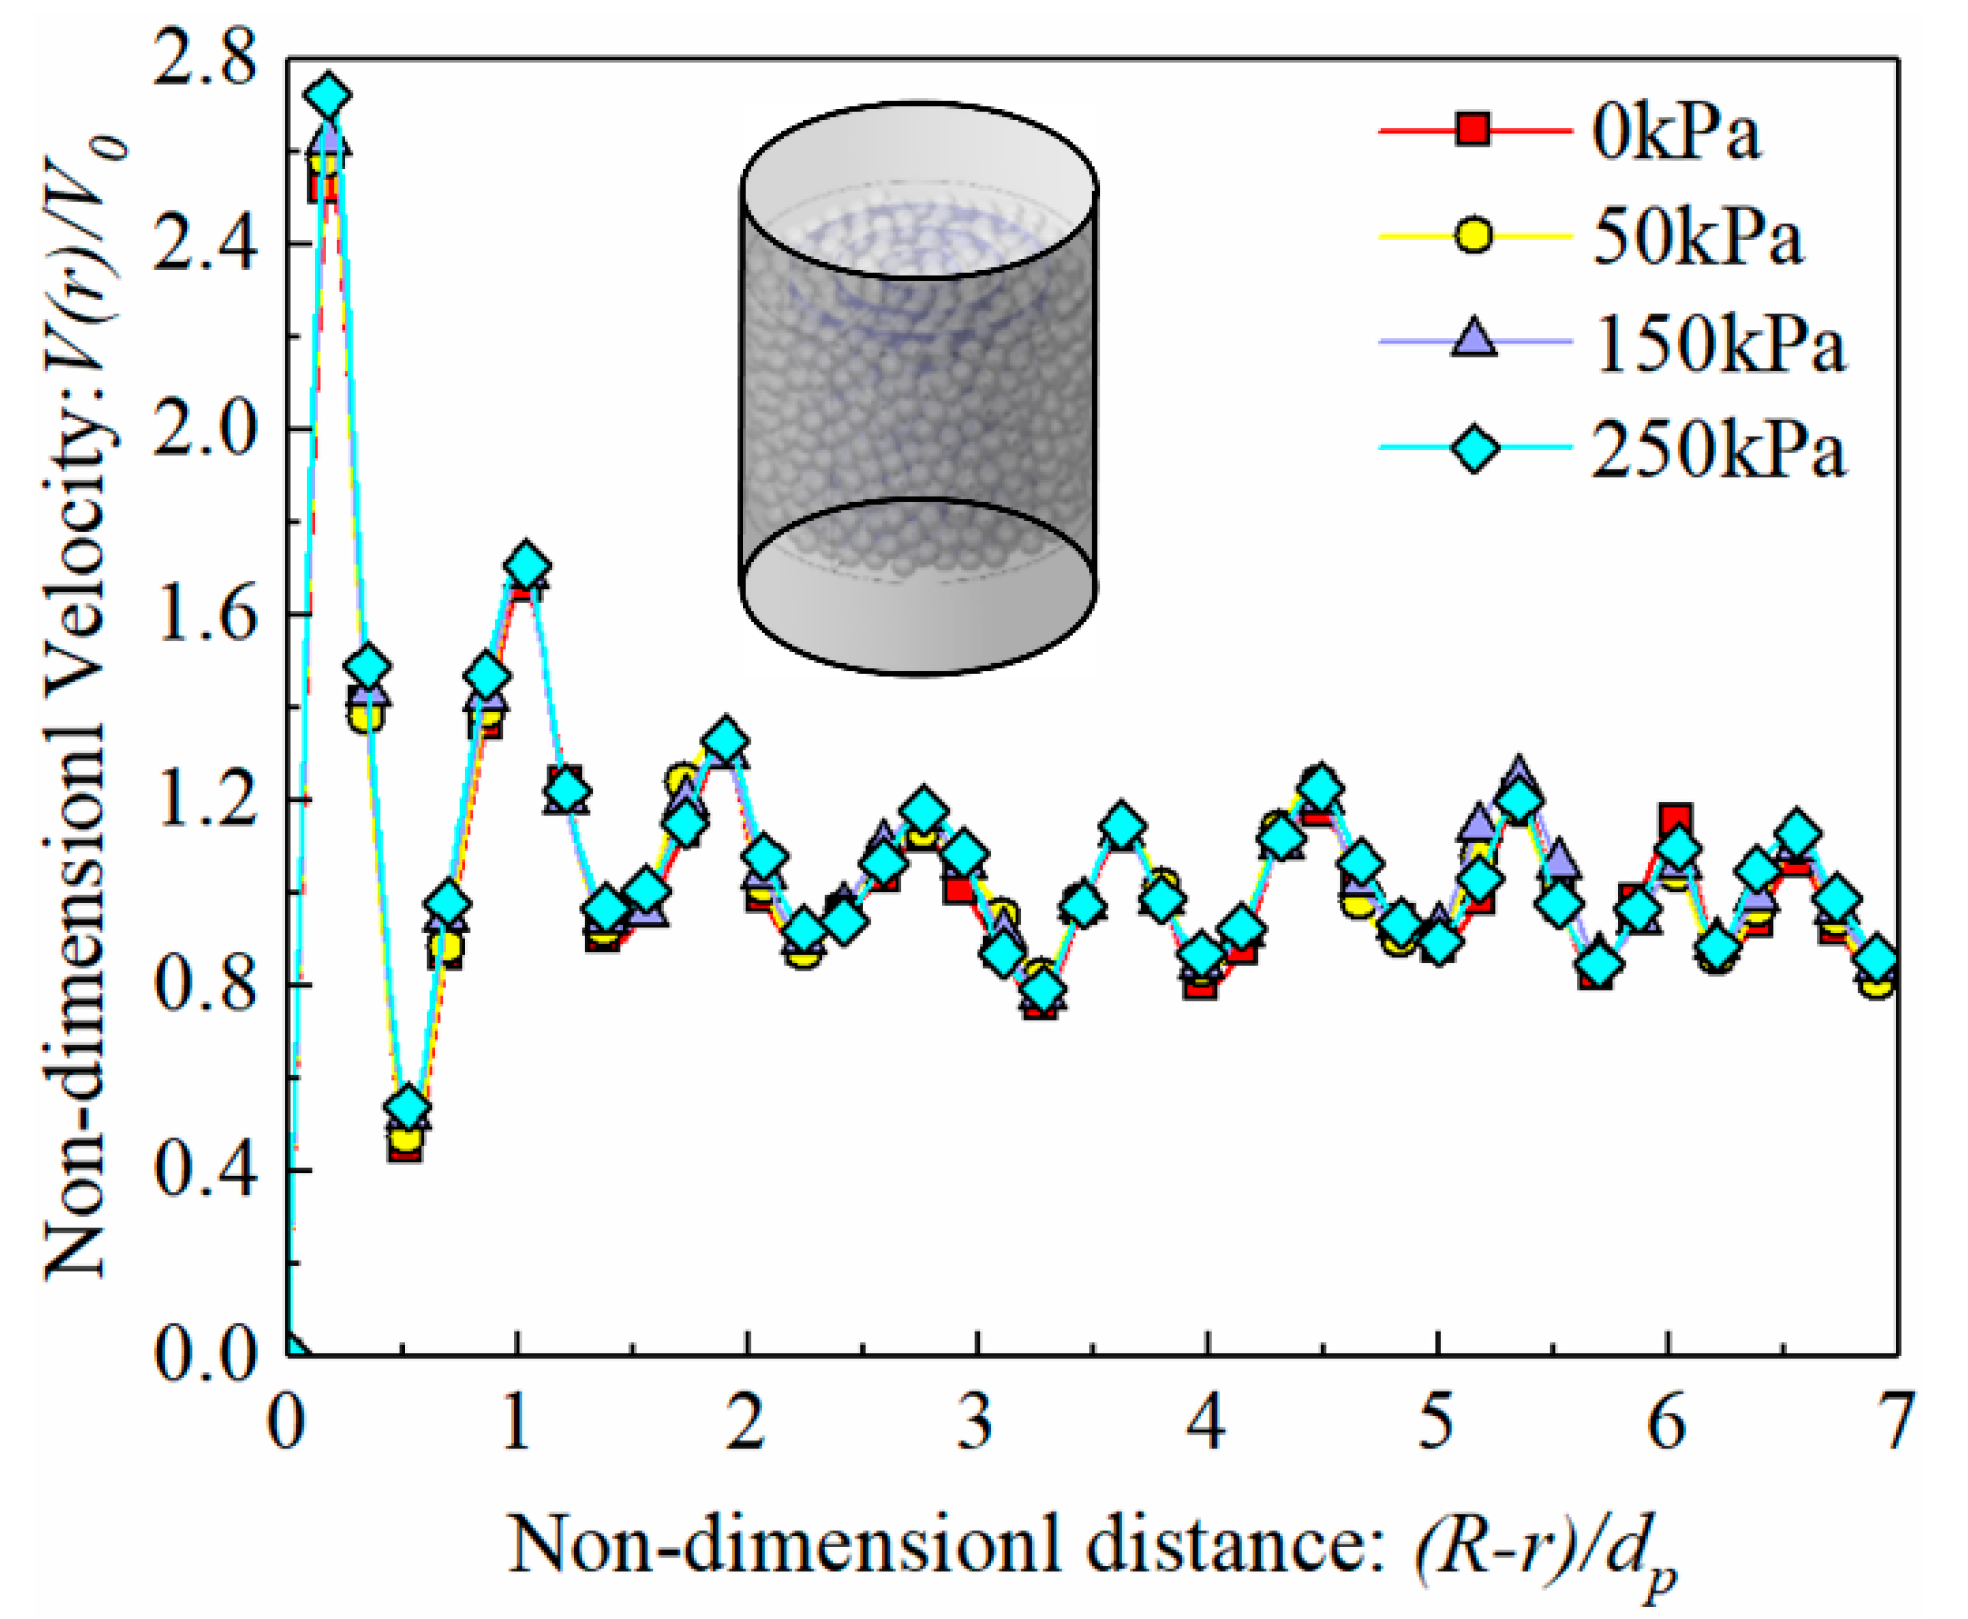
Consistent with the radial porosity distribution measurement method, the same coaxial cylindrical surface measurement was used to obtain the radial mean dimensionless velocity (Vr/V0) distribution of the packed bed as shown in Figure 8. The distribution of the radial mean dimensionless velocity at different vertical pressures was similar and consistent with the trend of the oscillatory distribution of porosity. The velocity was at maximum at about one-half particle radius from the cylindrical wall, with the local maximum velocity being 2.51, 2.58, 2.63, and 2.74 times the inlet velocity with increasing vertical pressure, respectively. The mean velocity inside the packed bed increases with the vertical pressure, with the mean velocities 0.75 m/s, 0.78 m/s, 0.81 m/s, and 0.86 m/s at vertical pressures of 0, 50, 150, and 250 kPa, respectively.

4.4. Pressure Drop

4.4.1. Experimental Pressure Drop

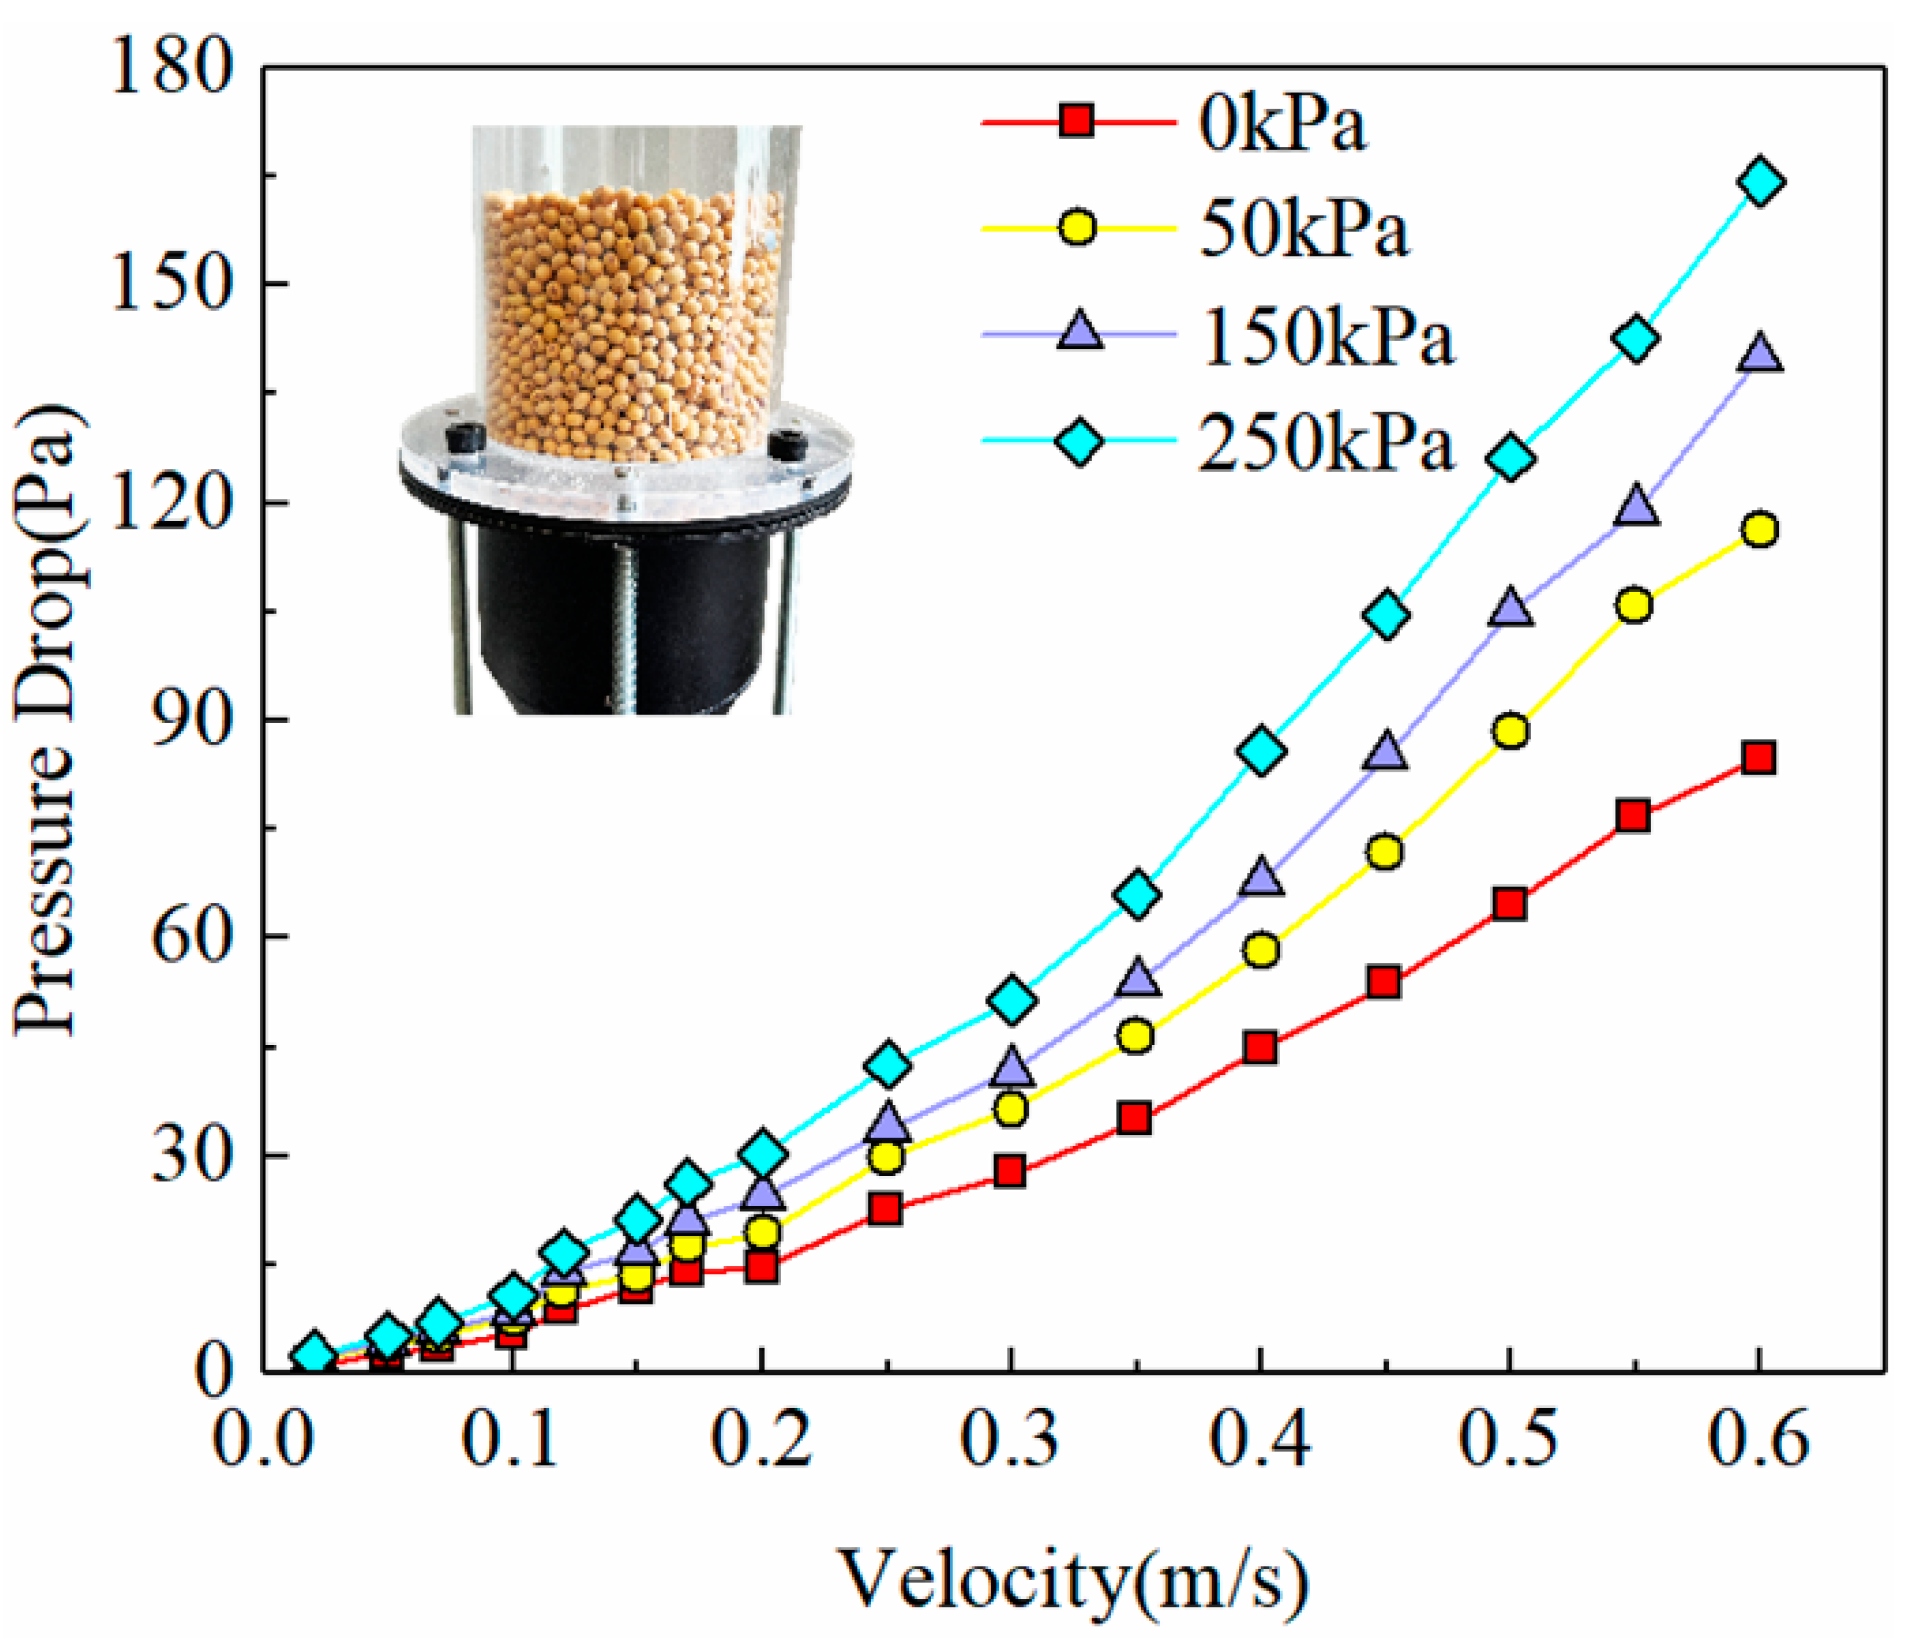
The test values of the pressure drop of soybeans at different vertical pressures are shown in Figure 9. The pressure drop increases with the increase in inlet velocity and vertical pressure. Pressure drop through soybean in the uncompressed state (0 kPa) was in the range of 1.24 to 84.68 Pa at inlet velocities ranging from 0.02 to 0.6 m/s. The pressure drop increases with vertical compression. Soybean pressure drop increases to a range of 2.05 to 116.35 Pa at a vertical pressure of 50 kPa. The pressure drop was in the range of 2.18 to 139.89 Pa at a vertical pressure of 150 kPa. The pressure drop ranges from 2.46 to 164.27 Pa at a vertical pressure of 250 kPa. When the vertical pressure increases, the pressure drop increases by 36%, 57%, and 92% on average, as the inlet velocity increases from 0.02 to 0.6 m/s.

4.4.2. Numerical Simulation of Pressure Drop

The Ergun [44] equations and Forchheimer [45] equations (as Equations (7) and (8), respectively), are the most widely used methods for calculating the flow resistance coefficient and pressure drop in porous media. A PathFinder code was developed by Sobieski [46] to calculate pore-scale features based on DEM simulations of particle-packed structures. The center coordinates of each particle were calculated by a C program with an accuracy of 10−7 and converted to a format readable by PathFinder code. In this study, the changes in airflow paths during soybean packing and compression were recreated using the PathFinder code. The flow resistance coefficient term in the Forchheimer equation was determined based on the DEM particle information at different vertical pressures. The pressure drop results from numerical simulations and equations were compared with the experimental results for verification to verify model accuracy. The results of the PathFinder code calculation are shown in Table 2.
Ergun Equation:
Δ P L = 150 μ ( 1 ε ) 2 ε 3 u d p 2 + 1.75 ρ ( 1 ε ) ε 3 u 2 d p
Forchheimer Equation:
Δ P L = A μ u + B ρ u 2
where μ is the dynamic viscosity of the air, μ = 1.79 × 10⁻⁵ kg/(m∙s); ρ is the density of the air, ρ = 1.025 kg/m3; u is the inlet velocity; A is the expression for the permeability coefficient in the Kozeny-Carman equation, A = 1 k = C k z τ S 0 2 ( 1 ε ) 2 ε 3 , Ckz is the Kozeny-Carman pore shape factor, Ckz = 5.0; τ is the tortuosity; S0 is the the specific surface of the packed bed.
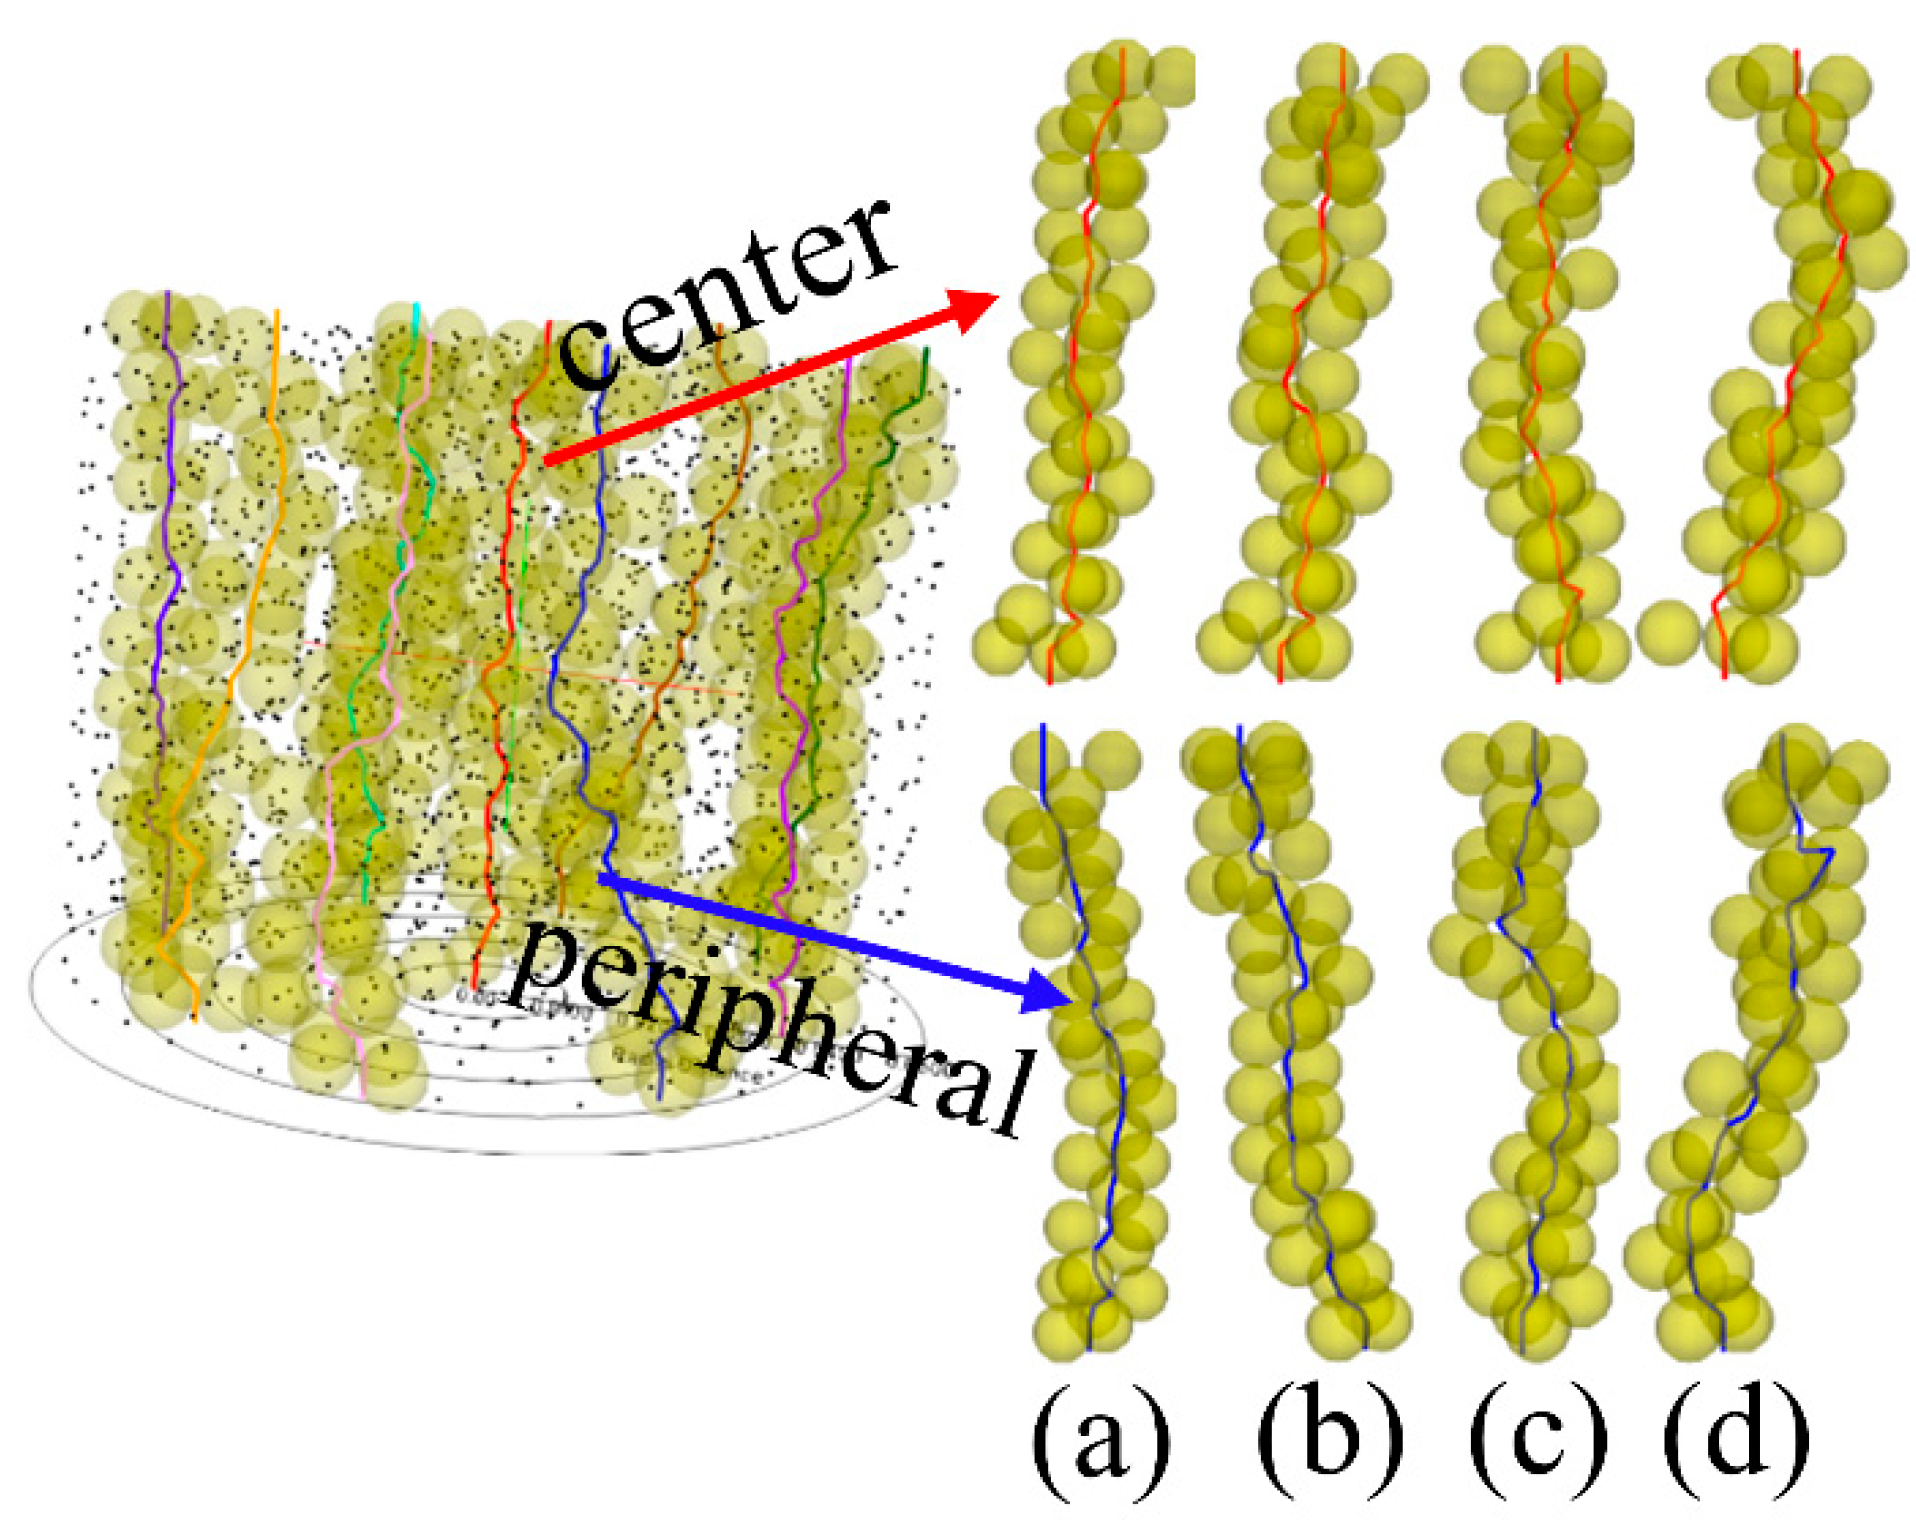
A total of nine inlet points in the center and periphery of the packed bed were selected for airflow path calculation. The airflow path distribution calculated by PathFinder software is shown in Figure 10. The shape and length of the airflow path change with the vertical pressure. The deviation from the bottom inlet point to the top outlet increases with the vertical pressure, and the airflow path becomes more tortuous, with continuous bends in the airflow path at 250 kPa. As the vertical pressure increases, the particles move toward the pore area, making the packed bed more compact and the pore connection path curved and narrow. Compared to the central and peripheral airflow paths, the curvature of the path near the peripheral region was more intense as the vertical pressure increased. The path curvature due to vertical compression can visually reflect the phenomenon of increased pressure drop in the packed bed.
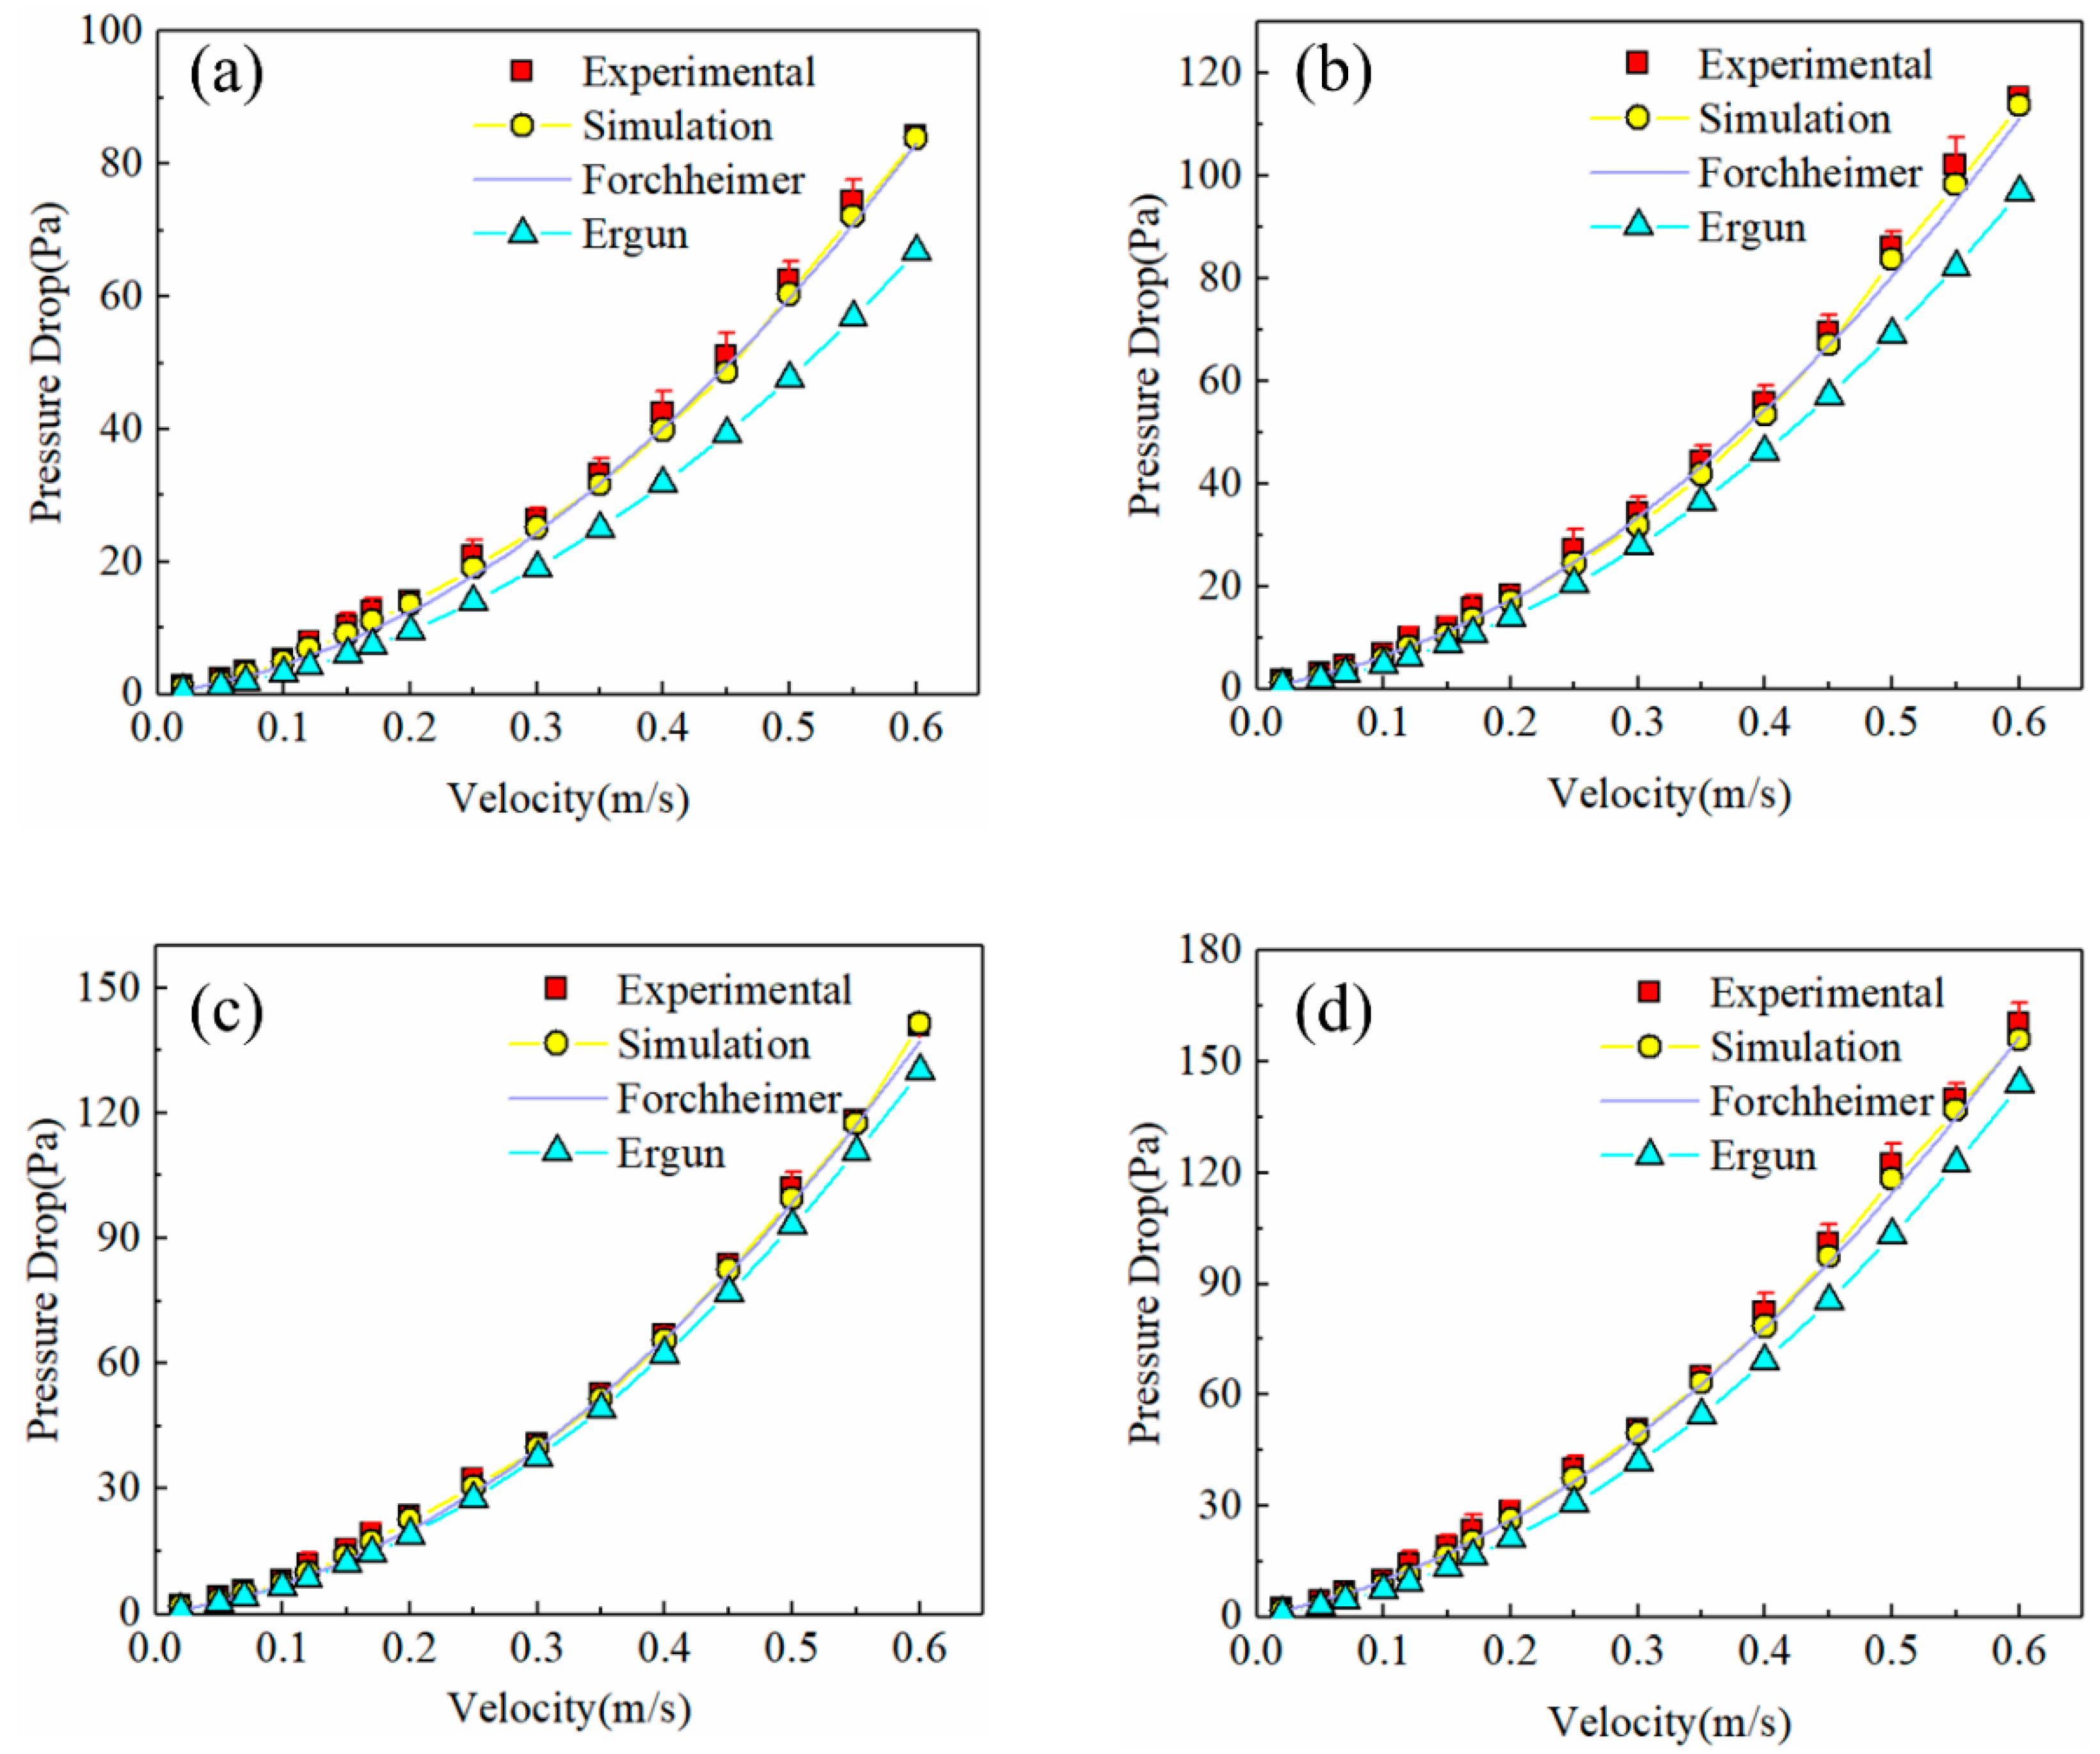
The pressure drop results simulated by the DEM-CFD method for different inlet velocities and vertical pressure conditions are shown in Figure 11, and are being compared with the empirical equations and experimental results. The calculated results of the DEM-CFD simulation and the Forchheimer equation under different vertical pressures were in close agreement with the experimental results, and the average difference was less than 10%. The Ergun equation underestimates the pressure drop values clearly, with an average difference of more than 24% in the uncompressed state (0 kPa) and a reduced average difference of 15% at 150 kPa. The DEM-CFD method and Forchheimer equation coefficients calculated by the PathFinder code take into account not only the decrease in porosity of the packed bed under the difference in vertical pressure but also the increase in the tortuosity of the pore path, which means the calculations were more accurate. The Ergun equation can only consider the effect of porosity variation on pressure drop, and the results have a greater difference.
The contours of pressure drop under different vertical pressures are shown in Figure 12. The inlet velocity V0 = 0.6 m/s was chosen for the study. The distribution of static pressure values at different vertical pressures was similar, and the static pressure decreases gradually. The static pressure decreased gradually and showed a clear layered phenomenon along the outlet direction, and the static pressure distribution was constant at the inlet and outlet regions. The static pressure at the inlet and the pressure drop through the soybean packed bed increase with the vertical pressure, which was consistent with the pressure drop test and empirical equation calculation.
The test and simulation results can be extrapolated at a larger scale. However, it is worth mentioning that the DEM-CFD method requires high computer computing power and requires reasonable simplification of operations. The pressure drop is relevant for the bed characteristics, which increase with the compression of the bed. As to an actual on-farm silo, the static pressure distribution is uneven under compaction by the self-weight of grain [47,48]. The temperature and moisture distributions will be quite different in a larger packed bed.
Summarizing the velocity distribution and pressure drop under vertical pressure, the DEM-CFD method is suitable to describe the airflow characteristics precisely. The vertical pressure reduces the porosity of the packed bed, reducing the voids occupied by air, resulting in a larger particle contact area and increased thermal conductivity. The temperature and moisture change in the soybean packed bed accelerated under vertical pressure. The temperature and moisture distributions should be considered in further investigations using the DEM-CFD method.

5. Conclusions

To clarify the effect of different vertical pressures on the pressure drop of soybean bulk, the DEM-CFD method was used to simulate the pressure drop characteristics of soybean packed beds under different compression states. The following conclusions were obtained by comparing the experimental and empirical equation results.
(1)
The deformation of the soybean bulk increases with vertical pressure. After applying vertical pressure, a large transient deformation of the grain bulk occurs, and then the deformation change rate decreases. The total compression of soybean bulk occurred mainly within two hours after loading and stabilized after about four hours. The compressions under 50, 150, and 250 kPa pressures were 4.29 mm, 7.18 mm, and 8.98 mm, respectively.
(2)
The distribution of particle center coordinates close to the cylindrical wall generated by DEM is approximately circular. With the increase in vertical pressure, the internal particles move towards the pore area and the central coordinates become more scattered. The amplitude of radial porosity oscillation decreases with increasing vertical pressure. The compression process leads to an increase in the compactness of the packed bed and a more continuous particle distribution. The central porosity of the packed bed was 0.39, 0.36, and 0.35, respectively, in 50, 150, and 250 kPa compression states. The porosity distribution simulated by DEM is consistent with the experimental results in the literature.
(3)
The radially mean dimensionless velocity is consistent with the trend of porosity oscillation distribution. The local maximum velocity increases with the vertical pressure. The mean velocities in the particle packed region were 0.75 m/s, 0.78 m/s, 0.81 m/s, and 0.86 m/s at vertical pressures of 0, 50, 150, and 250 kPa, respectively. The radially averaged dimensionless velocity distribution is not only determined by the porosity but also related to the pore channel connectivity.
(4)
The packed bed airflow path is more tortuous with the increase in vertical pressure, and the pressure drop of the soybean packed bed increases with the increase in inlet velocity and vertical pressure. Considering the variation in porosity and pore connectivity, the pressure drop results calculated by the DEM-CFD method and the Forchheimer equation were in close agreement with the experimental results.

Author Contributions

Conceptualization, W.L., G.C. and M.G.; methodology, W.L. and D.Z.; software, W.L.; validation, W.L. and C.L.; formal analysis, W.L. and M.G.; investigation, W.L. and C.L.; resources, G.C. and D.Z.; data curation, W.L. and M.G.; writing—original draft preparation, W.L.; writing review and editing, G.C. and D.Z.; supervision, G.C. and D.Z.; project administration, D.Z.; funding acquisition, G.C. All authors have read and agreed to the published version of the manuscript.

Funding

This research was funded by the National Grain Public Welfare Research Project of China, grant number 201513001-01; the Innovative Funds Plan of the Henan University of Technology, grant number 2020ZKCJ05; and the Open Project of Henan Key Laboratory of Grain and oil storage facility & safety, grant number 2020KF-A02.

Institutional Review Board Statement

Not applicable.

Informed Consent Statement

Not applicable.

Data Availability Statement

The data presented in this study are available in the article.

Conflicts of Interest

The authors declare no conflict of interest.

References

  1. Nalladurai, K.; Alagusundaram, K.; Gayathri, P. PH-postharvest technology: Airflow resistance of paddy and its byproducts. Biosyst. Eng. 2002, 83, 67–75. [Google Scholar] [CrossRef]
  2. Altuntas, E.; Demirtola, H. Effect of moisture content on physical properties of some grain legume seeds. N. Z. J. Crop Hortic. Sci. 2007, 35, 423–433. [Google Scholar] [CrossRef]
  3. Jian, F.; Jayas, D.S.; White, N.D.G.; Alagusundaram, K. A three-dimensional, asymmetric, and transient model to predict grain temperatures in grain storage bins. Trans. ASAE 2005, 48, 263–271. [Google Scholar] [CrossRef]
  4. Lawrence, J.; Maier, D.E.; Stroshine, R.L. Three-dimensional transient heat, mass, momentum, and species transfer in the stored grain ecosystem: Part I. Model development and evaluation. Trans. ASAE 2013, 56, 179–188. [Google Scholar] [CrossRef]
  5. Thompson, S.A.; McNeill, S.G.; Ross, I.J.; Bridges, T.C. Packing factors of whole grains in storage structures. Appl. Eng. Agric. 1987, 3, 215–221. [Google Scholar] [CrossRef]
  6. Haque, E. Estimating bulk density of compacted grains in storage bins and modifications of Janssen’s load equations as affected by bulk density. Food Sci. Nutr. 2013, 1, 150–156. [Google Scholar] [CrossRef]
  7. Cheng, X.D.; Zhang, Q.; Shi, C.X.; Yan, X.J. Model for the prediction of grain density and pressure distribution in hopper-bottom silos. Biosyst. Eng. 2017, 163, 159–166. [Google Scholar] [CrossRef]
  8. Mujumdar, A.S. Handbook of Industrial Drying, 3rd ed.; Taylor & Francis Group: Abingdon, UK; CRC Press: Boca Raton, FL, USA, 2006. [Google Scholar] [CrossRef]
  9. Yue, R.; Zhang, Q. A pore-scale model for predicting resistance to airflow in bulk grain. Biosyst. Eng. 2017, 155, 142–151. [Google Scholar] [CrossRef]
  10. Neethirajan, S.; Karunakaran, C.; Jayas, D.S.; White, N.D.G. X-ray computed tomography image analysis to explain the airflow resistance differences in grain bulks. Biosyst. Eng. 2006, 94, 545–555. [Google Scholar] [CrossRef] [Green Version]
  11. Haque, E. Void fraction as a function of depth and pressure drops of packed beds of porous media formed by granular materials. Trans. ASAE 2011, 54, 2239–2243. [Google Scholar] [CrossRef]
  12. Rocha, J.C.D.; Pohndorf, R.S.; Meneghetti, V.L.; de Oliveira, M.; Elias, M.C. Effects of mass compaction on airflow resistance through paddy rice grains. Biosyst. Eng. 2020, 194, 28–39. [Google Scholar] [CrossRef]
  13. Olatunde, G.; Atungulu, G.G.; Sadaka, S. CFD modeling of air flow distribution in rice bin storage system with different grain mass configurations. Biosyst. Eng. 2016, 151, 286–297. [Google Scholar] [CrossRef]
  14. Li, T.; Li, C.; Li, C.; Xu, F.; Fang, Z. Porosity of flowing rice layer: Experiments and numerical simulation. Biosyst. Eng. 2019, 179, 1–12. [Google Scholar] [CrossRef]
  15. Montross, M.D.; McNeill, S.G. Permeability of corn, soybeans, and soft red and white winter wheat as affected by bulk density. Appl. Eng. Agric. 2005, 21, 479–484. [Google Scholar] [CrossRef]
  16. Łukaszuk, J.; Molenda, M.; Horabik, J.; Szot, B.; Montross, M.D. Airflow resistance of wheat bedding as influenced by the filling method. Res. Agric. Eng. 2008, 54, 50–57. [Google Scholar] [CrossRef] [Green Version]
  17. Kenghe, R.N.; Nimkar, P.M.; Shirkole, S.S.; Shinde, K.J. Airflow resistance in soybean. Int. Agrophys. 2012, 26, 137–143. [Google Scholar] [CrossRef]
  18. Bartosik, R.E.; Maier, D.E. Effect of airflow distribution on the performance of NA/LT in-bin drying of corn. Trans. ASAE 2006, 49, 1095–1104. [Google Scholar] [CrossRef]
  19. Jayas, D.S.; Sokhansanj, S. Design data on resistance of airflow through canola (rapeseed). Trans. ASAE 1989, 32, 295–0296. [Google Scholar] [CrossRef]
  20. Kate, A.E.; Chakraborty, S.K.; Pawar, D.A.; Gorrepati, K. Airflow resistance and pressure drop behavior in different conditions of bulk-stored onion and its dynamic modeling. J. Food. Eng. 2019, 42, 1–11. [Google Scholar] [CrossRef]
  21. Kuptz, D.; Hartmann, H. Prediction of air pressure resistance during the ventilation of wood chips as a function of multiple physical fuel parameters. Biomass Bioenergy 2021, 145, 1–11. [Google Scholar] [CrossRef]
  22. Khatchatourian, O.A.; Savicki, D.L. Mathematical modelling of airflow in an aerated soya bean store under non-uniform conditions. Biosyst. Eng. 2004, 88, 201–211. [Google Scholar] [CrossRef]
  23. Kobus, Z.; Guz, T.; Kusińska, E.; Nadulski, R. Influence of moisture and vertical pressure on airflow resistance through oat grain. Inżynieria Rol. 2011, 15, 29–35. [Google Scholar]
  24. Chiputula, J.; Ajayi, E.; Bucklin, R.A.; Blount, A.R. Effects of moisture content and compaction pressure on bulk density of rye. Appl. Eng. Agric. 2021, 3, 491–494. [Google Scholar] [CrossRef]
  25. Cheng, X.D.; Zhang, Q.; Yan, X.J.; Shi, C.X. Compressibility and equivalent bulk modulus of shelled corn. Biosyst. Eng. 2015, 140, 91–97. [Google Scholar] [CrossRef]
  26. Yue, R.; Zhang, Q. Changes in Pore Structures of Porous Beds When Subjected to Vertical Vibration. KONA Powder Part. J. 2017, 1, 1–10. [Google Scholar] [CrossRef] [Green Version]
  27. Moses, J.A.; Chelladurai, V.; Jayas, D.S.; Alagusundaram, K. Simulation and validation of airflow pressure patterns in hopper-bottom bins filled with wheat. Appl. Eng. Agric. 2015, 31, 303–311. [Google Scholar] [CrossRef]
  28. Khatchatourian, O.A.; Binelo, M.O. Simulation of three-dimensional airflow in grain storage bins. Biosyst. Eng. 2008, 101, 225–238. [Google Scholar] [CrossRef]
  29. Cundall, P.A.; Strack, O.D. A discrete numerical model for granular assemblies. Geotechnique 1979, 29, 47–65. [Google Scholar] [CrossRef]
  30. Mohseni, M.; Peters, B.; Baniasadi, M. Conversion analysis of a cylindrical biomass particle with a DEM-CFD coupling approach. Case. Stud. Therm. Eng. 2017, 10, 343–356. [Google Scholar] [CrossRef]
  31. Bai, H.; Theuerkauf, J.; Gillis, P.A.; Witt, P.M. A coupled DEM and CFD simulation of flow field and pressure drop in fixed bed reactor with randomly packed catalyst particles. Ind. Ene. Chem. Res. 2009, 48, 4060–4074. [Google Scholar] [CrossRef]
  32. Niu, Q.; Wang, N.X. Study of heat transfer by using DEM-CFD method in a randomly packed pebble-bed reactor. Nucl. Sci. Tech. 2019, 30, 28. [Google Scholar] [CrossRef]
  33. ASAE S352.2 APR1988 (R2017); Moisture Measurement-Unground Grain and Seeds. ASAE: St. Joseph, MI, USA, 2017.
  34. Aghbashlo, M.; Mandegari, M.; Tabatabaei, M.; Farzad, S.; Soufiyan, M.M.; Görgens, J.F. Exergy analysis of a lignocellulosic-based biorefinery annexed to a sugarcane mill for simultaneous lactic acid and electricity production. Energy 2018, 149, 623–638. [Google Scholar] [CrossRef]
  35. Nemec, D.; Levec, J. Flow through packed bed reactors: 1. Single-phase flow. Chem. Eng. Sci. 2005, 60, 6947–6957. [Google Scholar] [CrossRef]
  36. Langston, P.; Kennedy, A.R. Discrete element modelling of the packing of spheres and its application to the structure of porous metals made by infiltration of packed beds of NaCl beads. Powder Technol. 2014, 268, 210–218. [Google Scholar] [CrossRef]
  37. Yan, D.X.; Yu, J.Q.; Wang, Y.; Zhou, L.; Yu, Y.J. A general modelling method for soybean seeds based on the discrete element method. Powder Technol. 2020, 372, 212–226. [Google Scholar] [CrossRef]
  38. Dixon, A.G.; Nijemeisland, M.; Stitt, E.H. Systematic mesh development for 3D CFD simulation of fixed beds: Contact points study. Comput. Chem. Eng. 2013, 48, 135–153. [Google Scholar] [CrossRef]
  39. Bu, S.S.; Yang, J.; Zhou, M.; Li, S.Y.; Wang, Q.W.; Guo, Z.X. On contact point modifications for forced convective heat transfer analysis in a structured packed bed of spheres. Nucl. Eng. Des. 2014, 270, 21–33. [Google Scholar] [CrossRef]
  40. Dixon, A.G.; Walls, G.; Stanness, H.; Nijemeisland, M.; Stitt, E.H. Experimental validation of high Reynolds number CFD simulations of heat transfer in a pilot-scale fixed bed tube. Chem. Eng. J. 2012, 200, 344–356. [Google Scholar] [CrossRef]
  41. Eisfeld, B.; Schnitzlein, K. A new pseudo-continuous model for the fluid flow in packed beds. Chem. Eng. Sci. 2005, 60, 4105–4117. [Google Scholar] [CrossRef]
  42. De Klerk, A. Voidage variation in packed beds at small column to particle diameter ratio. AIChE J. 2003, 49, 2022–2029. [Google Scholar] [CrossRef]
  43. Guo, Z.H.; Sun, Z.N.; Zhang, N.; Ding, M.; Shi, S. CFD analysis of fluid flow and particle-to-fluid heat transfer in packed bed with radial layered configuration. Chem. Eng. Sci. 2019, 197, 357–370. [Google Scholar] [CrossRef]
  44. Ergun, S. Fluid flow through packed columns. Chem. Eng. Prog. 1952, 48, 89–94. [Google Scholar]
  45. Forchheimer, P. Wasserbewegung durch boden. Z. Ver. Dtsch. Ing. 1901, 45, 1782–1788. [Google Scholar]
  46. Sobieski, W.; Zhang, Q.; Liu, C.Y. Predicting tortuosity for airflow through porous beds consisting of randomly packed spherical particles. Transp. Porous Media 2012, 93, 431–451. [Google Scholar] [CrossRef] [Green Version]
  47. Nwaizu, C.; Zhang, Q. Computational modeling of heterogenous pore structure and airflow distribution in grain aeration system. Comput. Electron. Agric. 2021, 188, 1–10. [Google Scholar] [CrossRef]
  48. Panigrahi, S.S.; Singh, C.B.; Fielke, J. Strategies to mitigate dead-zones in on-farm stored grain silos fitted with aeration ducting modelled using computational fluid dynamics. Biosyst. Eng. 2021, 205, 93–104. [Google Scholar] [CrossRef]
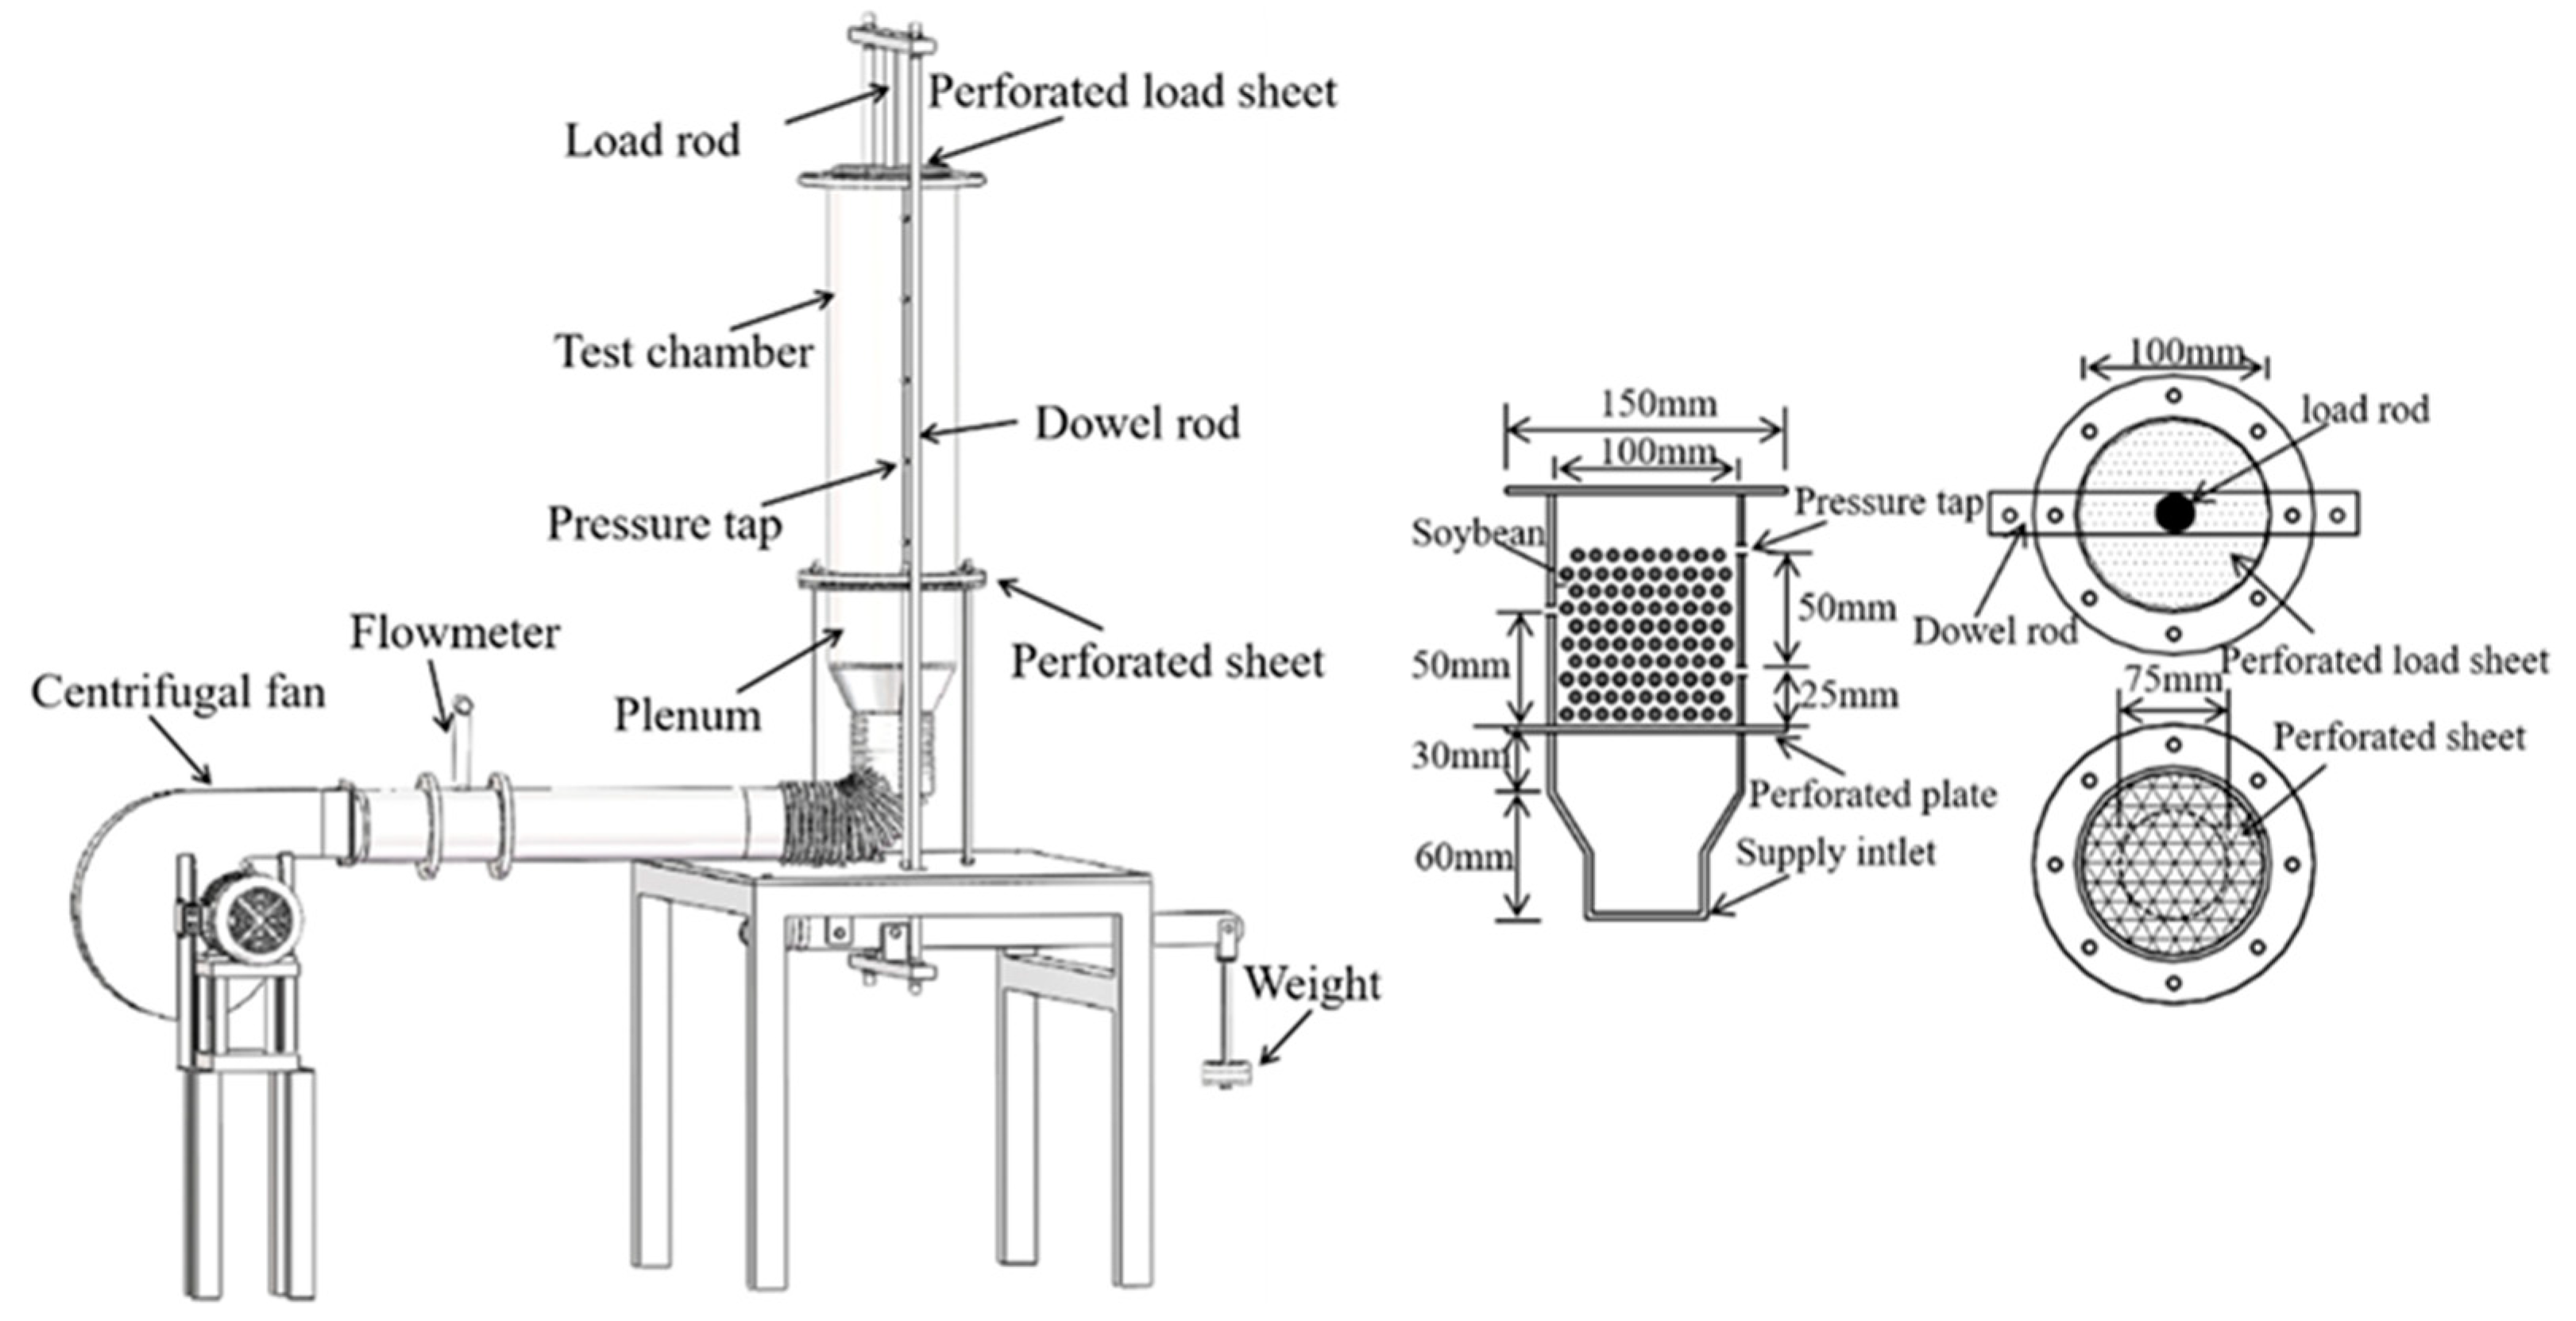
Figure 1. Schematic diagram of measuring soybean airflow resistance under vertical pressure.
Applsci 12 06830 g001
Figure 2. Soybean packing geometry model diagram.
Applsci 12 06830 g002
Figure 3. Schematic diagram of grid and contact treatment.
Applsci 12 06830 g003
Figure 4. Compression characteristics in soybean bulk.
Applsci 12 06830 g004
Figure 5. Particle center coordinates under different vertical pressures: (a) 0 kPa (b) 50 kPa (c) 150 kPa (d) 250 kPa.
Applsci 12 06830 g005
Figure 6. Radial porosity distribution under different vertical pressure.
Applsci 12 06830 g006
Figure 7. The contours of velocity under different vertical pressures at inlet velocity V0 = 0.6 m/s: (a) 0 kPa (b) 50 kPa (c)150 kPa (d) 250 kPa.
Applsci 12 06830 g007
Figure 8. Radial mean dimensionless velocity under different vertical pressures.
Applsci 12 06830 g008
Figure 9. Pressure drop test values under different vertical pressures.
Applsci 12 06830 g009
Figure 10. Airflow path distribution under different vertical pressure: (a) 0 kPa (b) 50 kPa (c) 150 kPa (d) 250 kPa.
Applsci 12 06830 g010
Figure 11. Comparison results of soybean pressure drop at different vertical pressures: (a) 0 kPa (b) 50 kPa (c) 150 kPa (d) 250 kPa.
Applsci 12 06830 g011
Figure 12. The contours of pressure drop under different vertical pressures at inlet velocity V0 = 0.6 m/s: (a) 0 kPa (b) 50 kPa (c) 150 kPa (d) 250 kPa.
Applsci 12 06830 g012
Table 1. Soybean particle parameters used in the DEM simulation.
ParametersSymbolValue
Packed bed dimensionD × H, m0.1 × 0.075
Particle diameterdp, m0.00724
Particle densityρp, kg/m31257
Poisson ratioν0.4
Modulus of elasticityE, Pa7.6 × 108
static friction coefficientμs0.2
rolling friction Coefficientμr0.02
Coefficient of restitutione0.627
Table 2. Results of PathFinder code calculations.
ParametersSymbolValue
0 kPa50 kPa150 kPa250 kPa
Average number of path points-34333230
Tortuosityτ1.251.321.431.47
Porosityε0.4280.3910.3620.353
Inner surfaceSp, m20.275
Solid volumeVb, m30.00033
Specific surfaceS0, m2824.73
pore shape factorCkc5
Forchheimer coefficientA17,740,438.6127,852,990.6741,729,700.9847,576,815.47
Forchheimer coefficientB191.24246.34320.98329.47
Publisher’s Note: MDPI stays neutral with regard to jurisdictional claims in published maps and institutional affiliations.