Article

Research on a Measurement Method for the Ocean Wave Field Based on Stereo Vision

1
China Ship Scientific Research Center, Wuxi 214082, China
2
Southern Marine Science and Engineering Guangdong Laboratory (Guangzhou), Guangzhou 511458, China
3
Taihu Laboratory of Deepsea Technological Science, Wuxi 214125, China
*
Authors to whom correspondence should be addressed.
Appl. Sci. 2022, 12(15), 7447; https://doi.org/10.3390/app12157447
Submission received: 6 June 2022 / Revised: 5 July 2022 / Accepted: 13 July 2022 / Published: 25 July 2022

Abstract

:

Featured Application

This technology can realize near-field wave load monitoring on ships and it can also provide support for short-term wave prediction.

Abstract

The wave parameter is an important environmental input condition. Traditional contact wave measurement methods are unable to meet the requirements of high precision, non-contact, and ship wave field assessment. Alternatively, stereo vision technology can realize a non-contact and mobile form of measurement. However, this technology suffers from poor timeliness and adaptability. This paper proposes a comprehensive wave measurement method that is based on stereo vision, wherein the gridding of siftGPU is used to achieve the fast matching of large images. The whole algorithm can be run within 6 s and it guarantees more than 20,000 feature-matching logarithms. Furthermore, by utilizing the least squares method and sea surface wave surface theory, the sea surface base level can be calculated without control points, along with the inversion of the sea wave parameters (wave height, period, and wave direction) and error point fitting. The rationality and superiority of the algorithm were verified through multiple comparison experiments. Compared with the Richard Brancker Research (RBR) wave height meter, the measurement error of the wave height is less than 10%, the period error is less than 0.5 s, and the wave direction error is less than 10° with the proposed method.

1. Introduction

Ocean waves indicate a classic and important research direction in the field of physical oceanography [1]. The wave parameter is also an important environmental input condition [2]. The directional spreading of ocean waves plays an important role in various aspects of ocean engineering, such as wave-induced loads, nonlinear wave evolution, and wave breaking [3]. Moreover, consistent sea state time series are essential for building coastal protection or offshore structures [4]. Current wave observation methods can be divided into two categories [5], the first of which is the “point” measurement method that is represented by wave buoys, which requires a fixed mooring line and is troublesome to deploy and maintain [6]. Another one is the “surface” measurement method that is represented by a synthetic aperture radar that obtains wave data depending on the selection of inversion parameters. It has a low measurement accuracy. Owing to such problems in the existing wave observation methods, research on non-contact, mobile and high-precision wave field measurement technology has become one of the important tasks for many countries [7].
Stereoscopic wave measurement technology is a wave measurement technology that uses two photographic cameras to synchronically collect images of the sea’s surface. It can directly extract the three-dimensional spatiotemporal distribution of the sea surface fluctuations through the principle of image matching and lens imaging and it obtains the direction spectrum [8]. This technology can effectively make up for the deficiencies of buoys and the remote sensing observation method. Therefore, the development of stereo vision wave measurement technology has important scientific significance and a practical application value for the theoretical development of ocean waves and their application in ocean remote sensing and ocean engineering [9].
The direct linear transformation (DLT) theory was proposed by Abdel-Aziz in 1971; it takes several or even ten days for each pair of images to be completely analyzed, thereby affecting the post-processing time [10]. In 2009, Vies et al. developed a stereo-photographic ocean wave measurement system and performed an experiment on the coast of Scheveningen [11]. They successfully measured the evolution of waves and they found that the measured sea surface area reached 1800 m2 [12]. Furthermore, in 2011, Wanek developed a fully automated trinocular photography ocean wave observation system (ATSIS) [13]. Different from the other photography systems, ATSIS uses three synchronized cameras to form an image acquisition system in the shape of a “product” and it simulates the measurement scene through the previously recorded camera frame’s orientation in the laboratory in order to calibrate the external orientation elements. The ATSIS calibration process is cumbersome and the measurement area is limited by the camera’s frame, indeed the ATSIS measurement area is only about 10 m2 [14]. In 2010, Cai Zhenghan used three synchronous cameras to form an image acquisition system in the shape of a “pin” [15] and then obtained the coordinates of the control point through the means of assessing the underwater makeup. It was necessary to set the calibration points with the current pool and the overall operation was complex [16]. In 2011, Yu Heng of Henan University captured a target image of the Yellow River model water flow vertically through a binocular system. By combining the improved Canny edge detection algorithm with the morphological connected domain segmentation method, he finally extracted and identified the river’s potential width and the flow velocity of the Yellow River model [17]. In 2012, Jiang Wenzheng, through his digital photogrammetry wave measurement system, reported a good study on the feature matching of left and right images [18]. Moravec’s corner detector is a corner detection operator that is based on gray variance that extracts the points with the maximum and minimum gray variance in four main directions as the feature points [19]. First, the Moravec corner points were extracted from the top layer of a pyramidal image. Then, the left and right images were extracted. Next, the corner points that were extracted from the top-level image of the pyramid were matched based on the principle of a maximum cross-correlation measure, thus obtaining the top-level matching pair set. In the matching pair sets, each matching pair was in the corresponding lower-level area of the pyramid and then matching that was based on a maximum cross-correlation measure was performed. After that, the matching sets of the left and right images were obtained. This feature matching method provides matching pairs as coordinates for the three-dimensional reconstruction of waves and, in this way, realizes sea surface wave measurement. However, the matched results that are obtained via this method have many mismatches. Accordingly, in the future, complex algorithms need to be introduced in order to eliminate the mismatches, alternatively algorithmically accurate wave heights can be introduced in the three-dimensional reconstruction [20]. In 2014, Cui Hao et al. achieved the acquisition of wave crest coordinates based on contour extraction technology, which reduced the influence of the acquisition accuracy on the two-dimensional coordinates of the wave crest in non-contact wave photogrammetry technology, but only the wave’s crest was studied [21].
This paper presents a comprehensive process algorithm of wave measurement that is based on stereo vision.
(1)
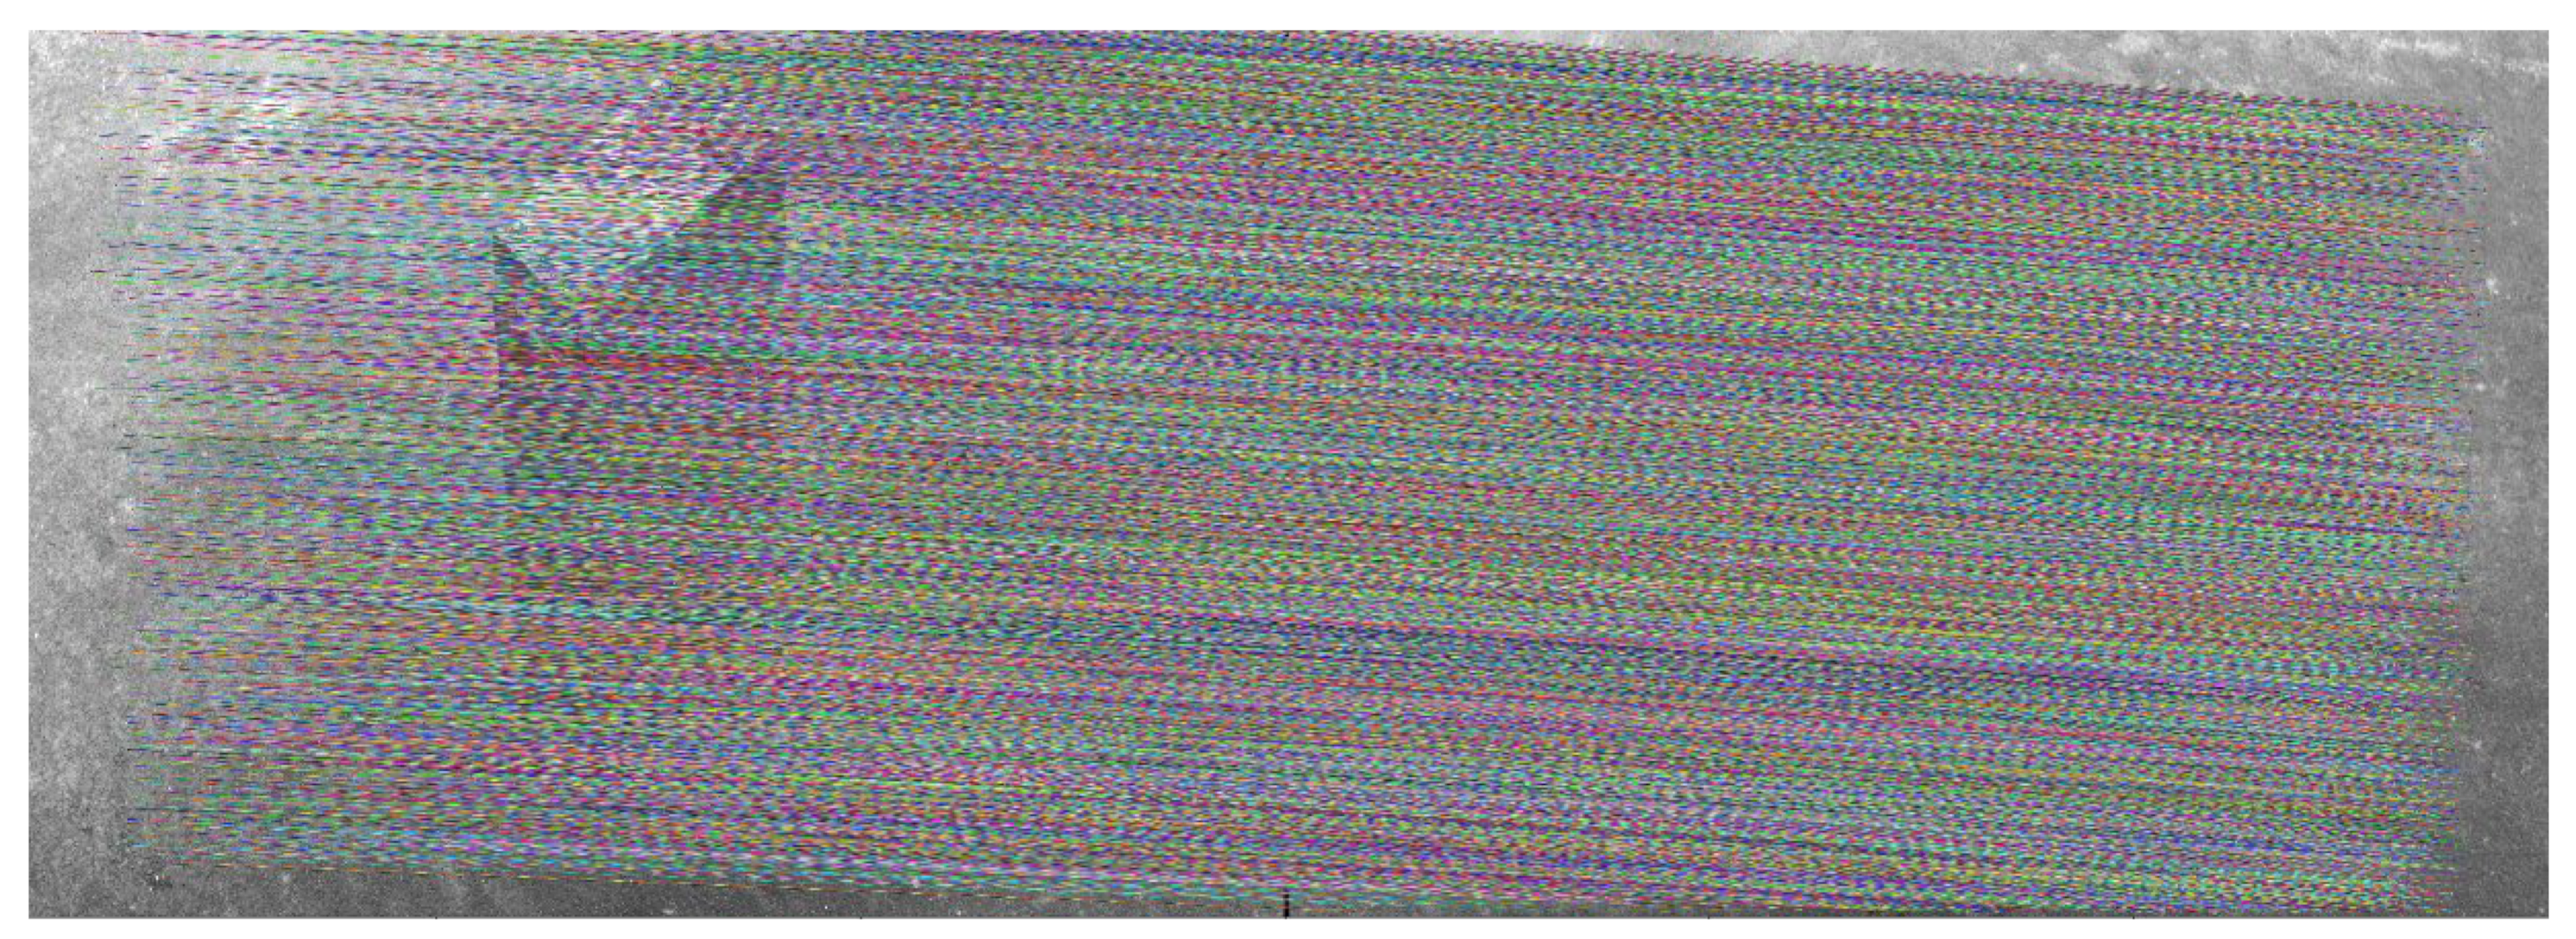
The matching part utilizes the gridding siftGPU method, wherein first the common area of the left and right cameras is determined and, then, grid zoning for the common area is carried out. The grid coordinates of the left camera are used to preliminarily locate the corresponding grid coordinates of the right camera and GPU multithreading processing is used in order to realize multi feature points and fast matching. Compared with the conventional siftGPU, the matching time with the proposed approach can be controlled below 6 s while the number of matching points can be maintained above 20,000, an outcome that is evidently much better than that of the traditional siftGPU algorithm.
(2)
In this paper, the least squares method and wave theory are used to normalize the sea surface-based plane calibration, plane error point fitting, and wave parameter inversion. The design’s method is simple and feasible. Compared with the traditional wave height meter, the wave height range is 0.2 m–1 m, the measurement error is less than 10%, and the periodic measurement error is less than 0.5 s.
(3)
The Hough transform and least squares method have been used herein to calculate the wave’s direction value. It was observed that, for a given wave image, the detection results and the original direction are basically the same.
The rest of this paper is organized as follows. Section 2 introduces the whole process of utilizing the algorithm of wave measurement that is based on stereo vision. Section 3 presents the experimental tests and results. Finally, the conclusions and directions for future work are given in Section 4 and Section 5.

2. Materials and Methods

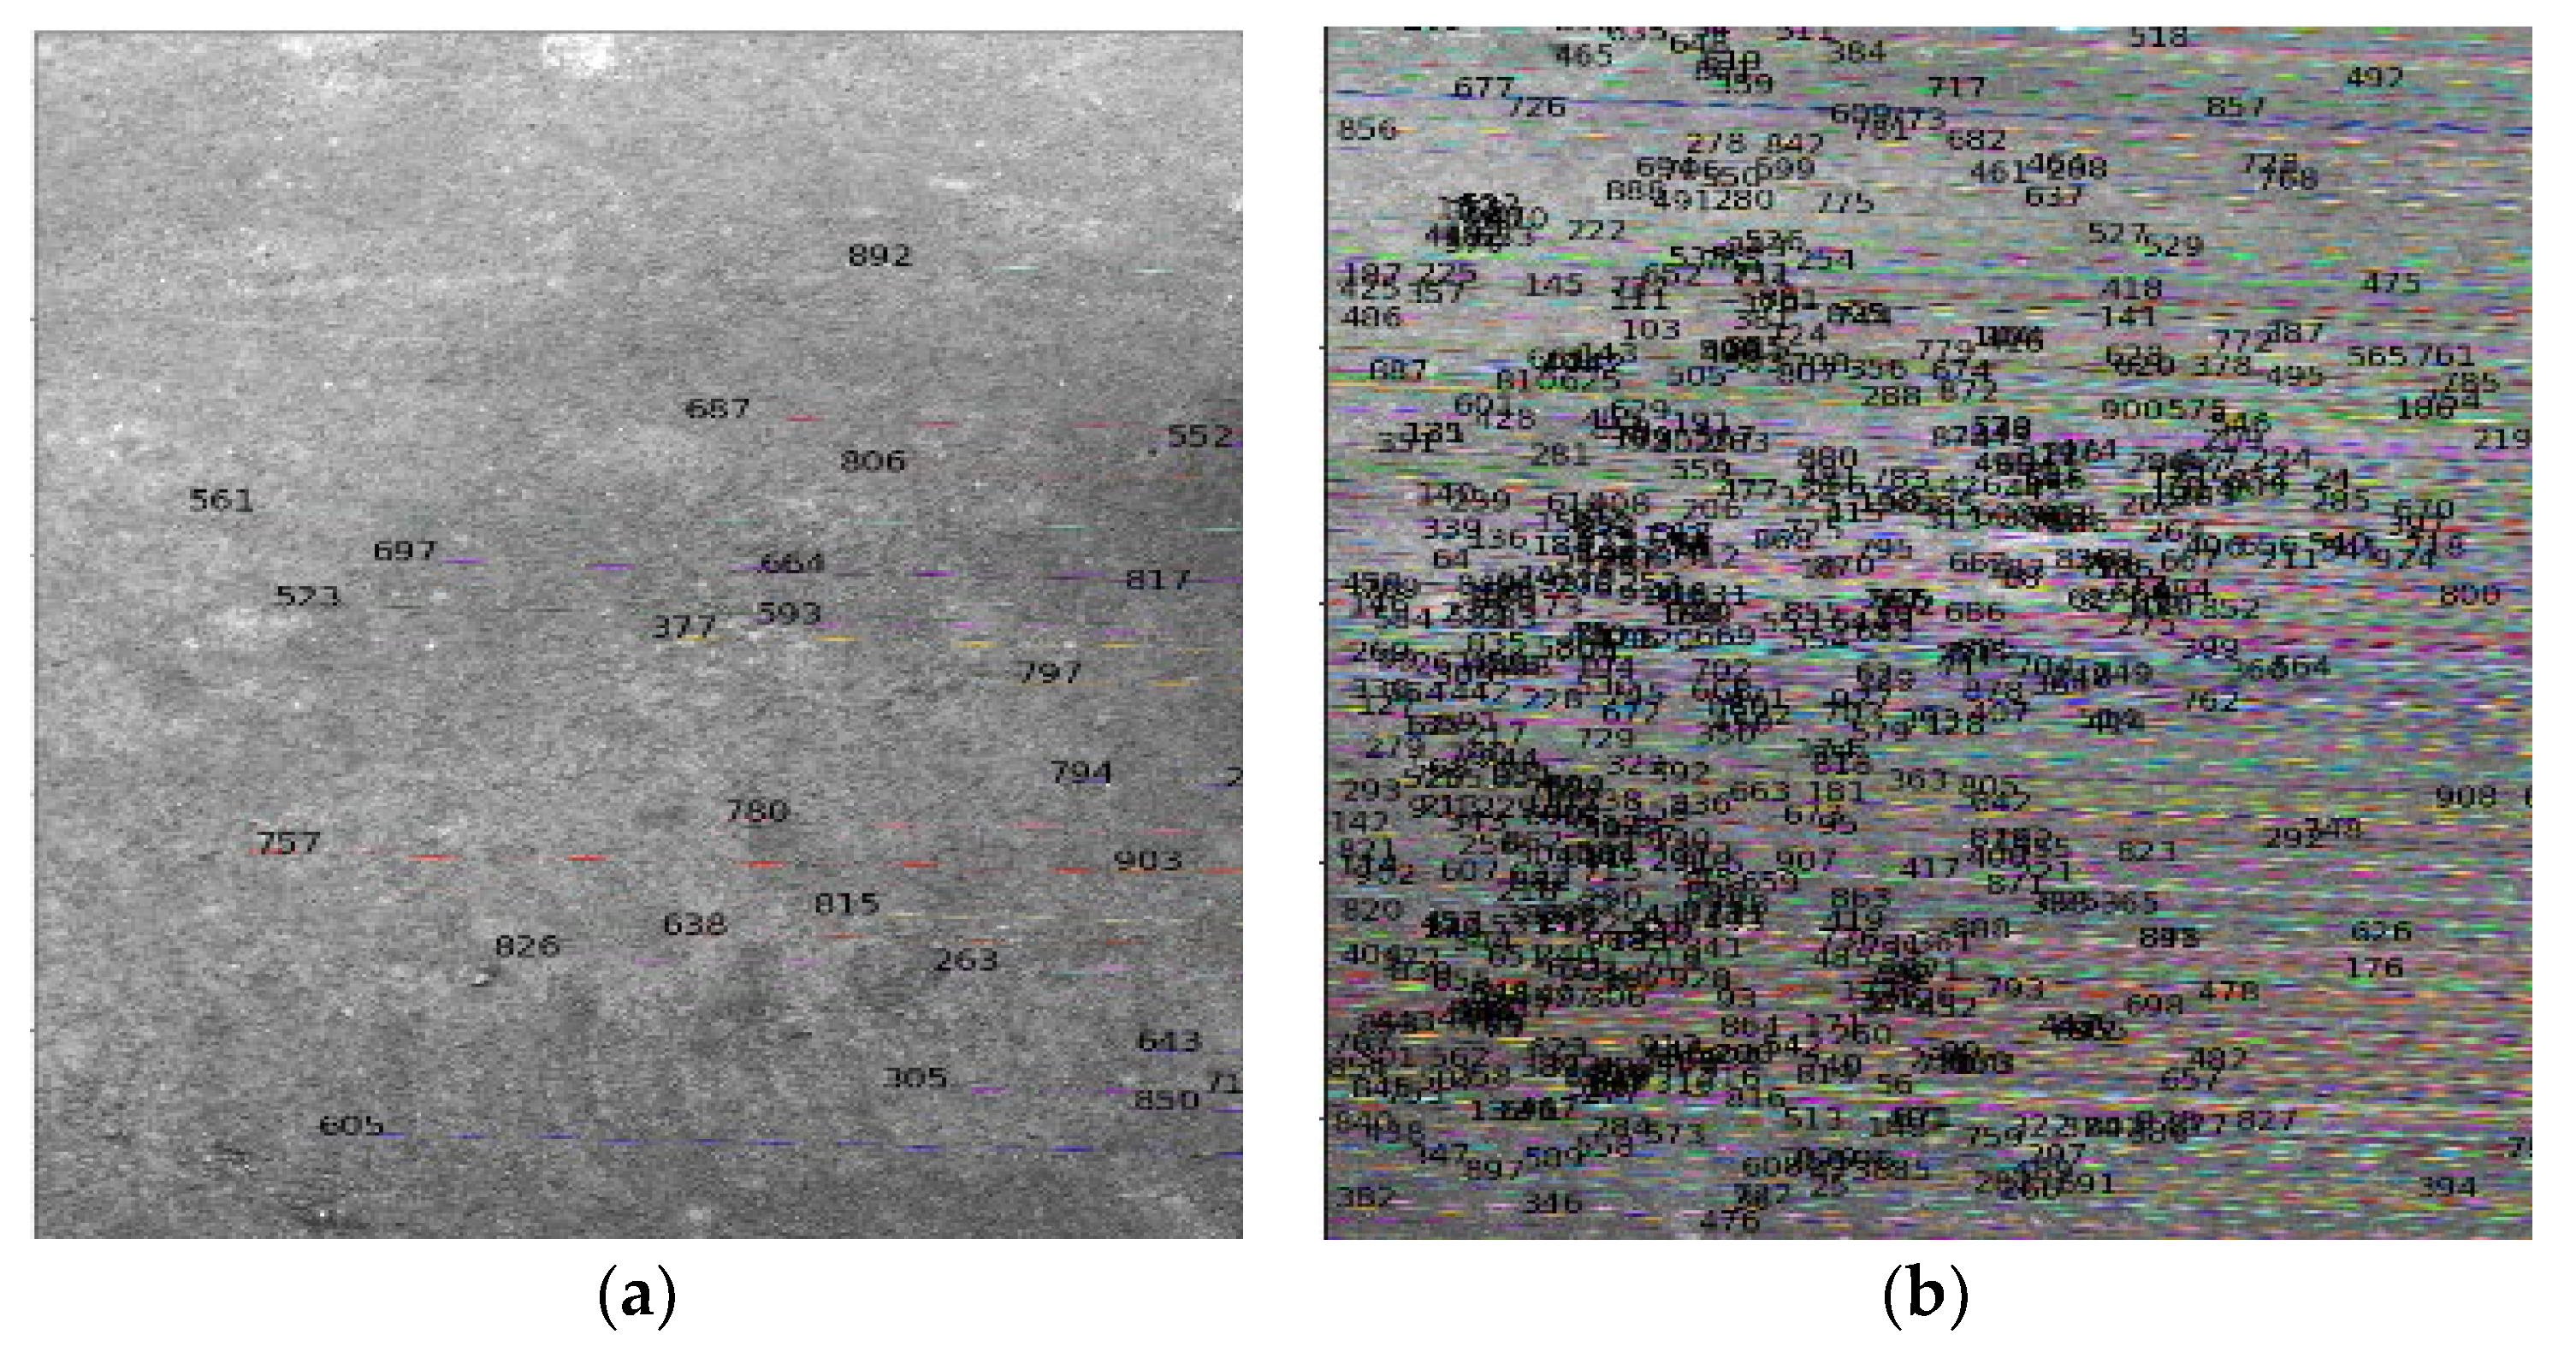
2.1. Stereo Calibration

The purpose of calibration is to obtain a mapping model between the target that is in three-dimensional coordinate space and the two-dimensional image [22]. Essentially, the internal parameters, external parameters, and distortion coefficients that are obtained through this calibration are the basis of the image correction, parameter inversion, and three-dimensional reconstruction. This paper refers to the method that was proposed by Zhang Zhengyou [23] in order to achieve dual-objective targeting. The specific steps are listed as follows:
(1)
Construct a checkerboard calibration board with black and white grids, wherein the length and size of the black and white grids are 10 cm and 9 cm × 7 cm, respectively.
(2)
Use the binocular camera to take 25 images of the calibration board from different angles.
(3)
Use the algorithm to identify the pixel coordinates of the corner points (i.e., the black and white grid intersections) in the image for matching.
(4)
Calculate the inversion in order to obtain the internal parameters, external parameters, and lens distortion coefficients of the binocular camera.

2.2. Stereo Matching

2.2.1. Scale-Invariant Feature Transform (SIFT) Feature Extraction and Matching

The first part of the SIFT process is the production of a Gaussian scale space [24], in which each octave is computed by means of the convolution between a down-sampled image and different Gaussian kernels, such as L ( x , y , σ ) in Equation (1), where G ( x , y , σ ) is a variable-scale Gaussian kernel and I ( x , y ) is an input image.
Next, the second part includes a difference of Gaussian (DoG) scale space [25], this DoG is a close approximation of the Laplacian of Gaussian (LoG), as expressed in Equation (2). Compared with LoG, DoG has lower computational costs and uses approximately the same function to extract stable features.
L ( x , y , σ ) = G ( x , y , σ ) × I ( x , y )
D ( x , y , σ ) = L ( x , y , k σ ) L ( x , y , σ )
The third part of SIFT contains the pixel and sub-pixel localizations of a keypoint [26]. The extreme pixel is compared with 26 neighboring pixels in a DoG scale space, which is chosen as the candidate pixel keypoint. Then, the localization of the sub-pixel keypoint is implemented using a quadratic approximation, which is computed using the second-order Taylor expansion.
The fourth part of the SIFT algorithm uses 128 dimension descriptors [27] to conduct the feature matching process. The SIFT feature descriptors represent the image gradient magnitudes and orientations in a 4 × 4 sub-region around the candidate feature.
Unfortunately, this strategy needs high computational power and memory consumption, which limit the use of SIFT in real-time engineering applications [28]. Notably, the above steps of the primal SIFT can run on a GPU in parallel fashion. It is shown that the performance of SiftGPU is nearly real-time for the images and the quality of the features that are extracted by SiftGPU is approximately the same as those that are extracted by the primal SIFT. However, since the GPU’s memory is limited, large images need to be down-sampled for size reduction before applying SIFT [29].
Due to the limitations of GPU and SIFT, a gridding siftGPU method is proposed in this work in order to extract and match the features from large images more efficiently.

2.2.2. Gridding SiftGPU Feature Extraction and Matching

First, we used several pairs of wave images to perform the image matching through the use of traditional SIFT, determine the common area of the left and right images, and determine the left image edge points ( u l m i n , v l m i n ) and right image edge points ( u r m a x , v r m a x ) . Here, the common area of the left image is ( u l m i n u l m a x , v l m i n v l m a x ), while that of right image is (0 − u r m a x , 0 − v r m a x ), and the non-overlapping area is cropped.
Subsequently, we divided the common area of the left and right images into matching blocks. At this stage, a specific matching block size was selected according to the actual resolution of the image. It was assumed that the pixel value of a block in the left image was the same as the pixel value in the matching block in the right image. Meanwhile, the size of the areas corresponding to the same matching block are not equal and the pixel coordinates do not have a simple one-to-one correspondence. The calculation method is given in Figure 1:
Considering the camera distortion [30], there are:
x i l = x 0 l + u i l + k 1 ( x 0 l + u i l ) r i l 2 y i l = y 0 l + v i l + k 1 ( y 0 l + v i l ) r i l 2
In above formula, ( u i l , v i l ) are the pixel coordinates of the left image, ( x 0 l , y 0 l ) are the center coordinates of the left image, k is the distortion parameter of the left and right cameras, and r is the distance between the pixel coordinates and center coordinates, r i l = ( x + u ) 2 + ( y + v ) 2 .
As shown in Figure 2, when it is assumed that the vector coordinates of OA are r = ( x i l , y i l , f ) and that o is the vector coordinates of OO’, then the normal vector of the plane is expressed as follows:
n = r × o
Then the normal vector n in the right camera coordinate system is expressed as follows:
N r = R 1 N
In above formula, R is the rotation matrix of the left camera and N represents the matrix corresponding to normal n. Therefore, the right camera pixel coordinates are:
n r ( x i r i + y i r j f k ) = 0
where f is the focus of the camera, N is the vector corresponding to matrix n, and ( x i r , y i r , f ) are the coordinates of the right camera.
Considering the camera distortion, there are:
x i r = x 0 r + u i r + k 1 ( x 0 r + u i r ) r i r 2 y i r = y 0 r + v i r + k 1 ( y 0 r + v i r ) r i r 2
where k is the distortion parameter of the right camera, r is the distance between the pixel coordinates and the center coordinates, and ( x 0 r , y 0 r ) are the center coordinates of the right image.
In this way, the pixel coordinates of the left and right matching grids were obtained and the position of the left and right corresponding windows was confirmed.
After determining the corresponding matching blocks in the left and right images, we then performed multi-threaded siftGPU accelerated matching on the matching grids in order to achieve fast and accurate matching.

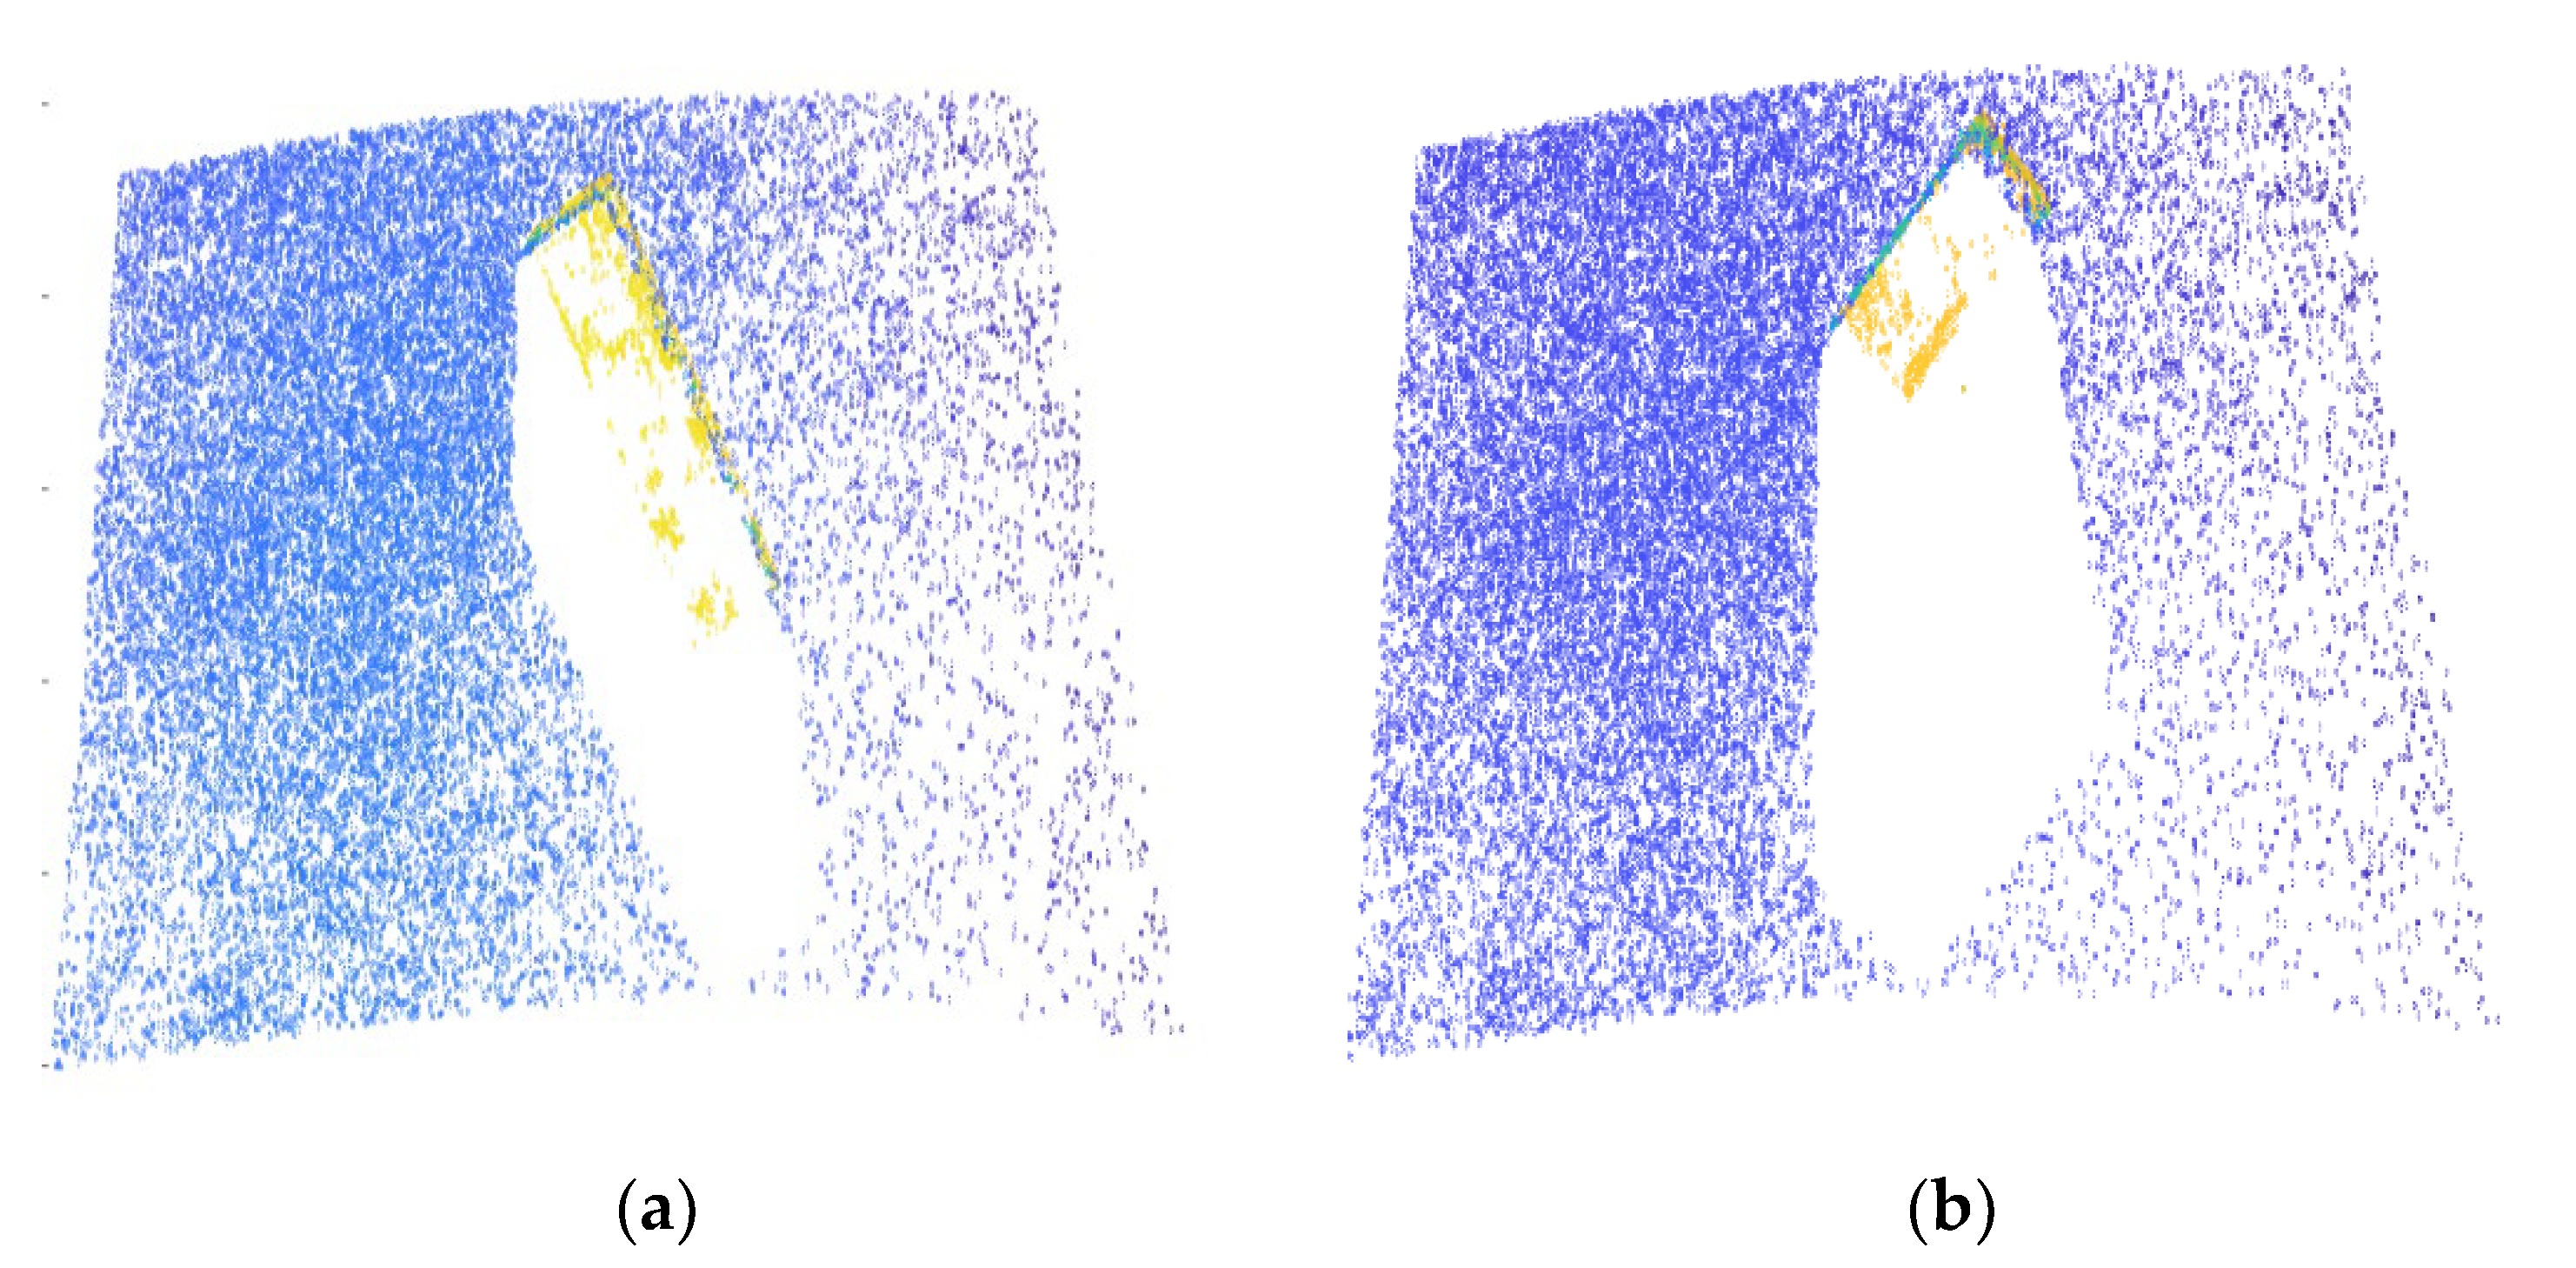
2.3. Sea Surface Base Plane Calibration

We then converted the image coordinates to camera coordinates and the specific method for this conversion is described as follows:
Assume that the coordinates of the wave target point in the left camera coordinate system O w X w Y w Z w are ( x w , y w , z w ) and that the coordinates of the corresponding image points on the left and right images are ( u l , v l ) , ( u r , v r ) . According to the conversion relationship, the formula for converting the left and right image points to the left camera coordinate system can be given as:
z c l u l v l 1 = H l × x w y w z w 1 , z c r u r v r 1 = H r x w y w z w 1
H l = A l × E 0
H r = A r × R T
In above formula, A l , A r are the internal parameter matrices of the left and right cameras, respectively; R , T are the rotation and translation matrices of the dual target, which can be obtained by calibration, and, then, H l and H r can be obtained. Expanding the above formula can provide the following formulas:
M = u l h l 31 h l 11 u l h l 32 h l 12 u l h l 33 h l 13 v l h l 31 h l 21 v l h l 32 h l 22 v l h l 33 h l 23 u r h r 31 h r 11 u r h r 32 h r 12 u r h r 33 h r 13 v r h r 31 h r 21 v r h r 32 h r 22 v r h r 33 h r 23
U = h l 14 u l h l 34 h l 24 v l h l 34 h r 14 u r h r 34 h r 24 v r h r 34
where M , U can be obtained from H l , H r , and the pixel coordinates ( u l , v l ) , ( u r , v r ) . Then the camera coordinates of the wave space point ( x w , y w , z w ) can be obtained through the following formula:
x w y w z w = ( M T × M ) 1 M T U
Hereafter, we converted the camera coordinates to the object coordinates; the specific method is as follows:
Select the calm sea images that match. The sea surface base plane equation is given as:
a x w + b y w + z w + c = 0
In the formula, a and b are the normal vectors in the X and Y directions and c is the average distance from the camera to the sea surface base plane.
Through the transformation of the coordinate system, the coordinates of the feature points in the camera coordinate system are obtained as:
B = x w 1 y w 1 1 x w 2 y w 2 1 x w n y w n 1
L = z w 1 z w 2 z w n T
The parameters of the sea surface base plane can be calculated using the least squares method as:
[ a , b , c ] = ( B T × B ) 1 × B T × L
Normalizing the plane normal vector that was obtained from each image results in:
n = a i + b j k a 2 + b 2 + 1 2
In the formula, n is the normal vector of the sea surface base plane.
The spherical coordinate transformation is performed on the normal vector, which is convenient for calculating the changing relationship between the image coordinate system and the object coordinate system.
φ = arccos ( c / a 2 + b 2 + 1 2 )
θ = arctan ( b / a )
In these formulas, φ and θ correspond to the spherical coordinates of the sea surface base plane.
Then, the conversion of the rotation and translation matrices from the camera coordinate system to that object coordinate system is expressed as:
R w = sin φ cos φ 0 cos θ cos φ cos θ sin φ sin θ sin θ cos φ sin θ sin φ cos θ
T w = R w 0 0 c T
Subsequently, the camera coordinates are obtained based on the sea surface base plane equation for the conversion from the camera coordinate system x w , y w , z w to the object coordinate system x c , y c , z c . This conversion equation is:
( x c , y c , z c ) T = R w ( x w , y w , z w ) T + T w

2.4. Wave Parameter Inversion

1.
Wave Height and Period
The center point of the matching block was selected as the wave inversion point. In order to ensure the accuracy of the calculation, the center point of the four matching blocks was selected in order to calculate the wave’s height and the changes in the wave data throughout 10 min was recorded. Next, the spectrum was obtained by the use of the Fourier transform and the main frequency range was selected. Following this, we selected the frequency of 0–0.5 Hz, filtered out the high-frequency part, and performed an inverse Fourier transform in order to obtain the time-domain curve corresponding to the main frequency. Then, we used the zero-crossing method to calculate the wave height and period.
2.
Wave Direction
The wave direction calculation method that was employed in this paper is as follows:
Essentially, the Hough transform is a feature extraction method. In this work, the Hough transform was performed on the left image and the specific steps are as follows:
    • Use a two-dimensional Gaussian function to the detect the extreme points. Obtain the coordinates of those extreme points ( u i , v i ) .
    • Convert the planar coordinates ( u i , v i ) to polar coordinates ( ρ , θ ) by using:
      ρ = u c o s θ + v s i n θ
    • Calculate the maximum value with a two-dimensional accumulator A ( a , b ) as:
A ( a , b ) = A ( a , b ) + 1
The camera resolution is M 1 × M 2 and, therefore, the parameter coordinate range is:
ρ 2 M 1 / 2 , 2 M 2 / 2
θ π / 2 , π / 2
The maximum value corresponding to the accumulator in the statistical parameter coordinate system is ρ , θ . Record all of the pixel coordinates on the line.
Next, calculate the corresponding u i h , v i h and x i h c , y i h c , z i h c . If z i h c 0.95 × z max , calculate the normal vector of the straight line ρ = x cos θ + y sin θ . On the other hand, if z i h c 0.95 × z max , select the corresponding coordinates to carry out the least squares fitting, so as to calculate the normal vector of the main peak line;
The normal vector of each straight line corresponds to two angles; thus it is necessary to determine the direction of the wave motion. In this paper, true north and counterclockwise rotation are considered as the positive direction when judging the change in the intercept of the wave crest line that was calculated in the frame images afterwards, so as to determine the wave movement direction.

3. Results

3.1. Laboratory Verification

The relevant experiment was carried out in the China Shipbuilding Research Center. The experiment used two cameras with a resolution of 6280 × 3158 in order to obtain the impact pair (shown in the Figure 3). The image shooting time was 17 January 2022. Moreover, a calibration box was used to check the system algorithm in order to measure its accuracy and the specific parameters are as follows:
  • Calibration Results
The calibration results of the internal and external parameters of the camera are in Table 1:
2.
Gridding siftGPU Parameter Calculation
For the left picture, u l m i n = 580 and v l m i n = 158; whereas, for the right picture, u r m a x = 5700 and v r m a x = 3000. Meanwhile, the gridding matching block size was 300 × 300 and the number of matching blocks was 190. Here, we chose the left picture (580, 158) and the right image (0, 0) for verification and the matching results are provided in the following Figure 3.
Following this, siftGPU and gridding siftGPU were used to match image 1 and image 2 and the matching result is shown in the following Figure 4, Figure 5, Figure 6 and Figure 7.
It can be seen from Figure 4, Figure 5, Figure 6 and Figure 7 that the matching number of feature points that are based on the gridding siftGPU algorithm is obviously better than that of the points that are based on the siftGPU algorithm. The calculation results are shown in the Table 2.
By comparison, the matching time of the gridding siftGPU was 1/6 of that of the siftGPU, whereas the match quantity that was based on the gridding siftGPU was 8 times that which was based on siftGPU.
3.
Calibration Results for the Base Plane
Twenty feature points were selected in image 2 in order to calculate the base plane. The selected area is the ground feature in image 2, which is shown in the Figure 8:
The code numbers and coordinates of the selected feature points are shown in Table 3.
The calculation parameters of the sea surface base plane are as follows:
a = 2.3715, b = −1.5122, c = −8428.2437
The calculation parameters of R w and T w are:
R w = 0.9983 0.059 0 0.042 0.717 0.696 0.041 0.695 0.718
T w = 0 5868.045 6049.904
Additionally, the scatter diagram is shown in Figure 8.
As shown in Figure 9, the original 3D point images of image 1 and image 2 are consistent with the original image. The blue points represent the ground features and the yellow features represent the calibration box features. The white area is the unrecognized area, due to the strong light.
Next, 14 points were selected in order to verify the measurement accuracy of the system. The obtained measurement results were compared with the tape (the minimum scale was 1 mm) and the error was basically controlled within 1%. The results are shown in Table 4 and Table 5.

3.2. Offshore Test Verification

The sea test was performed on the Qingdao Blue Valley No. 1 fixed platform on 19 January 2022. The image was captured simultaneously by two QHY26m industrial cameras and the lens that was used was a Nikon 50 mm/1.4D fixed-focus. The pixels of the QHY26M industrial camera were arranged to a value of 6280 × 3158, the pixel size was 3.76 um, and the height of the camera from the sea surface was about 10 m (relative to the tide level). The exposure time was set to 2 ms, the sampling frequency was 2 Hz, and the test position was the hatch of the platform. The test interval was between 14:00–16:00 and, in each observation, the data were collected for 10 min. The results of this work are compared with an RBR wave height meter’s data for verification. Furthermore, the test parameters are consistent with the laboratory verification parameters and the test pictures are shown in Figure 10:
The size of the field was X min = 1500   mm , X max = 1000   mm , Y min = 1000   mm , and Y max = 1000   mm . The coordinates of the center point (0, 0) were selected in order to verify the accuracy of the measured wave height and period. The measurement results are shown in the Figure 11:
As shown in the Figure 11, in the same time interval, the time–domain variation curve of wave height as measured at grid point (0, 0) with the proposed stereo vision wave measuring system is consistent with the time–domain variation trend of the wave height as measured by an RBR wave height meter. Moreover, the measurement results at grid point (−320, 0) are consistent with those at grid point (0, 0), in the same time interval.
The calculation results are shown in Table 6:
As shown in the Table 7, the wave height error that was based on binocular stereo vision is less than 10% and the period is less than 0.5 s, relative to the results of the RBR wave height meter.
The wave direction diagram is shown in the Figure 12:
As shown in Figure 12, the wave direction of the normal vector was basically consistent with the actual movement direction of the wave. The wave direction measurement error is ±10 degrees and the resolution is 1 degree. These findings imply that the measurement results are accurate. The calculation results are shown in Table 8:
A 3D reconstruction of the wave field is shown in Figure 13:
As is evident from Figure 12, the proposed method can effectively realize the three-dimensional reconstruction of an ocean wave field.
The wave height value of the 3D inversion is basically the same as the measurement result of the RBR wave height meter.

4. Discussion

Based on the results that were achieved by utilizing stereo vision in wave-height measurement, the following conclusions have been drawn:
(1)
Relying on the actual sea trial measurement results, it can be confirmed that the stereo vision wave measurement method can enable the accurate measurement of wave parameters (wave height, period, and wave direction) [30]. This is because the stereo vision technology uses the parallax formula to calculate the distance to the measured object, while the height of the object can be measured through corresponding coordinate conversion. Through the calculation of the elevation value of a fixed area, the wave height and the period of the sea wave can be analyzed. Furthermore, the wave direction can be detected using the normal vector of the wave crest line in the image, therefore it is necessary to recognize and fit the line features.
(2)
In order to realize a real-time operation of the whole process algorithm, the richness of the wave field’s features, and the accuracy of the measurement results, it is necessary to use a high-resolution camera for the measurement. However, this results in a too long matching time and very high computer memory costs. In this regard, the gridding siftGPU algorithm that is proposed in this paper considers that the common area of the left and right images can be gridded without down-sampling and the number of feature pairs can be matched using GPU multithreading processing, hence the matching is faster.
At present, radar is used for onboard wave measurements, however radar measurement is expensive and it has a low level of accuracy [31]. The fixed-point measurement methods mainly include ADCP and the wave heigh meter, both of which have high requirements for the water’s depth and they are also troublesome to place and recover. ADCP needs to be installed on the ground, while the wave heigh meter requires mooring line fixation [32]. In addition, both of these methods can only realize single point measurement and the measurement results will degrade due to the process of wave breaking under strong wave conditions. In contrast, stereo vision wave measurement technology can realize a non-contact and high-precision measurement. The main limitation of the approach that is presented in this paper is the high requirements of computer memory and GPU. Besides this, the internal and external parameters of the camera need to be calibrated manually before the measurement is undertaken. The calibration parameters also need to be kept unchanged throughout the actual application.
Binocular stereo wave measurement technology is a promising field, nevertheless there are still some problems that need to be solved in order to fully enable this technology for future engineering application [33]. These include the system’s motion compensation and applicability to complex lighting conditions (rainy and foggy days). The pre-calibration part can form a standard library for the internal and external parameters of the camera, which can be called directly in the practical application, so as to adapt to different measurement distances. Under complex lighting conditions, the illumination adaptability of the algorithm needs to be further studied. The relationship between the illumination intensity and the best aperture and focal lengths can be trained by deep learning in order to realize all-weather automatic focusing [34]. The system needs to consider the motion compensation algorithm and hardware for the motion of the platform. Taking a ship as an example, rolling and surge will not affect the measurement accuracy of the system and the heave direction needs to be compensated for by the integration of the results of the acceleration measurement, such as rolling and pitch. For yaw, a three degree of freedom motion compensation platform needs to be developed for the hardware’s compensation. Furthermore, with the development of ship and marine intelligent chemical engineering, marine measurement technology that is based on vision will become more and more important.

5. Conclusions

This paper presents a comprehensive processing algorithm for wave measurement that is based on stereo vision.
(1)
Compared with the conventional siftGPU, based on 6280 × 4210 image processing, the matching time can be controlled below 6 s and the number of matching points can be kept above 20,000, indicating much better performance than that of the traditional siftGPU algorithm.
(2)
In this paper, the least squares method and wave theory have been used to normalize the sea surface base plane calibration, plane error point fitting and wave parameter inversion. This design method is simple and feasible. Compared with RBR wave height measurement, the wave height range is 0.2 m–1 m, the measurement error is less than 10%, and the periodic measurement error is less than 0.5 s.
(3)
In this paper, the Hough transform and least squares method were used to calculate the wave direction value. Because the RBR wave height instrument does not have the function of wave direction measurement, compared with the original wave image, the detection results and original direction are basically the same.

Author Contributions

Conceptualization, H.S.; methodology, H.S.; software, W.C.; validation, Q.Z.; formal analysis, X.W.; investigation, G.W.; resources, P.Z.; data curation, T.Z.; writing—original draft preparation, H.S.; writing—review and editing, H.S.; visualization, G.W.; supervision, T.Z.; project administration, X.W. All authors have read and agreed to the published version of the manuscript.

Funding

This research was funded by the Key Special Project for Introduced Talents Team of Southern Marine Science and Engineering Guangdong Laboratory (Guangzhou), grant number GML2019ZD-0502, and the High Tech Ship Scientific Research Project of the Ministry of Industry and Information Technology, grant number [2019]357.

Institutional Review Board Statement

Not applicable.

Informed Consent Statement

Not applicable.

Data Availability Statement

The data that were used to support the findings of this study are included within the article.

Acknowledgments

The authors would like to thank the authors of SiftGPU and SIFT for making their algorithms available as open-sources, this was really helpful to the research that is described in this paper.

Conflicts of Interest

The authors declare no conflict of interest.

References

  1. Lin, Z.X.; Adcock, A.A.T.; McAllister Mark, L. Estimating ocean wave directional spreading using wave following buoys: A comparison of experimental buoy and gauge data. J. Ocean Eng. Mar. Energy 2022, 8, 93–97. [Google Scholar] [CrossRef]
  2. Christoph, J.; Berkenbrink, C.; Stumpe, B. Prediction and reconstruction of ocean wave heights based on bathymetric data using LSTM neural networks. Ocean Eng. 2021, 232, 109046. [Google Scholar]
  3. Makar, A. Determination of the Minimum Safe Distance between a USV and a Hydro-Engineering Structure in a Restricted Water Region Sounding. Energies 2022, 15, 2441. [Google Scholar] [CrossRef]
  4. Specht, C.; Lewicka, O.; Specht, M.; Dąbrowski, P.; Burdziakowski, P. Methodology for Carrying out Measurements of the Tombolo Geomorphic Landform Using Unmanned Aerial and Surface Vehicles near Sopot Pier, Poland. J. Mar. Sci. Eng. 2020, 8, 384. [Google Scholar] [CrossRef]
  5. Ying, W. Research on three-dimensional observation technology and application of shore based digital photography. Ocean. Univ. China 2015, 58, 239–250. [Google Scholar]
  6. Rossi, G.B.; Cannata, A.; Iengo, A.; Migliaccio, M.; Nardone, G.; Piscopo, V.; Zambianchi, E. Measurement of Sea Waves. Sensors 2022, 22, 78. [Google Scholar] [CrossRef]
  7. Wang, H.; Mouche, A.; Husson, R.; Grouazel, A.; Chapron, B.; Yang, J. Assessment of Ocean Swell Height Observations from Sentinel-1A/B Wave Mode against Buoy In Situ and Modeling Hindcasts. Remote Sens. 2022, 14, 862. [Google Scholar] [CrossRef]
  8. Bergamasco, F.; Benetazzo, A. Spatially Distributed Sea Wave Measurements. J. Mar. Sci. Eng. 2021, 9, 238. [Google Scholar] [CrossRef]
  9. Sun, X.; Jiang, Y.; Ji, Y.; Fu, W.; Yan, S.; Chen, Q.; Yu, B.; Gan, X. Distance Measurement System Based on Binocular Stereo Vision In IOP Conference Series: Earth and Environmental Science; IOP Publishing: Bristol, UK, 2019; Volume 252, pp. 1500–1504. [Google Scholar]
  10. Xie, H.Z.; Yao, H.X.; Zhou, S.C.; Zhang, S.P.; Tong, X.J.; Sun, W.X. Toward 3D object reconstruction from stereo images. Neurocomputing 2021, 463, 950–955. [Google Scholar] [CrossRef]
  11. Nagano, A. Three-dimensional videography using omnidirectional cameras: An approach inspired by the direct linear transformation method. J. Biomech. 2021, 128, 110722. [Google Scholar] [CrossRef]
  12. De Vries, S.; Hill, D.F.; De Schipper, M.A.; Stive, M.J.F. Remote sensing of surf zone waves using stereo imaging. Coast. Eng. 2011, 58, 239–250. [Google Scholar] [CrossRef]
  13. De Vries, S.; Hill, D.; De Schipper, M.A.; Stive, M.J.F. Using Stereo Photogrammetry to Measure Coastal Wavs. J. Coast. Res. 2009, 58, 1484–1488. [Google Scholar]
  14. Justin, M.W.; Chin, H.W. Automated trinocular stereo imaging system for three-dimensional surface wave measurements. Ocean. Eng. 2005, 33, 255–259. [Google Scholar]
  15. Guillaume, G.; Ludovic, C.; Damien, C.; Laurent, D. Free surface measurement by stereo-refraction. Exp. Fluids Exp. Methods Appl. Fluid Flow 2013, 54, 1900–1904. [Google Scholar]
  16. Cai, Z.H.; Dong, D.J.; Zhou, Y.Y. Research and development of stereo sea state photography technology. Taiwan Cent. Meteorol. Adm. 2010, 36, 101–106. [Google Scholar]
  17. Yu, H. Research and Application of Image Measurement Method for River Regime Width and Surface Velocity of Yellow River Model. Master’s Thesis, Henan University, Henan, China, 2011. [Google Scholar]
  18. Jiang, W.Z. Digital stereo photography wave measurement technology. Ph.D. Thesis, Ocean University of China, Qingdao, China, 2012. [Google Scholar]
  19. Zheng, K.; Jiang, W.Z.; Lu, X.; Wang, S.L. Three dimensional reconstruction of wave surface based on binocular stereo vision. Sci. Technol. Eng. 2021, 21, 735–740. [Google Scholar]
  20. Wei, S. Research on Wave Contour Measurement Based on Binocular Vision. Master’s Thesis, Harbin Engineering University, Harbin, China, 2015. [Google Scholar]
  21. Li, T.; Zhou, M. ECG classification using wavelet packet entropy and random forests. Entropy 2016, 18, 285. [Google Scholar] [CrossRef]
  22. Hagemann, A.; Knorr, M.; Janssen, H.; Stiller, C. Inferring Bias and Uncertainty in Camera Calibration. Int. J. Comput. Vis. 2022, 130, 17–32. [Google Scholar] [CrossRef]
  23. Mei, Z.; Wang, Y.; Li, Q.Y. Research on Moving Target Detection and Tracking Technology in Sports Video Based on SIFT Algorithm. Adv. Multimed. 2022, 2022, 1900–1905. [Google Scholar] [CrossRef]
  24. Zhang, Y.M.; Shu, J.; Hu, L.; Zhou, Q.; Du, Z.R. A Ship Target Tracking Algorithm Based on Deep Learning and Multiple Features. In Twelfth International Conference on Machine Vision (ICMV 2019); SPIE: Washington, WA, USA, 2020; Volume 11433, pp. 19–26. [Google Scholar]
  25. Wang, Y.C.; Yuan, Y.J.; Zhao, L. Fast SIFT Feature Matching Algorithm Based on Geometric Transformation. IEEE Access 2020, 8, 735–740. [Google Scholar] [CrossRef]
  26. Sun, H.Q.; Li, B.G.; Jin, Y.Y. Research on Fingerprint Cipher Based on SIFT Feature Matching Principle. Int. J. High. Educ. Teach. Theory 2021, 2, 16–20. [Google Scholar]
  27. Yang, J.R.; Huang, J.W.; Jiang, Z.Y.; Dong, S.B.; Tang, L.Q.; Liu, Y.P.; Liu, Z.J.; Zhou, L.C. 3D SIFT aided path independent digital volume correlation and its GPU acceleration. Opt. Lasers Eng. 2021, 136, 1177–1180. [Google Scholar] [CrossRef]
  28. Li, J.S.; Yun, P. GPU-based parallel optimization for real-time scale-invariant feature transform in binocular visual registration. Pers. Ubiquitous Comput. 2019, 23, 465–474. [Google Scholar] [CrossRef]
  29. Li, Z.H.; Jia, H.P.; Zhang, Y.Q.; Li, S.G.; Wang, X.; Zhang, H. Efficient parallel optimizations of a high-performance SIFT on GPUs. J. Parallel Distrib. Comput. 2018, 124, 79–91. [Google Scholar] [CrossRef]
  30. Filippo, B.; Alvise, B.; Francesco, B.; Sandro, C.; Mauro, S. Multi-view horizon-driven sea plane estimation for stereo wave imaging on moving vessels. Comput. Geosci. 2016, 95, 127–132. [Google Scholar]
  31. Alexis, M.; James, H.; Jason, F.; John, R.; Frederic, D. Incorporating Wave Spectrum Information in Real-time Free-surface Elevation Forecasting: Real-sea Experiments. IFAC Pap. 2018, 51, 225–230. [Google Scholar]
  32. Zhang, X.X.; Liu, Q.; Liu, J.G.; Zhang, T.; Niz, Y. Binocular Stereo Vision Based Obstacle Detection Method for Manipulator. In Proceedings of the 2016 International Conference on Electrical Engineering and Automation (ICEEA2016), Hangzhou, China, 24–25 April 2016; 439–447. [Google Scholar]
  33. Zhang, J.; Ye, L.; Zhang, Q.; Wang, J.J. Three-Dimensional Object Surface Reconstruction Based on Camera Calibration and SIFT. Appl. Mech. Mater. 2015, 3749, 719–720. [Google Scholar] [CrossRef]
  34. Jansen, E. Deepwater Drilling Milestone Motion Compensation Platform Enables Offshore Drilling from Vessel. Sea Technol. 2020, 61, 1712–1715. [Google Scholar]
Figure 1. Gridding image and identification of corresponding block.
Applsci 12 07447 g001
Figure 2. Schematic diagram of the principle of image matching.
Applsci 12 07447 g002
Figure 3. Illustration: (a) calibration box verification picture 1; (b) calibration box verification picture 2.
Applsci 12 07447 g003
Figure 4. Image 1 matching numbers based on siftGPU.
Applsci 12 07447 g004
Figure 5. Image 1 matching numbers based on gridding siftGPU.
Applsci 12 07447 g005
Figure 6. Image 2 matching numbers based on siftGPU.
Applsci 12 07447 g006
Figure 7. Image 2 matching numbers based on gridding siftGPU.
Applsci 12 07447 g007
Figure 8. Illustration: (a) sea surface base plane calibration image 1; (b) sea surface base plane calibration image 2.
Applsci 12 07447 g008
Figure 9. Illustration: (a) original 3D point images 1; (b) original 3D point images 2.
Applsci 12 07447 g009
Figure 10. Illustration: (a) stereo vision ocean wave observation system; (b) RBR wave height meter.
Applsci 12 07447 g010
Figure 11. Illustration: (a) at 14:00 with stereo vision, variation in coordinate (0, 0) of sea surface displacement with time; (b) at 15:00 with stereo vision, variation in coordinate (0, 0) of sea surface displacement with time; (c) at 16:00 with stereo vision, variation in coordinate (−320, 0) of sea surface displacement with time; (d) at 16:00 with stereo vision, variation in coordinate (0, 0) of sea surface displacement with time; (e) at 14:00 with RBR wave high meter of sea surface displacement with time; (f) at 15:00 with RBR wave high meter of sea surface displacement with time; (g) at 16:00 with RBR wave high meter of sea surface displacement with time.
Applsci 12 07447 g011aApplsci 12 07447 g011b
Figure 12. Illustration: (a) wave direction diagram of the first image frame; (b) wave direction diagram of the second image frame; (c) wave direction diagram of the third image frame; (d) wave direction diagram of the thirteenth image frame.
Applsci 12 07447 g012
Figure 13. Illustration: (a) wave field 3D reconstruction of the first frame image; (b) wave field 3D reconstruction of the second frame image; (c) wave field 3D reconstruction of the third frame image; (d) wave field 3D reconstruction of the fourth frame image.
Applsci 12 07447 g013
Table 1. System calibration parameters.
Code No.Title 2
Left camera internal reference (pixel) 13,868.3 0 2973.9 0 13,860.9 1614.1 0 0 1
Right camera internal reference (pixel) 13,911.8 0 3047.1 0 13,903.6 1691.9 0 0 1
Distortion coefficient of left camera (pixel) 0.11 0.58
Distortion coefficient of right camera (pixel) 0.15 1.18
Common area boundary parameters (pixel) 580 158 5700 3000
Rotation matrix (pixel) 0.9997 0.0254 0.0009 0.0254 0.9996 0.0110 0.0011 0.0110 0.9999
Translation matrix (pixel) 267.56134 1.75769 15.63543
Table 2. Matching time and feature points numbers.
Code No.siftGPUGridding siftGPU
Threshold0.50.5
Image 1 matching time (s)31.76
Image 1 matching no.300324,424
Image 2 matching time (s)29.95.8
Image 2 matching no.299624,321
Table 3. Sea surface base plane calibration feature point coordinates.
Code No.ul (mm)vl (mm)ur (mm)vr (mm)
561462.8691400.559117.2331557.912
523602.8971604.144244.8951763.765
757569.4872124.842181.7692283.181
697758.911509.639404.8891673.864
605676.6142716.894254.762878.093
826956.7532342.16553.652510.346
6871266.1151209.11926.6541386.103
3771207.9981668.579843.9521843.557
6381228.332294.944828.2122470.034
8921526.094886.0023618.3962288.871
6641388.5621534.3271030.8451714.759
5931378.1921638.1991014.2541818.597
7801326.8692057.044940.3752235.672
8061513.9961317.9251168.241501.776
8151471.9252253.0821072.9412435.356
8674628.848346.1254336.211608.107
8724956.7921102.2914623.2321372.855
5534666.9751550.4444307.8681814.572
3394113.9291368.6493762.9981618.408
9274781.3491701.5144414.9011968.805
Table 4. Measurement accuracy verification of the calibration box image 1.
Code No.x (mm)y (mm)z (mm)Calibration Box Width (mm)Error
763.67009483.8519690.56446900.08%
8102.5964349.7061692.48656900.36%
9157.9489−134.73689.95076900.01%
10−127.546750.4248696.53456900.95%
11−127.597745.3457691.43326900.21%
1256.47901491.2691685.96056900.59%
13102.3608353.218695.72446900.83%
14−133.579377.7314691.35776900.20%
1592.31968365.5422690.52686900.08%
16232.3613−295.85688.96576900.15%
17114.8581−181.829690.59556900.09%
2042.98887480.5747692.04366900.30%
21−109.301716.635694.62326900.67%
22119.2851316.8094689.26046900.11%
Table 5. Measurement accuracy verification of calibration box image 2.
Code No.x (mm)y (mm)z (mm)Calibration Box Height (mm)Error
1−164.961424.6891202.8812040.09%
2−101.668237.83861202.78712040.10%
3−206.176433.35361208.53312040.38%
4−155.174375.28881202.44812040.13%
5−102.034231.67291197.77712040.52%
6−250.352385.67091207.96312040.33%
7−155.551376.65411203.01512040.08%
8−133.514398.37011200.57512040.28%
9−183.244358.03531205.23912040.10%
10−229.913410.18611208.47912040.37%
11221.4955801.73971185.75412041.52%
12−194.046434.66761207.88412040.32%
13−233.126391.62231211.30312040.61%
14−171.595490.76351206.24412040.19%
Table 6. Measurement accuracy verification.
TimeParameterRBRStereo VisionError
14:001/3 wave height (m)0.8700.8571.5%
1/10 wave height (m)1.1601.1074.6%
1/100 wave height (m)1.4981.4473.4%
Average wave height (m)0.5560.5520.7%
Wave period (s)6.1676.6150.45
15:001/3 wave height (m)0.9450.9420.3%
1/10 wave height (m)1.2031.2201.4%
1/100 wave height (m)1.4761.5948.0%
Average wave height (m)0.6150.6220.1%
Wave period (s)6.9037.0540.35
16:001/3 wave height (m)1.0331.0290.3%
1/10 wave height (m)1.3091.3001.4%
1/100 wave height (m)1.7041.6398.0%
Average wave height (m)0.6890.7160.1%
Wave period (s)6.4076.7280.32
Table 7. Data comparison for different measured coordinates.
TimeParameterCoordinate (−320, 0)Coordinate (0, 0)Error
14:001/3 wave height (m)0.9420.9390.3%
1/10 wave height (m)1.2201.2181.4%
1/100 wave height (m)1.5941.6028.0%
Average wave height (m)0.6220.6250.1%
Wave period (s)7.0547.2530.35
Table 8. Measurement accuracy verification of wave direction.
TimeParameterRBRStereo VisionError
14:00Wave direction (degrees)1701755
15:00Wave direction (degrees)1711776
16:00Wave direction (degrees)1701722
Publisher’s Note: MDPI stays neutral with regard to jurisdictional claims in published maps and institutional affiliations.

