Article

The Role of a DirectDensity® CT Reconstruction in a Radiotherapy Workflow: A Phantom Study

1
Medical Physics Unit, IRCCS Istituto Romagnolo Per Lo Studio Dei Tumori (IRST) “Dino Amadori”, 47014 Meldola, Italy
2
Postgraduate Specialization School in Medical Physics, Alma Mater Studiorum—University of Bologna, 40127 Bologna, Italy
*
Author to whom correspondence should be addressed.
Appl. Sci. 2022, 12(15), 7845; https://doi.org/10.3390/app12157845
Submission received: 18 July 2022 / Revised: 2 August 2022 / Accepted: 3 August 2022 / Published: 4 August 2022
(This article belongs to the Special Issue Developments of Diagnostic Imaging Applied in Radiotherapy)

Abstract

:

Featured Application

The results of this work may promote the clinical application of the DirectDensity® CT reconstruction algorithm as a basis for radiation therapy dose calculations in different clinical situations (e.g., metal implants artifacts), allowing for a more personalized workflow while ensuring simplicity and solidity.

Abstract

The DirectDensity® CT reconstruction algorithm provides a reconstruction approach independent of the tube voltage, directly reconstructing the CT projection data into CT numbers related to the electron densities of the materials. This work examines the efficacy of DirectDensity® in the treatment planning process with both tissues and metallic materials. CT scans of a Cheese phantom were acquired at 80, 100, 120 and 140 kVp and reconstructed with different algorithms. Calibration curves were built for each kVp and reconstruction technique. To evaluate the flexibility of the DirectDensity® in dose calculations, a prostate cancer treatment plan was simulated on phantom images with and without metal inserts. Moreover, the robustness of the algorithm was tested by simulating a possible error in the selection of the calibration curve. As expected, the calibration curves related to DirectDensity® showed a tube voltage dependence only for densities above 1.82 g/cm3. The maximum percentage differences in dose distributions comparations never exceeded the 3% of tolerance and the 3D gamma analysis always returned indices greater than 90%. The results suggest that the DD reconstruction algorithm can be employed in most clinical cases and allows for a personalized radiotherapy cancer treatment workflow, maintaining its robustness and simplicity.

1. Introduction

In radiation therapy, computed tomography (CT) images of the patients are commonly used to both identify anatomical structures of clinical interest (targets and organs at risk, or OAR) and to provide a density map of the patient, through which the dose calculation using treatment planning systems (TPSs) is performed. To derive this density map from the CT scan, it is necessary to implement in the TPS a conversion curve between Hounsfield units (HU) and relative electron density (RED) or mass density (MD) in the form of a calibration curve [1,2]. However, this curve depends on the kVp set during acquisition [3,4]. This is due to the beam energy dependence of the linear attenuation coefficients defining the HUs. Images acquired at different kVp values would therefore need different calibration curves in the TPS [2,5]. However, keeping all of these curves properly controlled and calibrated is a time and energy consuming procedure that can become problematic in an often-demanding clinical routine. Therefore, most clinical centers prefer to acquire CTs for radiation therapy purposes always at a single value or, at most, at two different values of kVp, one of which is dedicated to pediatric acquisitions. Typical values are 80 kVp for pediatric patients (to reduce the improper dose) and 120 kVp in all other cases [6].
This choice allows one to implement a single (or double) calibration curve in the TPS, lightening the workload and reducing the risk factor associated with the right curve selection in the planning phase of the workflow. However, in some clinical cases, it might be convenient to acquire it at different kVp values (e.g., to increase image quality), thus allowing for a better contouring of the region of interest, or to reduce the absorbed dose [7,8,9].
The novel reconstruction algorithm DirectDensity® (DD) (Siemens Healthcare, Erlangen, Germany) allows one to represent the CT scan in CT numbers directly related to the RED of the involved materials [10,11,12]. In contrast to the classical HU, related to the linear attenuation coefficient of the materials, these new units (indicated as HUDD) are independent of the beam energy used during the acquisition as the RED is an energy independent quantity. This allows one to obtain a single linear relationship between the CT numbers and material density, not influenced by the tube voltage value. Therefore, it is possible to implement a single calibration curve in the TPS, while keeping all the advantages of acquiring one at different kVp. Thus, the application of the DirectDensity® algorithm in the clinical practice may help make the radiotherapy workflow more robust, simple, and personalized.
This work evaluates the applicability of the DirectDensity® algorithm in the treatment planning workflow in both the standard conditions and in the presence of high-density materials such as metal implants.
The validity of the algorithm in standard conditions was investigated by comparing the calibration curves at different kVp, built from CT images of a phantom including materials in a density range characteristic of the human body.
Consequences of introducing metallic materials in the phantom are explored to evaluate the applicability of DirectDensity® in clinical cases involving patients with metal implants. In particular, the dependence of calibration curves on kVp at such high densities was investigated and dose distributions calculated on CT scans of the phantom acquired with metal inserts were compared to the ones calculated on the CT scan of the same phantom without them, the latter having the same metal inserts densities, but only as an overwrite representing the ground truth.
Finally, a combination of the DD algorithm with a metal reduction algorithm, the iterative metal artifact reduction (iMAR, Siemens Healthcare—Erlangen, Germany) [13,14], was tested on both the calibration curves and dose distributions.

2. Materials and Methods

2.1. DirectDensity® Reconstruction Algorithm

The DirectDensity® reconstruction algorithm provides the CT images represented, in each voxel, with CT values directly related to the RED of the reconstructed materials in the correspondent physical voxel. To better understand the advantages and limitations of this algorithm, a brief introduction of its working principles is given in Appendix A, whereas a detailed description can be found in work by Ritter [10] and in the supplementary data in Van der Heyden [11].
Basically, the algorithm operates both on the image and the projection space and is based on the complete decomposition of a single-energy CT image into two main materials, water and a mixture of water and a bone-equivalent material, to which all the other materials are attributed. This, combined with a specific attenuation model, allows one to express the image in HU-like units that are related to the RED of the voxel materials as described in Equation (A2) of Appendix A.

2.2. Calibration Curve Building

To convert the CT numbers of the CT scan into a density map of the reconstructed region, a relationship between the CT numbers and density (electron density or mass density) is needed. Since each reconstruction algorithm has its own mechanism to represent images in CT numbers, in addition to being typically kVp-dependent, calibration curves are also algorithm-dependent.
To build the DD calibration curves and verify their behavior when varying kVp, CT images of the Cheese Phantom Mod. 467 Gammex (Gammex, Giessen-Allendorf, Germany) were acquired at 80, 100, 120, and 140 kVp using the SOMATOM go.Open Pro CT scanner (Siemens Healthcare, Erlangen, Germany), which is currently dedicated to radiotherapy simulation scans at our institute (Istituto per lo Studio dei Tumori Dino Amadori, IRCCS IRST—Meldola, Italy). The Cheese phantom contained inserts with certificated densities ranging from 0.30 g/cm3 (LN-300 lung) to 1.82 g/cm3 (cortical bone), miming human tissues. Table 1 shows the materials used, with their corresponding densities. Acquisitions were carried out using a slice thickness of 3 mm, pitch = 1, to follow the current clinical procedure, adjusting the value of mAs to keep constant noise levels. Raw data were reconstructed with DirectDensity® (DD in this work, but indicated as Sd40 in the SOMATOM workstation) and a standard convolution kernel (Qr40). Cylindrical regions of interest (ROIs) of volume about 3 cm3 were drawn in the middle of each insert (with a total volume approximately 45.5 cm3 each) and the mean HU was extracted using MIM Maestro® v. 7.1.4 (MIM Software Inc., Cleveland, OH, USA [15,16]). The calibration curves for each kVp and reconstruction technique were built using the nominal density of each insert and the corresponding HU mean value.
The acquisition and reconstruction processes were repeated with a titanium (mass density of 4.51 g/cm3) and a stainless-steel (mass density of 8 g/cm3) insert to study the dependency of the calibration curves on kVp at densities exceeding the range of human tissues (Table 1). In these cases, the images were also reconstructed with a combination between the DD algorithm and the iMAR algorithm (indicated as DD + iMAR), giving an additional set of calibration curves. Metallic regions were contoured according to the manufacturer’s specifications with ROIs of about 13.5 cm3.
The mean calibration curves were obtained averaging the mean HU (or HUDD) value in each type of non-metallic ROI over the acquisitions without metal inserts, with the titanium insert and with the stainless-steel insert. These curves were extended at high density, adding the points associated with the metal ROIs.

2.3. Metal Artifact Influence on Non-Metal ROIs

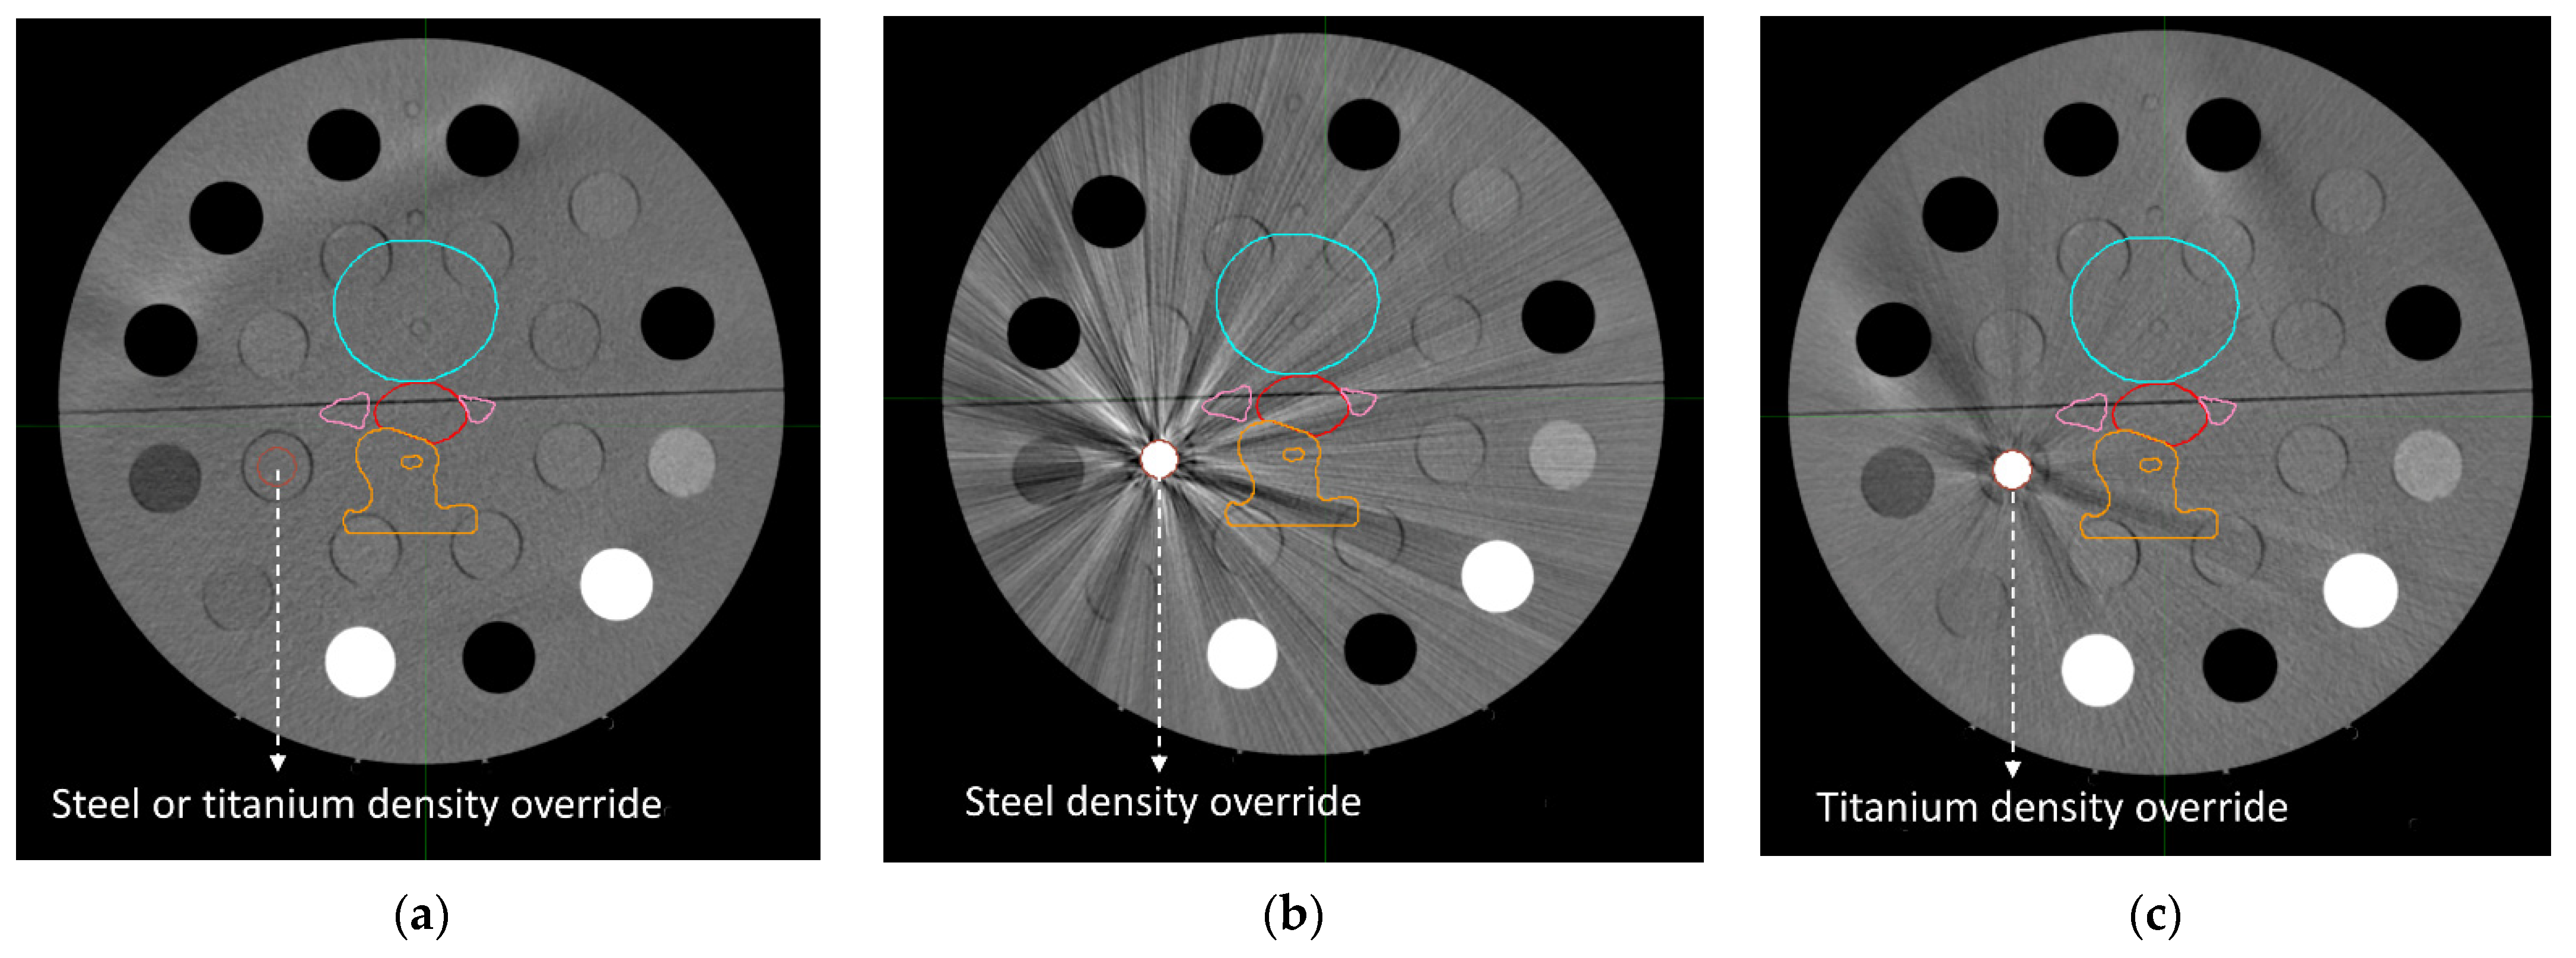
The introduction of metallic materials in the Cheese phantom induces a well-known effect of metal artifacts [17,18], as can be observed in Figure 1. These distortions have an impact on the image quality and can alter or entirely cover areas of clinical interest [19]. Differences in the mean HU (or mean HUDD) were calculated for each non-metallic ROI between the pairs of images acquired at the same kVp value and reconstructed with the same algorithm, but one with and one without metal inserts in the phantom, to investigate the effect of such artifacts on image regions associated with non-metallic materials. For images reconstructed with the DD + iMAR algorithm, differences were evaluated with the images acquired without metal inserts at the correspondent kVp value, but reconstructed with the DD convolution kernel only.

2.4. Dose Distributions

To evaluate the effect of introducing metallic materials on the dose calculations, a prostate treatment in a patient with a hip prosthesis was simulated. When high-density materials are present, in most cases, our treatment planning procedure entails a density override in the CT scan regions corresponding to the materials. This approach allows for an accurate calculation to be performed because the material density is evaluated from the prosthesis technical specifications sheet. Furthermore, some TPSs (such as Pinnacle) are limited to a maximum value of HU, beyond which they saturate and are no longer able to associate the correct densities to the voxels involved, even if the implemented calibration curve includes higher values.
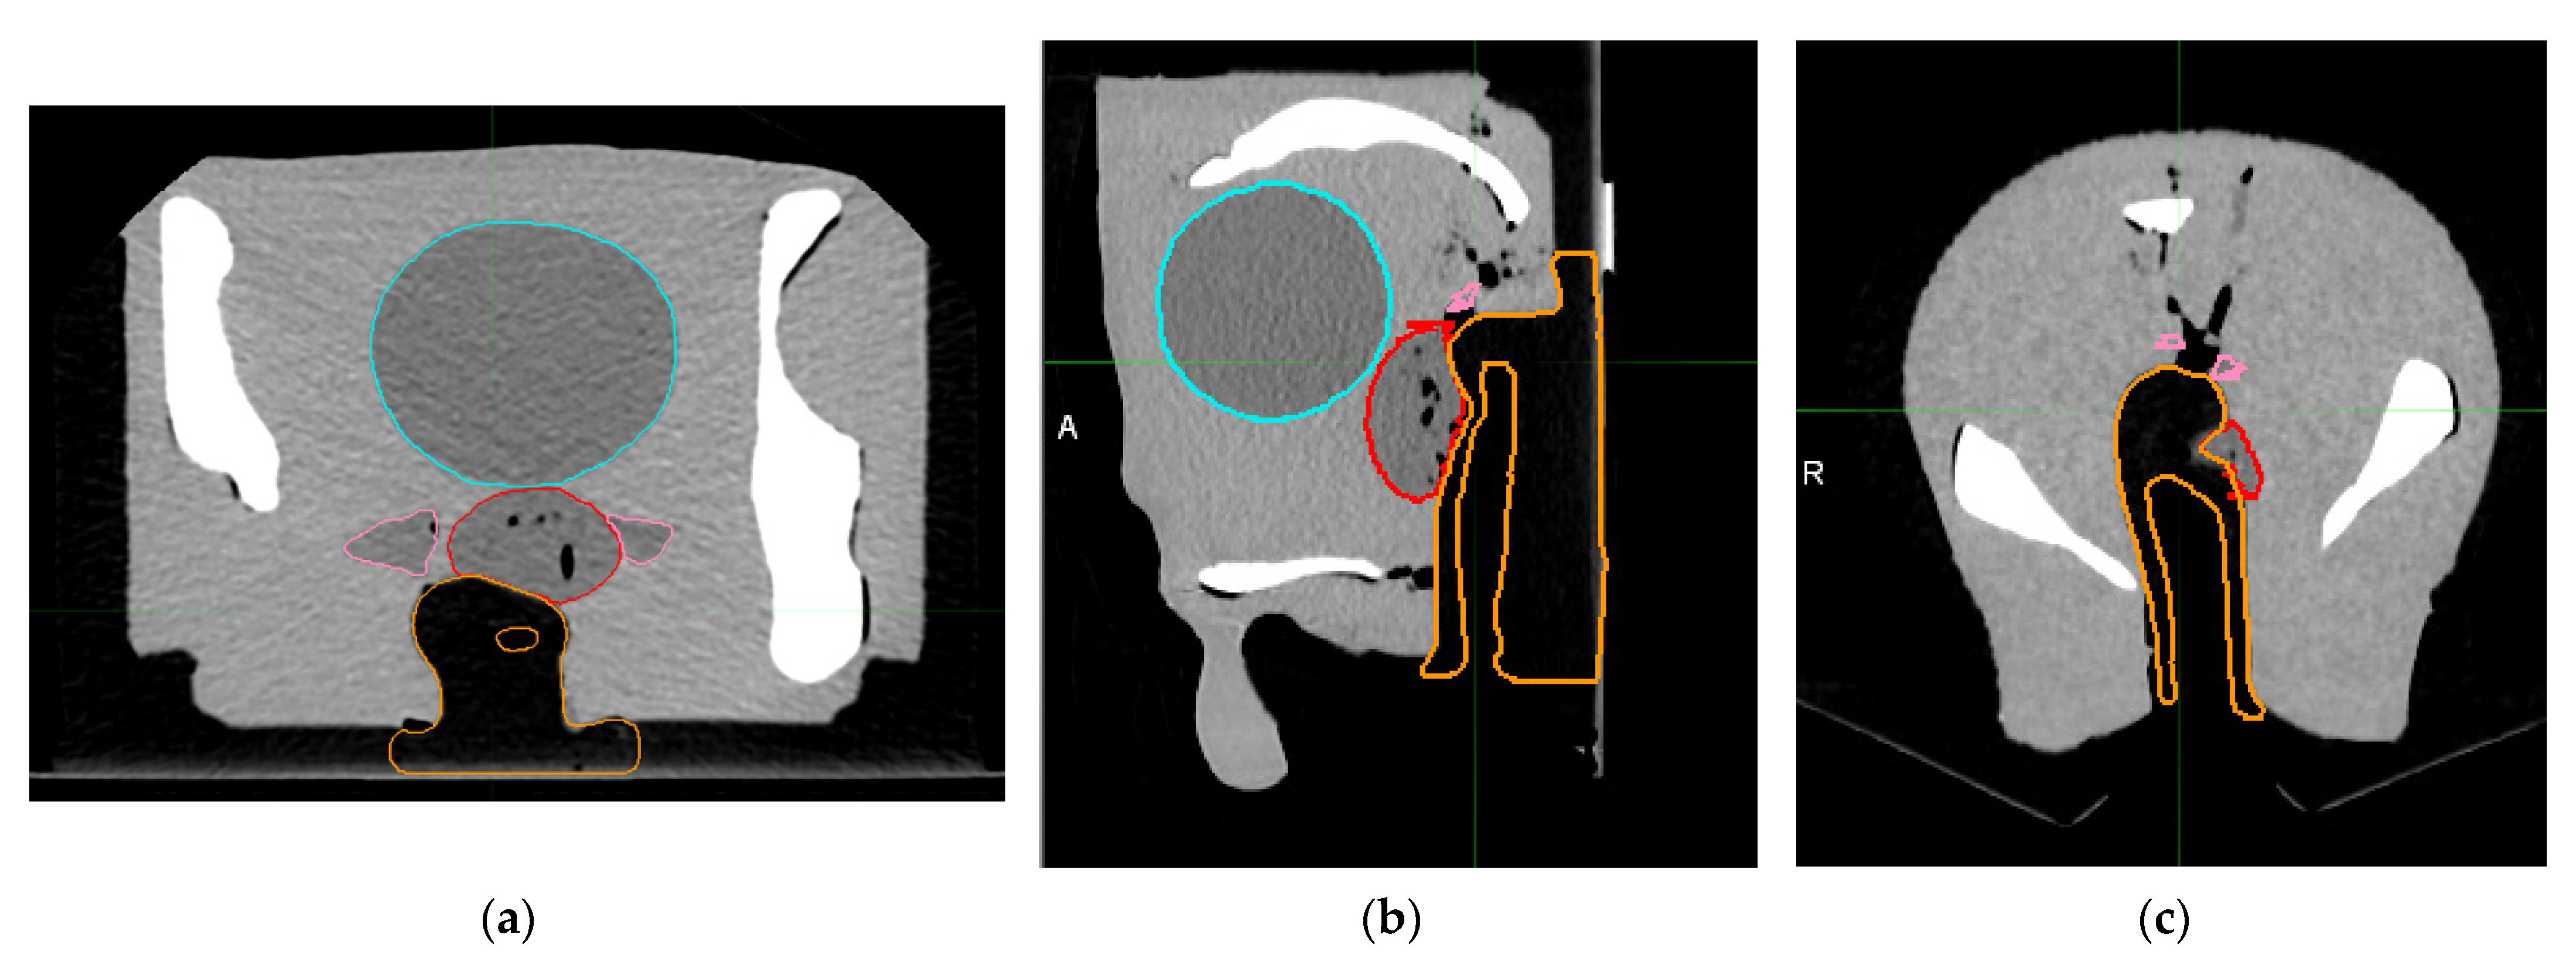
The targets (i.e., prostate and seminal vescicles) and organs at risk (i.e., rectum and bladder) were contoured on the CT of the Multi-Modality Male Pelvic Phantom (Mod. 048A—CIRS, Norfolk, VA, USA), an anthropomorphic phantom dedicated to the simulation of this anatomical region (Figure 2). These structures were transferred onto the CTs of the Cheese phantom acquired at 120 kVp, with and without the metal inserts, and reconstructed using the cited algorithms (Figure 3).
All of the mean calibration curves were implemented in the TPS Pinnacle (Philips Radiation Oncology Systems, Fitchburg, WI, USA) used for dose calculations. The CT acquired without metal inserts at 120 kVp and reconstructed with the Qr40 convolution kernel was selected as the reference.
We defined the titanium reference phantom (TRP) as the reference CT with a density override simulating the presence of a titanium insert in the same way the steel reference phantom (SRP) was defined as the reference CT with a steel density override. Both the overrides were performed in the metallic ROI of the image (brown ROI in Figure 3a).
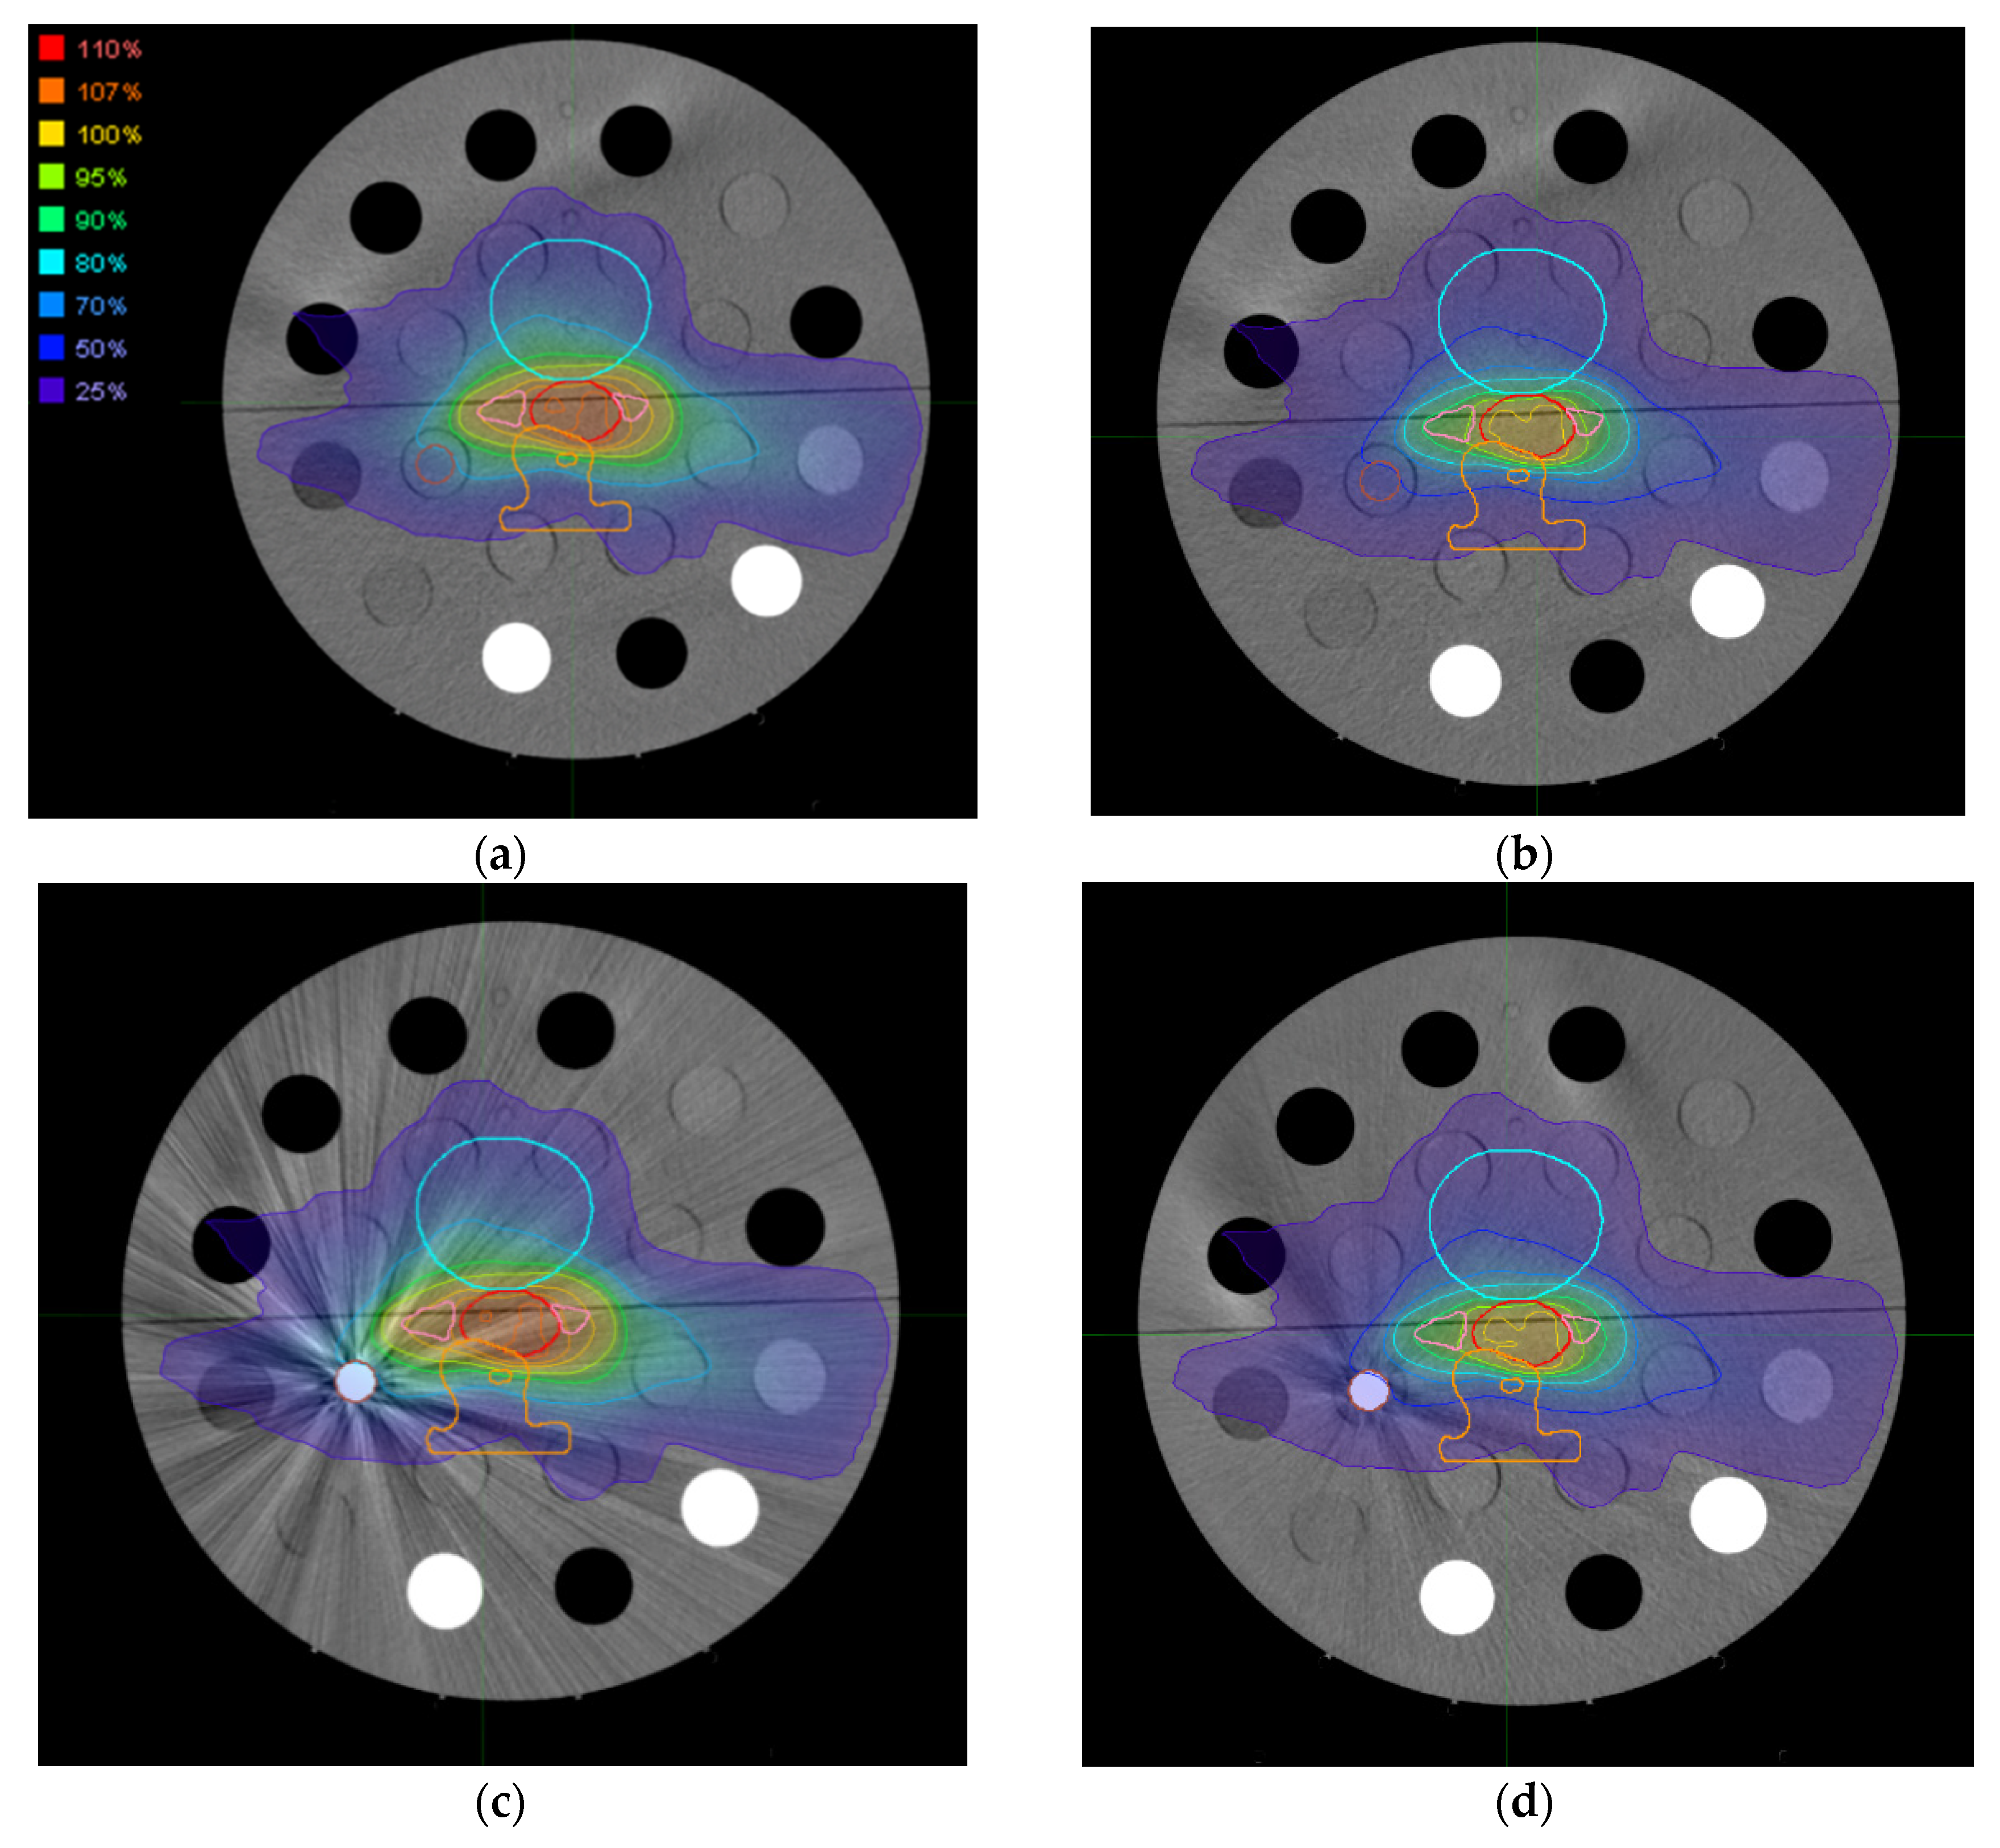
In these images, a volumetric modulated arc therapy (VMAT) treatment plan was optimized and calculated with the 6 MV Elekta Synergy® (Elekta Oncology Systems, Crawley, UK) linear accelerator model in the TPS Pinnacle, setting the dose grid at 0.25 cm, the prostate dose at 70 Gy, and the dose to the seminal vescicles at 63 Gy, both in 28 fractions. Thus, two reference dose distributions were obtained (Figure 4a,b).
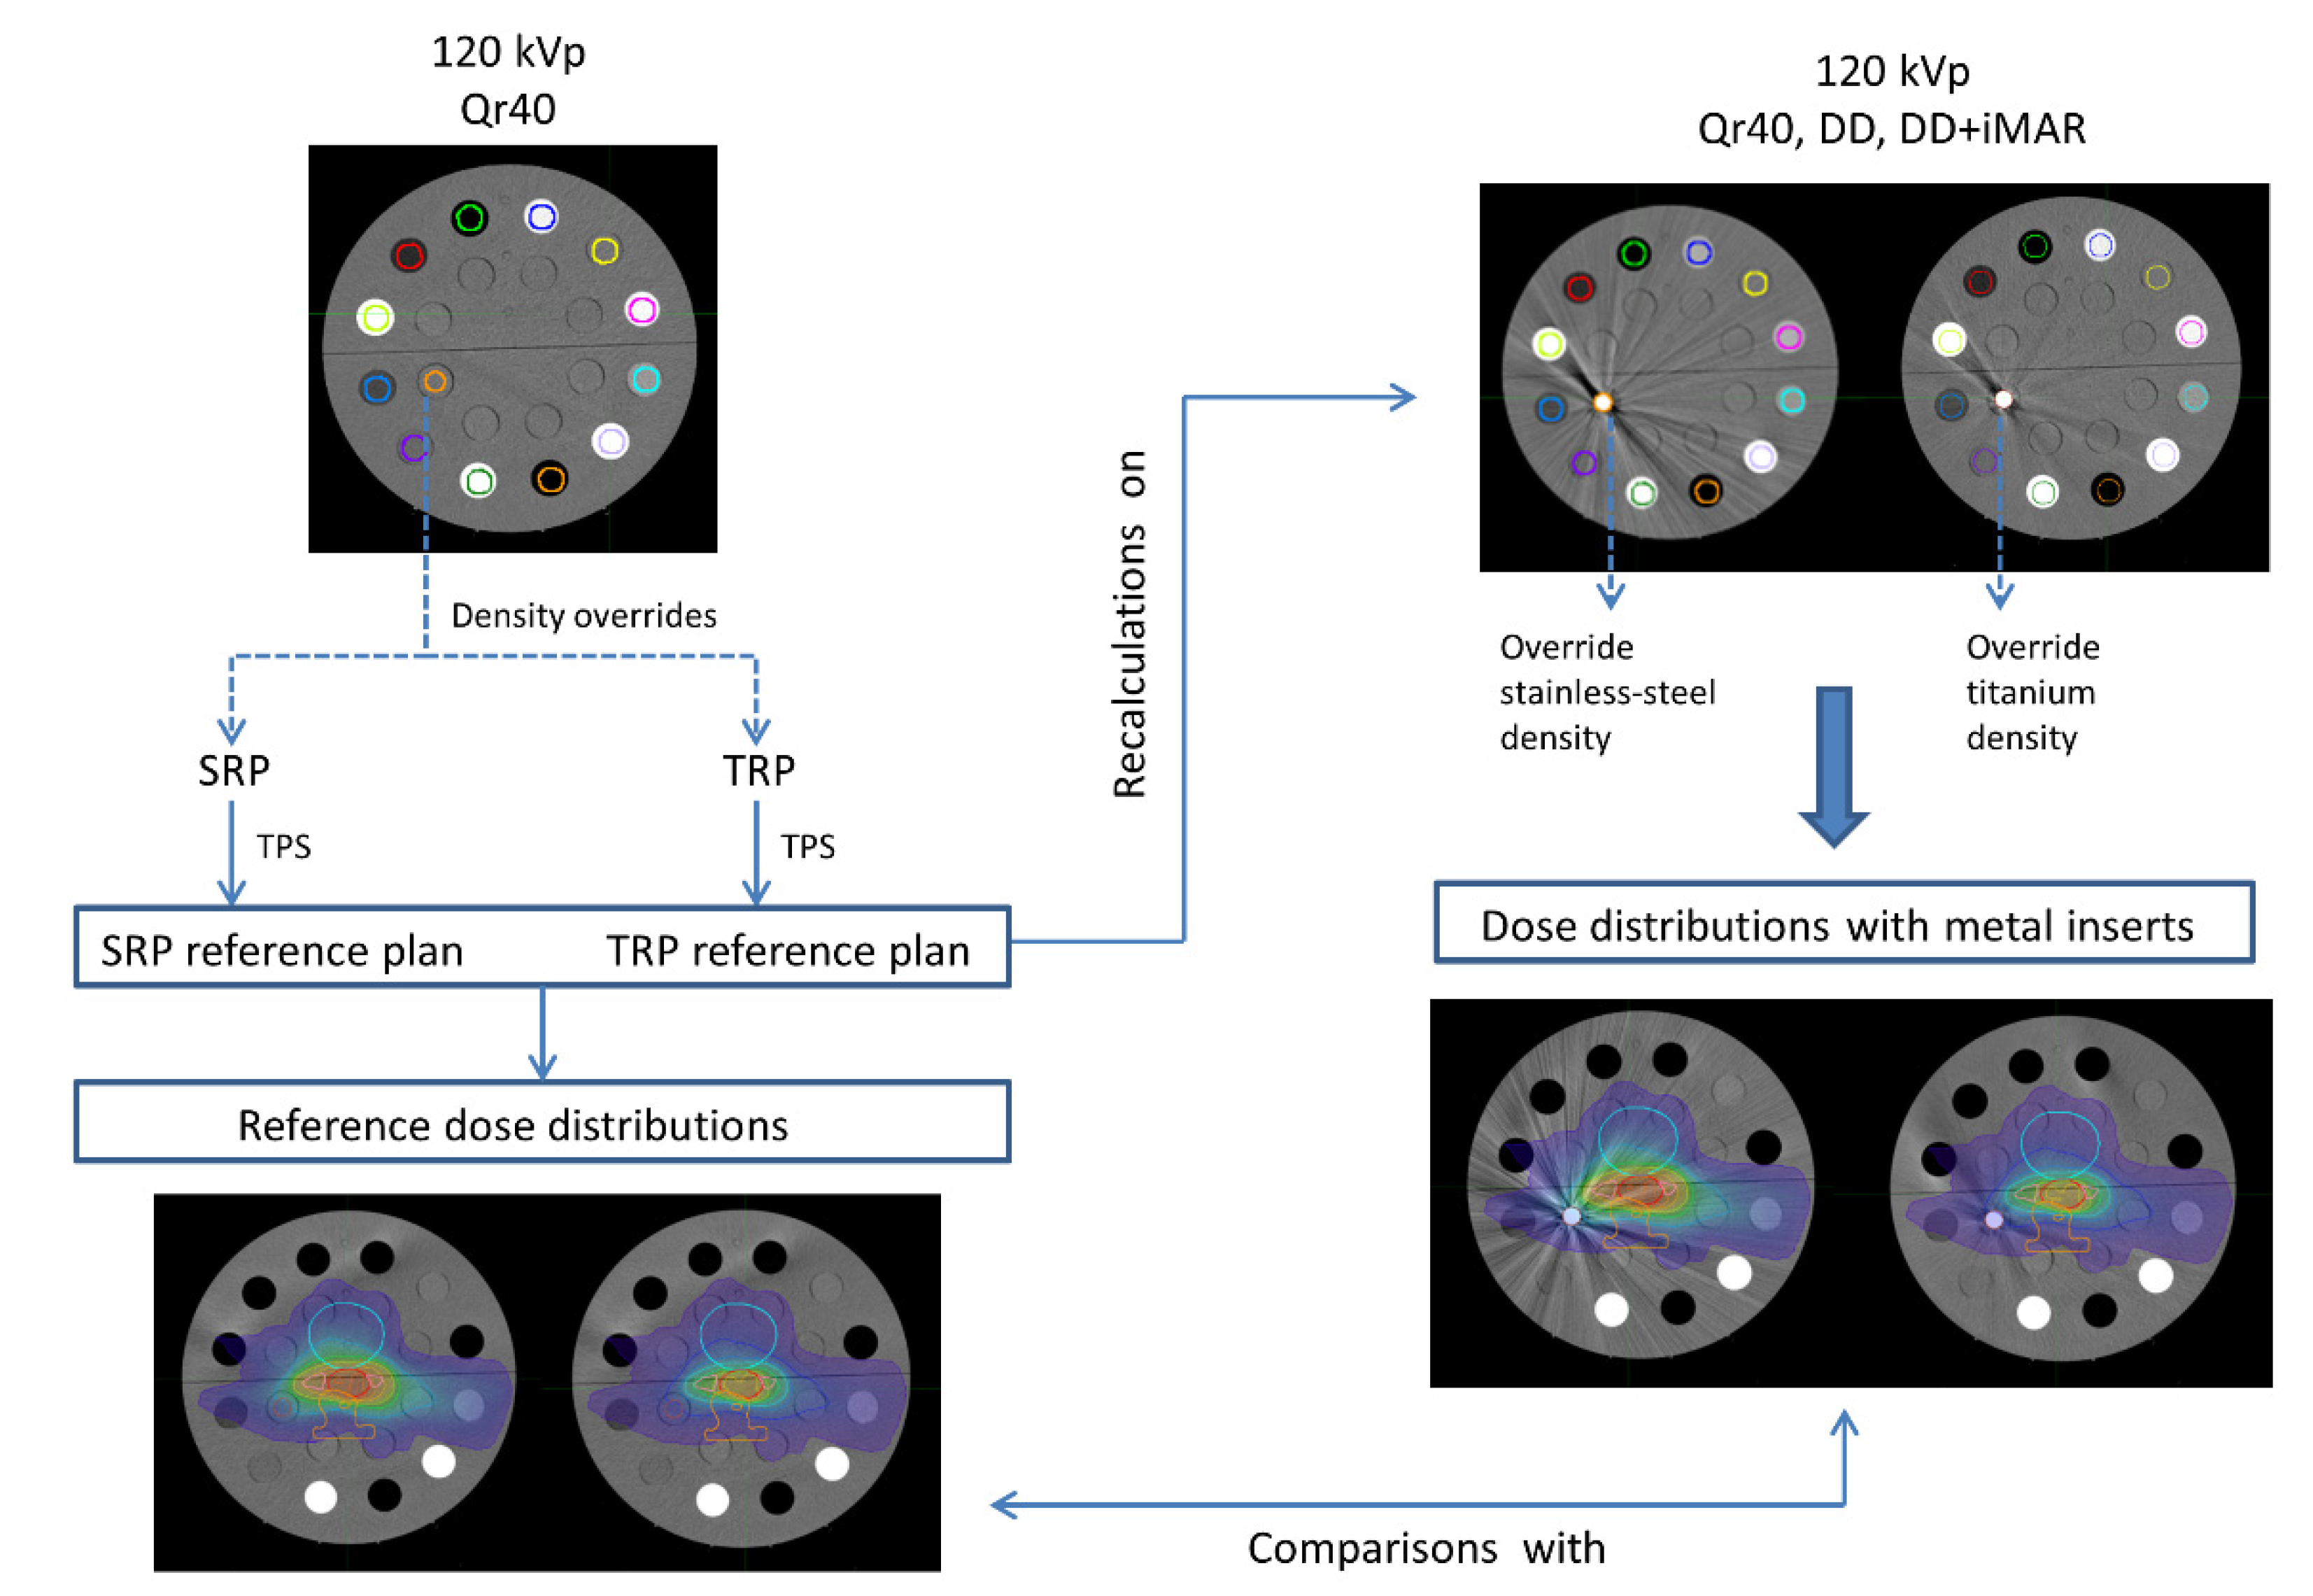
The treatment plan optimized on the TRP was copied and recalculated on the images including the titanium insert acquired at 120 kVp and reconstructed with the Qr40, DD, and the combined DD + iMAR algorithms, selecting the correct calibration curve each time and overriding the density in the metal ROI, keeping the parameters of the treatment fields unchanged. The same procedure, using the corresponding reference plan on SRP, was applied to the images including the stainless-steel insert, acquired at 120 kVp and reconstructed with the algorithms used for TRP. A schematic representation of the dose calculation procedure is shown in Figure 5. The dose distributions were exported from the TPS and compared, performing 3D gamma index analysis with the software VeriSoft (PTW, Freiburg, Germany), commonly used in the clinical workflow to compare a calculated treatment plan with the delivered dose distribution. In this study, the acceptability criteria commonly applied in the clinic were used, that is, a difference of 2% in dose and a spatial difference of 2 mm.
Another comparison between the dose distributions was conducted using the MIM Maestro® tool, which performs dose accumulation calculations. This tool allows for the resulting dose distribution to be spatially visualized on the images as the sum or difference between the analyzed distributions. Dose distributions calculated on the CT scans including the titanium or stainless-steel insert acquired at 120 kVp and reconstructed with the different algorithms were compared with the dose distributions calculated on the corresponding reference phantoms.
In the end, to test the validity of the DD algorithm in dose calculations, the SRP plan was recalculated (changing only the calibration curves and performing the density override) on the images including the steel insert acquired at 100 kVp and 140 kVp, both reconstructed with the DD algorithm. Dose distributions were compared with the MIM Maestro® tool. Moreover, a possible error in the selection of the correct calibration curve was simulated: the SRP plan was recalculated on the image including the steel insert, acquired at 120 kVp and reconstructed with the DD algorithm, but selecting the calibration curve related to the acquisition at 80 kVp with the same reconstruction algorithm. Using the MIM Maestro® tool, the resulting dose distribution was compared to the one calculated on the same image but using the right calibration curve.

3. Results

3.1. Curve Building and Metal Artifact Influence on Non-Metal ROIs

Table 2 shows the mean CT number calculated in each ROI at high and low densities of the Cheese phantom scan for each kVp value and convolution kernel used. Table 3 summarizes the impact of metallic artifacts on non-metallic ROIs, in terms of the differences in the mean HU (or HUDD) between the acquisitions with and without the metal inserts. The maximum absolute difference of 44 HU was found in the cortical bone density ROIs between the images acquired at 100 kVp and reconstructed with the standard convolution kernel (Qr40). However, the corresponding relative percentage difference was only 2%. The maximum relative percentage difference of 4% was found in the LN-300 Lung ROIs between the standard reconstruction (Qr40) of the image acquired at 100 kVp with the stainless-steel insert and the standard reconstruction of the image acquired at 100 kVp without the metal inserts. The corresponding absolute difference was equal to only 12 HU. Following the IAEA criterion of acceptability (±5% or ±20 HU) [20], none of these differences can be considered as significant.

3.2. Mean Calibration Curves

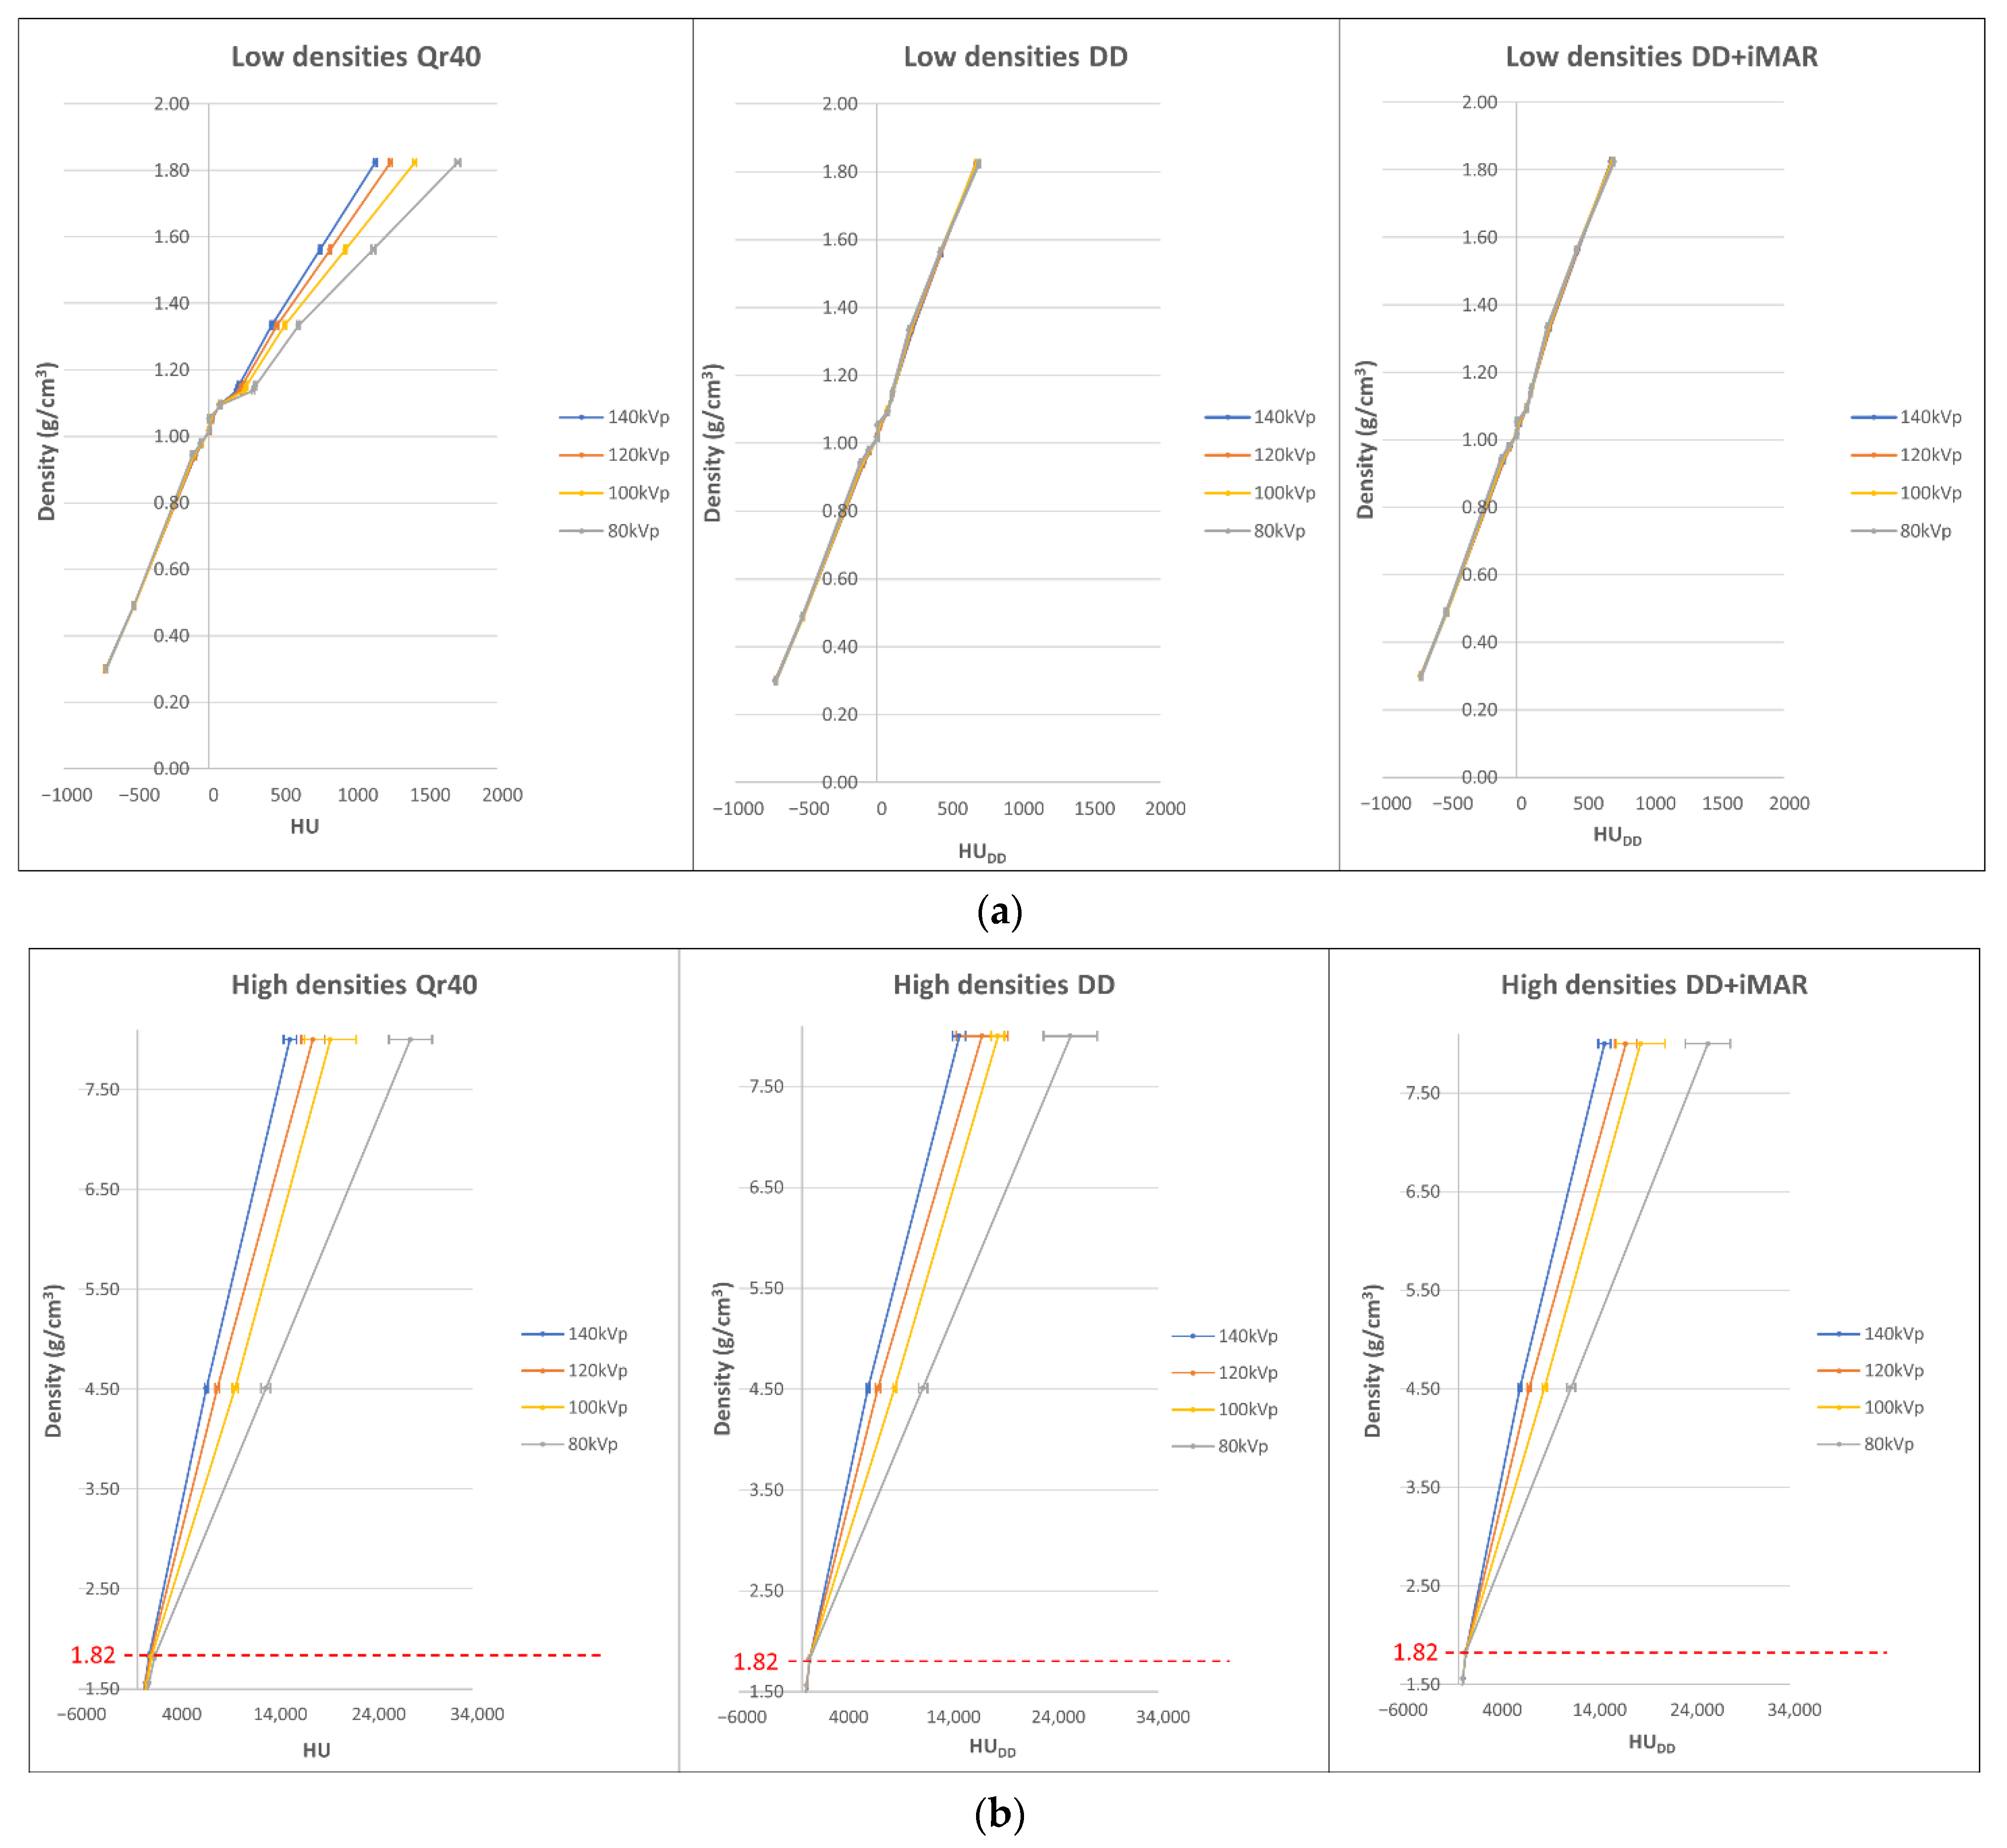
Figure 6 shows the mean calibration curves at low (Figure 6a) and high (Figure 6b) densities. As expected, the curves related to the standard reconstruction algorithm Qr40 had a strong dependence on the kVp value set during the image acquisition, both at low and high densities, as shown in the graphs to the left of Figure 6. In contrast, the mean calibration curves associated with the reconstruction algorithm DD exhibited this dependence only for densities above 1.82 g/cm3, which corresponds to the density of the cortical bone, as shown in the middle graphs in Figure 6. The same behavior could be observed for the calibration curves associated with the combined reconstruction DD + iMAR, as shown in the graphs to the right in Figure 6.
Figure 7 and Table 4 show the absolute differences in the HU or HUDD in terms of the density between the mean calibration curve built at 80 kVp and the one at 140 kVp for each reconstruction algorithm.
Given the curve sets associated with the DD and DD + iMAR algorithms at low densities (second and third column of Table 4), no significant difference in the HUDD was found between the 80 kVp and 140 kVp curves (following the IAEA criteria [20]). In contrast, when considering the set of curves associated with the standard reconstruction (first column of Table 4), significant differences in HU involve the ROIs corresponding to the inner bone, B-200 bone, CB2-30%, CB2-50%, and cortical bone equivalent materials.

3.3. Dose Distributions

Table 5 reports the gamma indices obtained from the comparisons between the dose distributions calculated on the images for all of the acquisition and reconstruction settings. In the first column of Table 5, all of dose distribution comparisons achieved a gamma index of 100%, suggesting that metal artifacts responsible for lowering image quality do not significantly affect the treatment plan quality against SRP and TRP for all reconstruction algorithms.
The first row in Table 5 shows that a gamma index of 100% was returned in the comparison between the dose distribution obtained on the Qr40-reconstructed image containing the stainless-steel/titanium insert and the dose distribution calculated on the SRP/TRP, respectively. This confirms that the current procedure of overriding the metal densities in the metallic regions of the CT images, containing metallic materials, allows dose distributions to be obtained that are not significantly affected by metal artifacts.
In the second, and similarly in the third row, the gamma index does not highlight significant differences between the reconstruction scenarios examined in this study
Comparisons between the dose distributions calculated on the same images or on images with different metal inserts were not performed. For example, dose distribution calculated on the Qr40 image with the titanium insert was not compared with the dose distribution calculated on the DD image containing the stainless-steel insert, or the dose distribution calculated on the SRP phantom. Corresponding results are indicated with the minus symbol in Table 5.
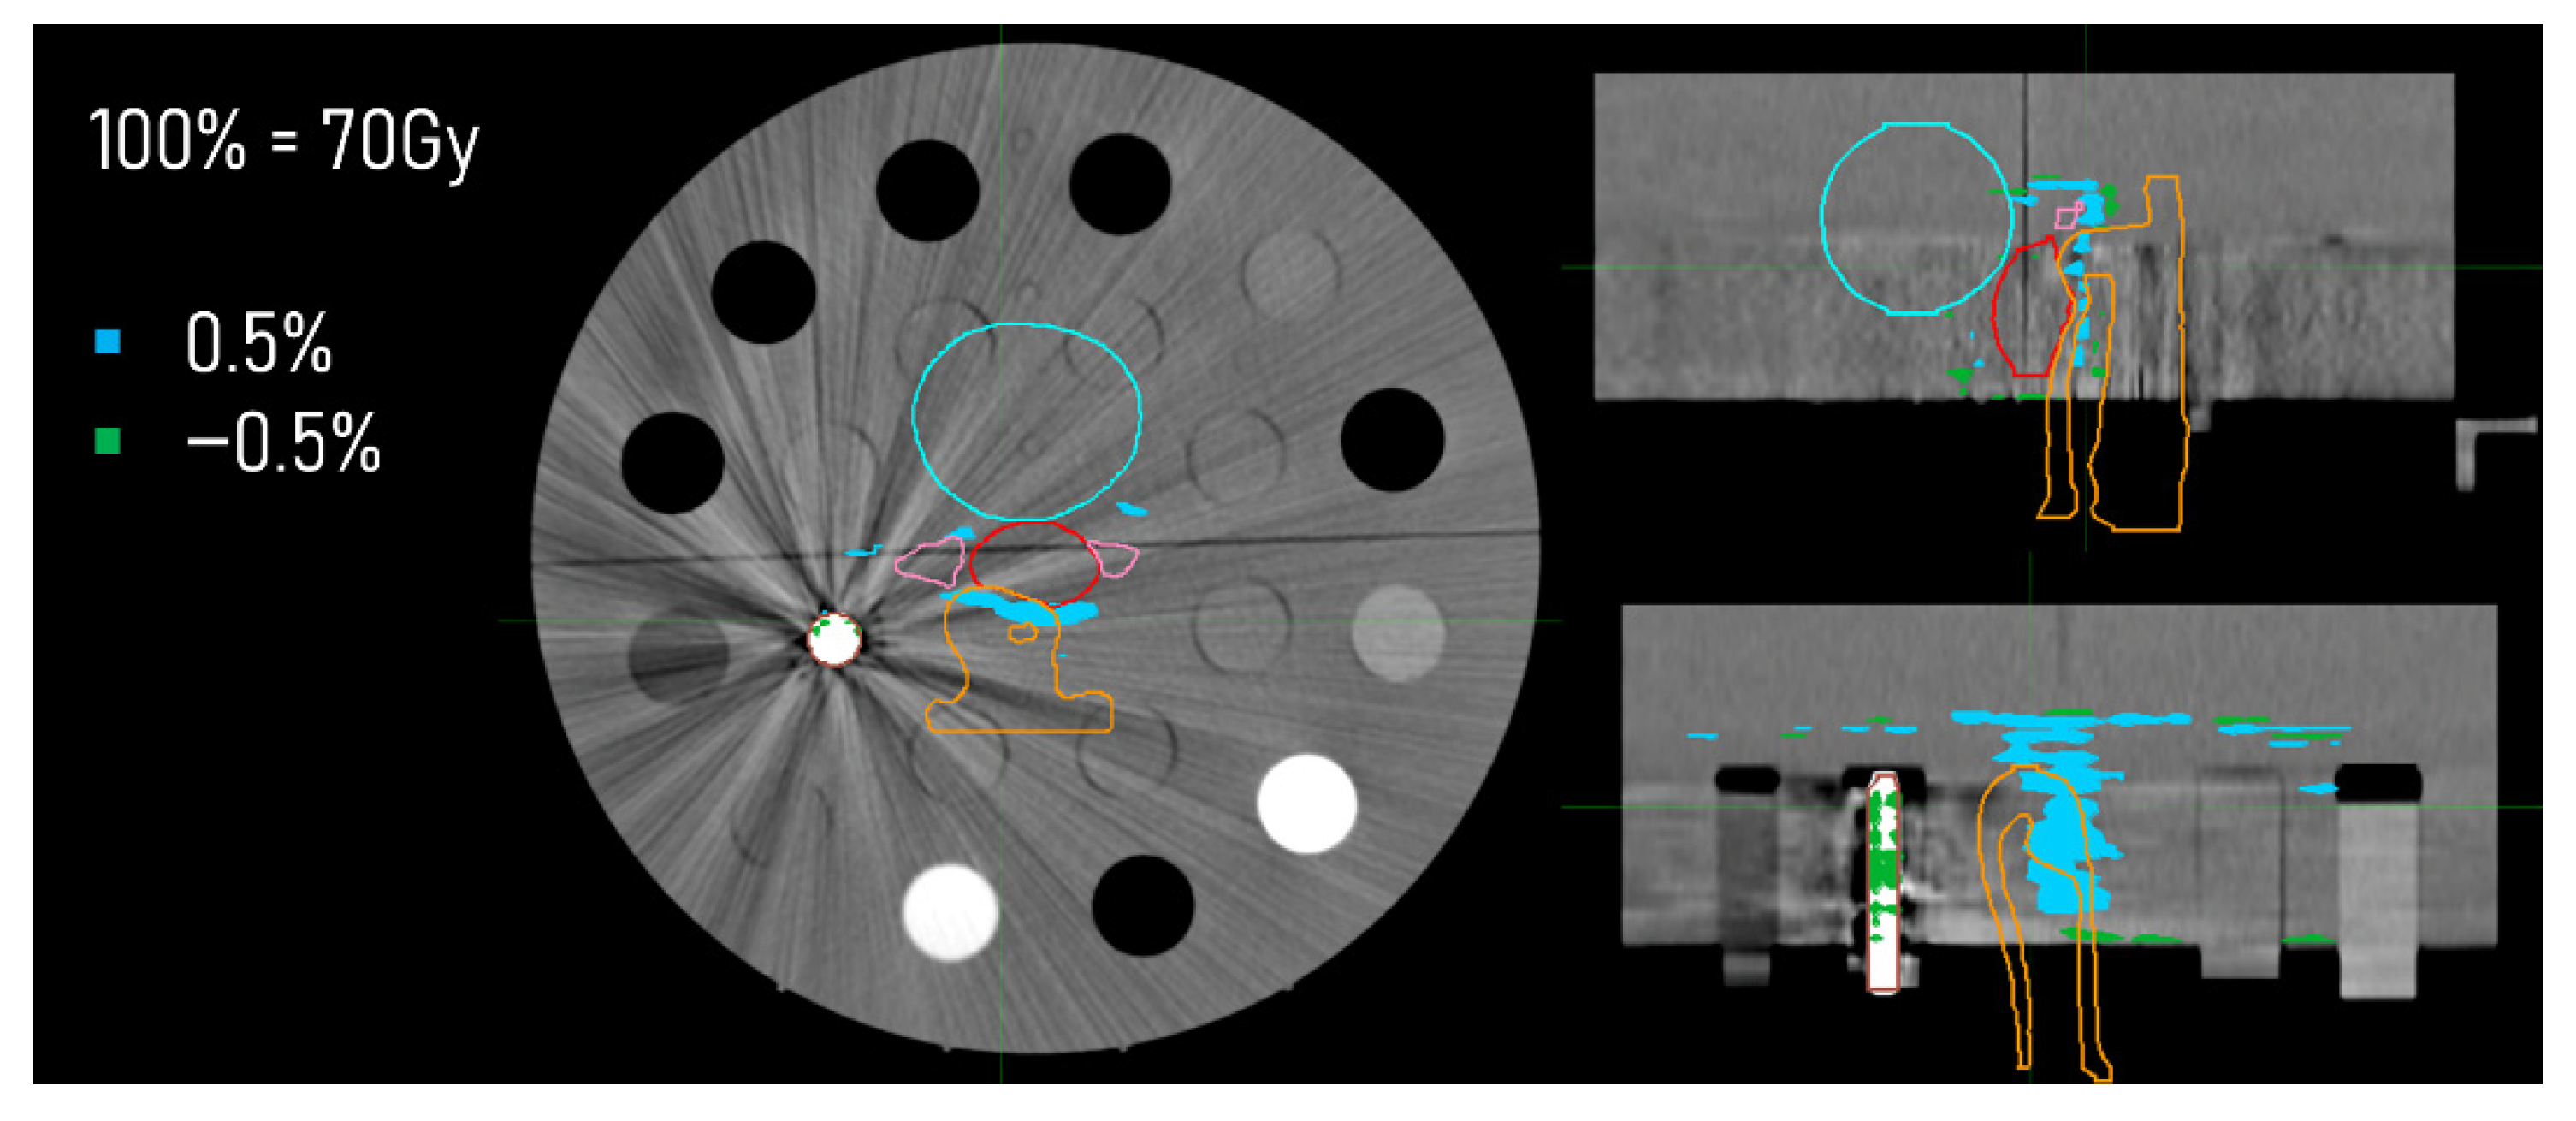
The maximum differences in dose, expressed as a percentage of the prostate dose (70 Gy), listed in Table 6, were derived from the analysis on the dose distributions performed with the MIM Maestro® tool. Figure 8 provides a representative example of these results, showing the spatial distribution of differences in the dose obtained compared to the dose distribution calculated on the SRP and the dose distribution calculated on the CT scan acquired at 120 kVp, with the stainless-steel insert embedded in the Cheese phantom and reconstructed with the DD algorithm.
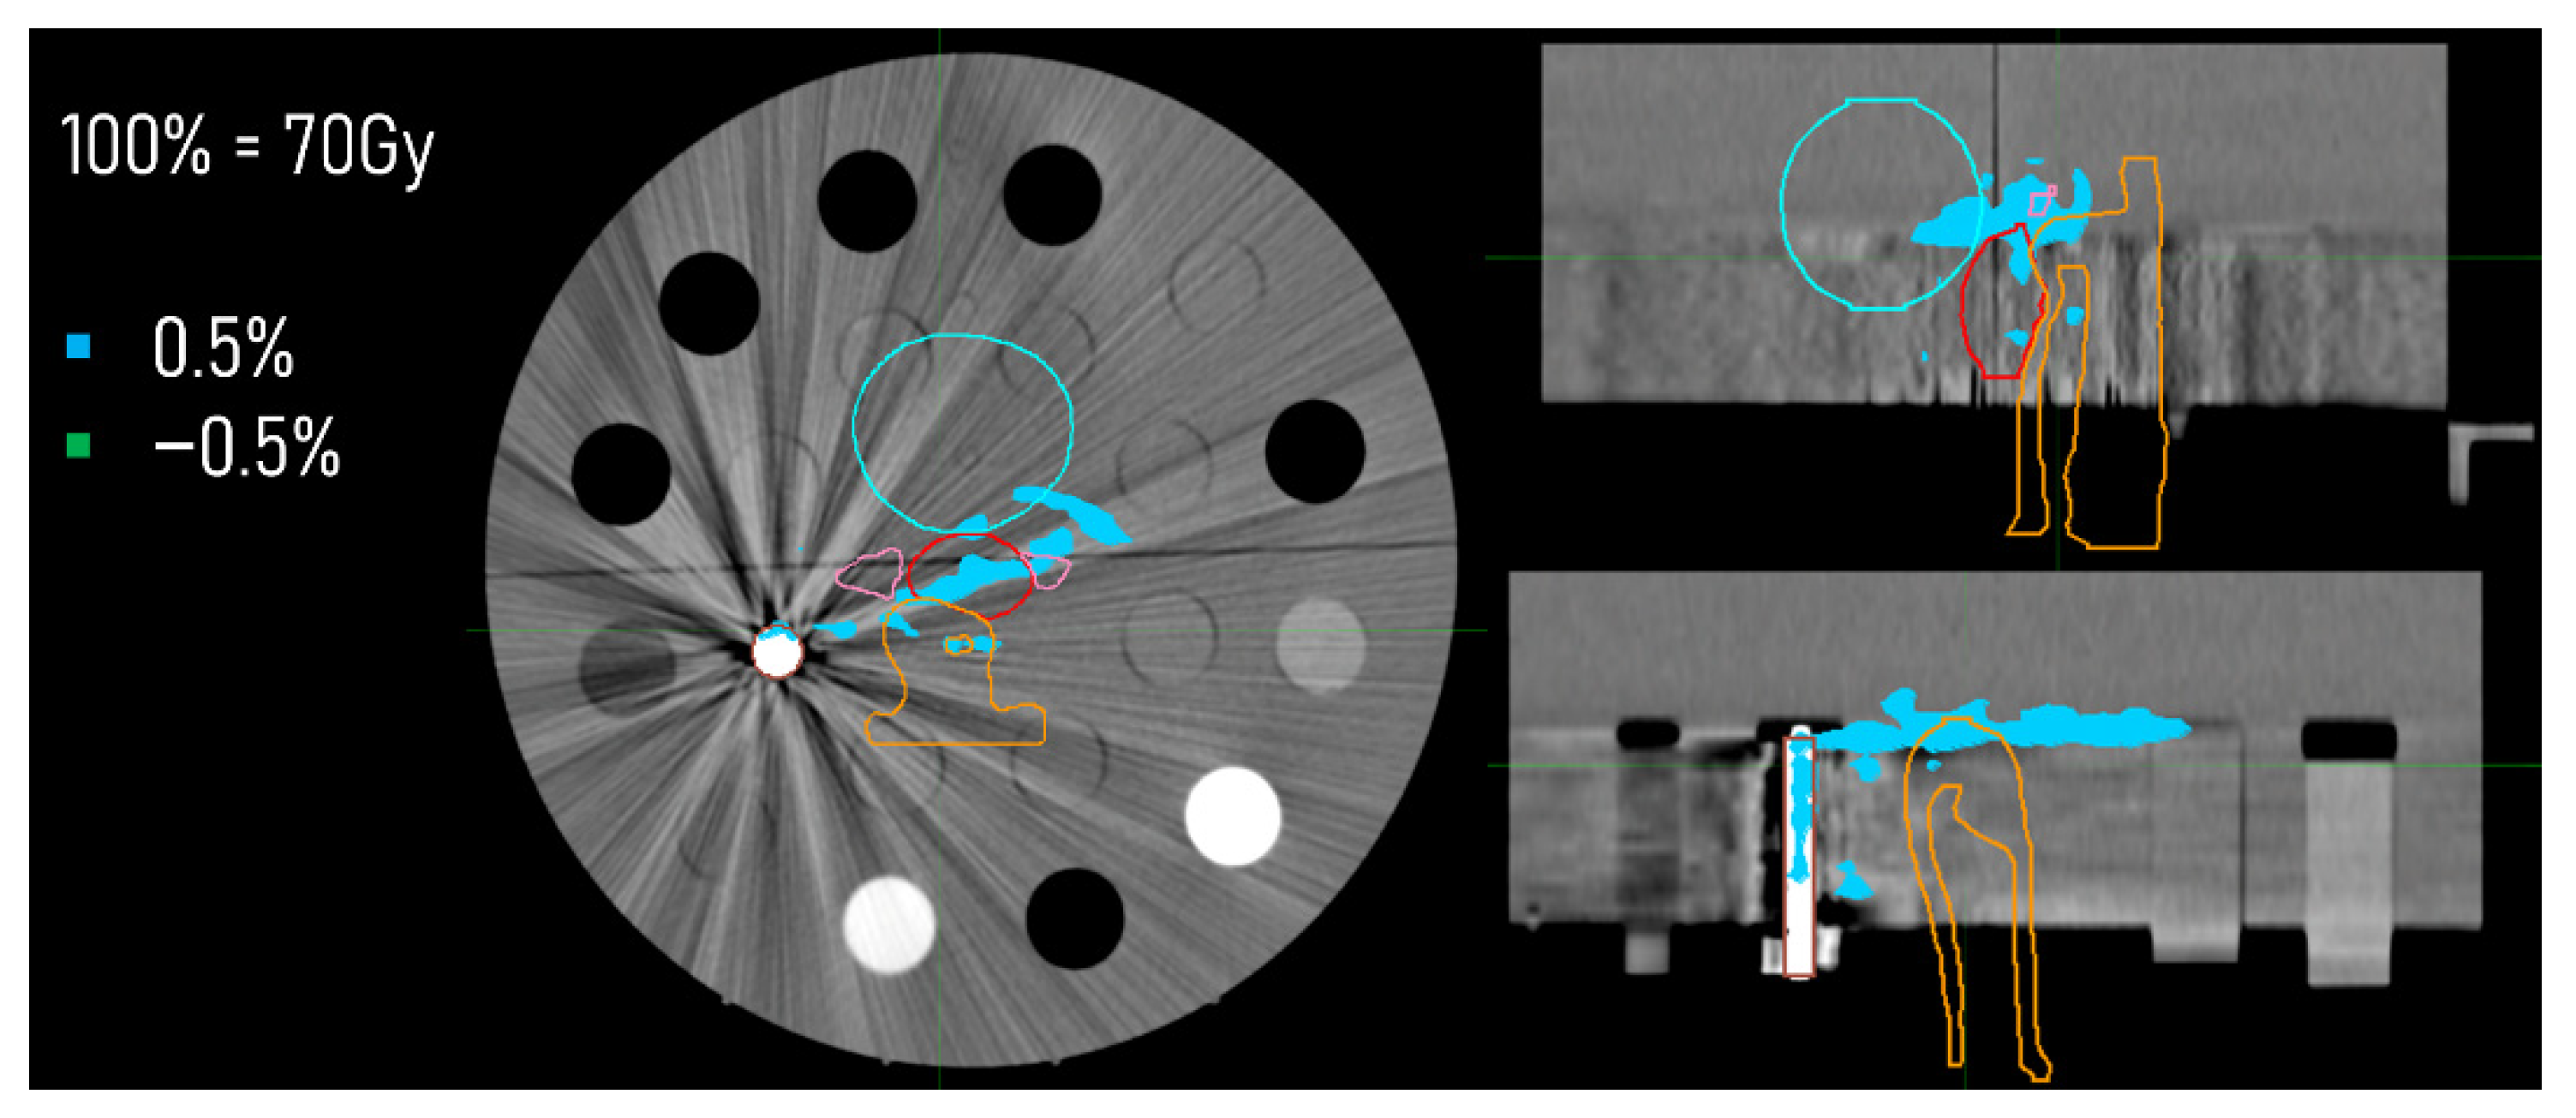
The comparison between the dose distributions calculated on the images acquired with the stainless-steel insert at 100 kVp and 140 kVp, both reconstructed with the DD algorithm, is represented in Figure 9. The main differences between the two distributions did not exceed the 0.5% of the dose to the prostate.
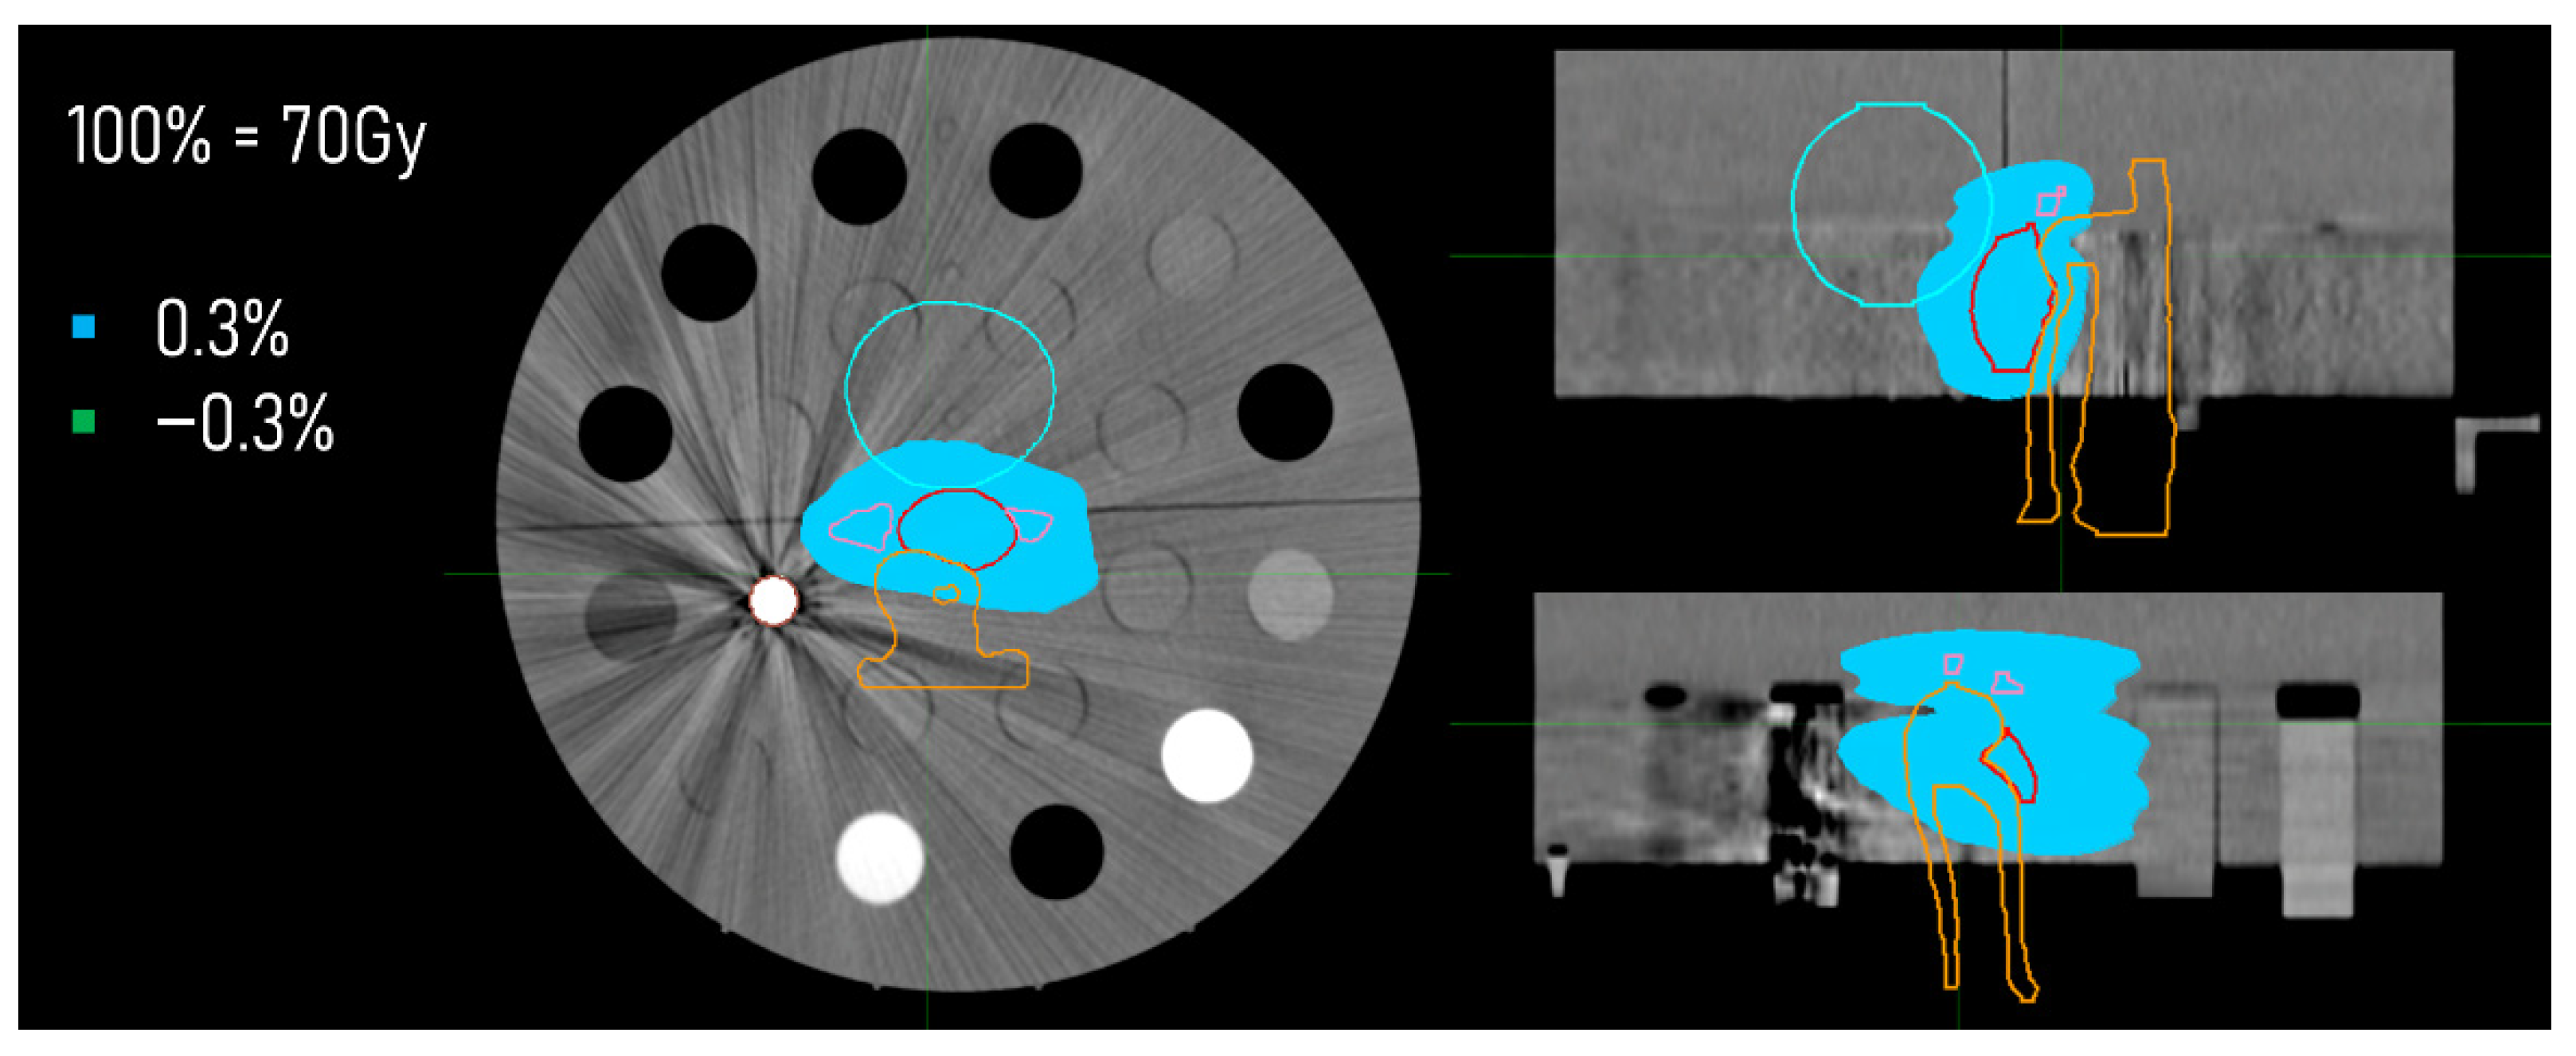
Figure 10 represents the comparison between the dose distribution calculated with the proper calibration curve on the image including the steel insert, acquired at 120 kVp and reconstructed with the DD algorithm and the dose distribution calculated on the same image, but intentionally selecting the calibration curve of 80 kVp. The main differences between the two distributions did not exceed the 0.3% of the dose to the prostate.

4. Discussion

The relationships between the CT numbers and mass densities associated with each reconstruction algorithm and kVp value needed to perform dose calculation with the TPSs were obtained scanning the Gammex phantom with inserts of certified densities including metal inserts (Table 1 and Table 2). The presence of metals induces artifacts on CT images (Figure 3), which could alter regions of interest in a clinical scan. The influence of metal artifacts on non-metallic regions of the Cheese phantom CT scans was investigated for each reconstruction algorithm used. No difference between acquisitions made in the presence or absence of metallic materials could be considered as significant in non-metallic regions, following the IAEA criteria [20] (Table 3). Therefore, the mean calibration curves were obtained by averaging the mean CT values in non-metallic ROIs over all the acquisitions associated with the same kVp value and reconstruction algorithm (Figure 6). This result was confirmed by Flatten et al. [12], who analyzed the influence of metal inserts on the images reconstructed with DD, concluding that the algorithm was not corrupted by the presence of such high densities.
The mean calibration curves associated with the standard algorithm Qr40 represent the well-known trend of standard calibration curves, with a strong dependence on the kVp value set during the CT scan acquisition at both low and high densities (Figure 6). In contrast, curves related to the DD reconstruction algorithm showed this dependence only for high densities (Figure 6b), while at low densities (Figure 6a), the curves at different kVp values agreed with each other. This behavior is in agreement with other studies [11,12,21] and with the company’s statement, which specifies that the algorithm may not be adequate to reconstruct the image with correct HUDD values in the regions of the image corresponding to materials with densities higher than that of the cortical bone (about 1.82 g/cm3) [10]. It is also worth noting that the curves associated with the combined DD-iMAR reconstruction were comparable for each kVp, with the curves associated to the DD reconstruction alone. Therefore, the combination with the iMAR algorithm does not affect the DD mechanism.
Evaluating the difference in HUDD between the 80 kVp and 140 kVp curves, no dependence of DD and DD-iMAR calibration curves on the kVp value could be detectable at low densities (in agreement with Flatten et al., Van der Heyden et al. [11,12], and D’Alessio et al. [21]), while the same analysis on standard calibration curves showed significant differences for the ROIs corresponding to the inner bone, B-200 bone, CB2-30%, CB2-50%, and cortical bone equivalent materials (Table 4). Moreover, it can be noted that this deviation was almost always greater, as expected, in the set of curves associated with the standard reconstruction, compared to the DD and DD-iMAR reconstruction sets, both at low and high densities (Figure 7).
Given the criticality of the DD reconstruction in the presence of metallic materials, a clinical case of a prostate treatment in a patient with a hip prosthesis was simulated to verify the applicability of the algorithm in the radiation therapy workflow in all clinical situations. Reference dose distributions were calculated on reference Cheese phantom scans with the same metal insert densities but without the metal artifacts (SRP and TRP). These distributions were compared to those calculated on CT scans acquired with metal inserts at 120 kVp, using the 3D gamma index analysis and the MIM Maestro® software for graphical comparison. The gamma analysis results indicated that all of the distributions associated with a given metallic material were comparable with the distribution calculated on the corresponding reference phantom, since the gamma index was 100% for each comparison (Table 5). This result was confirmed by the analysis with MIM Maestro®, which showed that all of the maximum percentage differences between the dose distributions were within the 3% (Table 6). Thus, the DD reconstruction was not affected by metal artifacts when we compared the treatment plan global quality in terms of gamma indices, however, there were visible differences (in the order of 0.5–1.6% of the local dose) in the surroundings of the metal inserts. The greatest differences were obtained by comparing the dose distribution in the reference phantom and the ones calculated in the presence of metals and reconstructed with the standard algorithm Qr40. This result may suggest a greater dependence of the standard algorithm in the presence of metal artifacts in the dose calculation, compared to the DD and DD + iMAR algorithms. Thanks to the spatial visualization of the distribution of dose differences, it was possible to identify regions where the differences were most concentrated. In all of the comparisons performed, differences were focused on the regions that were more deteriorated in the images, that is, the regions surrounding the inserted metal insert and the targets as well as along the striations of the metal artifacts (example in Figure 8).
Furthermore, the adequacy of the DD reconstruction for dose calculations was tested by comparing, with MIM Maestro®, the dose distributions calculated on the CT scans of the Cheese phantom with the stainless-steel insert acquired at 100 kVp and 140 kVp, both reconstructed with the DD algorithm. As in the metal ROI, the density override was performed, and possible relevant differences in dose would suggest an inadequacy of the DD reconstruction to be used for dose calculations in the presence of metal implants. The main differences between the two distributions did not exceed the 0.5% of the dose to the prostate and they were concentrated in the same regions as previously described, that is, near the metal insert, along the striations of metal artifacts and near the targets as can be observed in Figure 9. However, these discrepancies did not exceed the tolerance of 3%, thus the distributions were comparable and the algorithm invariance for the change in kVp can also be considered valid for dose calculations. This result matches the results of Flatten et al. [9], who compared the dose distributions calculated on the DD images at different kVp values without metal implants with a reference distribution obtained on standard reconstruction at 120 kVp. Almost all of the evaluated comparisons with the gamma analysis showed a passing rate greater than 99% with the acceptability criteria of 2 mm in space and 2% in dose.
In the end, the robustness of the DD algorithm against a possible error in the selection of the calibration curve was investigated. Thus, the dose distribution calculated on the DD reconstruction at 120 kVp of the Cheese phantom including the stainless-steel insert was compared, using MIM Maestro®, with the dose distribution calculated on the same image but intentionally selecting the wrong calibration curve associated with the DD reconstruction at 80 kVp. The main differences between the two distributions did not exceed the 0.3% of the dose to the prostate and they were located only near the structures simulating the seminal vescicles and the target (Figure 10). As the main difference was within the tolerance, the two distributions were comparable, and the DD reconstruction confirmed its robustness in dose calculation, even in the case of a possible error in the selection of the calibration curve.

5. Conclusions

The DirectDensity® reconstruction algorithm was evaluated, validated, and compared with the standard reconstruction algorithm actually used in the clinical protocol as a possible method that can increase the robustness and simplicity of the clinical radiation therapy workflow. This allows for HU-density calibration curves independent of the tube voltage for densities below 1.82 g/cm3 to be obtained, thus enabling CT acquisition optimization without burdening the workload or increasing the possibility of errors. In the presence of metallic materials, its combination with the iMAR algorithm was also tested and validated, giving no significant differences in the calibration curves, nor in the dose distribution comparisons.
The results of this study confirm the algorithm robustness and validity as a basis for dose calculations for radiation therapy treatments potentially in all clinical situations including patients with metal implants. In fact, comparisons with the standard procedure, in the same setup conditions (e.g., with the same metal insert in the phantom), gave differences in the dose distributions never exceeding the 1.6% of the prescribed dose to the target. Moreover, dose comparisons with the ideal situation excluding metal artifacts in the CT image, and with a biased situation, mimicked an error in the calibration curve selection, showing maximum differences of 0.5% and 0.3% of the prescribed dose, respectively. Its application in the clinical routine could increase the flexibility and the personalization of the whole treatment workflow, while at the same time ensuring its simplicity and robustness.

Author Contributions

Conceptualization, C.G. and E.L.; Data curation, C.G. and E.L.; Formal analysis, E.M.; Investigation, G.F.; Methodology, M.L.B. and E.M.; Project administration, A.S.; Resources, A.S.; Software, V.D.; Supervision, G.F. and A.S.; Validation, M.L.B. and V.D.; Visualization, V.D.; Writing—original draft, G.F. and C.G.; Writing—review & editing, A.S. All authors have read and agreed to the published version of the manuscript.

Funding

This work was partly supported thanks to the contribution of Ricerca Corrente by the Italian Ministry of Health.

Institutional Review Board Statement

The study did not require ethical approval.

Informed Consent Statement

Not applicable.

Data Availability Statement

All the relevant data employed in this study are reported in the present manuscript.

Conflicts of Interest

The authors declare no conflict of interest.

Appendix A

The DD reconstruction algorithm allows a CT with simil-HU to be reconstructed that is directly related to the RED of the materials involved [10,11,12]. The algorithm is based on a specific attenuation model combined with a total decomposition of the CT image into two main materials, water and a mixture of water and a bone-equivalent material, to which all other materials are assigned.
First, a single-energy CT scan must be acquired and this original sinogram (Sμ) is reconstructed via filtered-back projection, giving the input image with CT values (I) expressed in Hounsfield units. In the input image, a specific threshold (IT) is applied to separate the bone contribution (IB) to the total image: voxels with an initial CT value below the threshold (I < IT) are supposed to be constituted of pure water with a density proportional to the initial CT value; similarly, voxels with an initial CT value above the threshold (I > IT) are supposed to be composed of a mixture of water with a fixed density (1 g/cm3) and a bone-equivalent material with a density proportional to the initial CT value. This assumption is valid in the presence of organic materials, but if very high-density materials are introduced (e.g., metals implants or contrast agents), they could be detected as dense bone and this assumption would no longer be appropriate.
The bone-only image (IB) is then forward-projected, obtaining a bone sinogram (SB) from which it is possible to calculate the effective bone thickness for each line integral (dB). Thanks to a specific internal attenuation model, it is possible to relate the effective bone thickness and the water bone thickness (dW) with the original sinogram (Sμ) for each line integral. Therefore, the combination between Sμ and dB allows dW to be obtained and to perform a complete decomposition of all of the materials into only two basis-materials: water and bone-equivalent. Knowing the RED of water ( ρ ^ W ) and the RED of bone ( ρ ^ B ), they can be combined with the water and bone effective thicknesses to provide a synthetic sinogram of RED. Thus, each RED sinogram line can be expressed as:
S ρ ^ = ρ ^ W d W + ρ ^ B d B .
In the final stage, the synthetic sinogram of RED is filtered-back projected to provide a RED proportional image (IDD) expressed in HU-like units. These units, in a specified voxel, are related to the RED of materials, as described in Equation (A2):
I DD ρ ^ 1 1000 ,
where ρ ^ is the RED of the material composing the considered voxel.

References

  1. Davis, A.T.; Palmer, A.L.; Nisbet, A. Can CT Scan Protocols Used for Radiotherapy Treatment Planning Be Adjusted to Optimize Image Quality and Patient Dose? A Systematic Review. Br. J. Radiol. 2017, 90, 20160406. [Google Scholar] [CrossRef] [PubMed]
  2. Schneider, U.; Pedroni, E.; Lomax, A. The Calibration of CT Hounsfield Units for Radiotherapy Treatment Planning. Phys. Med. Biol. 1996, 41, 111–124. [Google Scholar] [CrossRef] [PubMed]
  3. Kolarević, G.; Jaroš, D.; Pavičar, B.; Ignjić, T.; Kostovski, A.; Marošević, G.; Predojević, B.; Mirjanić, D. Computed Tomography Simulator Conversion Curve Dependence on Scan Parameters and Phantom Dimension. J. Health Sci. 2020, 10, 226–233. [Google Scholar] [CrossRef]
  4. Brevitt, B.A.; Suarez, E.G.; Clemente, R.A.M.; Voutchkov, M. Evaluating the Impact of CT Scanning Parameters on Dose Calculations by the Treatment Planning System in External Beam Radiation Therapy. J. Can. Res. 2021, 2, 8. [Google Scholar]
  5. Constantinou, C.; Harrington, J.C.; DeWerd, L.A. An Electron Density Calibration for Ct-based Treatment Planning Computers. Med. Phys. 1992, 19, 325–327. [Google Scholar] [CrossRef] [PubMed]
  6. Reid, J.; Gamberoni, J.; Dong, F.; Davros, W. Optimization of KVp and MAs for Pediatric Low-Dose Simulated Abdominal CT: Is It Best to Base Parameter Selection on Object Circumference? Am. J. Roentgenol. 2010, 195, 1015–1020. [Google Scholar] [CrossRef] [PubMed]
  7. Chen, G.P.; Noid, G.; Tai, A.; Liu, F.; Lawton, C.; Erickson, B.; Li, X.A. Improving CT Quality with Optimized Image Parameters for Radiation Treatment Planning and Delivery Guidance. Phys. Imaging Radiat. Oncol. 2017, 4, 6–11. [Google Scholar] [CrossRef] [Green Version]
  8. Seyal, A.R.; Arslanoglu, A.; Abboud, S.F.; Sahin, A.; Horowitz, J.M.; Yaghmai, V. CT of the Abdomen with Reduced Tube Voltage in Adults: A Practical Approach. Radiographics 2015, 35, 1922–1939. [Google Scholar] [CrossRef] [PubMed] [Green Version]
  9. Kalender, W.A. Dose in X-Ray Computed Tomography. Phys. Med. Biol. 2014, 59, R129–R150. [Google Scholar] [CrossRef] [PubMed]
  10. Ritter, A.; Mistry, N. DirectDensity®: Technical Principles and Implications for Radiotherapy; White paper; Technical Report; Siemens Healthineers: Erlangen, Germany, 2016. [Google Scholar]
  11. Van der Heyden, B.; Öllers, M.; Ritter, A.; Verhaegen, F.; van Elmpt, W. Clinical Evaluation of a Novel CT Image Reconstruction Algorithm for Direct Dose Calculations. Phys. Imaging Radiat. Oncol. 2017, 2, 11–16. [Google Scholar] [CrossRef] [Green Version]
  12. Flatten, V.; Friedrich, A.; Engenhart-Cabillic, R.; Zink, K. A Phantom Based Evaluation of the Dose Prediction and Effects in Treatment Plans, When Calculating on a Direct Density CT Reconstruction. J. Appl. Clin. Med. Phys. 2020, 21, 52–61. [Google Scholar] [CrossRef] [PubMed] [Green Version]
  13. Kachelrieß, M.; Krauss, A.; Healthcare, S. Iterative Metal Artifact Reduction (IMAR): Technical Principles and Clinical Results in Radiation Therapy; White paper; Siemens Healthcare: Erlangen, Germany, 2016. [Google Scholar]
  14. Trabzonlu, T.A.; Terrazas, M.; Mozaffary, A.; Velichko, Y.S.; Yaghmai, V. Application of Iterative Metal Artifact Reduction Algorithm to CT Urography for Patients with Hip Prostheses. Am. J. Roentgenol. 2020, 214, 137–143. [Google Scholar] [CrossRef] [PubMed]
  15. Piper, J.; Nelson, A.; Harper, J. Deformable Image Registration in MIM Maestro® Evaluation and Description; White paper; MIM Software Inc.: Cleveland, OH, USA, 2018. [Google Scholar]
  16. MIM Software Inc. Available online: https://www.mimsoftware.com/ (accessed on 17 July 2022).
  17. Boas, F.E.; Fleischmann, D. CT Artifacts: Causes and Reduction Techniques. Imaging Med. 2012, 4, 229–240. [Google Scholar] [CrossRef] [Green Version]
  18. Katsura, M.; Sato, J.; Akahane, M.; Kunimatsu, A.; Abe, O. Current and Novel Techniques for Metal Artifact Reduction at CT: Practical Guide for Radiologists. Radiographics 2018, 38, 450–461. [Google Scholar] [CrossRef] [PubMed] [Green Version]
  19. Moudi, E.; Haghanifar, S.; Madani, Z.; Bijani, A.; Nabavi, Z.S. The Effect of Metal Artifacts on the Identification of Vertical Root Fractures Using Different Fields of View in Cone-Beam Computed Tomography. Imaging Sci. Dent. 2015, 45, 147–151. [Google Scholar] [CrossRef] [PubMed] [Green Version]
  20. IAEA. Quality Assurance Programme for Computed Tomography: Diagnostic and Therapy Applications; IAEA: Vienna, Austria, 2012. [Google Scholar]
  21. D’Alessio, A.; D’Ippolito, E.; Tenconi, C.; Cavallo, A.; Stucchi, C.; Pignoli, E. Potentials and Limits of a Novel CT Reconstruction Algorithm (DirectDensityTM) Developed for Radiotherapy Treatment Planning. Biomed. Phys. Eng. Express 2019, 5, 065014. [Google Scholar] [CrossRef]
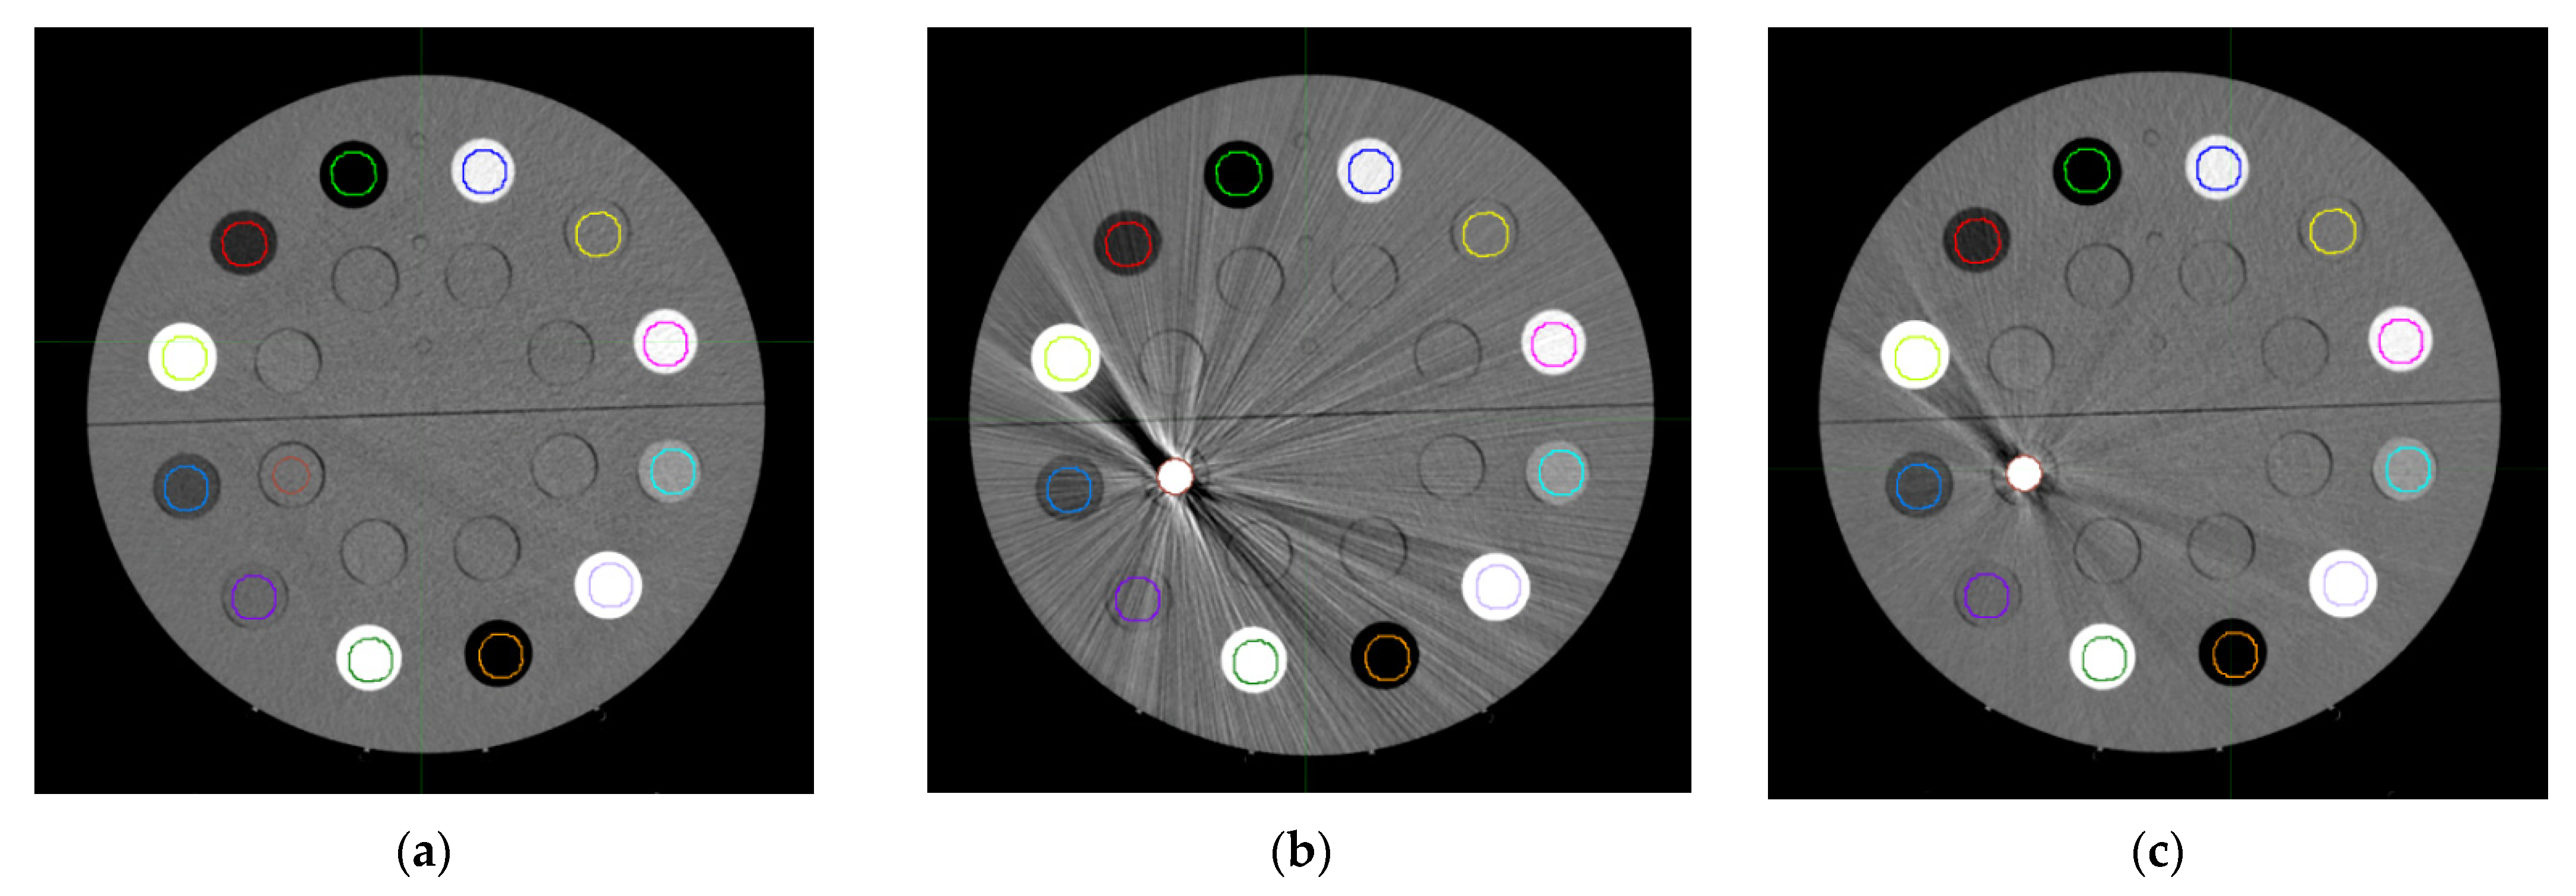
Figure 1. The CT scans of the Cheese phantom reconstructed with the standard algorithm Qr40, acquired at 120 kVp: (a) without metal inserts; (b) with the stainless-steel insert with a nominal density of 8 g/cm3; (c) with the titanium insert with a nominal density of 4.51 g/cm3.
Applsci 12 07845 g001
Figure 2. The CT scan of the CIRS phantom simulating the pelvis region with the contouring of the prostate (red), seminal vescicles (pink), bladder (light blue), and rectum (orange). (a) Transverse plan; (b) sagittal plan; (c) coronal plan.
Applsci 12 07845 g002
Figure 3. The CT scans (transverse sections) of the Cheese phantom reconstructed with the standard algorithm Qr40 at 120 kVp: (a) without metal inserts; (b) with the stainless-steel insert; (c) with the titanium insert. Structures of the targets (prostate in red and vescicles in pink) and organs at risk (bladder in light blue and rectum in orange) are visible at the center of each phantom. The density override in the brown ROI of figure (a) allows two ideal phantoms to be obtained, simulating the presence of the stainless-steel insert and the titanium insert, respectively, but without artifacts. The override of densities was also conducted in the metallic ROIs of the other CT scans (b,c).
Applsci 12 07845 g003
Figure 4. Isodoses, expressed as percentages of the dose to the prostate (100% = 70 Gy), on: (a) the ideal phantom simulating the stainless-steel insert (SRP); (b) the ideal phantom simulating the titanium insert (TRP); (c) the standard reconstruction of the CT scans of the Cheese phantom acquired at 120 kVp with the stainless-steel insert; (d) the standard reconstruction of the CT scans of the Cheese phantom acquired at 120 kVp with the titanium insert.
Applsci 12 07845 g004
Figure 5. A representative scheme of the dose calculation procedure.
Applsci 12 07845 g005
Figure 6. (a) The mean calibration curves at densities up to 1.82 g/cm3 associated with the three different convolution kernels (Qr40 on the left, DD in the middle, and DD + iMAR on the right) used during the reconstruction of the Cheese phantom CT scans with or without the metal inserts. Curves associated with each kVp value, given a convolution kernel, were obtained by averaging the mean HU (or HUDD) value in each ROI over the acquisitions with and without the metal inserts in the Cheese phantom, at the same kVp value. (b) The mean calibration curves at densities ranging from 1.82 g/cm3 to 8 g/cm3 associated with the three different convolution kernels (Qr40 on the left, DD in the middle, and DD + iMAR on the right) used during the reconstruction of the Cheese phantom CT scans with the metal inserts.
Applsci 12 07845 g006
Figure 7. The absolute difference in HU or HUDD between the average calibration curve corresponding to the acquisition at 80 kVp and the average calibration curve corresponding to the acquisition at 140 kVp, for each set of curves related to each reconstruction algorithm. The curve related to the DD reconstruction (DD) matched the curve related to the combined reconstruction DD + iMAR.
Applsci 12 07845 g007
Figure 8. Absolute maximum differences in dose, expressed as percentage of the dose to the prostate (100% = 70 Gy), between the dose distribution calculated on the DD reconstruction of the CT scan of the Cheese phantom acquired with the stainless-steel insert at 120 kVp and the dose distribution calculated on the ideal phantom simulating the presence of the stainless-steel phantom SRP). Green and blue shading corresponds to maximum differences of −0.5% and 0.5%, respectively. The analysis was made with MIM Maestro® and differences are reported on the DD reconstruction of the Cheese phantom acquired with the stainless-steel insert at 120 kVp (axial section on the left, sagittal section at the upper right corner, and coronal section at the lower right corner).
Applsci 12 07845 g008
Figure 9. The absolute maximum differences in dose, expressed as the percentage of the dose to the prostate (100% = 70 Gy), between the dose distributions calculated on the DD reconstructions of the CT scans of the Cheese phantom with the stainless-steel insert acquired at 100 kVp and 140 kVp, respectively. Blue shading corresponds to maximum differences of 0.5%. The analysis was conducted with MIM Maestro® and differences were reported on the DD reconstruction of the Cheese phantom acquired with the stainless-steel insert at 100 kVp (axial section on the left, sagittal section at the upper right corner, and coronal section at the lower right corner).
Applsci 12 07845 g009
Figure 10. The absolute maximum differences in dose, expressed as percentage of the dose to the prostate (100% = 70 Gy) between the dose distributions calculated on the DD reconstruction of the CT scan of the Cheese phantom with the stainless-steel insert acquired at 120 kVp using the correct calibration curve and the calibration curve related to the acquisition at 80 kVp, respectively. Blue shading corresponds to maximum differences of 0.5%. The analysis was conducted with MIM Maestro® and the differences were reported on the DD reconstruction of the Cheese phantom acquired with the stainless-steel insert at 120 kVp (axial section on the left, sagittal section at the upper right corner, and coronal section at the lower right corner).
Applsci 12 07845 g010
Table 1. A list of the equivalent materials of the inserts used in the Cheese phantom, with the correspondent nominal mass densities.
Equivalent MaterialDensity (g/cm3)
LN-300 Lung0.300
LN-450 Lung0.490
Adipose0.942
Breast0.979
Solid Water1.018
Brain1.053
Liver1.095
Inner Bone1.139
B-200 Bone1.152
CB2-30%1.334
CB2-50%1.562
Cortical Bone1.824
Titanium4.510
Stainless-steel8.000
Table 2. The mean HU in the selected cylindrical ROIs in the Cheese phantom with inserts of densities ranging from 0.30 g/cm3 to 8 g/cm3. Data were divided on the basis of the kVp used during the acquisition of the image, on the basis of the reconstruction algorithm (Qr40, DD or the combined algorithm DD + iMAR), and on the basis of the metal insert placed in the phantom. The combined algorithm DD + iMAR was used only for CT scans acquired with the metal inserts.
Convolution Kernel
Qr40DDDD + iMAR
80 kVp100 kVp120 kVp140 kVp80 kVp100 kVp120 kVp140 kVp80 kVp100 kVp120 kVp140 kVp
Metal InsertInsert NameDensity (g/cm3)HU MeanHU MeanHU MeanHU MeanHU MeanHU MeanHU MeanHU MeanHU MeanHU MeanHU MeanHU Mean
NoneLN-300 Lung0.30−710 ± 15−713 ± 15−712 ± 14 −711 ± 15−714 ± 11 −717 ± 11 −715 ± 10−714 ± 11 ----
LN-450 Lung0.49−511 ± 18−512 ± 15−513 ± 15−516 ± 17 −520 ± 14−519 ± 12−520 ± 12−522 ± 14 ----
Adipose0.94−115 ± 11−102 ± 10−95 ± 8 −90 ± 10 −118 ± 7−105 ± 7−97 ± 5−92 ± 7 ----
Breast0.98−57 ± 11−52 ± 9 −48 ± 8 −46 ± 12−61 ± 7−55 ± 6 −51 ± 5 −48 ± 7----
Solid Water1.029 ± 124 ± 9 3 ± 9 1 ± 137 ± 73 ± 62 ± 50 ± 9----
Brain1.054 ± 1416 ± 923 ± 11 28 ± 10 2 ± 9 15 ± 622 ± 7 27 ± 6----
Liver1.1084 ± 1580 ± 9 78 ± 12 77 ± 1180 ± 7777 ± 676 ± 7 74 ± 6----
Inner Bone1.14314 ± 15253 ± 12220 ± 11 196 ± 10106 ± 5107 ± 4108 ± 4107 ± 4 ----
B-200 Bone1.15328 ± 15263 ± 10 233 ± 13 209 ± 11112 ± 4113 ± 3116 ± 4114 ± 4 ----
CB2-30%1.33621 ± 15525 ± 11 471 ± 11 438 ± 16 226 ± 7 235 ± 6243 ± 6250 ± 7 ----
CB2-50%1.561151 ± 23952 ± 13847 ± 13 776 ± 15448 ± 13 447 ± 9453 ± 9 455 ± 9 ----
Cortical Bone1.821734 ± 28 1449 ± 22 1269 ± 11631163 ± 18719 ± 14 712 ± 13703 ± 10 703 ± 10 ----
TitaniumLN-300 Lung0.30−708 ± 16 −710 ± 14−712 ± 15−710 ± 14−713 ± 12−714 ± 11−716 ± 11−713 ± 11−716 ± 11−716 ± 11−717 ± 11−715 ± 11
LN-450 Lung0.49−513 ± 20 −515 ± 16 −516 ± 16−58 ± 16−521 ± 16−521 ± 13−521 ± 13−522 ± 13−522 ± 19−521 ± 13−521 ± 14−522 ± 13
Adipose0.94−114 ± 12 −101 ± 9 −94 ± 11−89 ± 8−118 ± 8−104 ± 6−97 ± 8−92 ± 6−118 ± 7−104 ± 6−97 ± 8−92 ± 6
Breast0.98−51 ± 18 −48 ± 9 −44 ± 11−42 ± 11−58 ± 12−53 ± 6−48 ± 7−46 ± 7−61 ± 10−54 ± 6−49 ± 7−46 ± 7
Solid Water1.0214 ±18 7 ± 10 4 ± 94 ± 1310 ± 124 ± 62 ± 63 ± 97 ± 102 ± 60 ± 61 ± 9
Brain1.055 ± 12 17 ± 9 24 ± 828 ± 83 ± 816 ± 623 ± 527 ± 62 ± 815 ± 623 ± 528 ± 6
Liver1.1085 ± 13 79 ± 9 77 ± 977 ± 1080 ± 977 ± 675 ± 675 ± 680 ± 877 ± 675 ± 675 ± 6
Inner Bone1.14310 ± 16 251 ± 11 217 ± 10 195 ± 9106 ± 5107 ± 4107 ± 4107 ± 4106 ± 5107 ± 4108 ± 4107 ± 4
B-200 Bone1.15323 ± 15 263 ± 9 228 ± 9 208 ± 9 111 ± 5113 ± 3113 ± 3114 ± 4111 ± 4113 ± 3112 ± 3115 ± 4
CB2-30%1.33623 ± 18 525 ± 11 470 ± 10438 ± 14228 ± 8236 ± 6243 ± 6250 ± 6228 ± 8237 ± 6243 ± 6250 ± 7
CB2-50%1.561136 ± 21 949 ± 12 839 ± 11775 ± 14445 ± 12448 ± 9 450 ± 8456 ± 9448 ± 12449 ± 9451 ± 8456 ± 9
Cortical Bone1.821718 ± 30 1430 ± 21 1269 ± 191150 ± 16719 ± 16708 ± 12708 ± 11699 ± 9728 ± 16712 ± 13711 ± 12701 ± 10
Titanium4.5113,021 ± 468 9891 ± 282 8059 ± 2136953 ± 17211,539 ± 4298826 ± 2457249 ± 1866306 ± 14911,541 ± 4338828 ± 2497251 ± 1886308 ± 152
St. steelLN-300 Lung0.30−700 ± 15 −701 ± 15 −705 ± 15 −712 ± 17−706 ± 11−705 ± 12−709 ± 12−716 ± 13−708 ± 12−717 ± 11−716 ± 11−719 ± 12
LN-450 Lung0.49−525 ± 18 −513 ± 20 −516 ± 27−516 ± 17−531 ± 11−518 ± 16−522 ± 21−520 ± 14−533 ± 11−524 ± 23−525 ± 27−523 ± 22
Adipose0.94−111 ± 11 −97 ± 15 −91 ± 12−87 ± 15−115 ± 10−100 ± 10−94 ± 8−90 ± 10−115 ± 9−105 ± 6−98 ± 6−91 ± 7
Breast0.98−52 ± 11 −42 ± 33 −42 ± 19−42 ± 15−58 ± 10−48 ± 22−47 ± 12−46 ± 10−61 ± 9−55 ± 14−50 ± 9−48 ± 7
Solid Water1.0213 ± 12 18 ± 38 16 ± 285 ± 1510 ± 915 ± 3013 ± 223 ± 117 ± 94 ± 133 ± 90 ± 7
Brain1.055 ± 14 15 ± 16 25 ± 10 28 ± 133 ± 914 ± 1124 ± 628 ± 82 ± 912 ± 822 ± 626 ± 7
Liver1.1085 ± 15 78 ± 13 78 ± 1377 ± 1280 ± 974 ± 874 ± 873 ± 780 ± 976 ± 676 ± 675 ± 6
Inner Bone1.14310 ± 15 247 ± 15 215 ± 11196 ± 14106 ± 9106 ± 5107 ± 4108 ± 5106 ± 8107 ± 4107 ± 4109 ± 5
B-200 Bone1.15322 ± 15 261 ± 14 229 ± 12208 ± 12111 ± 9112 ± 5112 ± 5115 ± 5111 ± 8113 ± 4114 ± 4115 ± 4
CB2-30%1.33623 ± 15 529 ± 23481 ± 25436 ± 15228 ± 9239 ± 9249 ± 11249 ± 7228 ± 8238 ± 10247 ± 12250 ± 8
CB2-50%1.561137 ± 23 944 ± 18 847 ± 18770 ± 12445 ± 8446 ± 11454 ± 11454 ± 8447 ± 7451 ± 10457 ± 10457 ± 8
Cortical Bone1.821718 ± 28 1405 ± 251242 ± 231150 ± 22719 ± 7698 ± 13693 ± 11701 ± 13728 ± 6718 ± 14713 ± 14711 ± 12
St. steel8.0027,708 ± 2217 19,552 ± 264017,790 ± 118815,464 ± 67025,596 ± 256018,691 ± 247217,175 ± 110714,988 ± 62525,591 ± 230318,682 ± 248817,170 ± 111614,989 ± 631
Table 3. The absolute and percentage differences in terms of HU or HUDD, for each non-metallic ROI, between the pairs of images acquired at the same kVp value and reconstructed with the same algorithm but one with and one without metal inserts (stainless-steel or titanium) in the phantom. For data related to the combined algorithm (DD + iMAR), variations were investigated with respect to the images acquired at different kVp without metallic materials and reconstructed with the DD convolution kernel.
Convolution Kernel
Qr40DDDD + iMAR
80 kVp100 kVp120 kVp140 kVp80 kVp100 kVp120 kVp140 kVp80 kVp100 kVp120 kVp140 kVp
Metal InsertInsert NameDensity (g/cm3)dHU%dHU%dHU%dHU%dHUDD%dHUDD%dHUDD%dHUDD%dHUDD%dHUDD%dHUDD%dHUDD%
TitaniumLN-300 Lung0.30203110101021100021102110
LN-450 Lung0.49203120101020101010201000
Adipose0.94001010100010000000000000
Breast0.98615040403030203010102020
Solid Water1.02403010302010002000101010
Brain1.05101000001010000000000010
Liver1.10000010000000001000000010
Inner Bone1.14302030100000100000001000
B-200 Bone1.15600050101010200010102000
CB2-30%1.33100010002010000020100000
CB2-50%1.561513080103010201010202010
Cortical Bone1.821611910013010405040100008020
St.steelLN-300 Lung0.30103124621083114622162001052
LN-450 Lung0.49143102000112102020123516110
Adipose0.94405130302040202030101000
Breast0.986110161403071302010000010
Solid Water1.024014113140201211113000101000
Brain1.05101010101010101000301010
Liver1.10001000000030201000000000
Inner Bone1.14305050000010201000101010
B-200 Bone1.15602040101000200010101000
CB2-30%1.332040101202040600020204000
CB2-50%1.561518000603010101010404020
Cortical Bone1.821614422711211014190201006010180
Table 4. The absolute and percentage differences (percentage differences between brackets) in the HU or HUDD between the average calibration curve corresponding to the acquisition at 80 kVp and the average calibration curve corresponding to the acquisition at 140 kVp, for each set of curves related to each reconstruction algorithm.
Insert NameDensity (g/cm3)Convolution Kernel
Qr40DDDD + iMAR
Abs dHU (dHU%)Abs dHU (dHU%)Abs dHU (dHU%)
LN-300 Lung0.305 (2)3 (1)5 (2)
LN-450 Lung0.490 (0)3 (1)5 (1)
Adipose0.9424 (3)26 (3)25 (3)
Breast0.9810 (1)12 (1)14 (1)
Solid Water1.029 (1)7 (1)7 (1)
Brain1.0523 (2)24 (2)25 (2)
Liver1.107 (1)6 (0)6 (0)
Inner Bone1.14116 (10)1 (0)2 (0)
B-200 Bone1.15116 (10)3 (0)3 (0)
CB2-30%1.33185 (23)22 (2)22 (2)
CB2-50%1.56368 (21)9 (0)9 (1)
Cortical Bone1.82569 (26)18 (1)22 (1)
Titanium4.516068 (76)5233 (72)5234 (72)
Stainless-steel8.0012,243 (74)10,608 (66)10,602 (66)
Table 5. The gamma indices obtained from the comparation of dose distributions calculated on the images acquired at 120 kVp, with the acceptability criteria of 2% in dose and 2 mm in space. Each distribution considered in the comparisons was identified by the image on which it was calculated (i.e., by the type of algorithm used to reconstruct it (Qr40, DD, DD + iMAR) and by the type of metal insert placed in the Cheese phantom (titanium, steel, or none)).
Qr40
SRP/TRP SteelTitanium
Qr40Steel100%--
Titanium100%--
DDSteel100%100%-
Titanium100%-100%
DD + iMARSteel100%100%-
Titanium100%-100%
Table 6. The maximum differences in dose, expressed as percentages of the prostate dose (70 Gy), derived from the comparation of the dose distributions on the images acquired at 120 kVp, performed with MIM Maestro®. Each distribution considered in the comparisons was identified by the image on which it was calculated (i.e., by the type of algorithm used to reconstruct it (Qr40, DD, DD + iMAR) and by the type of metal insert inserted in the phantom (titanium, steel, or none)).
Qr40
SRP/TRP SteelTitanium
Qr40Steel2.6%--
Titanium1.6%--
DDSteel0.5%1.6%-
Titanium0.5%-0.5%
DD + iMARSteel0.5%1.6%-
Titanium0.5%-0.5%
Publisher’s Note: MDPI stays neutral with regard to jurisdictional claims in published maps and institutional affiliations.