
Optimization of a Nature-Inspired Shape for a Vertical Axis Wind Turbine through a Numerical Model and an Artificial Neural Network


 ,
, 
Abstract
:1. Introduction
- -
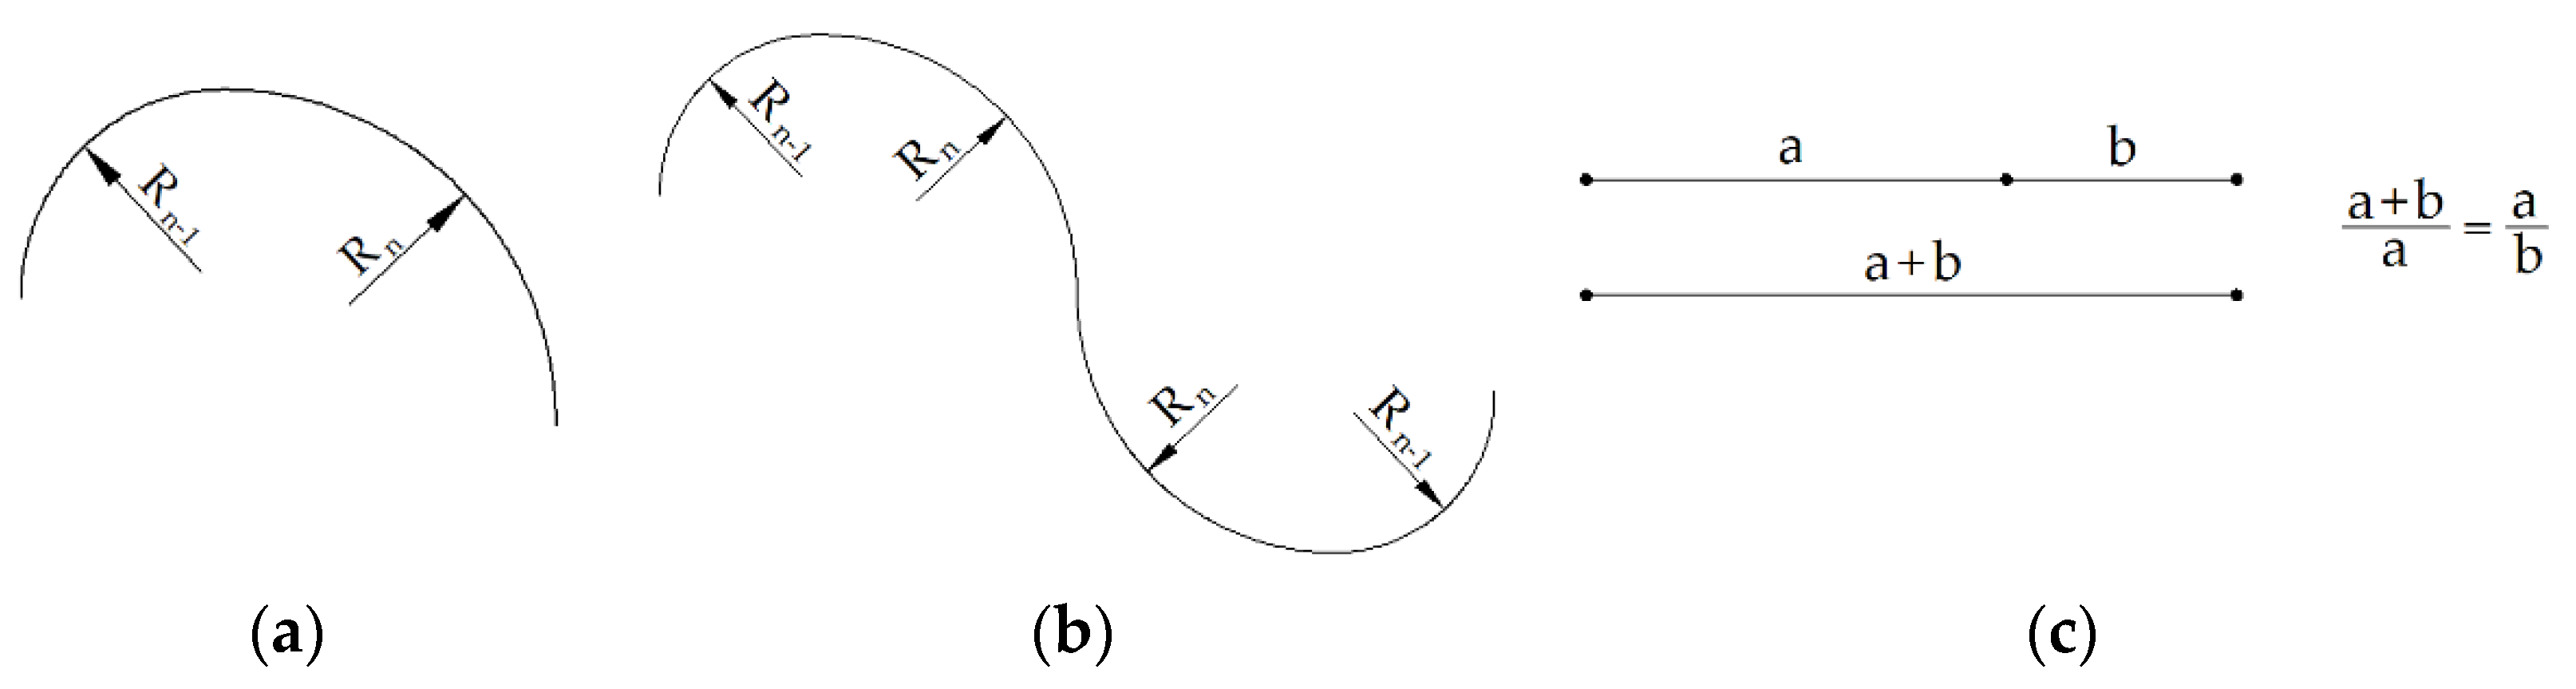
- Proposing an innovative blade profile for a Savonius-type VAWT based on the Fibonacci spiral.
- -
- Carrying out a CFD model validated with experimental measurements in order to provide 125 data to establish an ANN.
- -
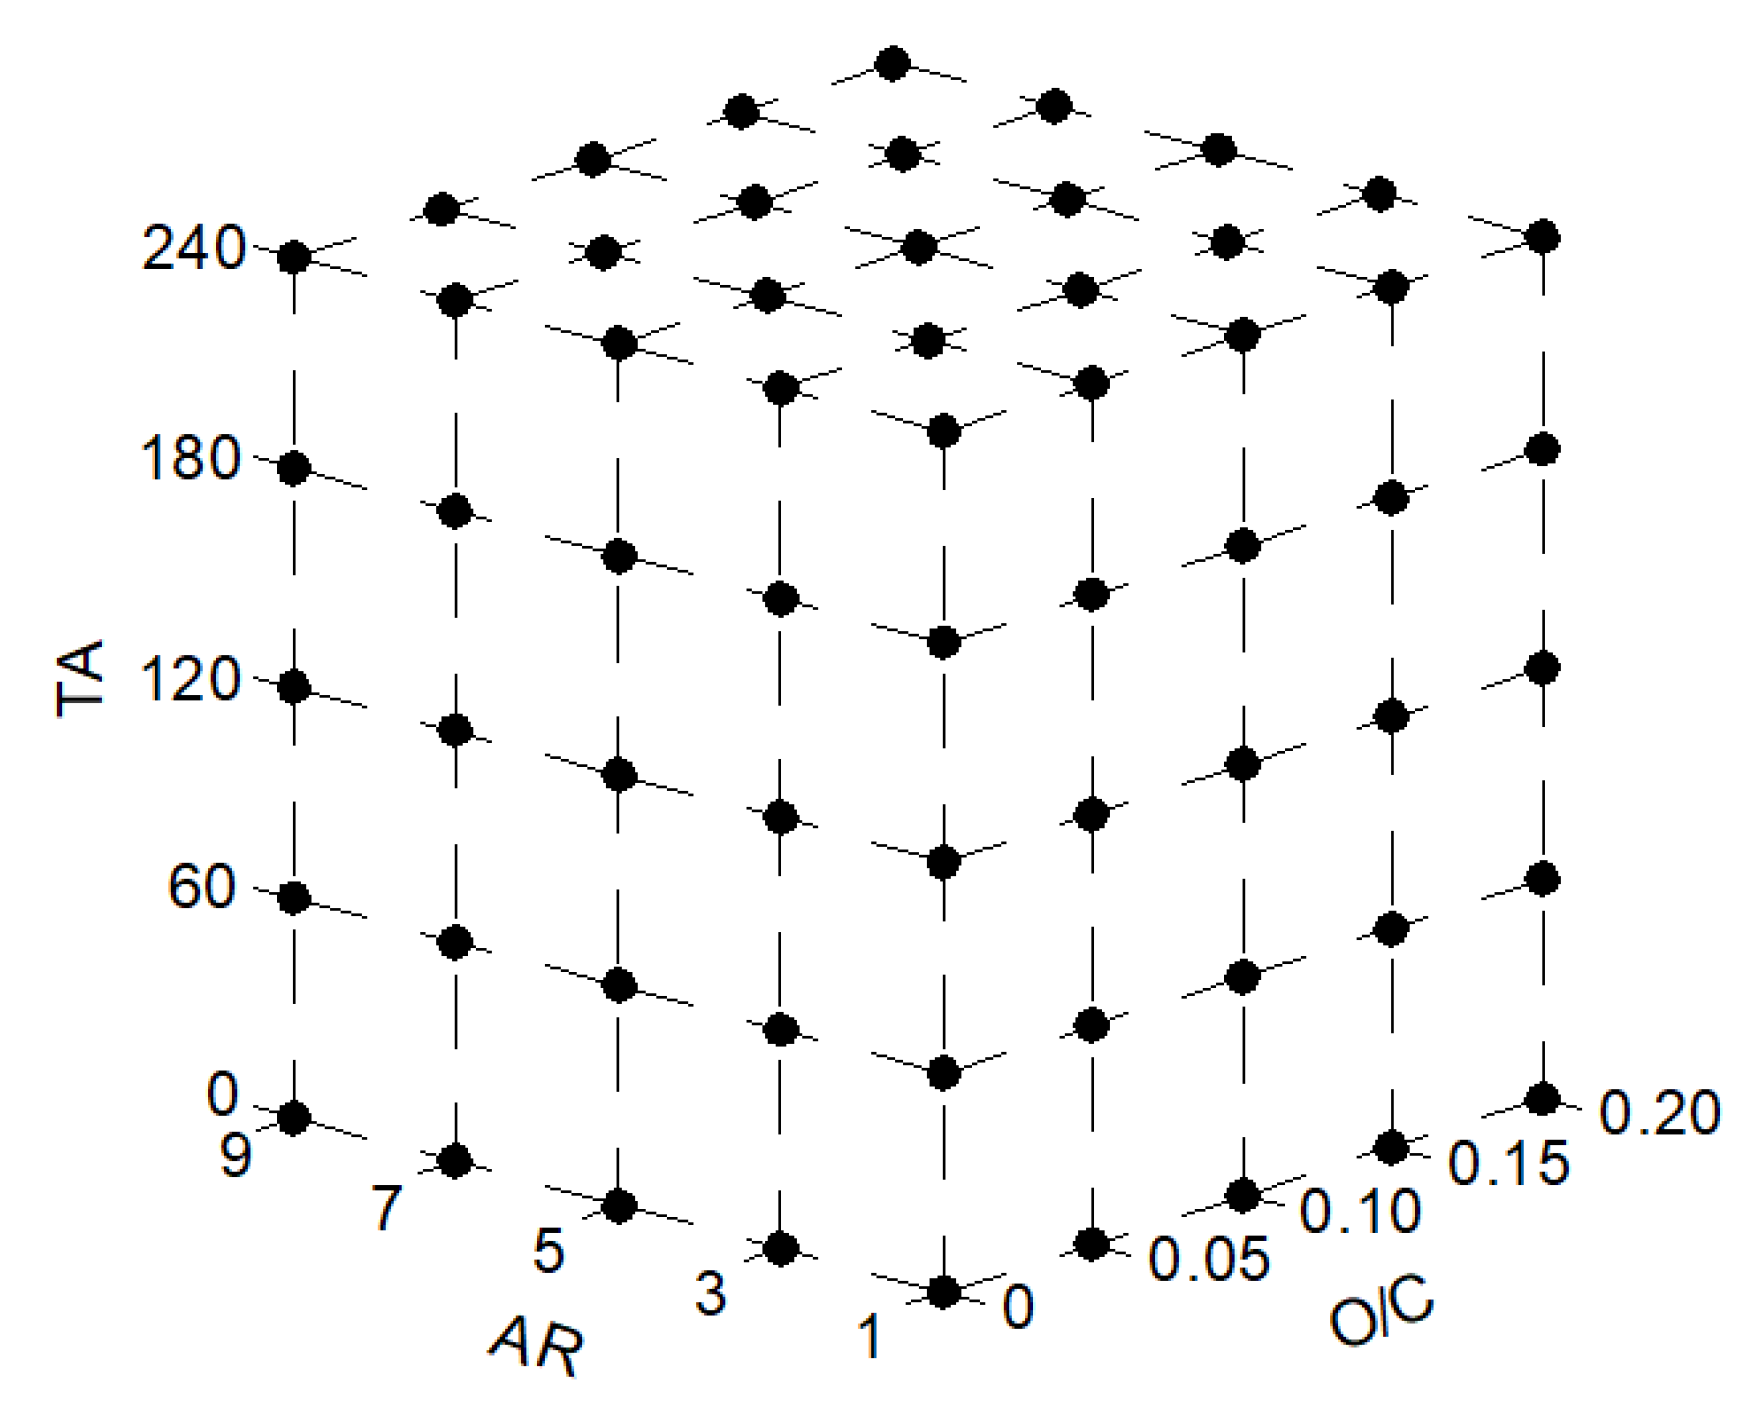
- Establishing an ANN to analyze 793,881 possible combinations of aspect ratio, overlap, and twist angle and determine the most appropriate combination of all these cases considered.
2. Materials and Methods
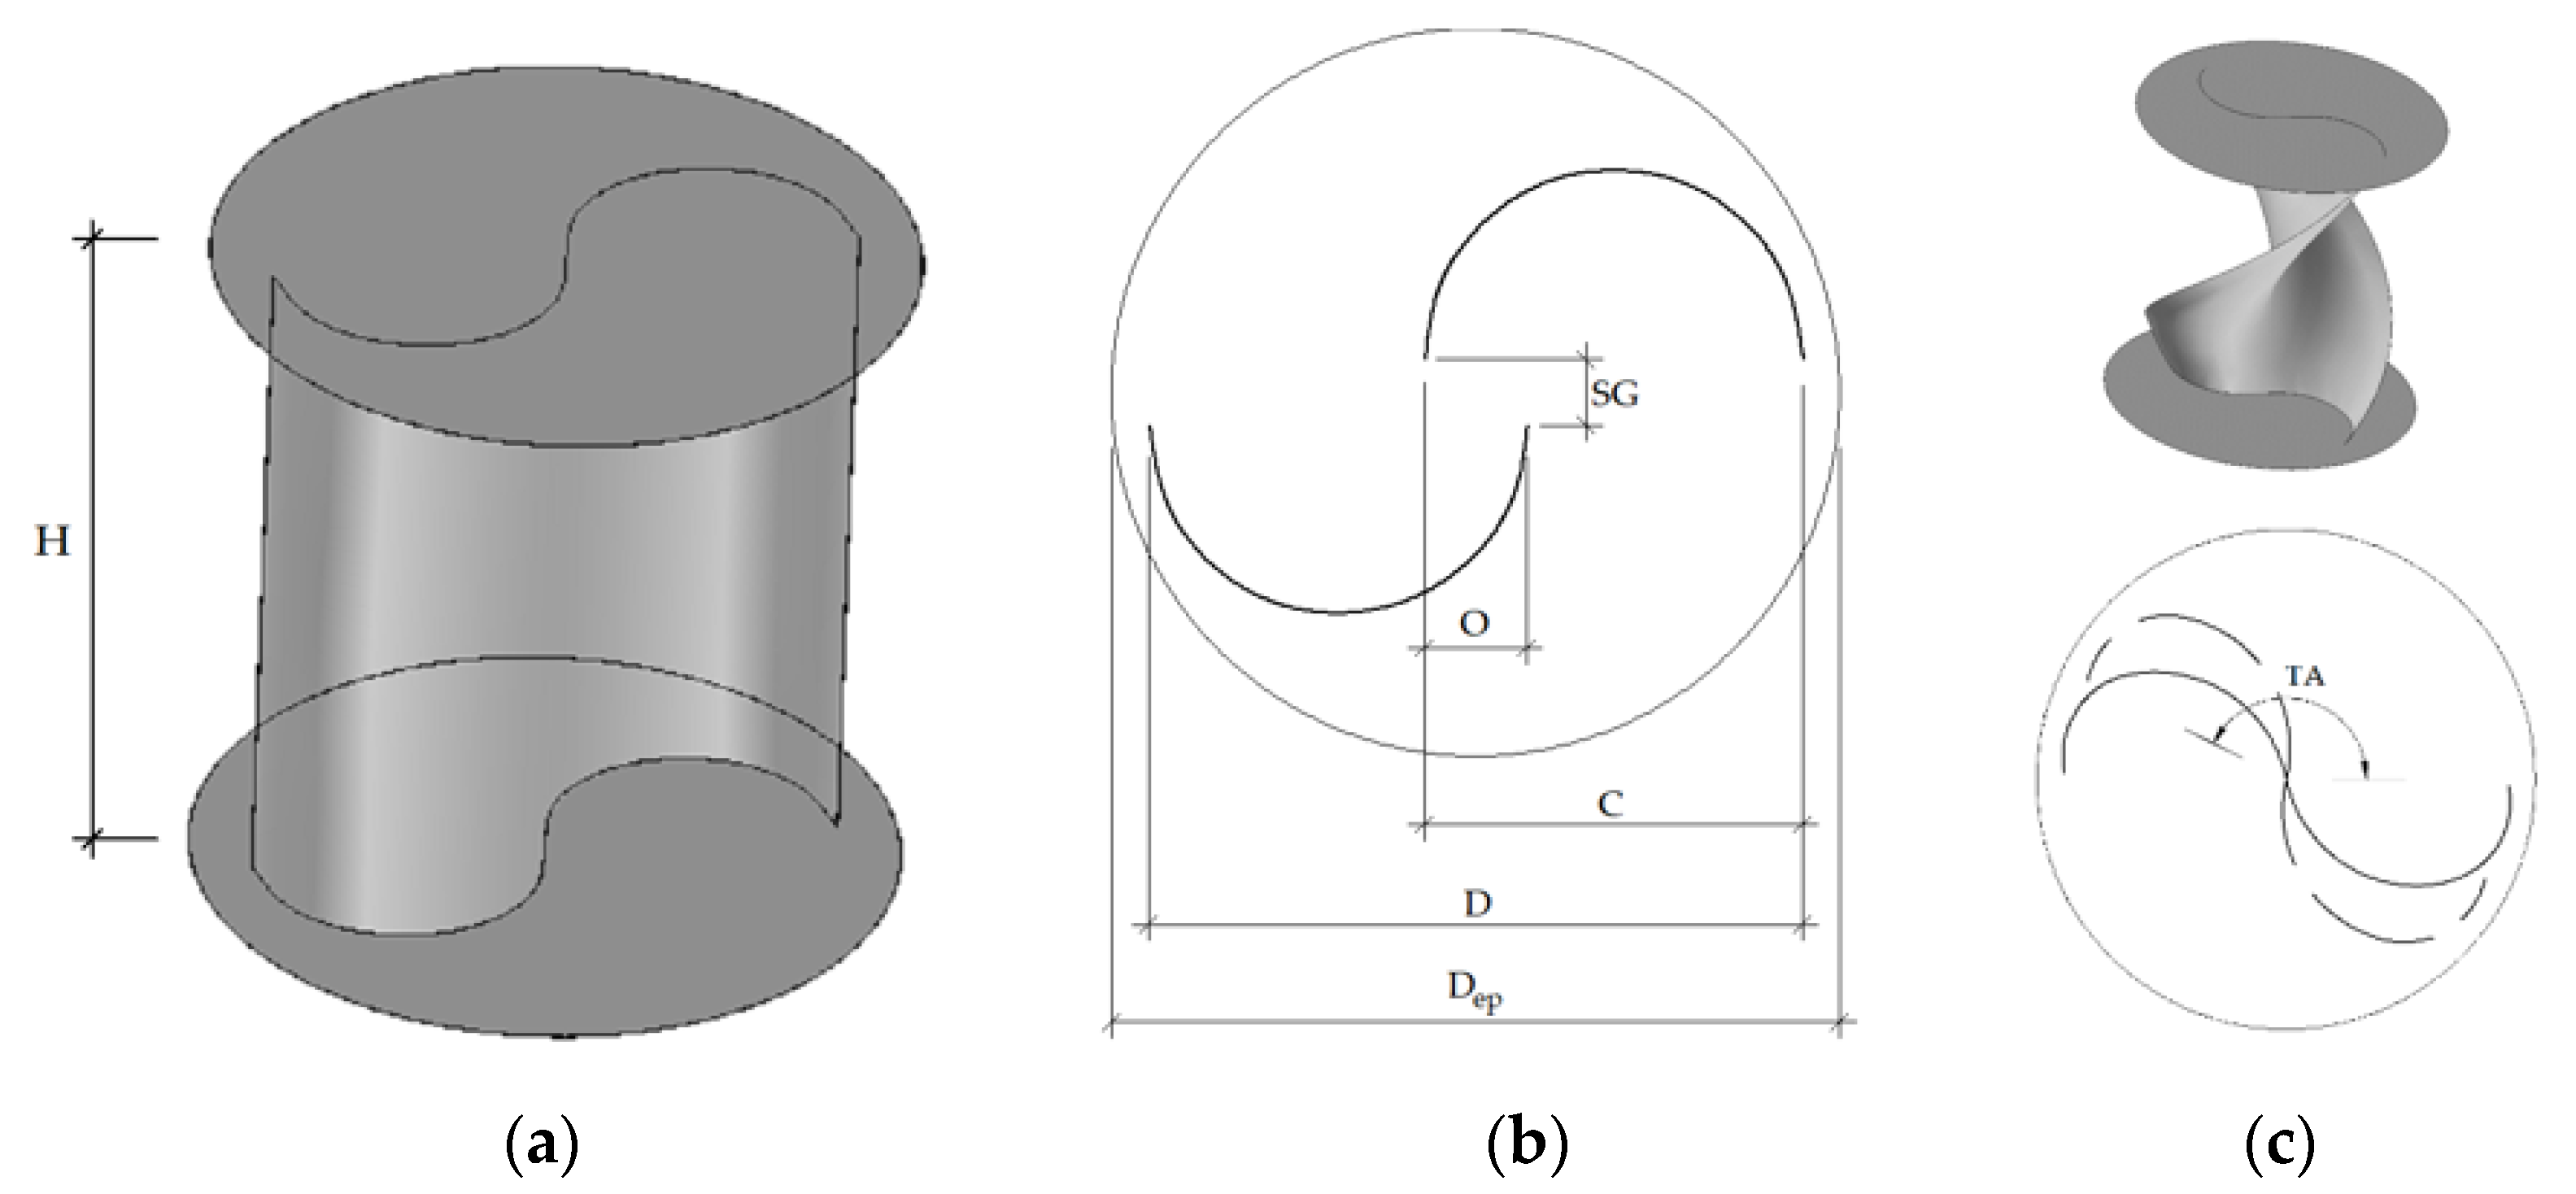
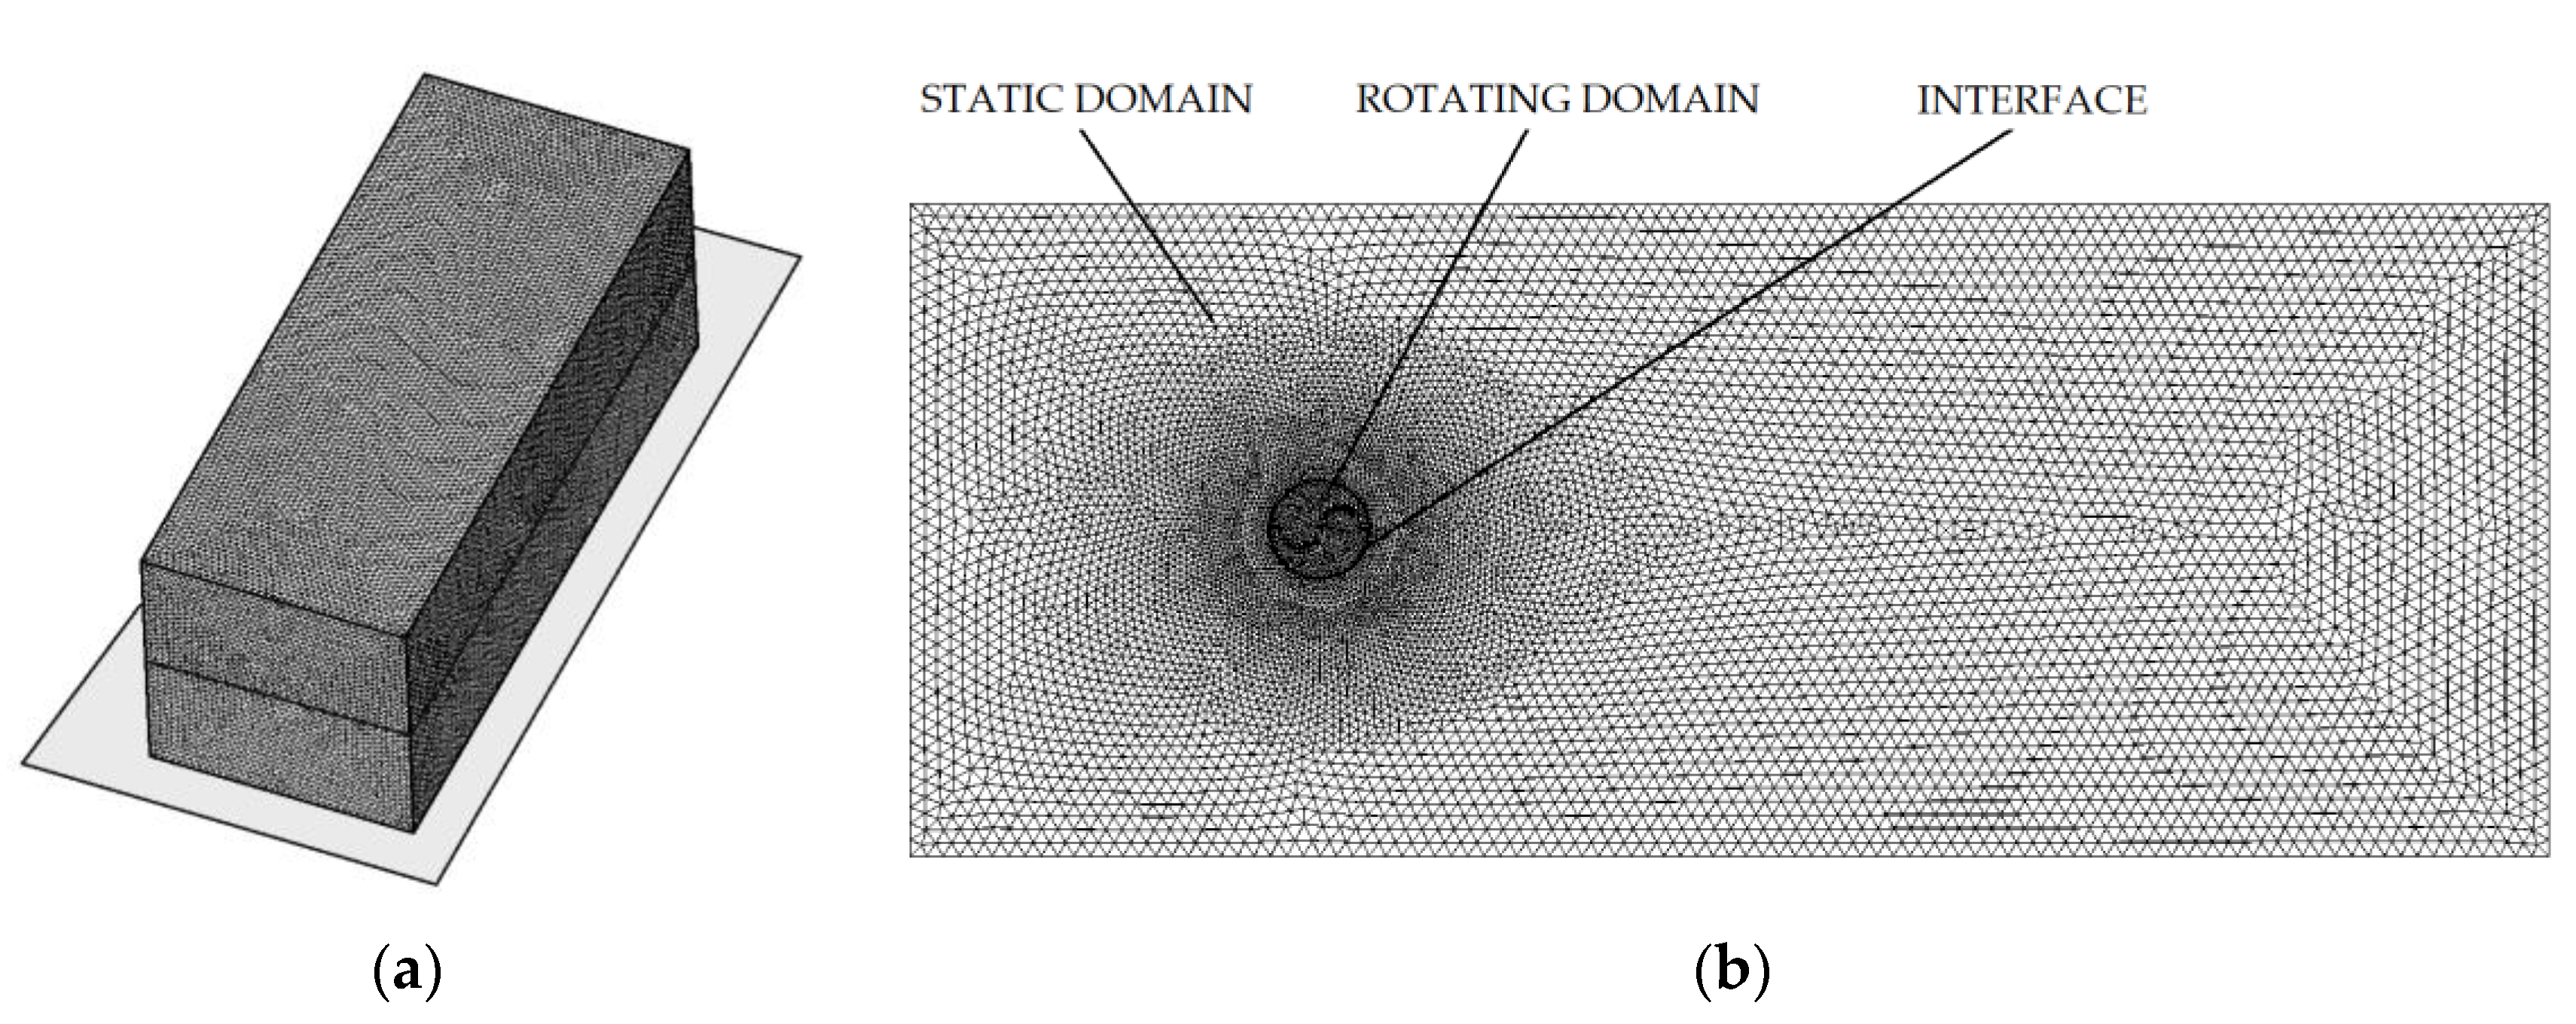
2.1. CFD Analysis
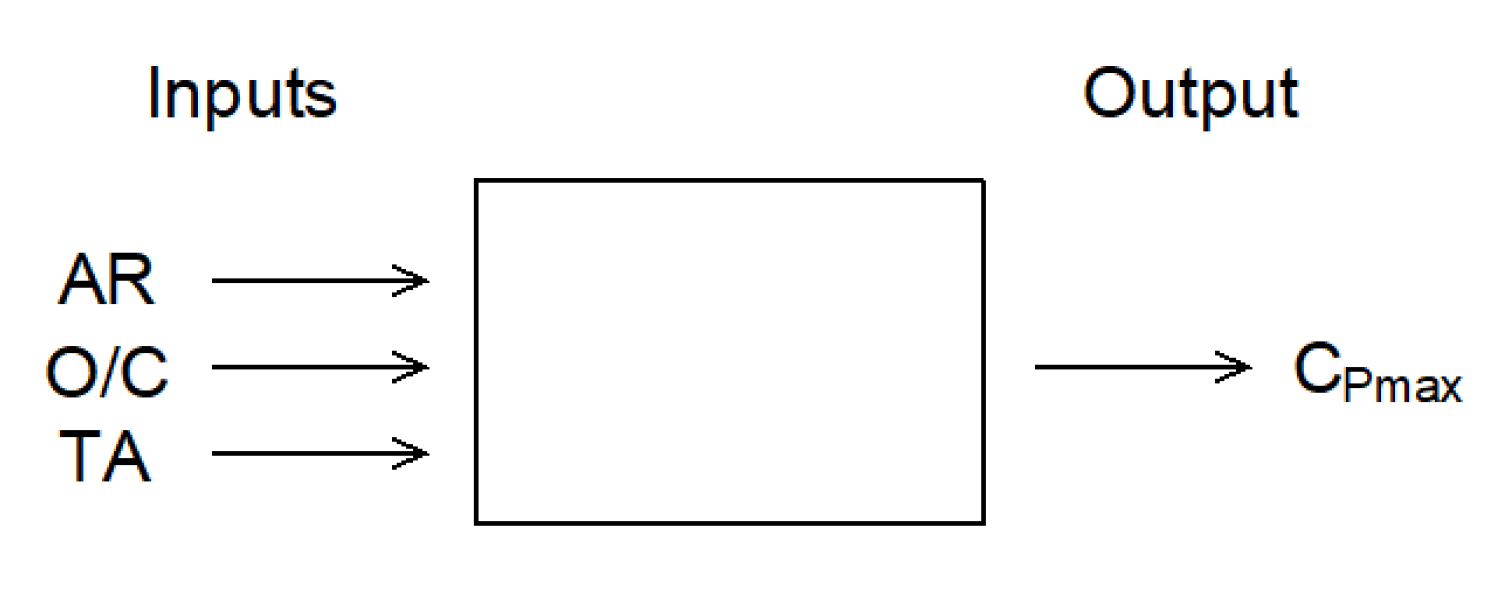
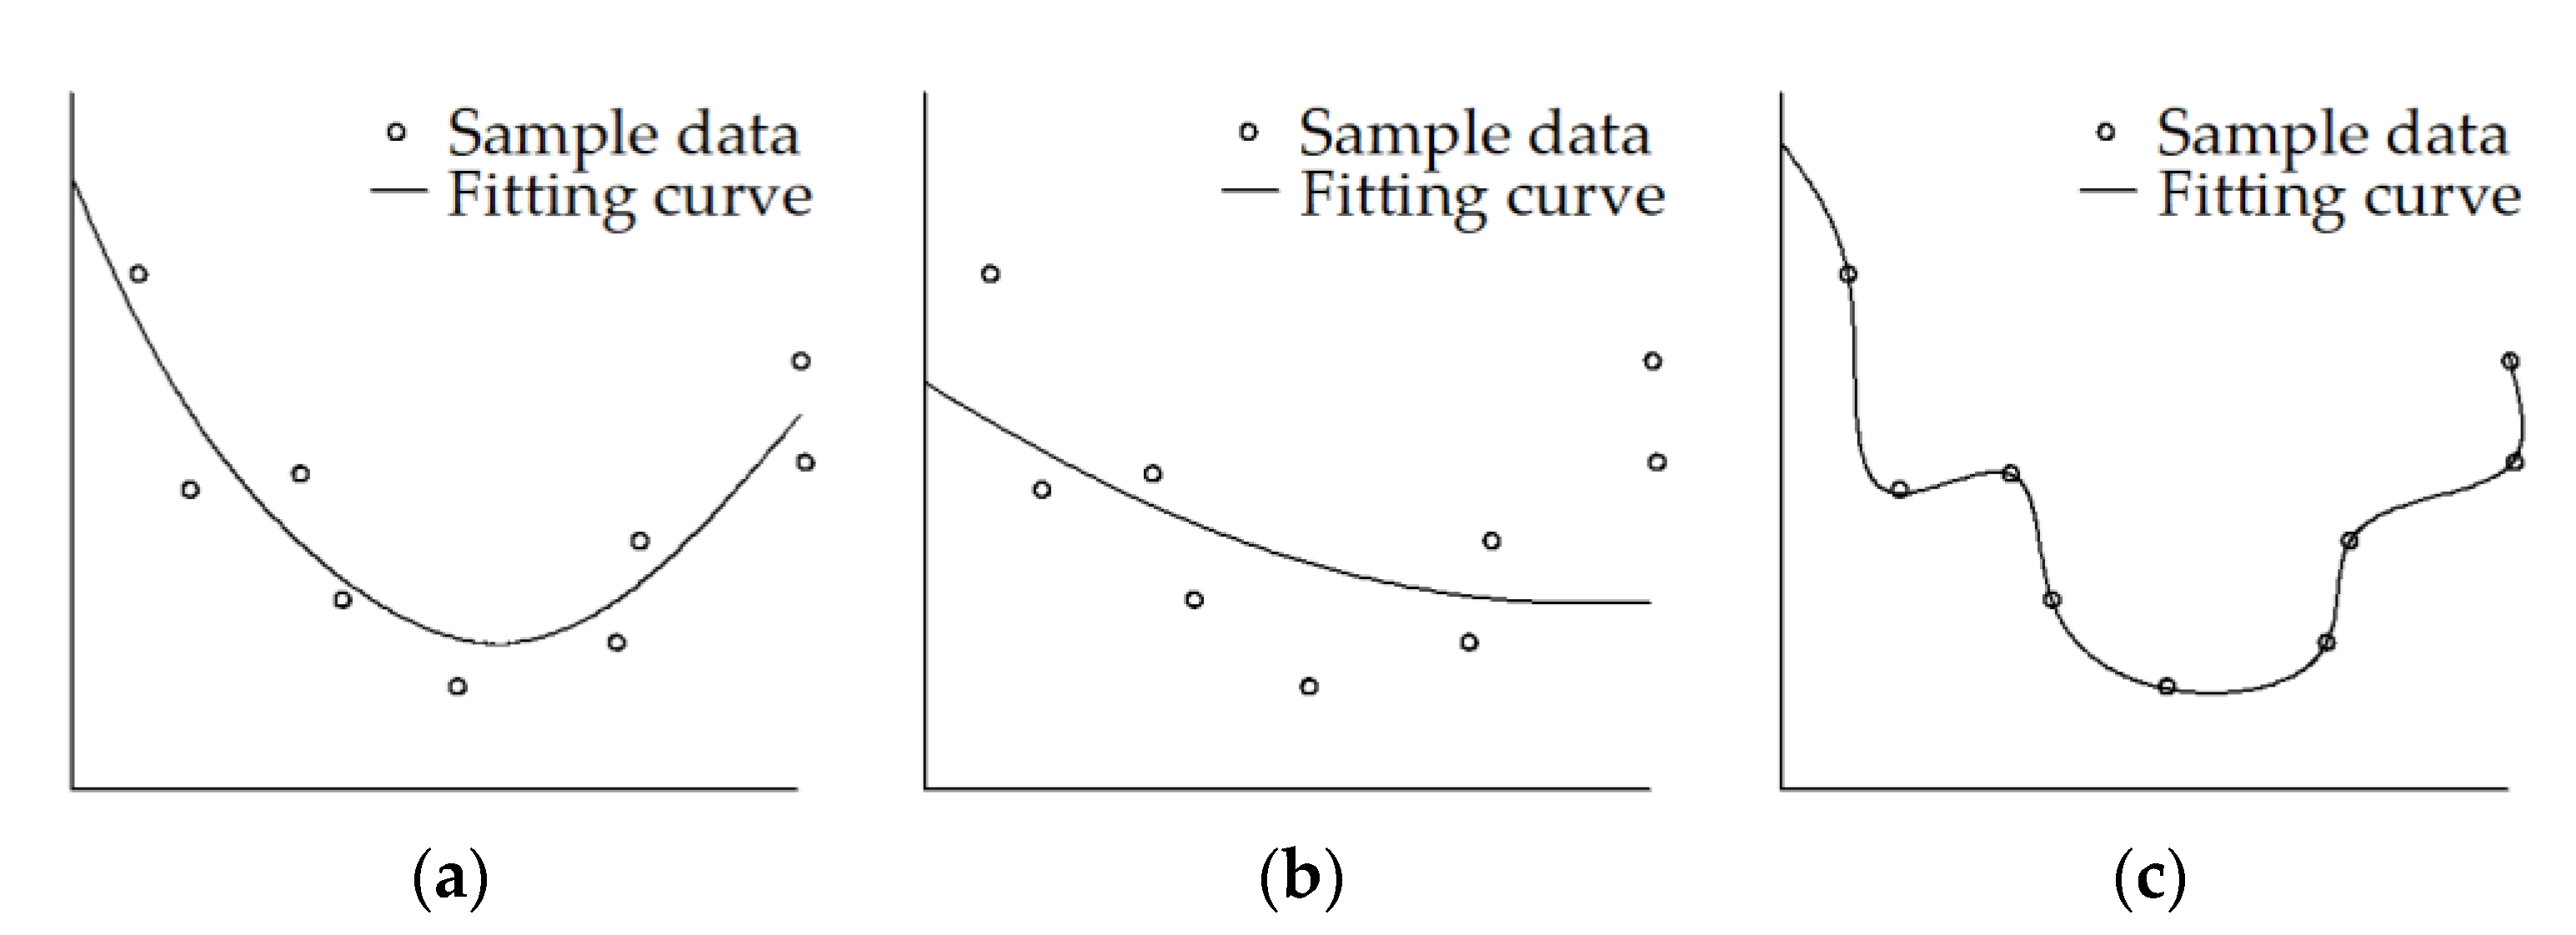
2.2. ANN Analysis
- -
- Capacity to learn from existing data and thus the ability to provide a prediction from multivariable relationships between process parameters.
- -
- Capacity to treat complex relationships between dependent and independent variables with high accuracy.
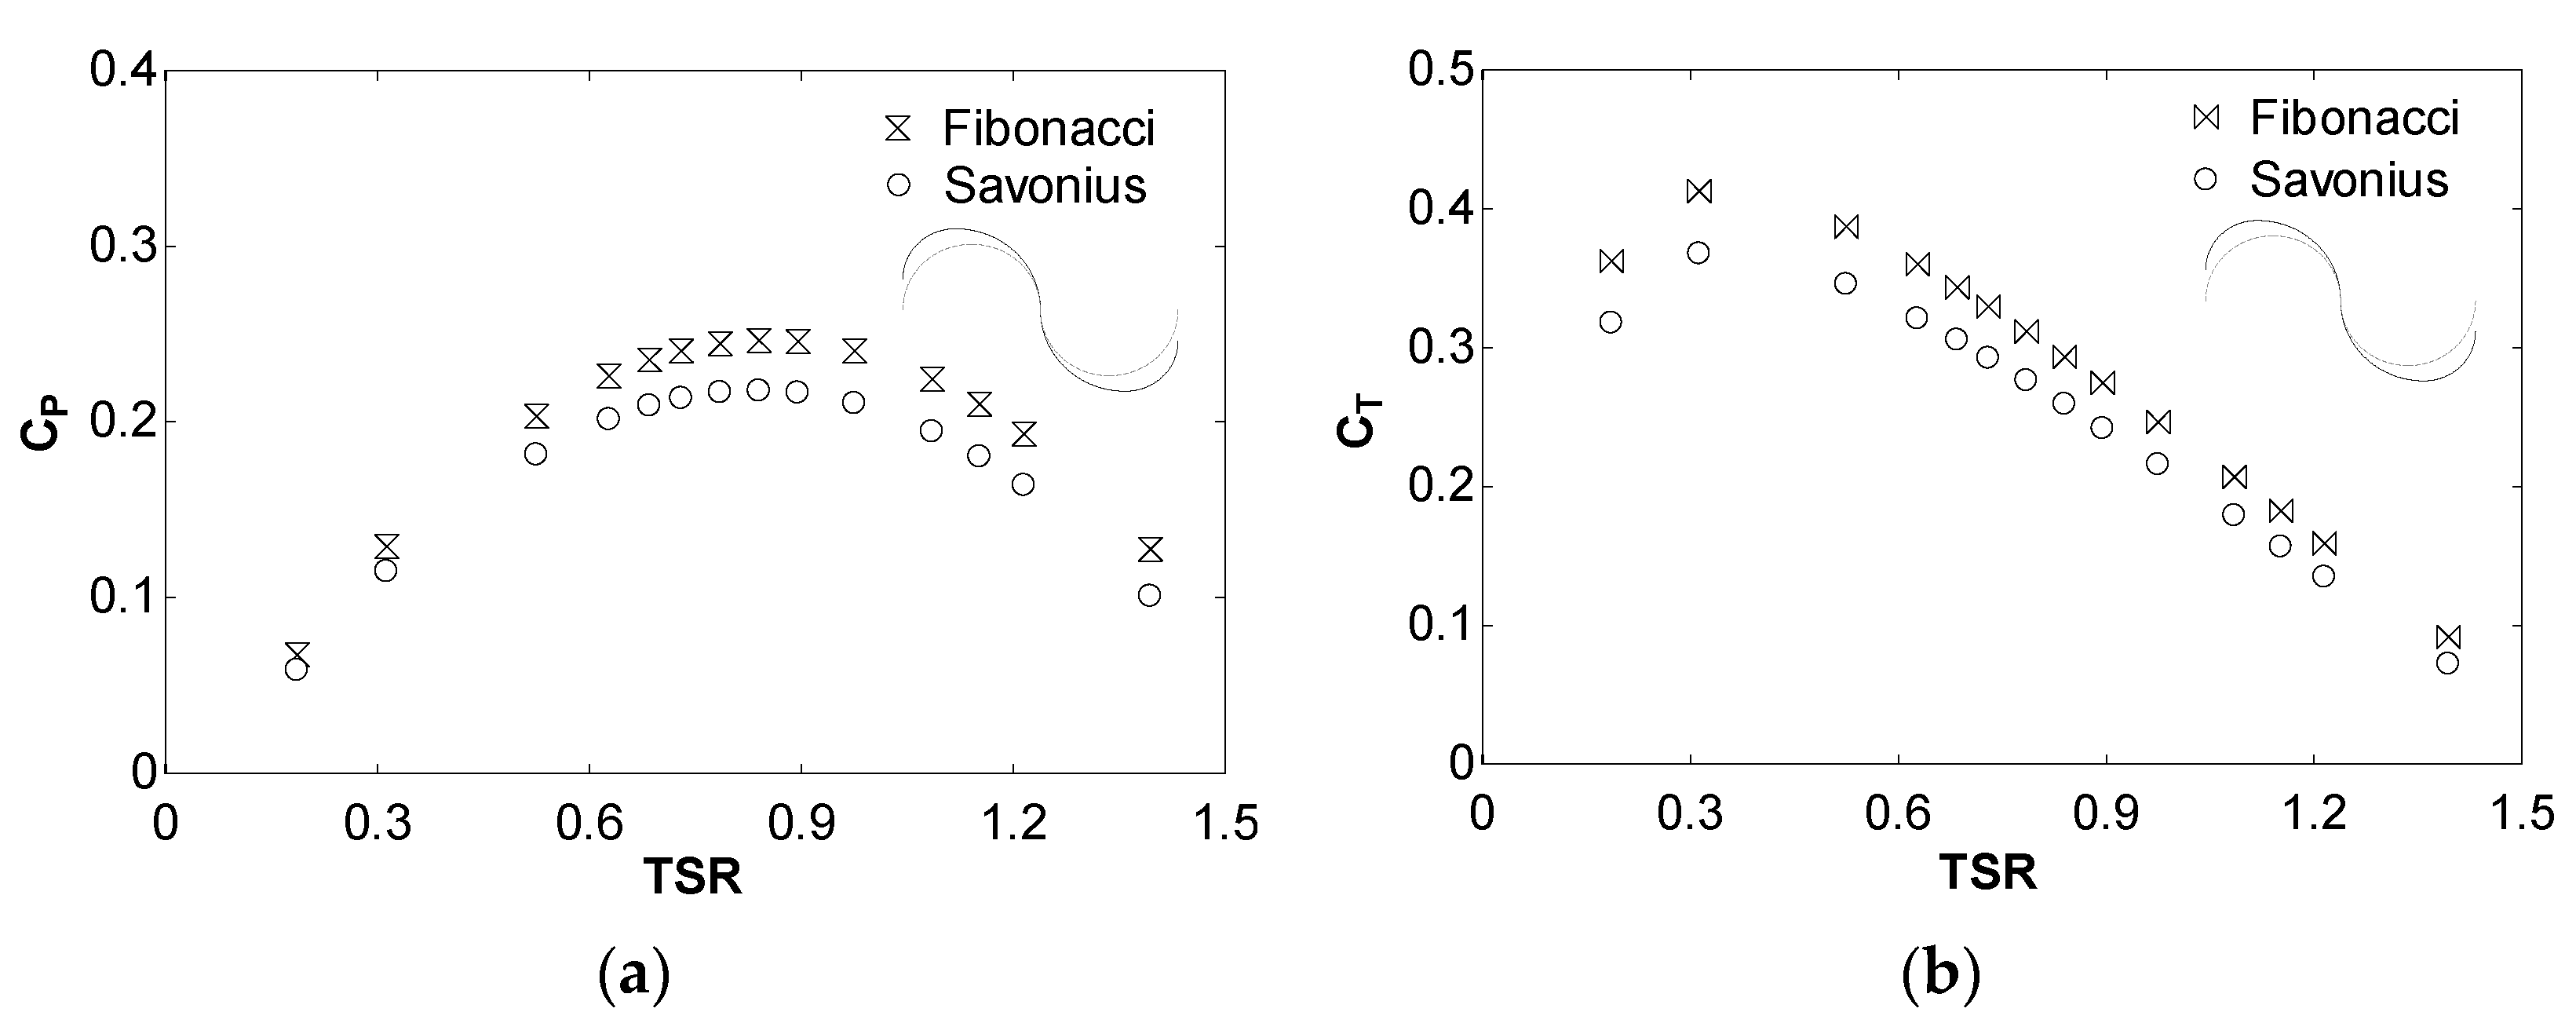
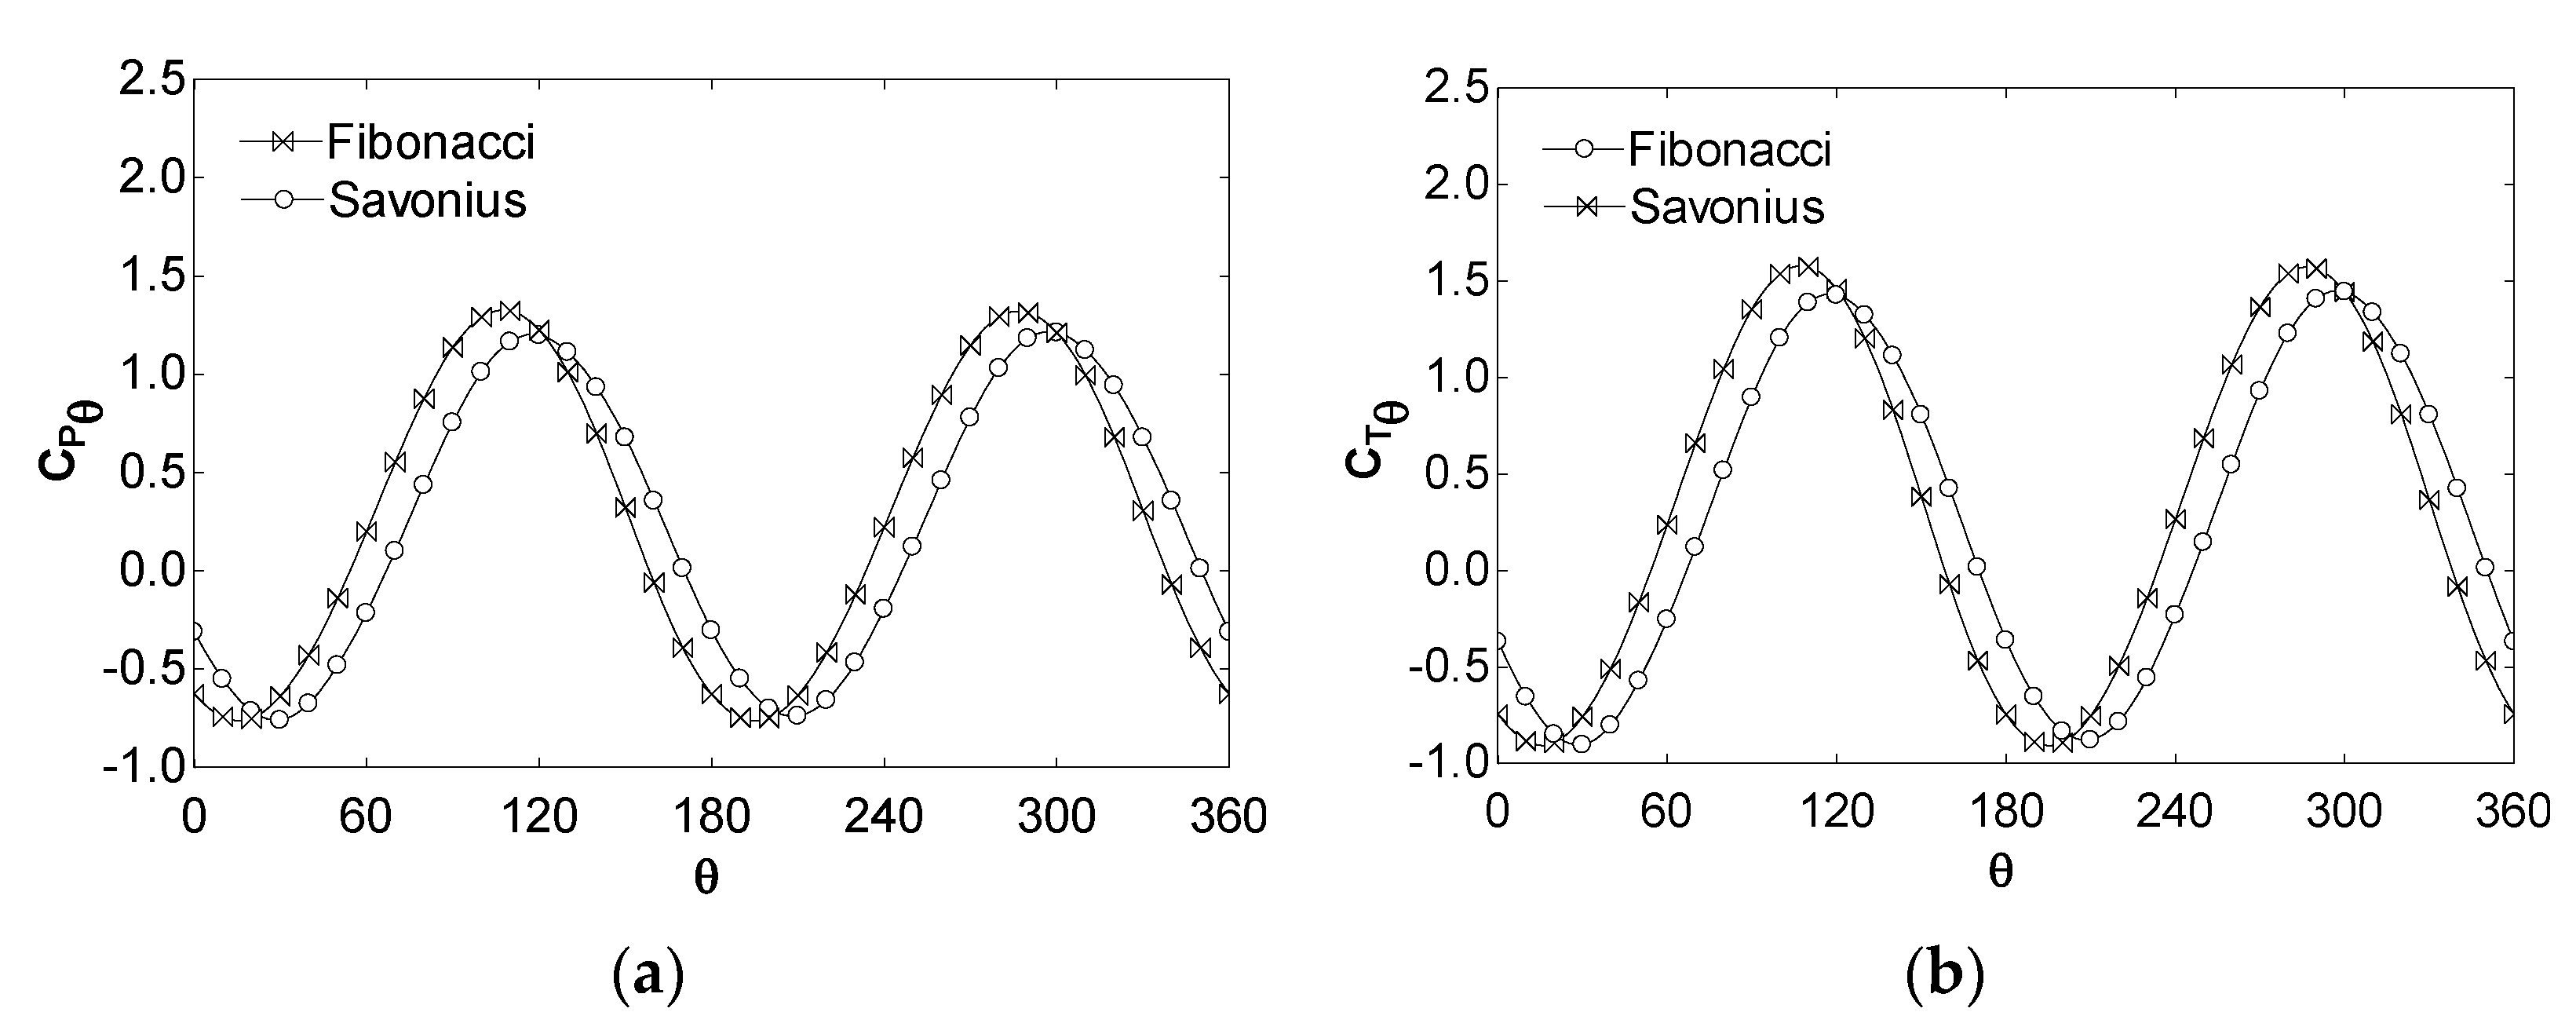
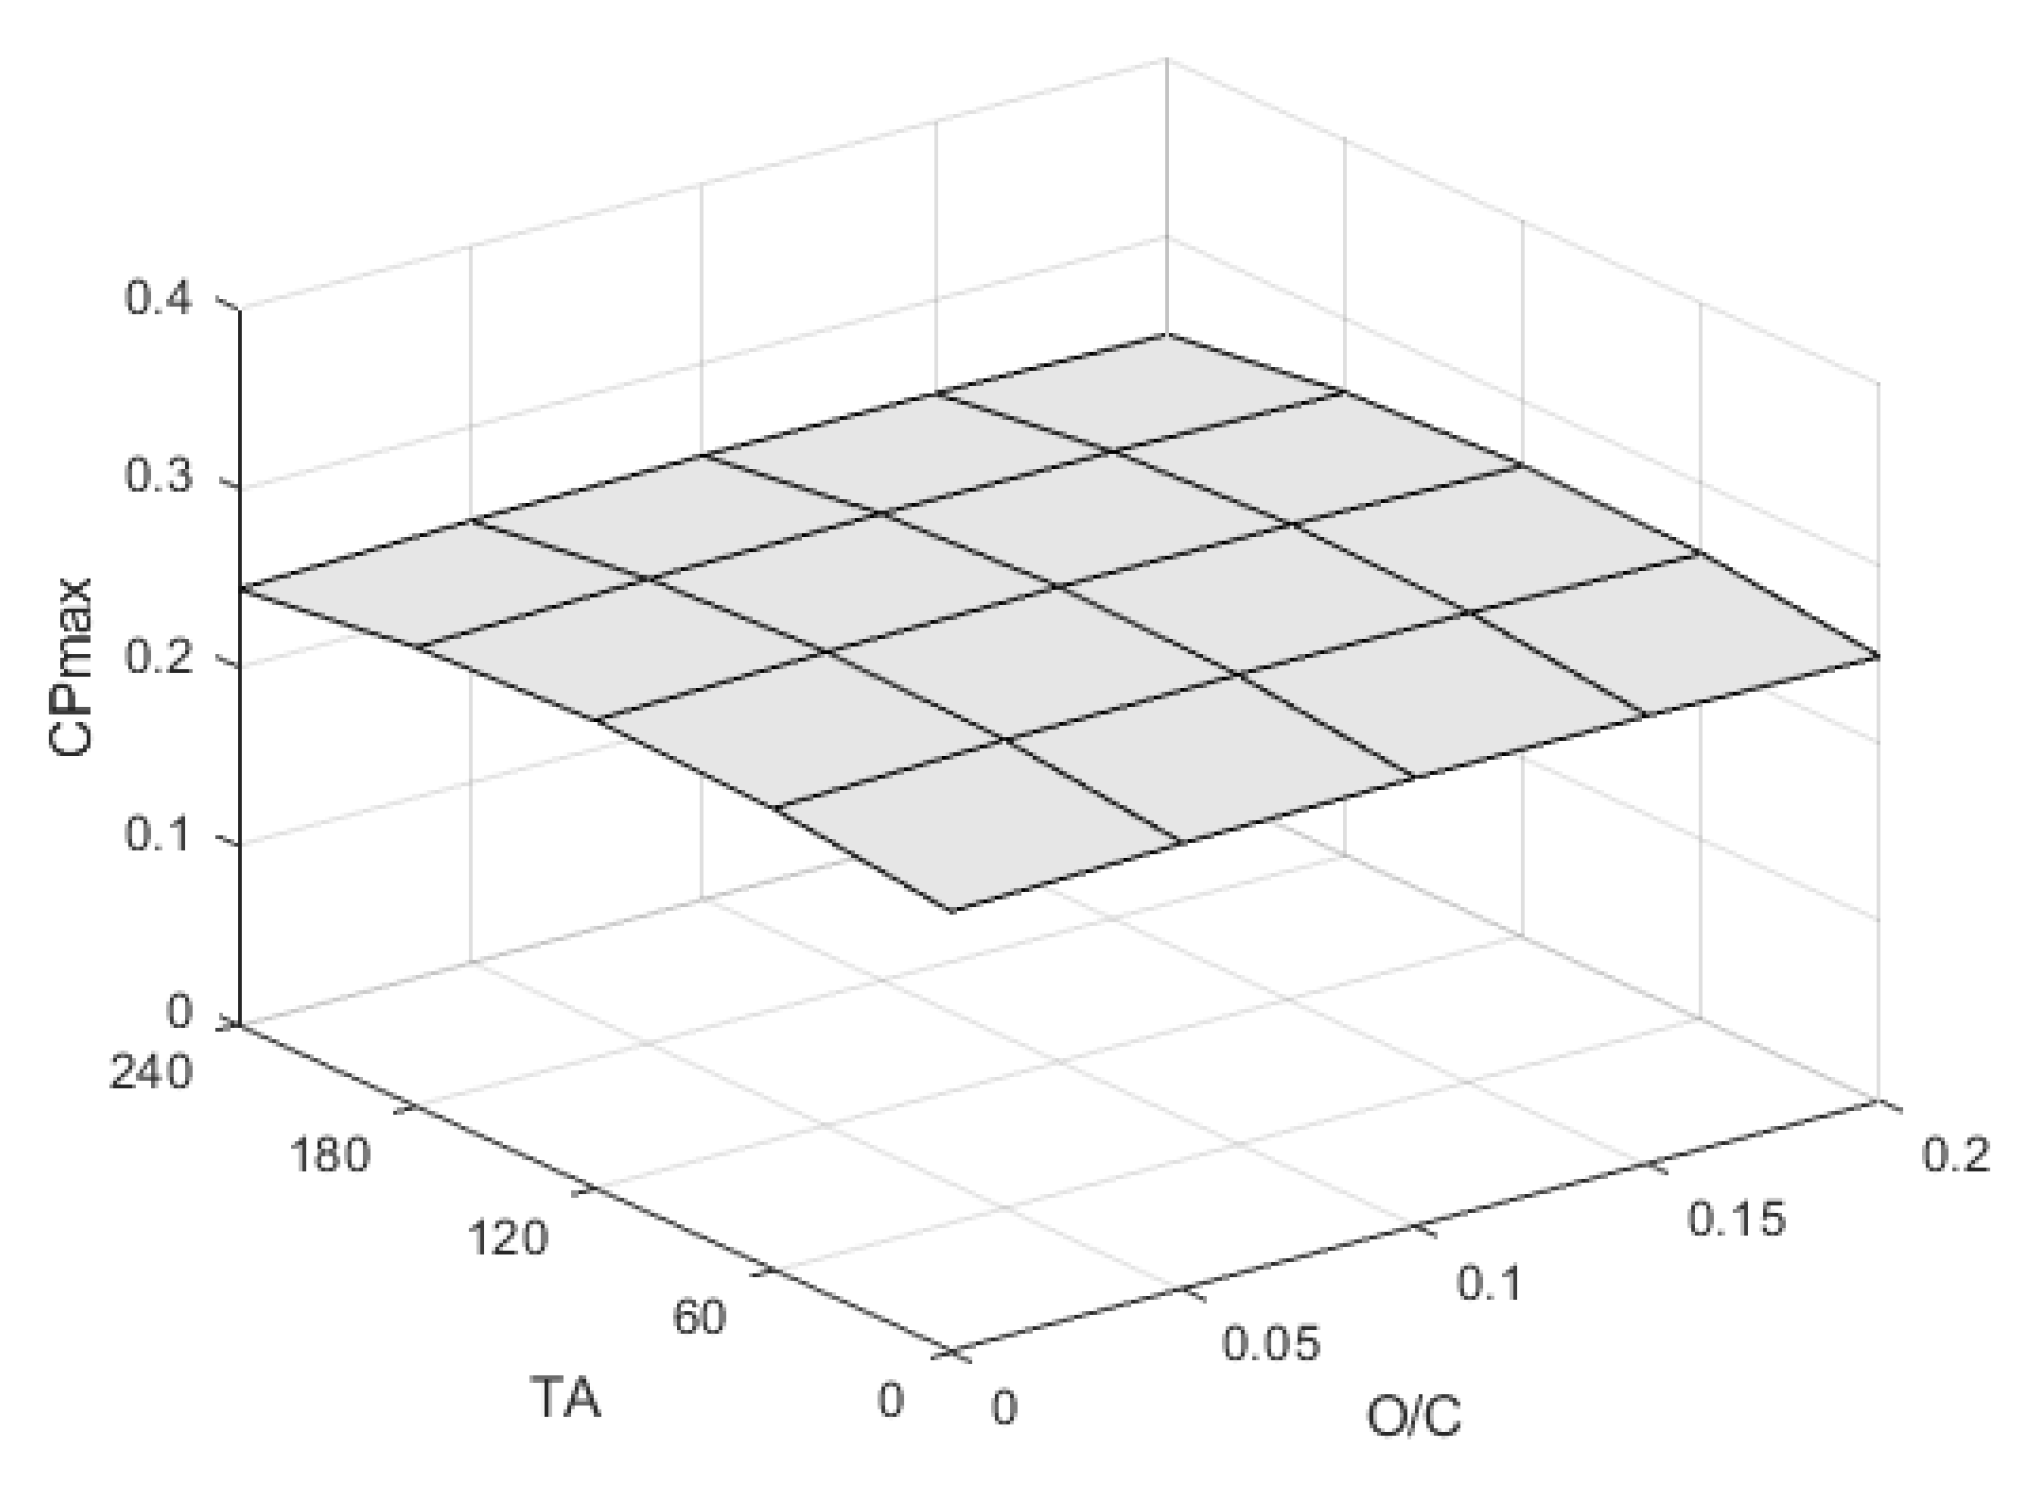
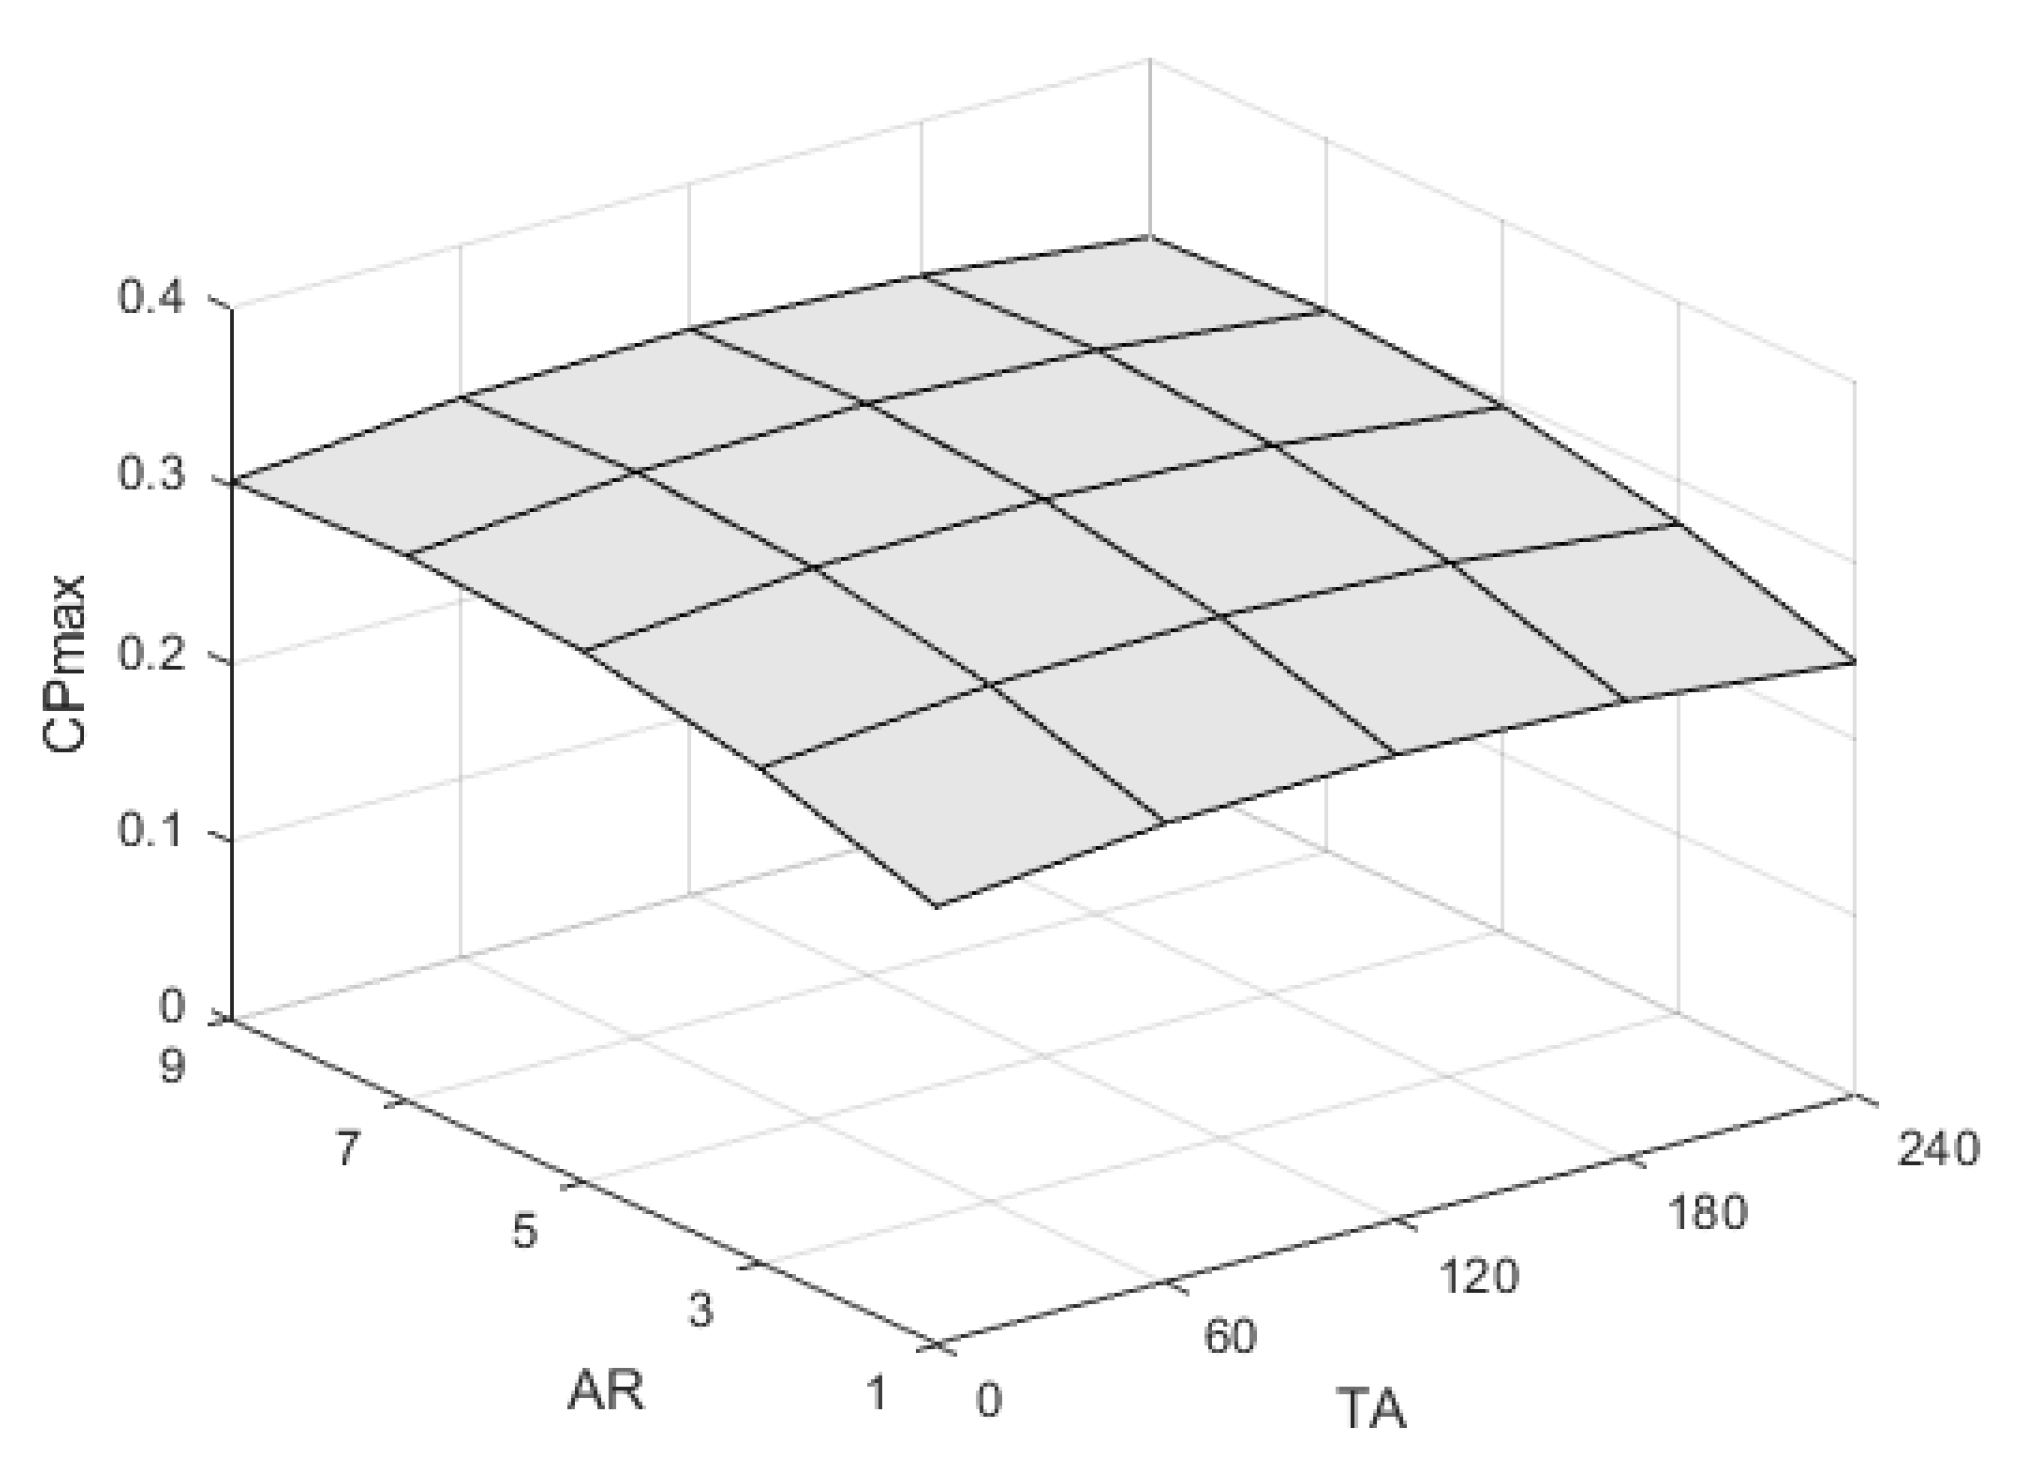
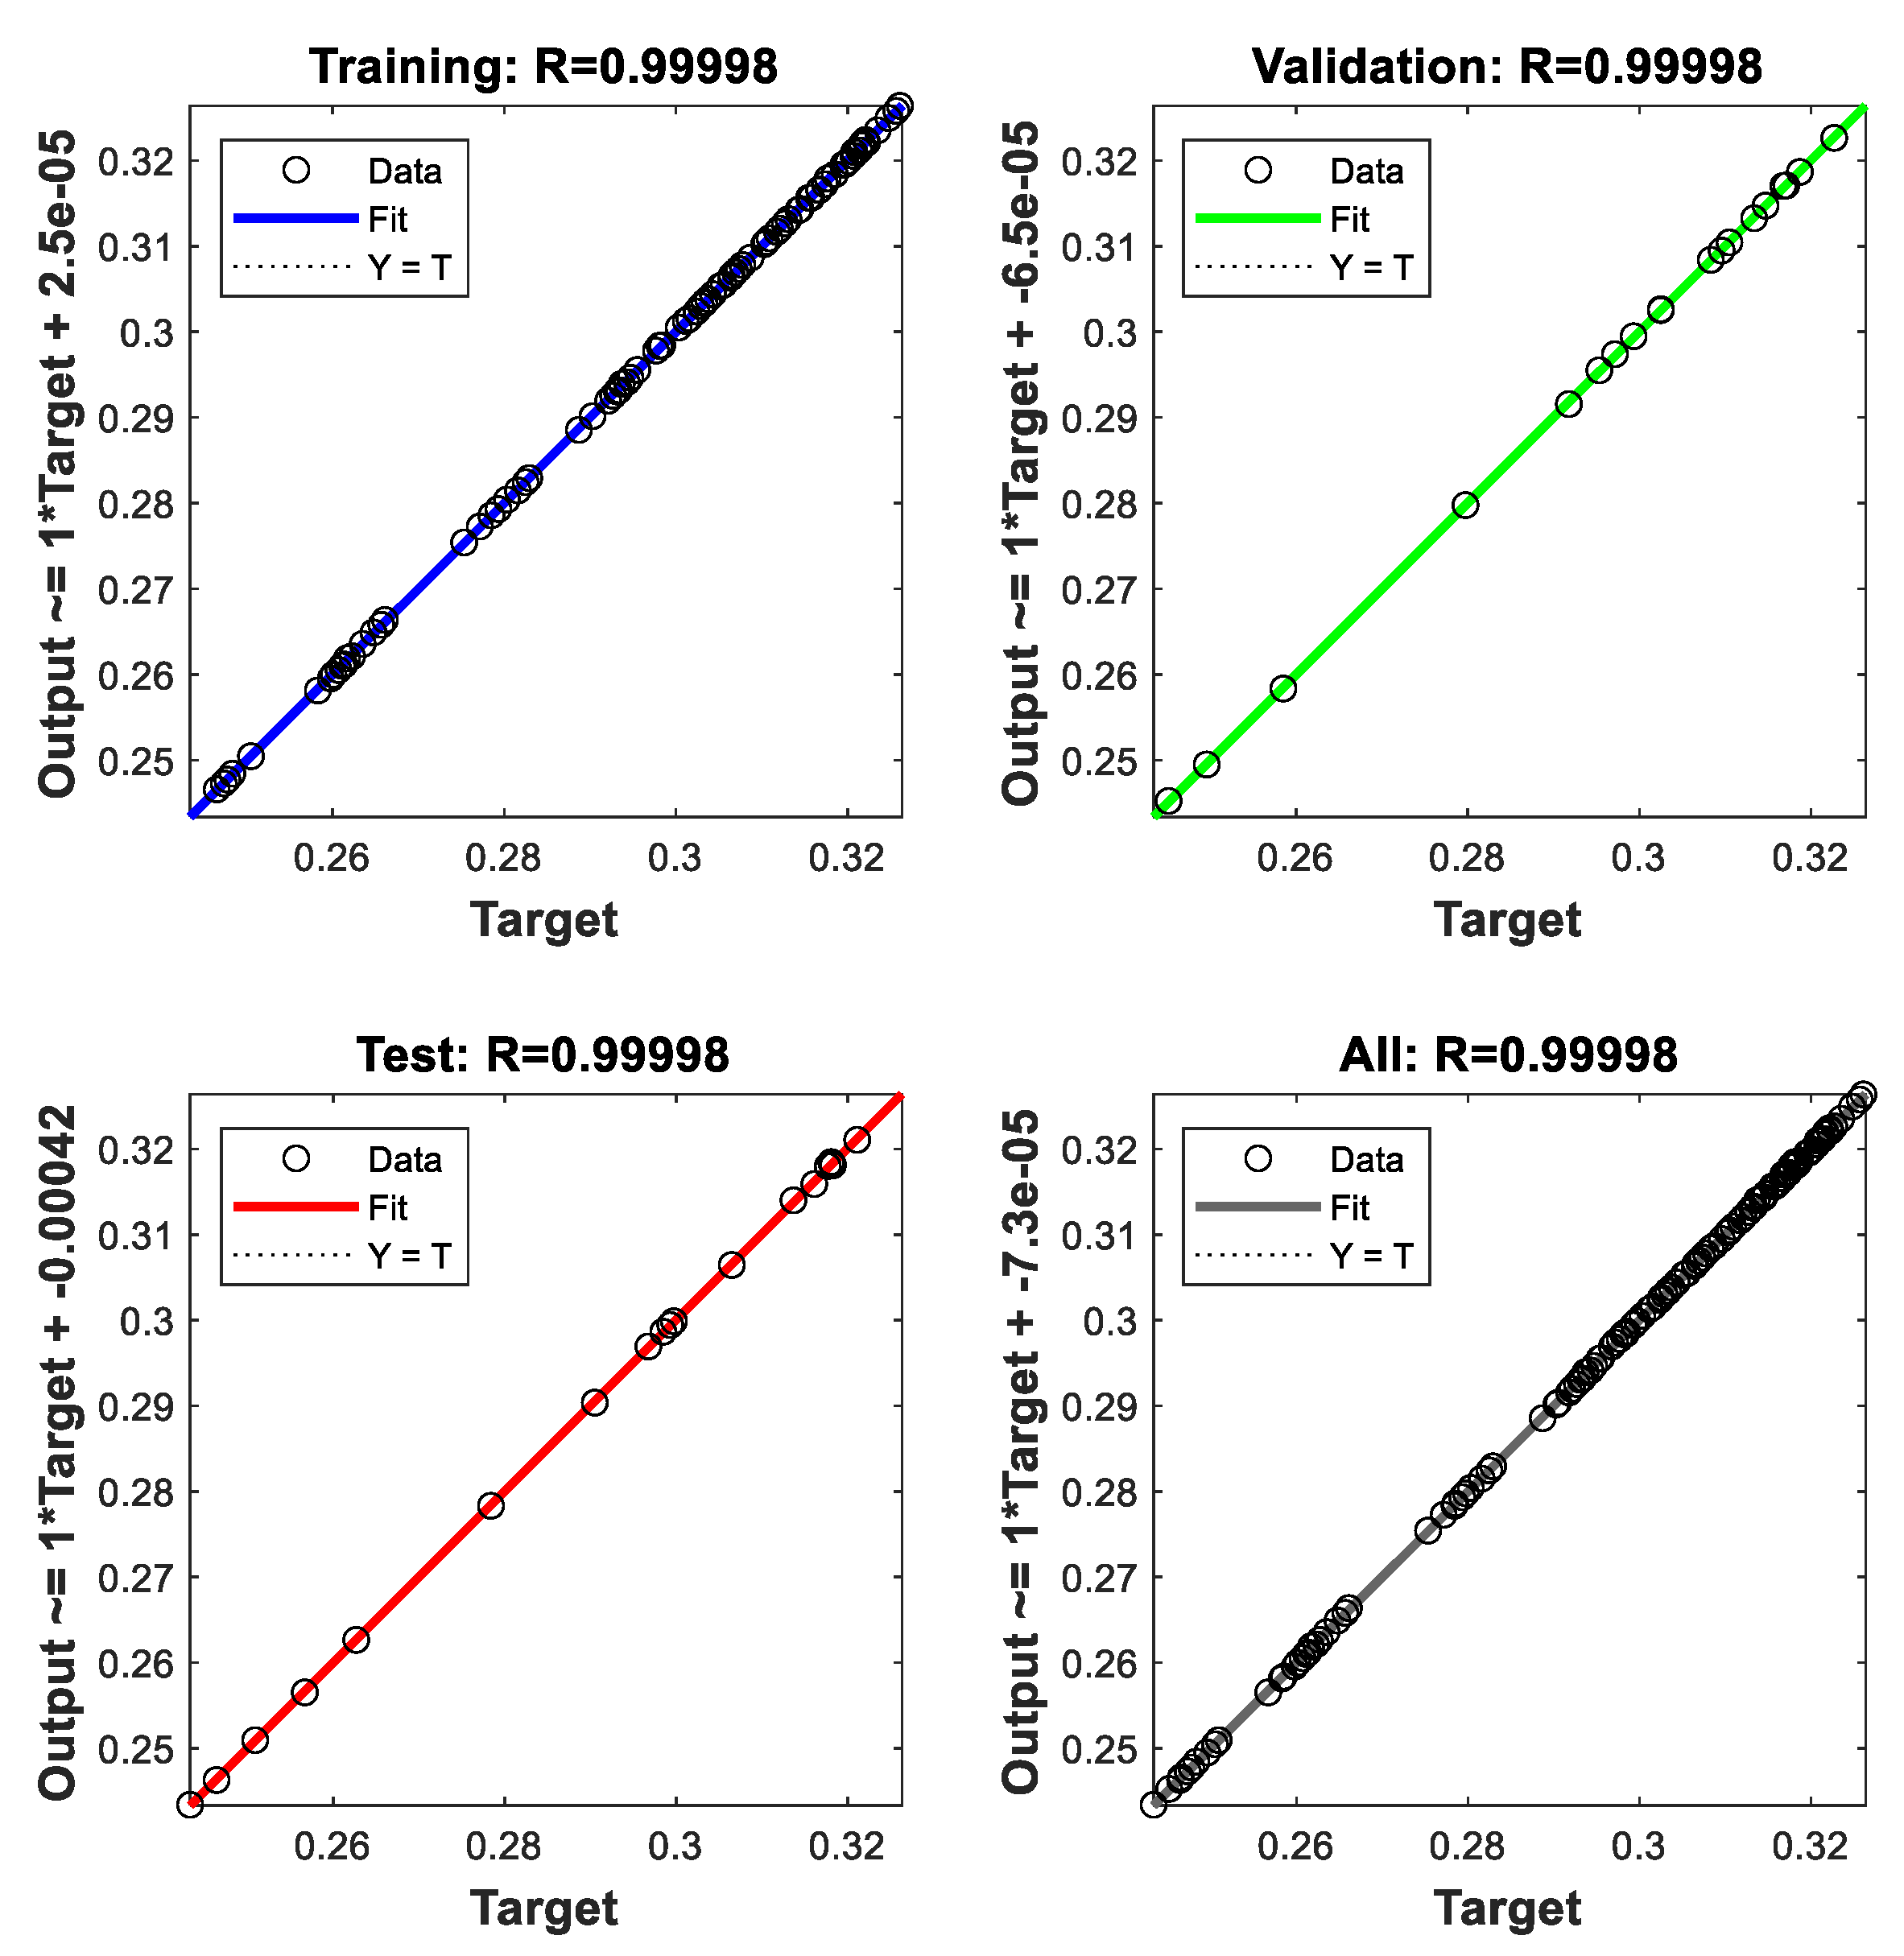
3. Results
4. Conclusions
Author Contributions
Funding
Institutional Review Board Statement
Informed Consent Statement
Conflicts of Interest
References
- Hegler, S.; Plettemeier, D. Simulative investigation of the radar cross section of wind turbines. Appl. Sci. 2019, 9, 4024. [Google Scholar] [CrossRef]
- Ding, L.; Guo, T. Numerical study on the power efficiency and flow characteristics of a new type of wind energy collection Device. Appl. Sci. 2020, 10, 7438. [Google Scholar] [CrossRef]
- Ancuti, M.C.; Musuroi, S.; Sorandaru, C.; Dordescu, M.; Erdodi, G.M. Wind turbines optimal operation at time variable wind speeds. Appl. Sci. 2020, 10, 4232. [Google Scholar] [CrossRef]
- Dolinski, L.; Krawczuk, M. Analysis of modal parameters using a statistical approach for condition monitoring of the wind turbine blade. Appl. Sci. 2020, 10, 5878. [Google Scholar] [CrossRef]
- Jessen, K.; Laugesen, K.; Mortensen, S.M.; Jensen, J.K.; Soltani, M.N. Experimental validation of aero-hydro-servo-elastic models of a scaled floating offshore wind turbine. Appl. Sci. 2019, 9, 1244. [Google Scholar] [CrossRef]
- Qi, L.; Zheng, L.; Bai, X.; Chen, Q.; Chen, J.; Chen, Y. Nonlinear maximum power point tracking control method for wind turbines considering dynamics. Appl. Sci. 2020, 10, 811. [Google Scholar] [CrossRef]
- Astolfi, D.; Castellani, F.; Berno, F.; Terzi, L. Numerical and experimental methods for the assessment of wind turbine control upgrades. Appl. Sci. 2018, 8, 2639. [Google Scholar] [CrossRef]
- Han, X.; Liu, D.; Xu, C.; Shen, W.; Li, L.; Xue, F. Monin–Obukhov similarity theory for modeling of wind turbine wakes under atmospheric stable conditions: Breakdown and modifications. Appl. Sci. 2019, 9, 4256. [Google Scholar] [CrossRef]
- Wijayanto, R.P.; Kono, T.; Kiwata, T. Performance characteristics of an orthopter-type vertical axis wind turbine in shear flows. Appl. Sci. 2020, 10, 1778. [Google Scholar] [CrossRef]
- Damota, J.; Lamas, I.; Couce, A.; Rodriguez, J. Vertical axis wind turbines: Current technologies and future trends. Renew. Energy Power Qual. J. 2015, 1, 530–535. [Google Scholar] [CrossRef]
- Alom, N.; Saha, U.K. Influence of blade profiles on Savonius rotor performance: Numerical simulation and experimental validation. Energy Convers. Manag. 2019, 186, 267–277. [Google Scholar] [CrossRef]
- Kacprzak, K.; Liskiewicz, G.; Sobczak, K. Numerical investigation of conventional and modified Savonius wind turbines. Renew. Energy 2013, 60, 578–585. [Google Scholar] [CrossRef]
- Kumar, G.; Ram, V.R.; Kumar, N. Numerical analysis of different blade profile of wind turbine. Int. J. Appl. Eng. Res. 2018, 6, 375–385. [Google Scholar]
- Benesh, A.H. Wind Turbine System Using a SAVONIUS-Type Rotor. U.S. Patent 4,715,776A, 27 February 1996. [Google Scholar]
- Mohamed, M.H.; Janiga, G.; Pap, E.; Thévenin, D. Optimal blade shape of a modified Savonius turbine using an obstacle shielding the returning blade. Energy Convers. Manag. 2011, 52, 236–242. [Google Scholar] [CrossRef]
- Chan, C.M.; Bai, H.L.; He, D.Q. Blade shape optimization of the Savonius wind turbine using a genetic algorithm. Appl. Energy 2018, 213, 148–157. [Google Scholar] [CrossRef]
- Akwa, J.V.; Vielmo, H.A.; Petry, A.P. A review on the performance of Savonius wind turbines. Renew. Sustain. Energy Rev. 2012, 16, 3054–3064. [Google Scholar] [CrossRef]
- Mahmoud, N.H.; El-Haroun, A.A.; Wahba, E.; Nasef, M.H. An experimental study on improvement of Savonius rotor performance. Alex. Eng. J. 2012, 51, 19–25. [Google Scholar] [CrossRef]
- Zhang, H.; Li, Z.; Xin, D.; Zhan, J. Improvement of aerodynamic performance of Savonius wind rotor using straight-arc curtain. Appl. Sci. 2020, 10, 7216. [Google Scholar] [CrossRef]
- Bu, L.; Du, G.; Hou, Q. Prediction of the compressive strength of recycled aggregate concrete based on artificial neural network. Materials 2021, 14, 3921. [Google Scholar] [CrossRef]
- Asteris, P.G.; Moropoulou, A.; Skentou, A.D.; Apostolopoulou, M.; Mohebkhah, A.; Cavaleri, L.; Rodrigues, H.; Varum, H. Stochastic vulnerability assessment of masonry structures: Concepts, modeling and restoration aspects. Appl. Sci. 2019, 9, 243. [Google Scholar] [CrossRef]
- Blanco, J.; Rodriguez, J.D.; Couce, A.; Lamas, M.I. Proposal of a nature-inspired shape for a vertical axis wind turbine and comparison of its performance with a semicircular blade profile. Appl. Sci. 2021, 11, 6198. [Google Scholar] [CrossRef]
- Damota, J.B.; García, J.D.D.R.; Casanova, A.C.; Miranda, J.T.; Caccia, C.G.; Galdo, M.I.L. Analysis of a nature-inspired shape for a vertical axis wind turbine. Appl. Sci. 2022, 12, 7018. [Google Scholar] [CrossRef]
- Blackwell, B.F.; Sheldahl, R.E.; Feltz, L.V. Wind Tunnel Performance Data for Two- and Three-Bucket Savonius Rotors; Sandia Laboratories: Springfield, VA, USA, 1977. [Google Scholar]
- Ross, I.J. Wind Tunnel Blockage Corrections: An Application to Vertical-Axis Wind Turbines. Master’s Thesis, University of Dayton, Dayton, OH, USA, 2010. [Google Scholar]
- Savonius, S.J. The S-rotor and its applications. Mech. Eng. 1931, 53, 333–338. [Google Scholar]
- Lamas, M.I.; Rodriguez, C.G. Hydrodynamics of biomimetic marine propulsion and trends in computational simulations. J. Mar. Sci. Eng. 2020, 8, 479. [Google Scholar] [CrossRef]
- Lamas Galdo, M.I.; Rodriguez Vidal, C.G.; Rodriguez Garcia, J.D. Optimization of the efficiency of a biomimetic marine propulsor using CFD. Ing. Investig. 2014, 34, 17–21. [Google Scholar]
- Lamas, M.I.; Rodriguez, J.D.; Rodriguez, C.G. CFD analysis of biologically-inspired marine propulsors. Brodogradnja 2012, 63, 125–133. [Google Scholar]
- Lamas, M.; Rodríguez, J.; Rodríguez, C.; González, P. Three-dimensional CFD analysis to study the thrust and efficiency of a biologically-inspired marine propulsor. Pol. Marit. Res. 2011, 18, 10–16. [Google Scholar] [CrossRef]
- Sheldahl, R.E.; Blackwell, B.F.; Feltz, L.V. Wind tunnel performance data for two- and three-bucket Savonius rotors. J. Energy 1978, 2, 160–164. [Google Scholar] [CrossRef]
- Saha, U.K.; Thotla, S.; Maity, D. Optimum design configuration of Savonius rotor through wind tunnel experiments. J. Wind Eng. Ind. Aerodyn. 2008, 96, 1359–1375. [Google Scholar] [CrossRef]
- Zhao, Z.; Zheng, Y.; Xu, X.; Liu, W.; Hu, G. Research on the Improvement of the Performance of Savonius Rotor Based on Numerical Study. In Proceedings of the 2009 International Conference on Sustainable Power Generation and Supply, Nanjing, China, 6–7 April 2009; pp. 1–6. [Google Scholar] [CrossRef]
- Bhatt, A.N.; Shrivastava, N. Application of artificial neural network for internal combustion engines: A state of the art review. Arch. Comput. Methods Eng. 2022, 29, 897–919. [Google Scholar] [CrossRef]
- Özcan, E.; Danışan, T.; Yumuşak, R.; Eren, T. An artificial neural network model supported with multi criteria decision making approaches for maintenance planning in hydroelectric power plants. Eksploat. Niezawodność.-Maint. Reliab. 2020, 22, 400–418. [Google Scholar] [CrossRef]
- Golmohammadi, D. Neural network application for fuzzy multi-criteria decision making problems. Int. J. Prod. Econ. 2011, 131, 490–504. [Google Scholar] [CrossRef]
- Lamas Galdo, M.I.; Telmo Miranda, J.; Rebollido Lorenzo, J.M.; Caccia, C.G. Internal modifications to optimize pollution and emissions of internal combustion engines through multiple-criteria decision-making and artificial neural networks. Int. J. Environ. Res. Public Health 2021, 18, 12823. [Google Scholar] [CrossRef] [PubMed]
- Rodriguez, C.G.; Lamas, M.I.; Rodriguez, J.D.; Abbas, A. Analysis of the pre-injection system of a marine diesel engine through multiple-criteria decision-making and artificial neural networks. Pol. Marit. Res. 2022, 28, 88–96. [Google Scholar] [CrossRef]
- Sietsma, J.; Dow, R.J.R. Creating artificial neural networks that generalize. Neural Netw. 1991, 4, 67–79. [Google Scholar] [CrossRef]
- Yuan, Z.; Shi, X.; Jiang, D.; Liang, Y.; Mi, J.; Fan, H. Data-based engine torque and NOx raw emission prediction. Energies 2022, 15, 4346. [Google Scholar] [CrossRef]


| Parameter | Value |
|---|---|
| Diameter (m) | 1 |
| Height (m) | 1 |
| Number of blades | 2 |
| Overlap (m) | 0 |
| Separation gap (m) | 0 |
| Twist angle (°) | 0 |
| AR | O/C | TA | Cpmax | |
|---|---|---|---|---|
| Base case | 1 | 0 | 0 | 0.2465 |
| Optimum | 7.5 | 0.1125 | 112 | 0.3263 |
Publisher’s Note: MDPI stays neutral with regard to jurisdictional claims in published maps and institutional affiliations. |
© 2022 by the authors. Licensee MDPI, Basel, Switzerland. This article is an open access article distributed under the terms and conditions of the Creative Commons Attribution (CC BY) license (https://creativecommons.org/licenses/by/4.0/).
Share and Cite
Blanco Damota, J.; Rodríguez García, J.d.D.; Couce Casanova, A.; Telmo Miranda, J.; Caccia, C.G.; Galdo, M.I.L. Optimization of a Nature-Inspired Shape for a Vertical Axis Wind Turbine through a Numerical Model and an Artificial Neural Network. Appl. Sci. 2022, 12, 8037. https://doi.org/10.3390/app12168037
Blanco Damota J, Rodríguez García JdD, Couce Casanova A, Telmo Miranda J, Caccia CG, Galdo MIL. Optimization of a Nature-Inspired Shape for a Vertical Axis Wind Turbine through a Numerical Model and an Artificial Neural Network. Applied Sciences. 2022; 12(16):8037. https://doi.org/10.3390/app12168037
Chicago/Turabian StyleBlanco Damota, Javier, Juan de Dios Rodríguez García, Antonio Couce Casanova, Javier Telmo Miranda, Claudio Giovanni Caccia, and María Isabel Lamas Galdo. 2022. "Optimization of a Nature-Inspired Shape for a Vertical Axis Wind Turbine through a Numerical Model and an Artificial Neural Network" Applied Sciences 12, no. 16: 8037. https://doi.org/10.3390/app12168037
APA StyleBlanco Damota, J., Rodríguez García, J. d. D., Couce Casanova, A., Telmo Miranda, J., Caccia, C. G., & Galdo, M. I. L. (2022). Optimization of a Nature-Inspired Shape for a Vertical Axis Wind Turbine through a Numerical Model and an Artificial Neural Network. Applied Sciences, 12(16), 8037. https://doi.org/10.3390/app12168037