Article

Optimization of a Nature-Inspired Shape for a Vertical Axis Wind Turbine through a Numerical Model and an Artificial Neural Network

by
Javier Blanco Damota
1,
Juan de Dios Rodríguez García
1,
Antonio Couce Casanova
1,
Javier Telmo Miranda
2,
Claudio Giovanni Caccia
3 and
María Isabel Lamas Galdo
1,*
1
Escuela Politécnica de Ingeniería de Ferrol, Universidade da Coruña, 15403 Ferrol, Spain
2
Escuela Técnica Superior de Ingenieros Industriales, Universidad Nacional de Educación a Distancia (UNED), 28040 Madrid, Spain
3
Department of Aerospace Engineering, Politecnico di Milano, 20156 Milan, Italy
*
Author to whom correspondence should be addressed.
Appl. Sci. 2022, 12(16), 8037; https://doi.org/10.3390/app12168037
Submission received: 23 July 2022 / Revised: 6 August 2022 / Accepted: 8 August 2022 / Published: 11 August 2022
(This article belongs to the Special Issue Numerical Modeling in Energy and Environment)

Abstract

:
The present work proposes an artificial neural network (ANN) to analyze vertical axis wind turbines of the Savonius type. These turbines are appropriate for low wind velocities due to their low starting torque. Nevertheless, their efficiency is too low. In order to improve the efficiency, several modifications are analyzed. First of all, an innovative blade profile biologically inspired is proposed. After that, the influence of several parameters such as the aspect ratio, overlap, and twist angle was analyzed through a CFD (computational fluid dynamics) model. In order to characterize the most appropriate combination of aspect ratio, overlap, and twist angle, an artificial neural network is proposed. A data set containing 125 data points was obtained through CFD. This data set was used to develop the artificial neural network. Once established, the artificial neural network was employed to analyze 793,881 combinations of different aspect ratios, overlaps, and twist angles. It was found that the maximum power coefficient, 0.3263, corresponds to aspect ratio 7.5, overlap/chord length ratio 0.1125, and twist angle 112°. This corresponds to a 32.4% increment in comparison to the original case analyzed with aspect ratio 1, overlap 0, and twist angle 0.

1. Introduction

Nowadays, energy demand is constantly increasing. Finite resources such as fossil fuels are being depleted, and global pollution is reaching alarming levels. These facts lead to the current necessity to urgently implement renewable resources. In this regard, wind energy plays a crucial role in the decarbonization process of society [1,2,3,4] and constitutes the most relevant energy contributor to the renewable sector [5]. Depending on the orientation of the rotation axis, wind turbines can be categorized into HAWTs (horizontal axis wind turbines) and VAWTs (vertical axis wind turbines). HAWTs are the most employed ones, mainly installed in high-power wind farms. An important disadvantage is that HAWTs are too dependent on wind conditions [6,7,8]. On the other hand, VAWTs are less common but also interesting due to their capacity to capture wind from all directions and their acceptable performance under poor wind conditions. These characteristics make VAWTs appropriate for small power generation applications, especially in urban environments [9]. VAWTs are basically categorized into Darrieus (based on lift) and Savonius (based on drag). The Savonius VAWTs are recommended when the wind velocity is low due to their lower starting torque, i.e., they need lower wind velocities to start [10]. Nevertheless, the efficiency of the Savonius turbine is lower than the Darrieus turbine. In order to increment the efficiency of the Savonius turbine, several parameters have been analyzed in the literature. Several augmentation techniques have been proposed, such as nozzles, deflectors, guide vanes, end plates, etc. Another improvement of the Savonius turbine relies on the blade profile. Some authors proposed modifications to the semicircular blade profile [11,12,13,14,15,16]. The efficiency can also be increased through some parameters related to the rotor design, such as the aspect ratio (AR), overlap (O), separation gap (SG), twist angle (TA), number of blades, etc. [17,18,19]. Figure 1a illustrates a 3D view of a Savonius turbine. It is composed of semicircular blades vertically positioned along the rotation axis. The O is the distance that an inside edge penetrates into another. The SG is the width separating the inside edges of the blades. The TA is the angle between the upper and lower sections of the blades. The turbine shown in Figure 1a has a zero value of AR, O, SG, and TA. The AR, O, and SG are illustrated in Figure 1b and the TA in Figure 1c. The AR is the relation between the height and the diameter, AR = H/D.
Unfortunately, the relations between these parameters and the efficiency are too complex, and there is no analytical relation between them. The determination of the most appropriate combination of AR, SG, O, etc., is a complex nonlinear problem and there is a huge number of combinations. Because of this, a tool is required to efficiently predict the power output. In this regard, artificial neural networks (ANNs) may constitute a useful solution for these types of problems. In fact, ANNs are recommended for problems that are too complex to solve and where enough data can be obtained. The principle of operation of ANNs consists of simulating the biological neuron structure and learning capacity. ANNs employ artificial neurons similarly to biological neurons in the human brain. Through the training process, an ANN takes the input/s variable/s and inter-relates them to obtain the output/s variable/s. An important advantage is that a well-trained ANN is too fast to predict the output variable/s. ANNs are able to learn the relationships between the inputs and outputs and provide output predictions with a higher accurate prediction than traditional methods [20,21]. The nonlinear application of ANNs enables them to address many problems that are very difficult to be modeled mathematically. ANNs avoid complex physical and/or mathematical models. In recent years, ANNs have been widely used in many fields, such as engineering, science, economy, etc.
After analyzing several models and taking into account the tendency observed in the literature, the present work proposes a nature-inspired blade profile to be used in VAWTs, particularly a blade profile inspired by Fibonacci’s spiral, based in turn on Fibonacci’s mathematical sequence. This is presented in many nature scenes, such as the formation of some flowers and fruits, hurricanes, and even the galaxies with their rotation movements. In a previous work [22], the Fibonacci shape was proposed to improve the efficiency of the conventional Savonius turbine. Subsequently, the effect of the number of blades, aspect ratio, overlap, separation gap, and twist angle was illustrated [23], but a method to obtain the most appropriate combination of these parameters was not proposed. In order to solve this issue, the preset work proposes to employ an ANN to obtain the most appropriate combination of parameters. In total, 125 training data points were used to develop the ANN, and this dataset was obtained through CFD simulations. The ANN predicts the power coefficient and was employed to analyze 793,881 cases. The maximum power coefficient of these alternatives was extracted and proposed as the most appropriate option.
The main objectives of the present work are:
-
Proposing an innovative blade profile for a Savonius-type VAWT based on the Fibonacci spiral.
-
Carrying out a CFD model validated with experimental measurements in order to provide 125 data to establish an ANN.
-
Establishing an ANN to analyze 793,881 possible combinations of aspect ratio, overlap, and twist angle and determine the most appropriate combination of all these cases considered.
The remainder of this paper is structured as follows. Section 2 describes the methodology employed in the numerical model and the ANNs. Section 3 presents the results obtained and a discussion about them. Finally, the conclusions of this work are indicated in Section 4.

2. Materials and Methods

This section describes the CFD model employed to obtain the data used to train the ANN and its corresponding validation using experimental results. Moreover, the advantages of the new blade profile are illustrated. After that, the methodology used to establish the ANN is described.

2.1. CFD Analysis

The CFD procedure carried out to simulate the VAWT was described in a previous paper [23]. For this reason, it will be briefly described herein. The model is based on the RANS equations of conservation of mass and momentum. The turbulence was treated through the SST k-ω turbulence model. The software OpenFOAM was employed. An important step in the CFD analysis was the validation process. To this end, data obtained by Sandia laboratories [24] were employed. These experiments are based on the turbine shown in Figure 1a. The main characteristics are listed in Table 1. This turbine has two blades, 1 m diameter, 1 m height, 0 overlap, 0 separation gap, and 0 twist angle. Two end plates were added to reduce the escape of air from the blades.
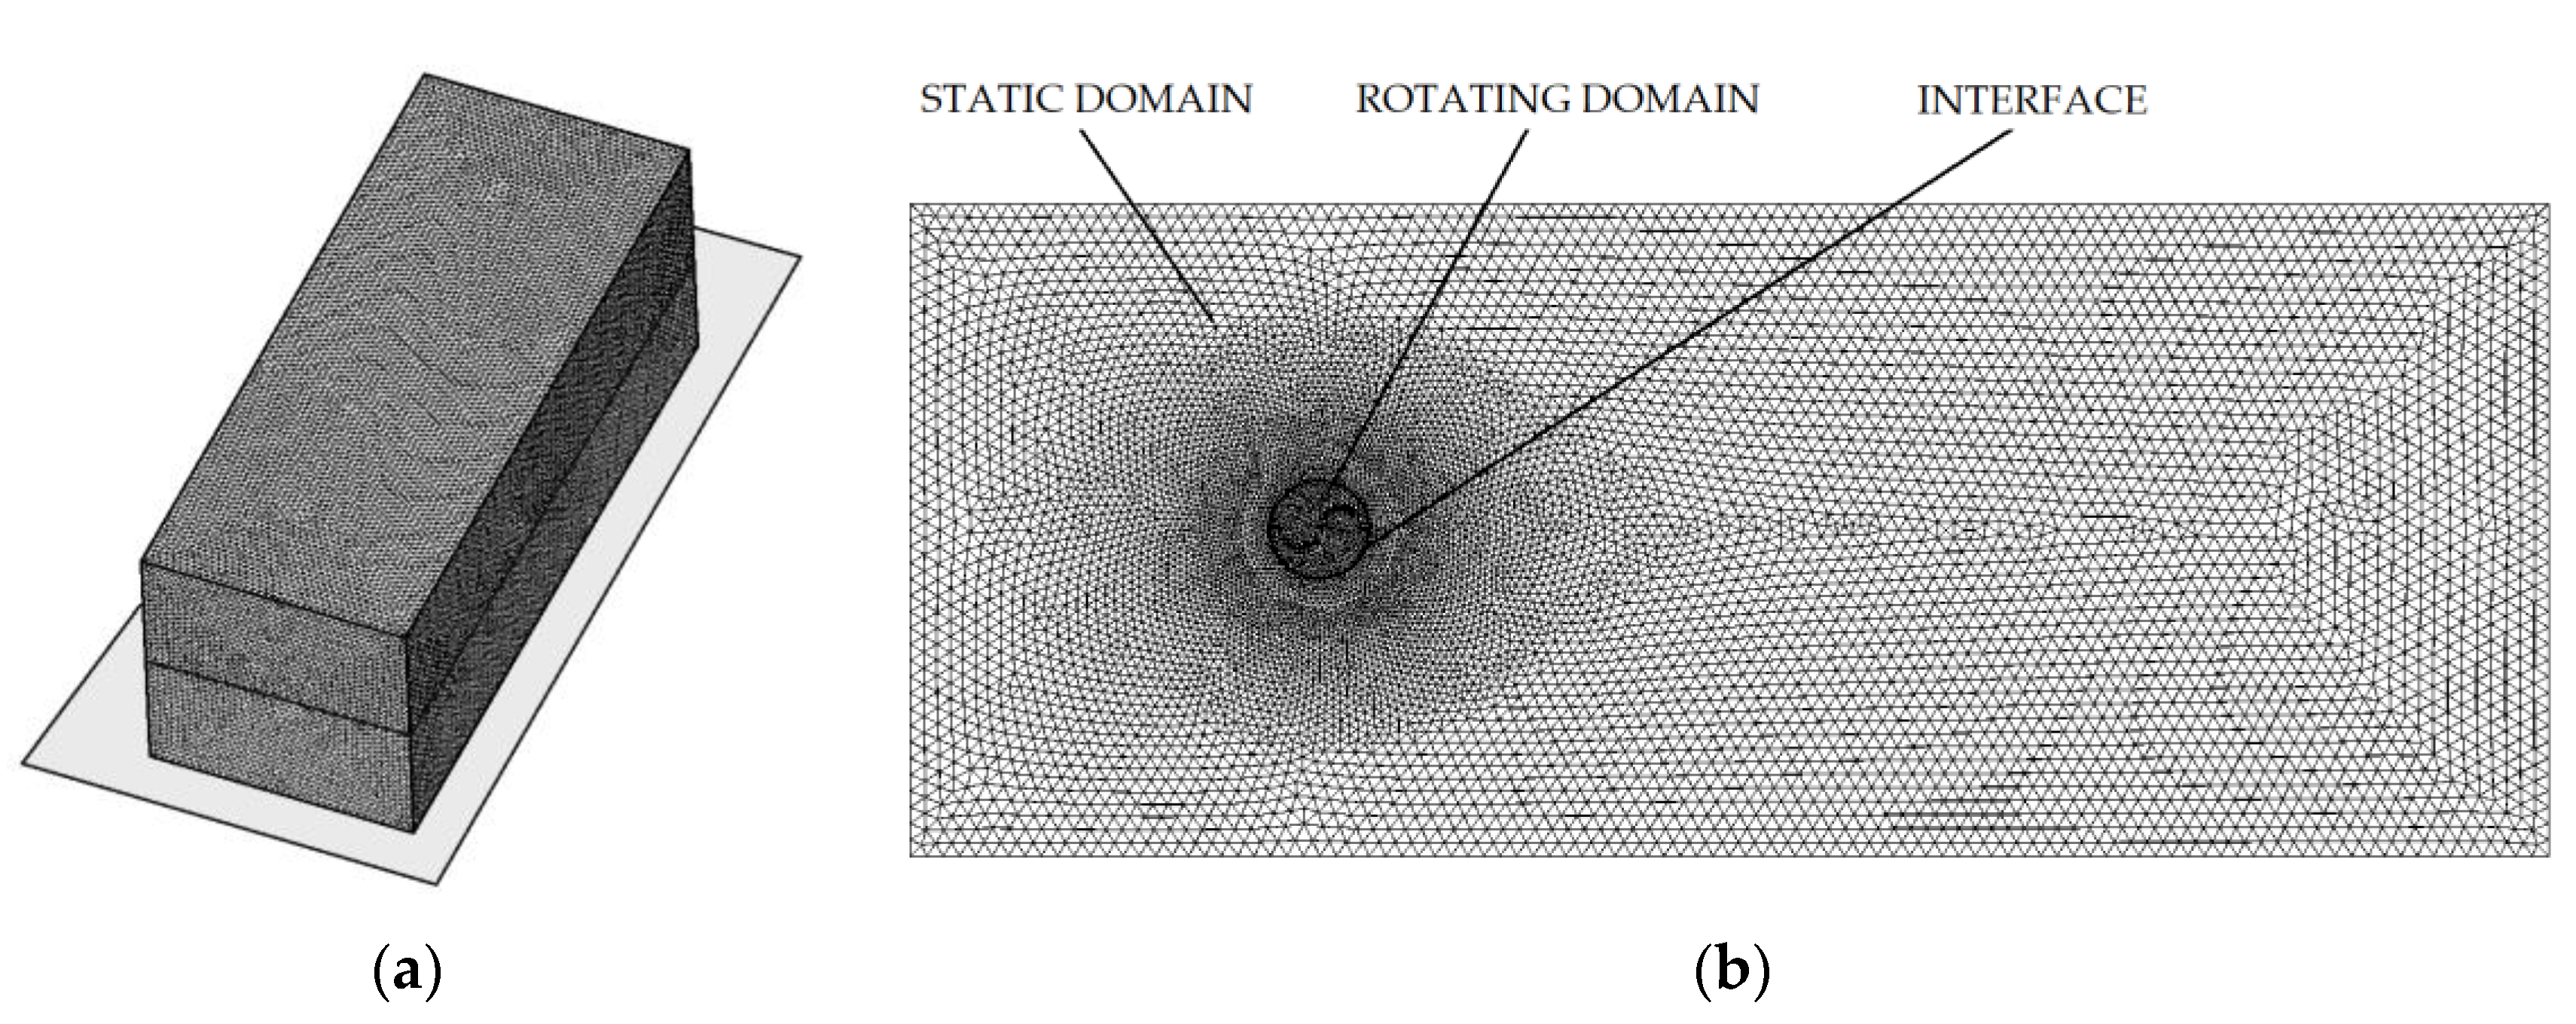
The mesh employed is shown in Figure 2. Two zones are differenced: static and rotating. The static domain is almost the whole region, while the rotating domain is a cylinder that rotates according to the rotational velocity. The turbine is placed inside the rotating domain. Regarding boundary conditions, a velocity inlet was modeled on the upstream face, while the downstream face was modeled as an outlet. The exterior faces were assumed to free sleep and the turbine surface was modeled as no-slip.
A comparison between the experimental and numerical results is shown in Figure 3. Particularly, Figure 3a shows the power coefficient (CP) and Figure 3b compares the torque coefficient (CT) against the tip speed ratio (TSR). These parameters represent the non-dimensioned form of the rotational velocity, power, and torque, and are given by Equations (1)–(3), respectively. In these equations, V is the free-stream velocity, ω the rotational speed, P the power, ρ the density of air, ν the kinematic viscosity of air, S the cross-section area (S = DH), and T the torque. Figure 3 shows an adequate concordance between experimental and numerical results. Several reasons are responsible for the differences between experimental and numerical data. First of all, CFD is an approximate method and unavoidable errors are introduced due to the discretization processes and hypotheses realized to simplify the model. On the other hand, experimental measurements are affected by the tolerance of the apparatus employed. Moreover, another important source of error is the blockage effect. This effect is produced when a sample is placed in the test section of a wind tunnel; the sample alters the current velocity. Several methods can be found in the literature to correct this modified current velocity, but significant differences can be obtained using different methods [25].
TSR = blade   tip   tangential   velocity wind   speed = ω R V
C P = power available   power = P 0.5 ρ SV 3
C T = torque available   torque = T 0.25 ρ SV 2 D
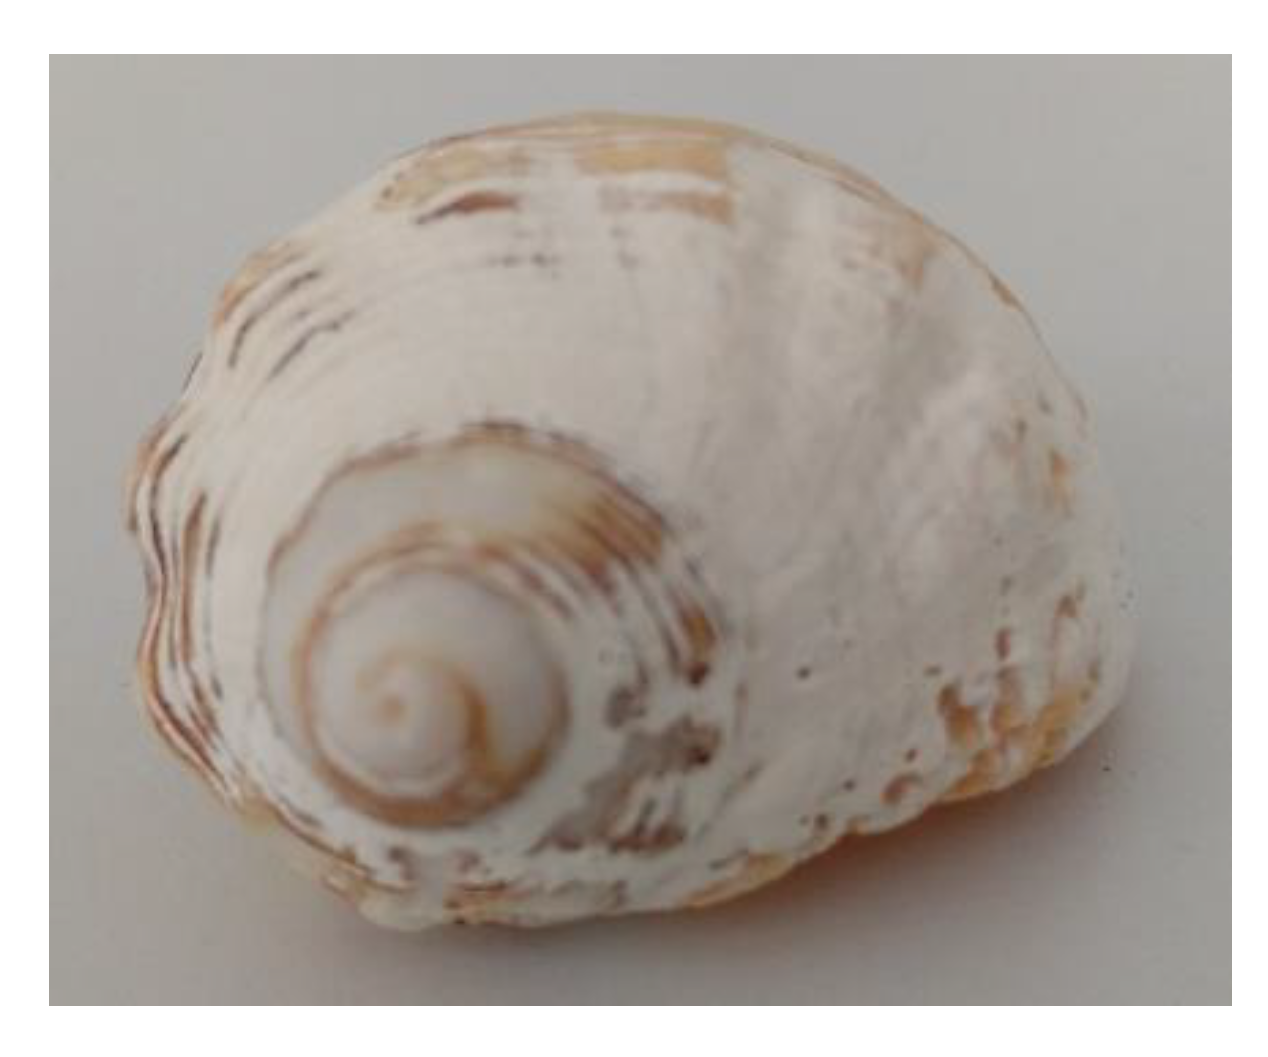
Once the model was validated, the first improvement proposed in the present work is to modify the semicircular blade profile originally proposed by Sigur Savonius [26]. The nature-inspired Fibonacci spiral is proposed to this end. This shape is highly presented in nature in animals, plants, and several natural phenomena—Figure 4. Since this shape is the result of thousands of centuries of evolution, it is reasonable to propose this geometry for VAWT Savonius-type turbines. It is worth mentioning that some of the authors of the present work have previously proposed bioinspired shapes to be applied in engineering mechanisms with successful results [27,28,29,30].
The Fibonacci spiral is composed of quarter circumferences. The higher the consecutive terms, the closer the relationship is to the so-called divine proportion or golden ratio, i.e., the terms Rn−1 and Rn shown in Figure 5a tend to the relation Rn−1/Rn = 1.61803398874896… if Rn−1 and Rn are high enough. The resulting turbine is shown in Figure 5b. This ratio between two consecutive terms comes from dividing a segment into two parts, a and b, where a is longer than b, and the relation between the total length to a is the relation between a and b, as shown in Figure 5c. The resulting succession is 0, 1, 1, 2, 3, 5, 8, 13, 21, 34, 55, 89, etc. The first terms of this succession do not fulfill the divine proportion, but they are closer to the divine proportion as higher are the terms.
According to Figure 5c, and taking into account that a must be a positive number, the length of a is obtained through the following development:
a + b a = a b a 2 = a b + b 2 a = b + b 2 + 4 b 2
And the relation between a and b, i.e., the divine proportion or golden ratio is:
a b = 1 + 1 + 4 2 = 1.61803398874896
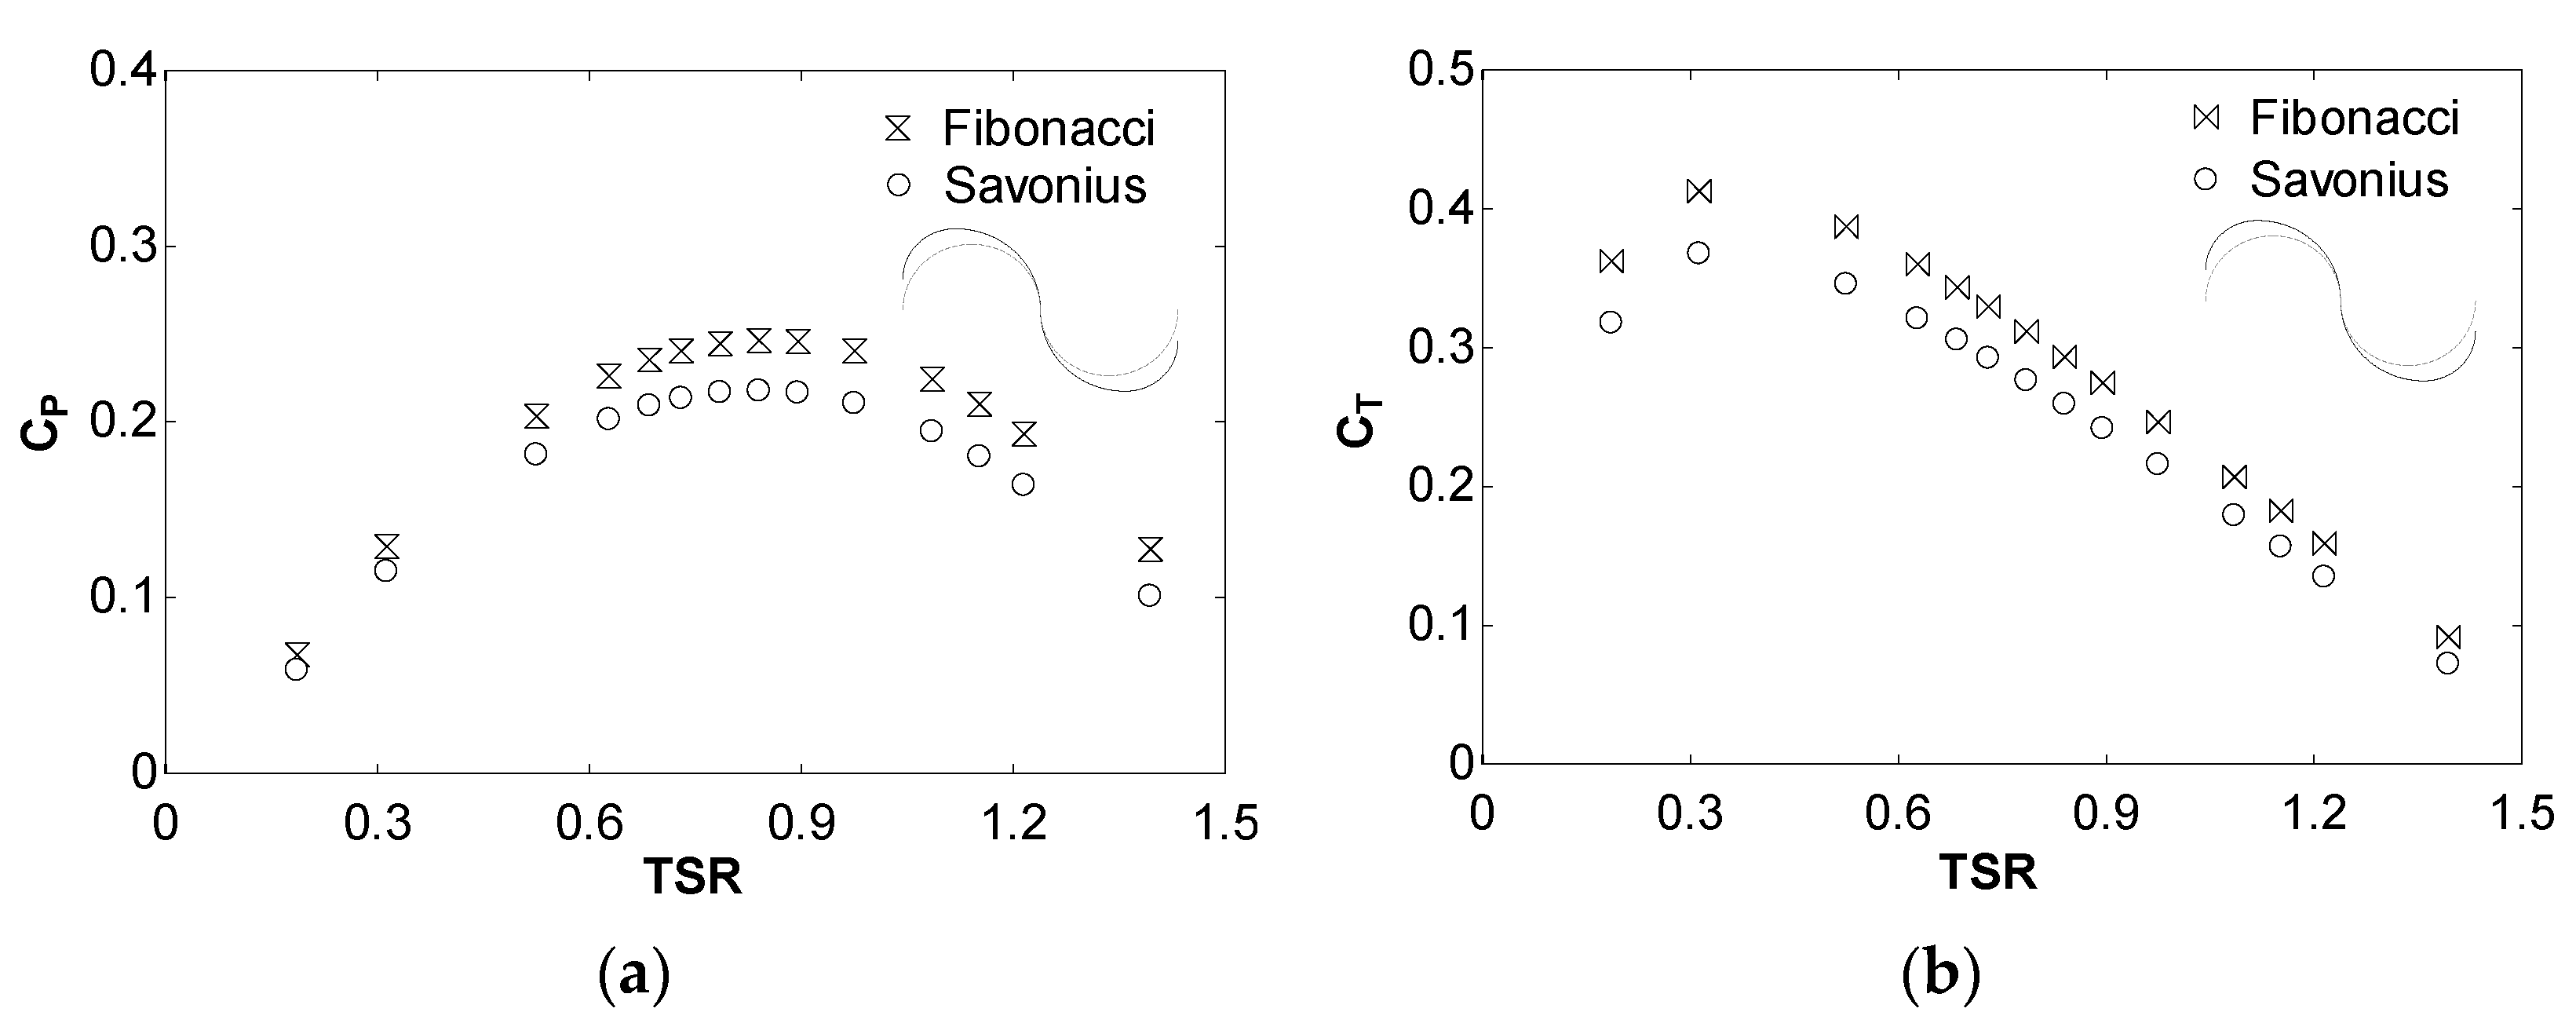
Figure 6a,b show a comparison between the Fibonacci and original Savonius blade profiles. These profiles are illustrated in the figures, using a grey color dotted line for the original Savonius and a black color dashed line for the Fibonacci. Particularly, Figure 6a illustrates the power coefficient, and Figure 6b compares the torque coefficient against the TSR. It can be seen that the proposed blade profile improves the original Savonius since it provides higher power and torque coefficients.
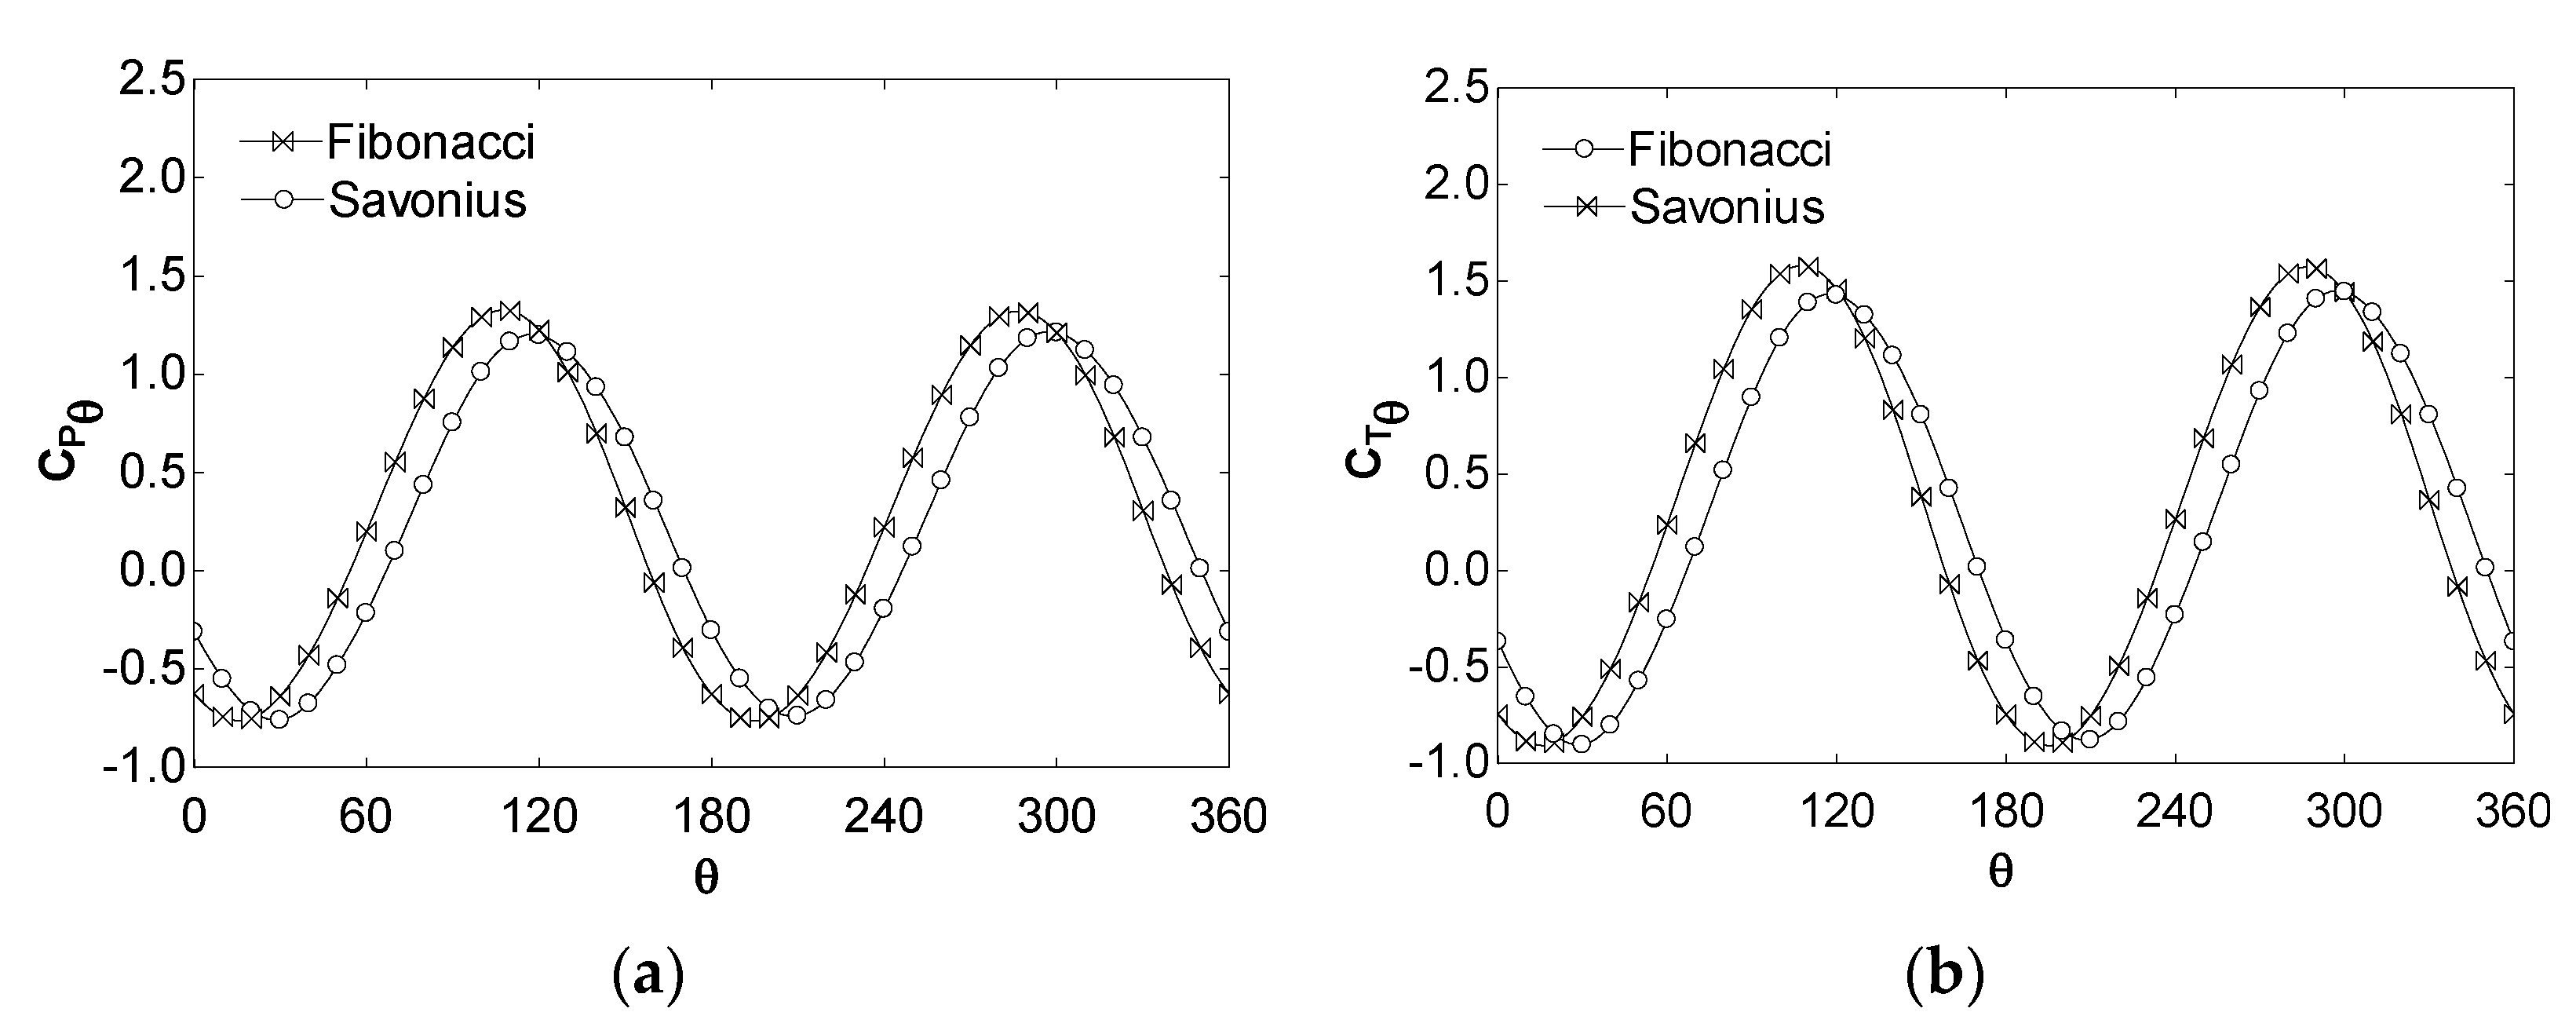
It is worth mentioning that the values shown in Figure 6 correspond to the average value along a rotor cycle (360°). The variation of the power and torque coefficients along a cycle is shown in Figure 7, which illustrates these values for a TSR = 0.84. Other values of TSR provide similar results and thus are not shown again.

2.2. ANN Analysis

Once the superiority of the Fibonacci blade profile was verified through CFD, the next step is to analyze the effect of other parameters. In a previous work [22], it was verified that the optimum number of blades is 2 and the optimum separation gap is 0. The same conclusion was obtained by other authors [17,31,32,33]. Nevertheless, the optimum aspect ratio, overlap, and twist angle are not clear, and there is no consensus in the scientific literature. Further on, the determination of the most appropriate combination of these parameters is a complex issue. The reason is that a huge number of combinations are possible and the relation between these parameters and the power is not a simple task. As mentioned above, in order to analyze a high number of combinations, an ANN is proposed in the present work.
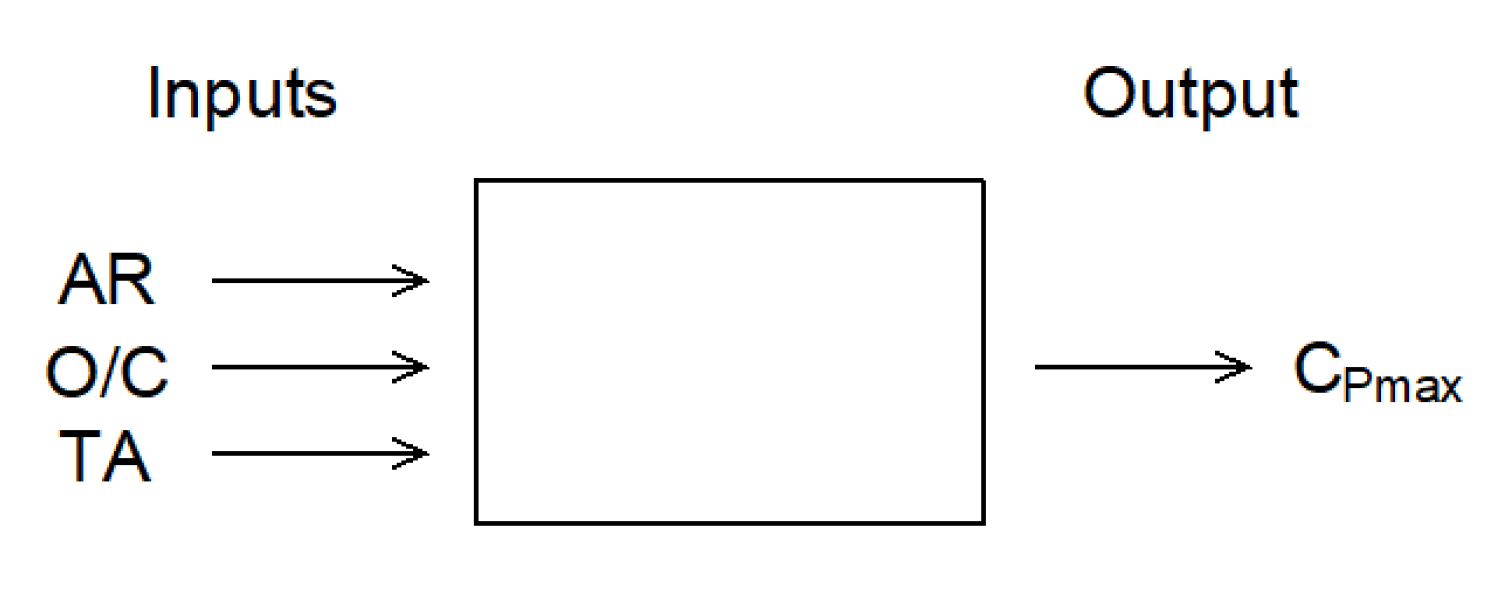
Three input variables were established: the aspect ratio, overlap, and twist angle. It is worth mentioning that it is common to provide the overlap as the overlap/chord length ratio, i.e., O/C. Regarding the output variables, in this case, only one variable is needed, the maximum power coefficient, CPmax. For instance, regarding the base case with AR = 1, O/C = 0, and TA = 0, the maximum power coefficient is the maximum value of the graph shown in Figure 6a, which corresponds to 0.2465. According to this, the ANN used for the present work will perform as a “black box” in which the three inputs are provided and the output is returned, as shown in Figure 8.
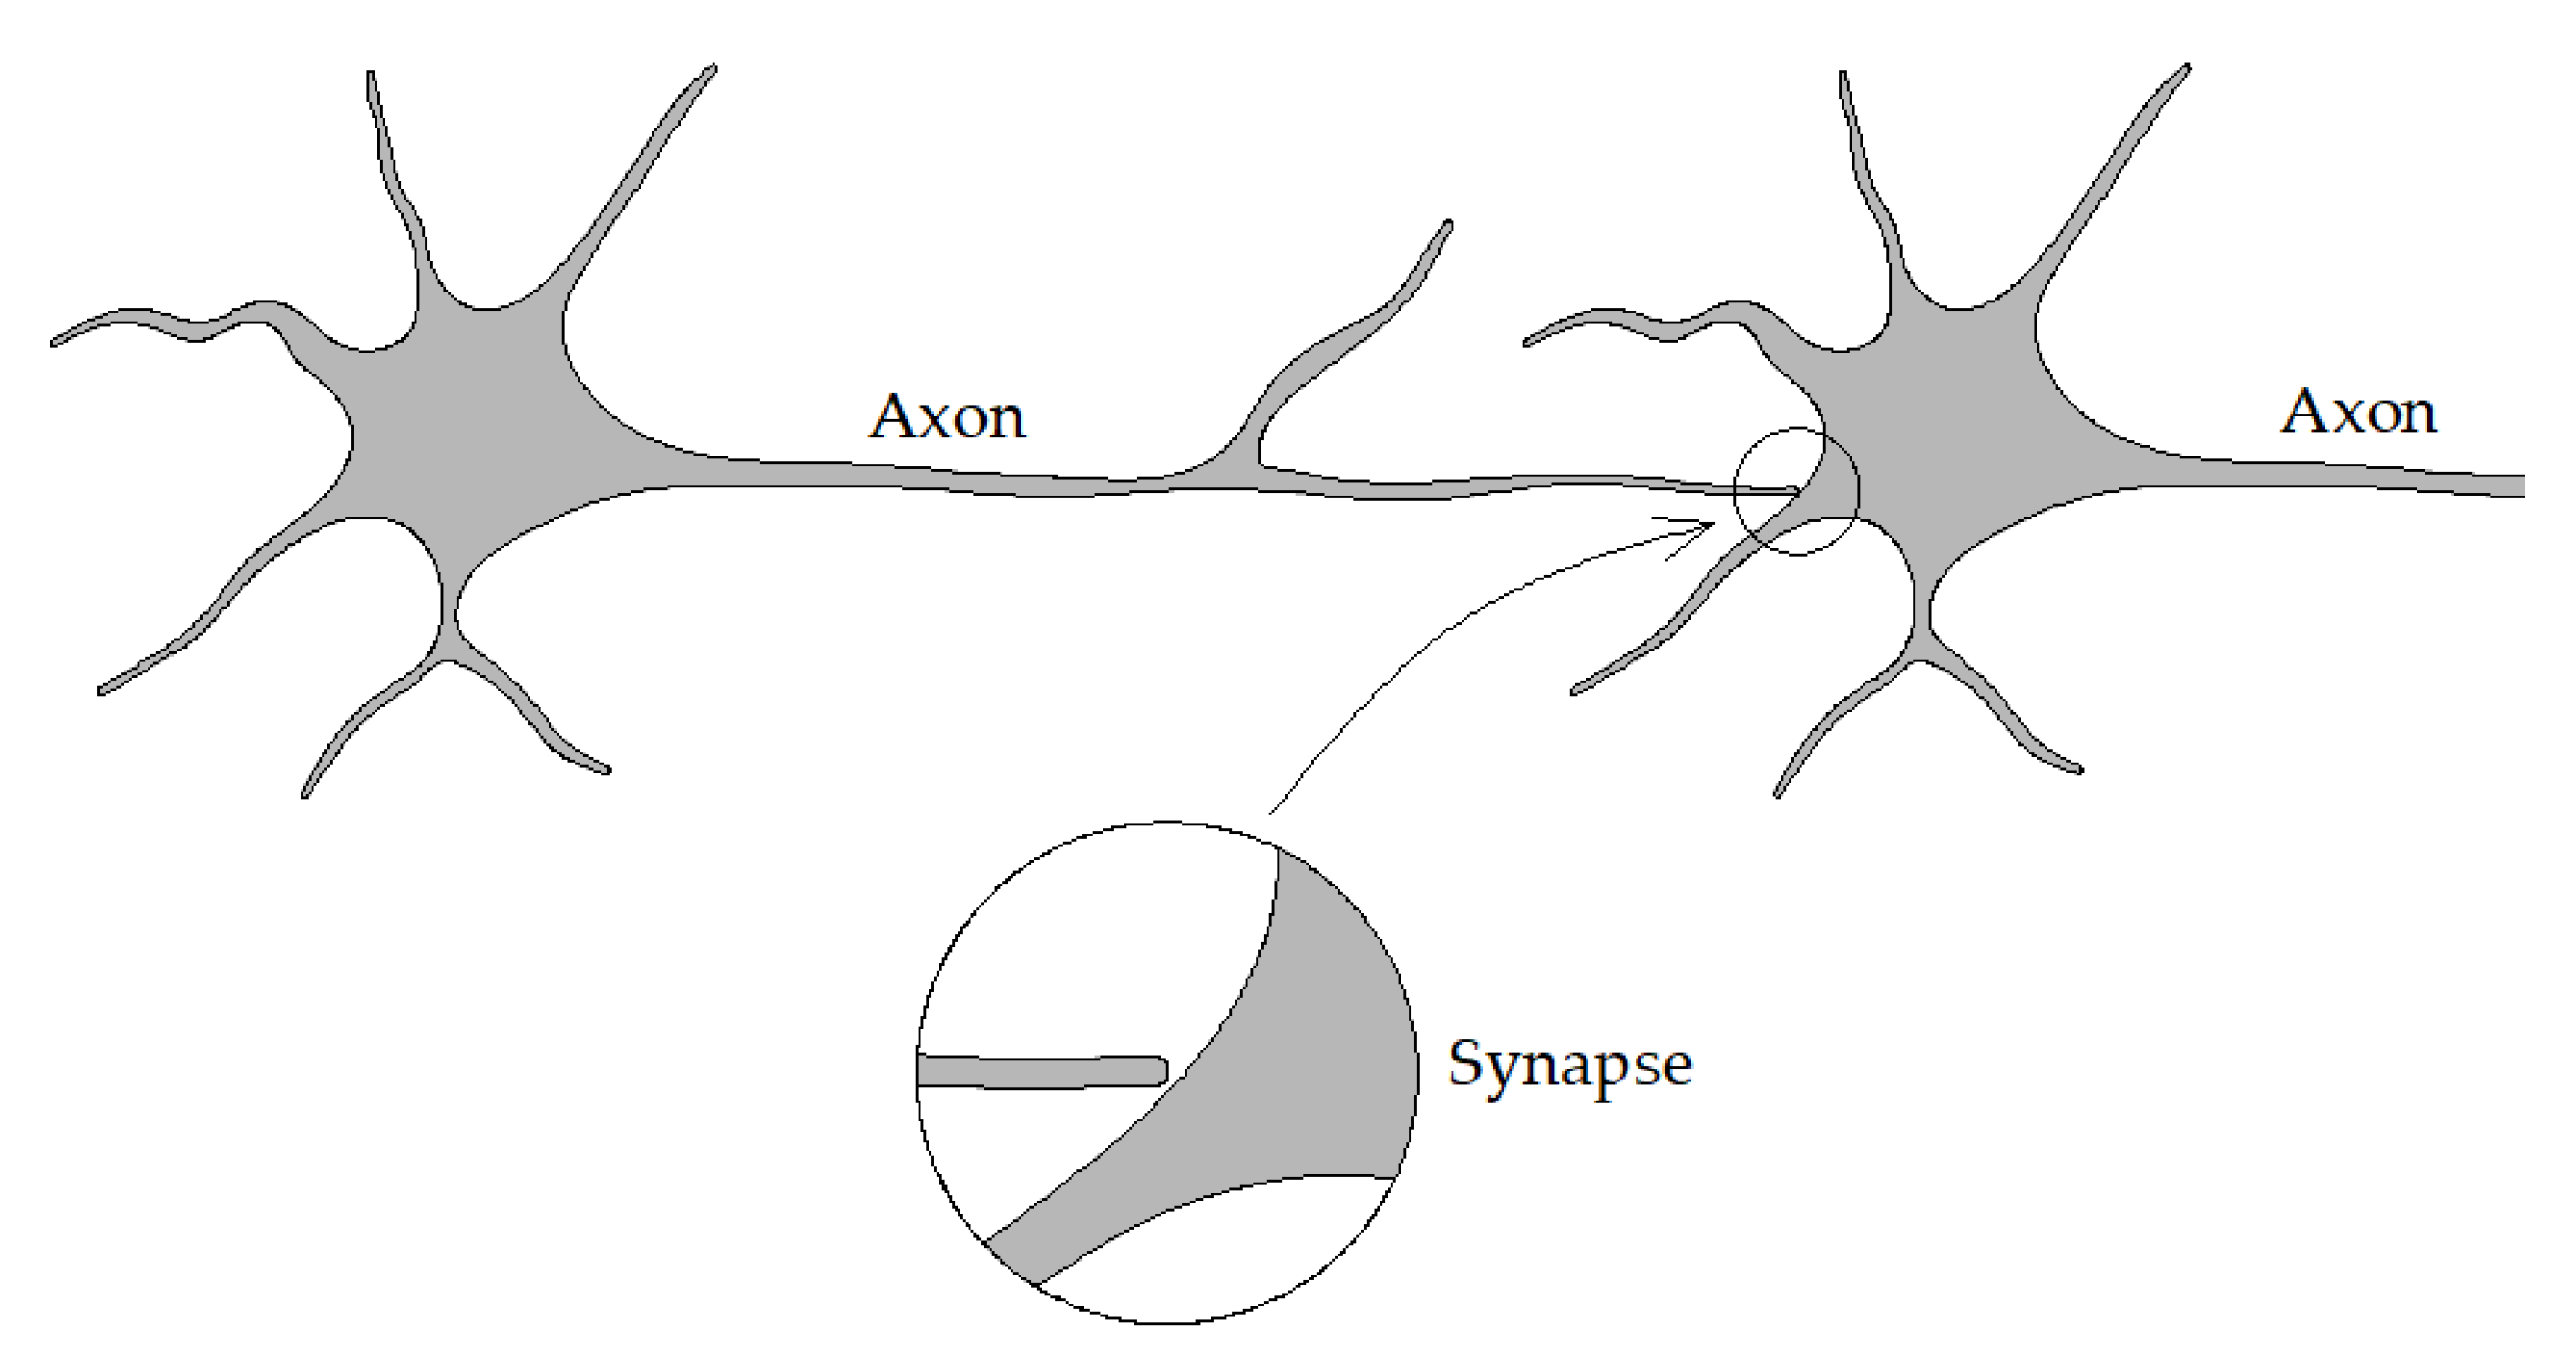
ANNs are structures that imitate human intuition. An ANN is capable of simulating the human brain and is able to process information and provide the corresponding predictions. The human brain uses neurons to process data. Figure 9 shows the structure of biological neurons. The data are transferred from synapses to the axon through electrochemical media called neurotransmitters. The human brain contains approximately 100 billion interconnected neurons [34]. The information in the brain propagates via electrochemical media known as neurotransmitters and is transferred along the neurons. The artificial neural network imitates this configuration. The principle of operation of ANNs is based on interconnected nodes that can process information. Two main advantages are provided by ANNs:
-
Capacity to learn from existing data and thus the ability to provide a prediction from multivariable relationships between process parameters.
-
Capacity to treat complex relationships between dependent and independent variables with high accuracy.
In the present work, the software Matlab 2021 was employed. The learning between the inputs and outputs of an ANN is performed through a mathematical training process that minimizes errors and provides an optimal prediction. The neurons of the ANN are organized into three layers: input, hidden, and output—Figure 10. The input layer corresponds to the independent variables; in this particular work, the aspect ratio, overlap/chord length ratio, and twist angle. On the other hand, the output layers correspond to the dependent variable; in this particular work, CPmax. The effect of the input to the cell refers to weights. There is no exact rule to define the number of hidden layers and hidden nodes, and several methods to determine them can be found in the literature. Generally, a single hidden layer is recommended for most problems, and the multi-layered structure is only recommended for complex problems [35,36,37,38] since adding hidden layers may cause memorizing instead of generalizing [39]. Each input node has an assigned weight and transfer functions related to the nodes.
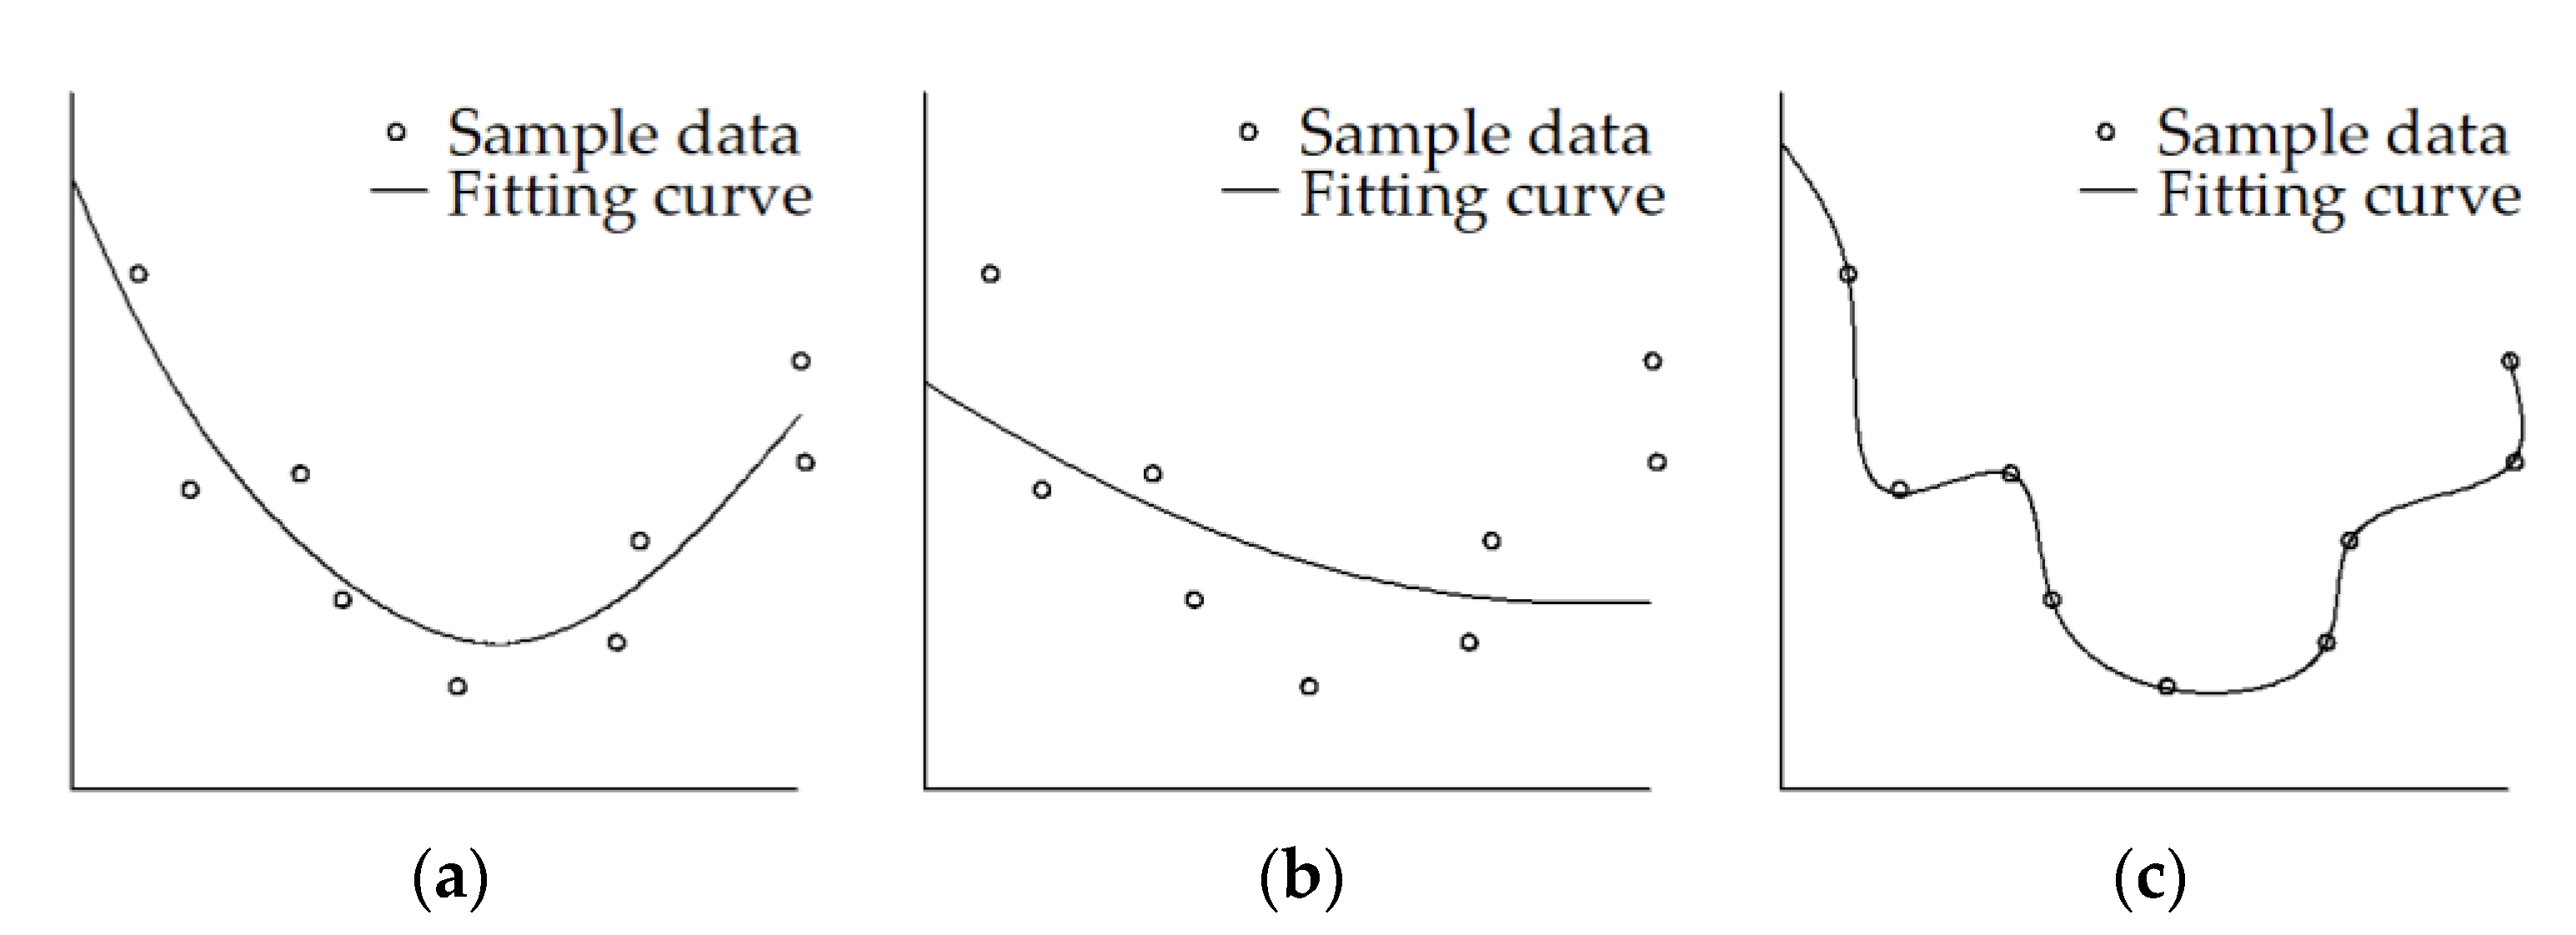
Two common problems in ANNs are underfitting and overfitting. An ANN must accurately fit the input and output data, as shown in Figure 11a. Underfitting takes place when the ANN is too simple, or the data sample is too small. In this case, the ANN does not accurately fit the data, as shown in Figure 11b. On the other hand, overfitting takes place when the model memorizes instead of generalizing. In this case, the ANN fits too well during the training process but poorly on the test dataset [40], as shown in Figure 11c. Regarding the number of neurons in the hidden layer, a low quantity may lead to high computational cost and overfitting, while a low number of neurons may lead to underfitting. In the present work, several networks with hidden layer neurons between 3 and 20 were tested.

3. Results

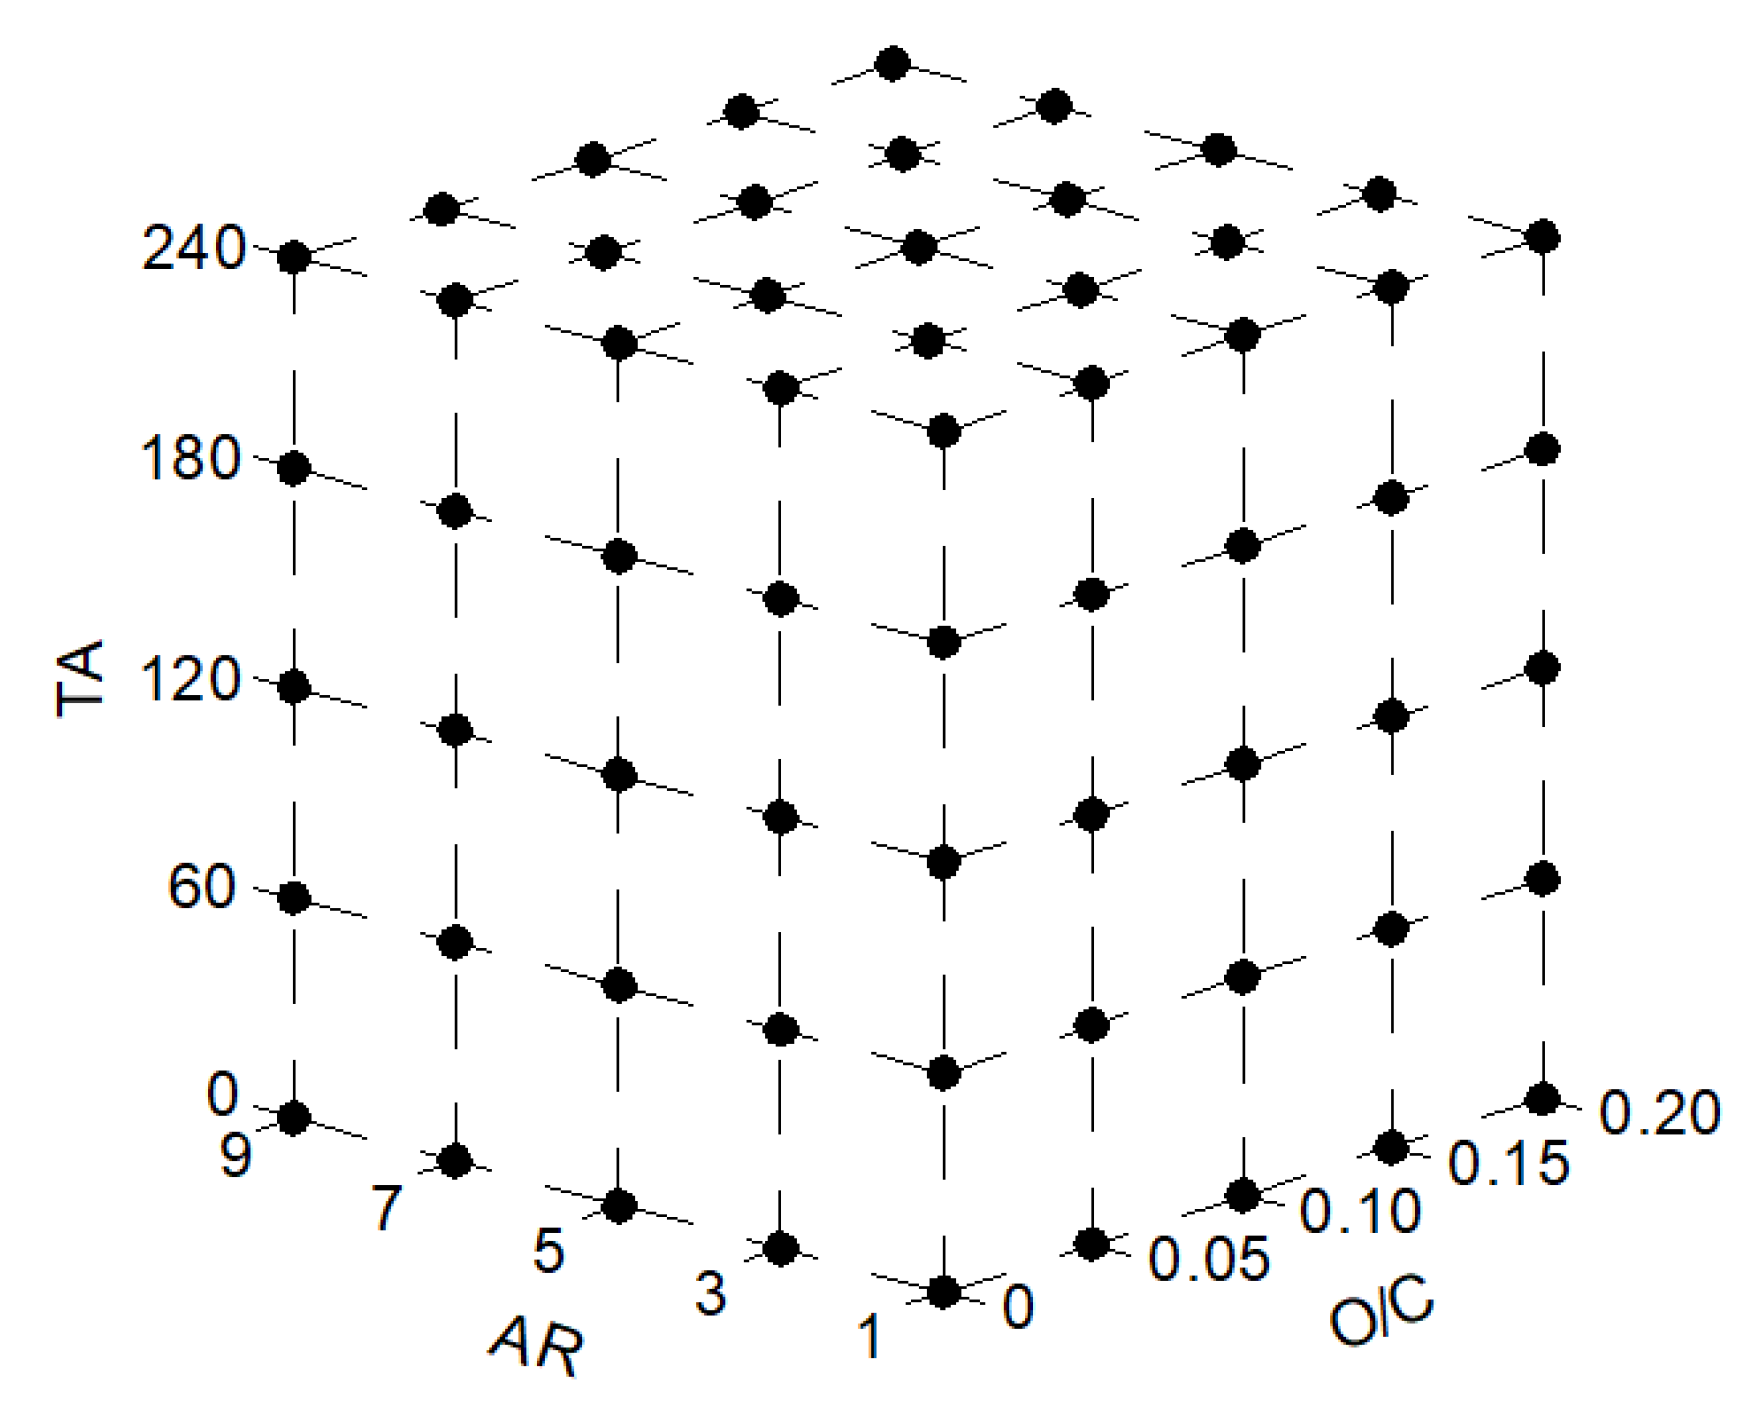
In order to establish the ANN, a data set must be provided. As mentioned previously, these data set were obtained through the CFD model. A total of 125 cases were analyzed using different values of the aspect ratio, overlap, and twist angle. Particularly, five values of the aspect ratio were employed: 1, 3, 5, 7, and 9; five values of the overlap/chord length ratio: 0, 0.05, 0.1, 0.15, and 0.2; and five values of the twist angle: 0°, 60°, 120°, 180°, and 240°. These ranges were chosen according to proposed values in the literature. Taking into account these values of the aspect ratio, overlap/chord length ratio, and twist angle, a total of 5 × 5 × 5 = 125 cases were analyzed. These cases are graphically represented in Figure 12.
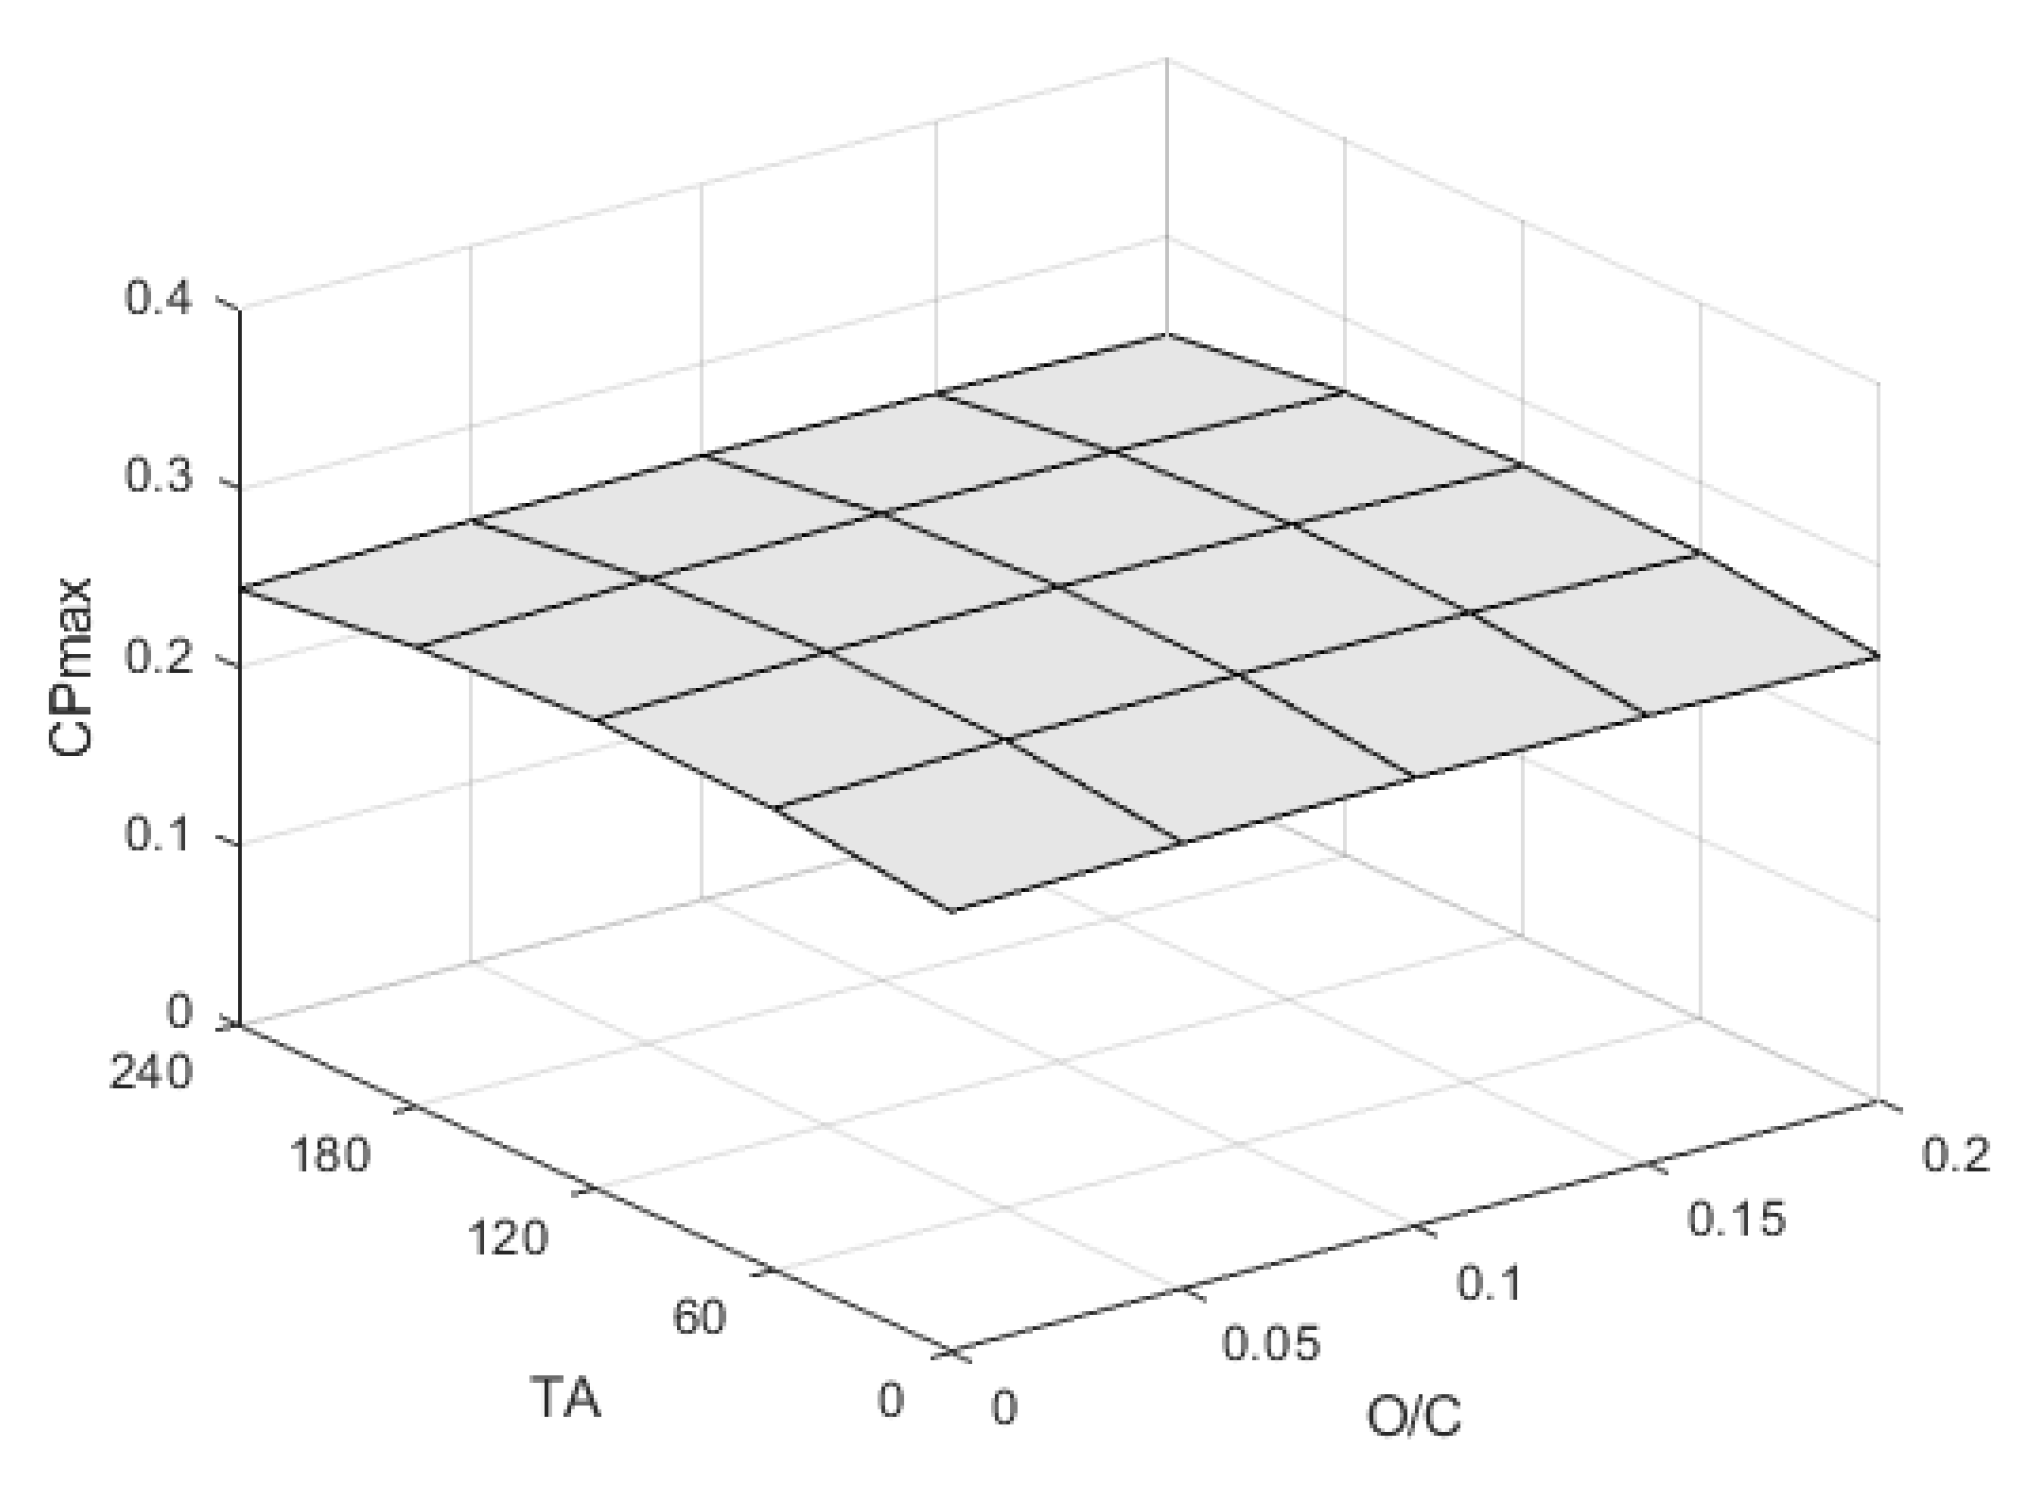
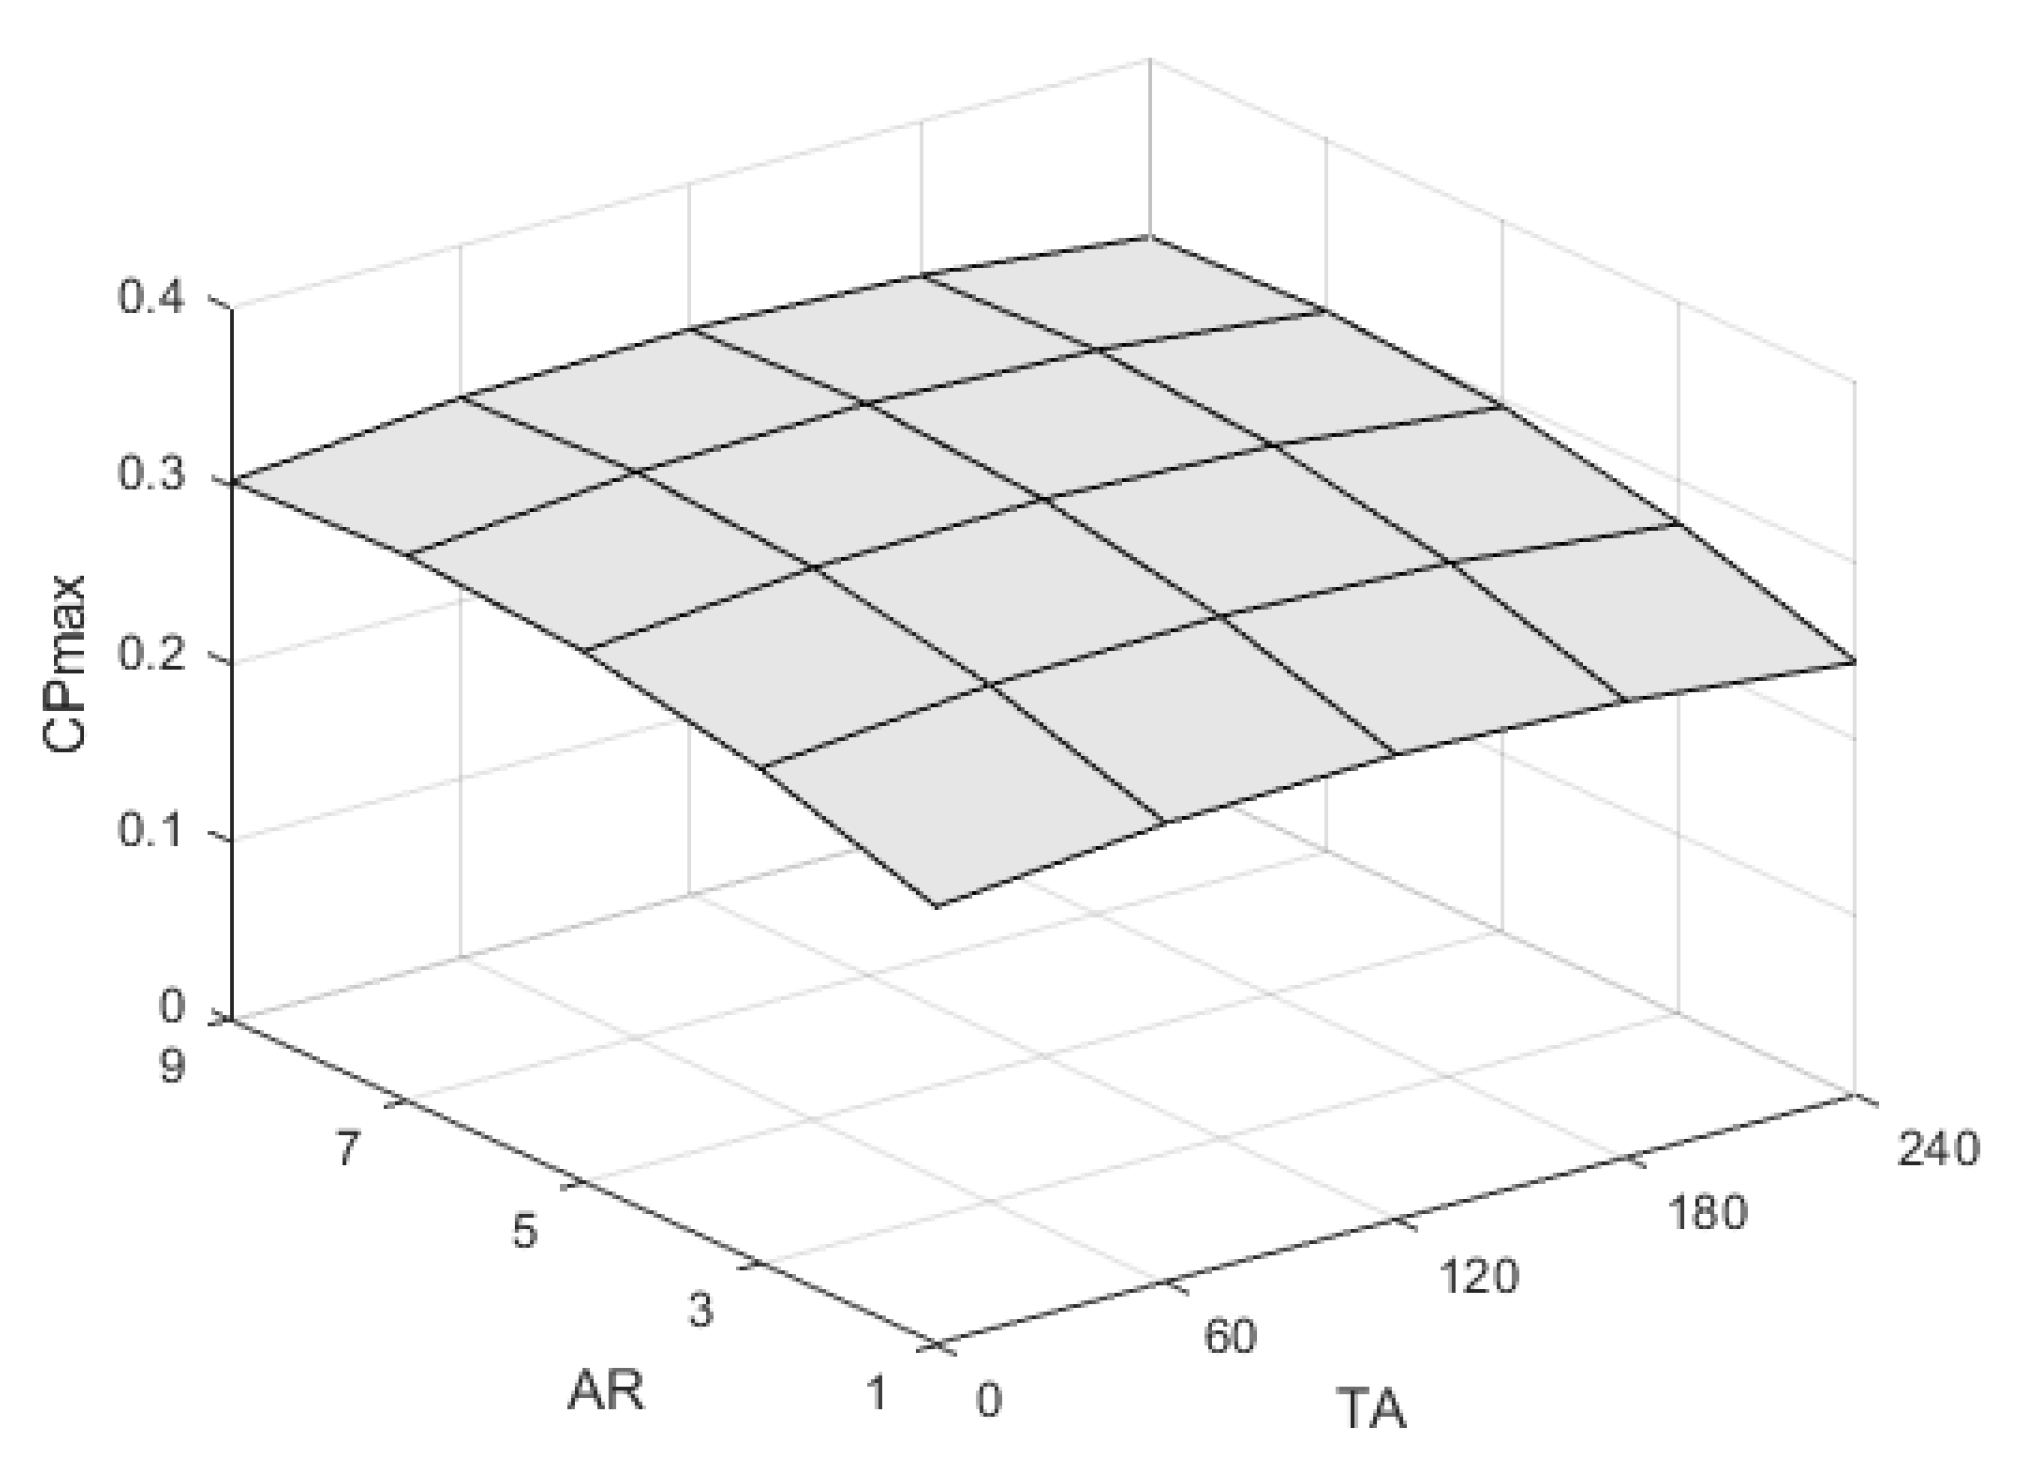
The CFD provided the power coefficients of all these 125 cases. Some results of the maximum power coefficients are illustrated in Figure 13, Figure 14 and Figure 15. Particularly, Figure 13 shows the maximum power coefficient against O/C and AR, Figure 14 shows the maximum power coefficient against TA and O/C, and Figure 15 shows the maximum power coefficient against AR and TA. It can be seen that the influence of the aspect ratio, overlap, and twist angle on the power coefficient is not a simple task since some values of the aspect ratio increment the maximum power coefficient but, from a certain value, the maximum power coefficient decreases again. The same effect is observed regarding the overlap and twist angle. These relations make it difficult to achieve the most appropriate combination of the aspect ratio, overlap, and twist angle. The only way to solve it appropriately is to simulate a huge quantity of possible combinations. Nevertheless, this procedure would take too much time with the computational resources currently available. This fact justifies the employment of alternative methods such as ANNs.
Once these 125 data were obtained through CFD, they will be employed to set the ANN and analyze a considerably higher amount of data. In order to minimize the domination of any parameter, data standardization was realized. This standardization or normalization process eliminates the dimensions and scales the data in a range, usually from 0 to 1, Equation (6).
x n = x x min x max x min
where xn is the normalized value, xmax is the maximum x value, and xmin is the minimum x value.
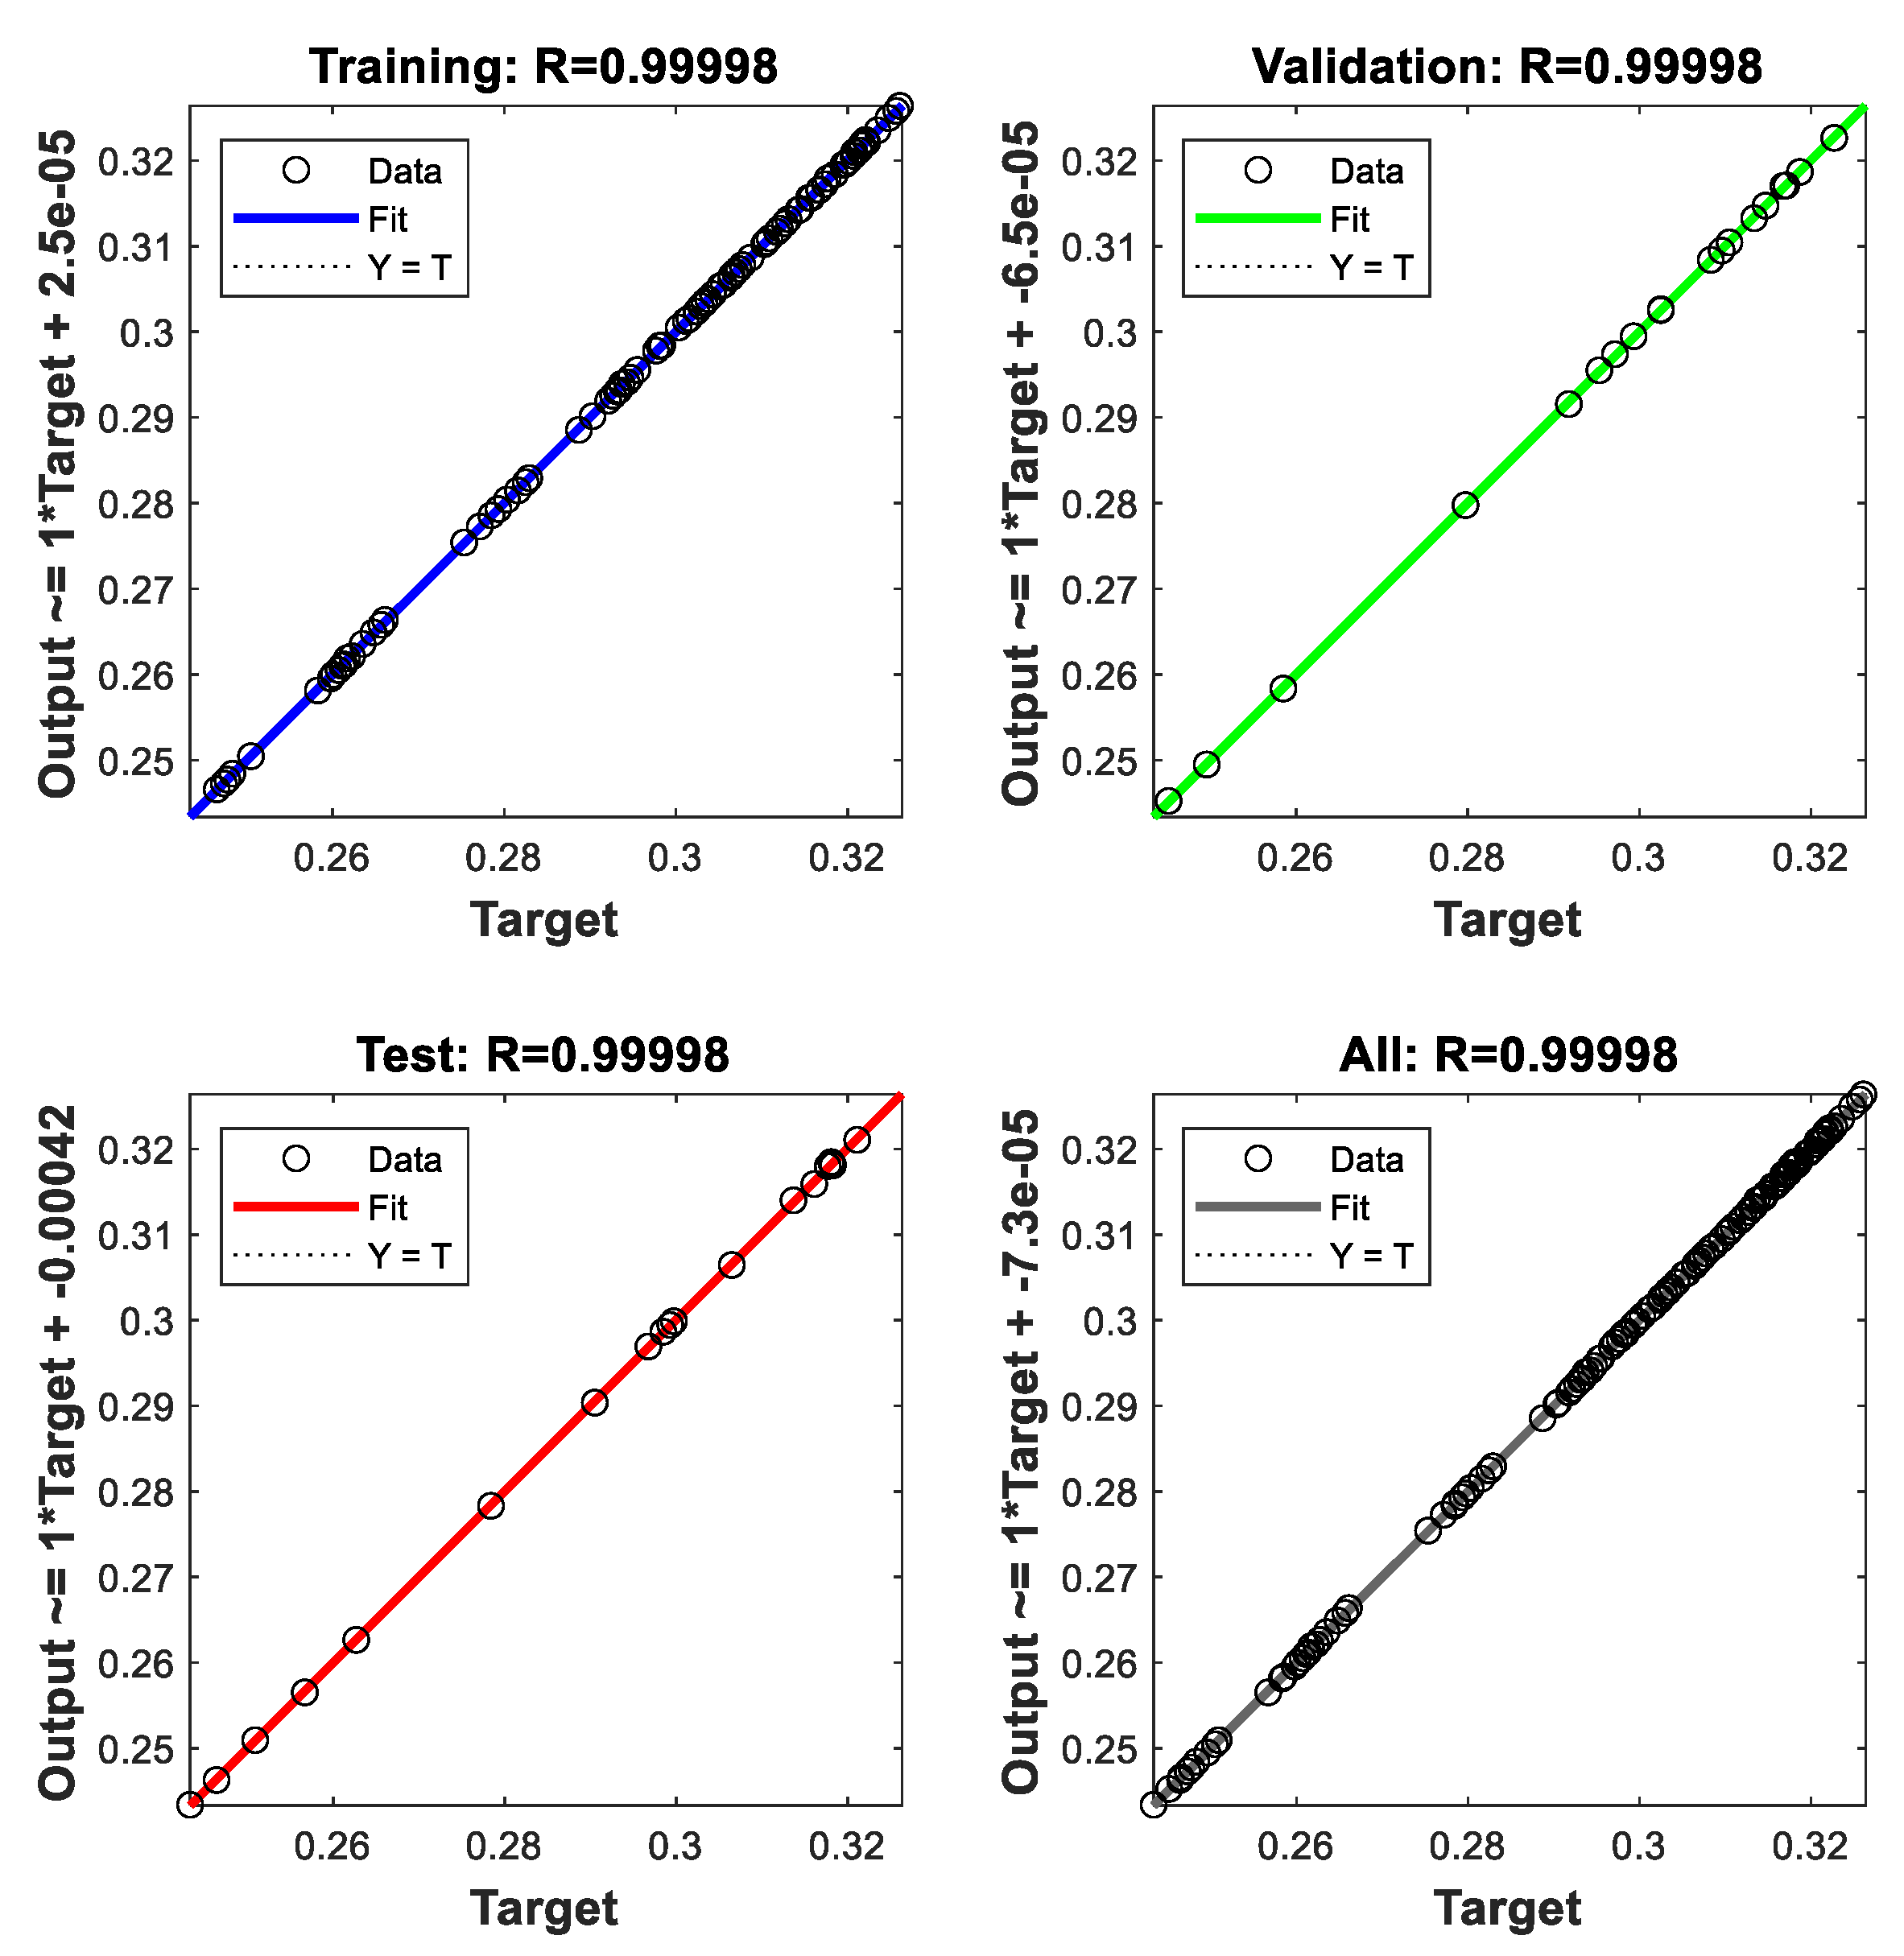
Once normalized, these 125 cases analyzed through CFD were employed as samples to train, validate, and test the network. Particularly, 89 samples, randomly selected, were used to train the network, 18 to validate it, and 18 to test it. Figure 14 shows the performance separated into three sets: training, validation, and test. Moreover, all data are also provided. The accuracy is evaluated on the basis of the prediction errors from the verification data. Equation (7) is used to compute the correlation coefficient R. The global R-value is too close to the optimum value R = 1. The closer to R = 1, the more accurate the ANN is. Graphically, Figure 16 shows that the fitting of the four images is practically diagonal, thus providing an excellent data fitting. It can be seen that the curves of the four images are basically on the diagonal, which indicates an appropriate data fitting, i.e., an accurate prediction of the maximum power coefficient.
R = 1 i = 1 m [ ( t i o i ) 2 ] i = 1 m o i 2
where t is the target value, o the output, and m the number of samples.
As mentioned previously, this ANN was employed to analyze a much higher quantity of cases than 125. Particularly, 81 values of the aspect ratio were employed: 1, 1.1, 1.2, … 9; 81 values of the overlap/chord length ratio: 0, 0.0025, 0.005, … 0.2; and 121 values of the twist angle: 0°, 2°, 4°, … 240°. Taking into account these values of the aspect ratio, overlap/chord length, and twist angle, a total of 81 × 81 × 121 = 793,881 cases were analyzed. The most appropriate solution obtained by the ANN is shown in Table 2. It can be seen that the optimum solution corresponds to AR = 7.5, O/C = 0.1125, and TA = 112°, providing a maximum power coefficient of 0.3263. Regarding the aspect ratio, high values increment the power coefficient, but excessive values reduce the positive effect that the endplates promote on the performance (reducing escaping of air). Regarding the overlap, it is positive since it allows the flowing of air from the advancing to the returning blade, incrementing the power. Nevertheless, excessive overlaps lead to a high reduction in the air on the advancing blade, which reduces the power. Regarding the twist angle, the optimum value also improves the aerodynamics of the turbine. For comparison, the base case with AR = 1, O/C = 0, and TA = 0 is also shown in Table 2. The obtained solution improves the maximum power coefficient by 32.4% in comparison with the base case.
For comparison purposes, Figure 17 compares the power coefficient against the TSR corresponding to the base and optimum cases. It can be seen that the improvement is considerable.

4. Conclusions

The present work focuses on an ANN to analyze a Savonius-type VAWT. The reason is the current necessity to employ renewable resources to reduce both global pollution and the dependency on finite resources such as fossil fuels. The Savonius turbine is appropriate for small power generations, but its main disadvantage relays on its low efficiency. With a proper design, it is possible to increment its efficiency. According to this, the present work proposes a bio-inspired blade profile based on the Fibonacci spiral. Previous studies showed that the performance of these turbines could be affected by several parameters. The present work focuses on the aspect ratio, overlap, and twist angle that influence the efficiency of the Savonius turbine. The variety of possible combinations of these parameters is immense; moreover, their relation to efficiency and thus optimization is a complex nonlinear problem. To predict the efficiency, an ANN was developed. The data employed to set the ANN were obtained through a validated CFD model. One hundred twenty-five cases were employed to train, validate, and test the neural network. The ANN was validated using R-value, which was close to 1. This shows that the ANN can accurately predict the performance as an alternative to classical modeling techniques and direct measurements. Once established, the ANN was used to analyze a total of 793,881 cases using different combinations of aspect ratios, overlap/chord length ratios, and twist angles. It was found that the most appropriate combination corresponds to aspect ratio 7.5, overlap/chord length ratio 0.1125, and twist angle 112°. This combination improves the maximum power coefficient by 32.4% in comparison to the base case with aspect ratio 1, overlap/chord length ratio 0, and twist angle 0. Regarding future works, it will be interesting to analyze other improvements such as deflectors, several stages, and combinations of Savonius–Darrieus stages.

Author Contributions

Conceptualization, J.d.D.R.G., J.B.D., J.T.M., A.C.C., M.I.L.G. and C.G.C.; methodology, J.d.D.R.G., J.B.D., J.T.M., A.C.C., M.I.L.G. and C.G.C.; software, J.d.D.R.G., J.B.D., J.T.M., A.C.C., M.I.L.G. and C.G.C.; validation, J.d.D.R.G., J.B.D., J.T.M., A.C.C., M.I.L.G. and C.G.C.; formal analysis, J.d.D.R.G., J.B.D., J.T.M., A.C.C., M.I.L.G. and C.G.C.; investigation, J.d.D.R.G., J.B.D., J.T.M., A.C.C., M.I.L.G. and C.G.C.; resources, J.d.D.R.G., J.B.D., J.T.M., A.C.C., M.I.L.G. and C.G.C.; writing—original draft preparation, J.d.D.R.G., J.B.D., J.T.M., A.C.C., M.I.L.G. and C.G.C.; writing—review and editing, J.d.D.R.G., J.B.D., J.T.M., A.C.C., M.I.L.G. and C.G.C.; supervision, J.d.D.R.G., J.B.D., J.T.M., A.C.C., M.I.L.G. and C.G.C. All authors have read and agreed to the published version of the manuscript.

Funding

This research received no external funding.

Institutional Review Board Statement

Not applicable.

Informed Consent Statement

Not applicable.

Conflicts of Interest

The authors declare no conflict of interest.

References

  1. Hegler, S.; Plettemeier, D. Simulative investigation of the radar cross section of wind turbines. Appl. Sci. 2019, 9, 4024. [Google Scholar] [CrossRef]
  2. Ding, L.; Guo, T. Numerical study on the power efficiency and flow characteristics of a new type of wind energy collection Device. Appl. Sci. 2020, 10, 7438. [Google Scholar] [CrossRef]
  3. Ancuti, M.C.; Musuroi, S.; Sorandaru, C.; Dordescu, M.; Erdodi, G.M. Wind turbines optimal operation at time variable wind speeds. Appl. Sci. 2020, 10, 4232. [Google Scholar] [CrossRef]
  4. Dolinski, L.; Krawczuk, M. Analysis of modal parameters using a statistical approach for condition monitoring of the wind turbine blade. Appl. Sci. 2020, 10, 5878. [Google Scholar] [CrossRef]
  5. Jessen, K.; Laugesen, K.; Mortensen, S.M.; Jensen, J.K.; Soltani, M.N. Experimental validation of aero-hydro-servo-elastic models of a scaled floating offshore wind turbine. Appl. Sci. 2019, 9, 1244. [Google Scholar] [CrossRef]
  6. Qi, L.; Zheng, L.; Bai, X.; Chen, Q.; Chen, J.; Chen, Y. Nonlinear maximum power point tracking control method for wind turbines considering dynamics. Appl. Sci. 2020, 10, 811. [Google Scholar] [CrossRef]
  7. Astolfi, D.; Castellani, F.; Berno, F.; Terzi, L. Numerical and experimental methods for the assessment of wind turbine control upgrades. Appl. Sci. 2018, 8, 2639. [Google Scholar] [CrossRef]
  8. Han, X.; Liu, D.; Xu, C.; Shen, W.; Li, L.; Xue, F. Monin–Obukhov similarity theory for modeling of wind turbine wakes under atmospheric stable conditions: Breakdown and modifications. Appl. Sci. 2019, 9, 4256. [Google Scholar] [CrossRef]
  9. Wijayanto, R.P.; Kono, T.; Kiwata, T. Performance characteristics of an orthopter-type vertical axis wind turbine in shear flows. Appl. Sci. 2020, 10, 1778. [Google Scholar] [CrossRef]
  10. Damota, J.; Lamas, I.; Couce, A.; Rodriguez, J. Vertical axis wind turbines: Current technologies and future trends. Renew. Energy Power Qual. J. 2015, 1, 530–535. [Google Scholar] [CrossRef]
  11. Alom, N.; Saha, U.K. Influence of blade profiles on Savonius rotor performance: Numerical simulation and experimental validation. Energy Convers. Manag. 2019, 186, 267–277. [Google Scholar] [CrossRef]
  12. Kacprzak, K.; Liskiewicz, G.; Sobczak, K. Numerical investigation of conventional and modified Savonius wind turbines. Renew. Energy 2013, 60, 578–585. [Google Scholar] [CrossRef]
  13. Kumar, G.; Ram, V.R.; Kumar, N. Numerical analysis of different blade profile of wind turbine. Int. J. Appl. Eng. Res. 2018, 6, 375–385. [Google Scholar]
  14. Benesh, A.H. Wind Turbine System Using a SAVONIUS-Type Rotor. U.S. Patent 4,715,776A, 27 February 1996. [Google Scholar]
  15. Mohamed, M.H.; Janiga, G.; Pap, E.; Thévenin, D. Optimal blade shape of a modified Savonius turbine using an obstacle shielding the returning blade. Energy Convers. Manag. 2011, 52, 236–242. [Google Scholar] [CrossRef]
  16. Chan, C.M.; Bai, H.L.; He, D.Q. Blade shape optimization of the Savonius wind turbine using a genetic algorithm. Appl. Energy 2018, 213, 148–157. [Google Scholar] [CrossRef]
  17. Akwa, J.V.; Vielmo, H.A.; Petry, A.P. A review on the performance of Savonius wind turbines. Renew. Sustain. Energy Rev. 2012, 16, 3054–3064. [Google Scholar] [CrossRef]
  18. Mahmoud, N.H.; El-Haroun, A.A.; Wahba, E.; Nasef, M.H. An experimental study on improvement of Savonius rotor performance. Alex. Eng. J. 2012, 51, 19–25. [Google Scholar] [CrossRef]
  19. Zhang, H.; Li, Z.; Xin, D.; Zhan, J. Improvement of aerodynamic performance of Savonius wind rotor using straight-arc curtain. Appl. Sci. 2020, 10, 7216. [Google Scholar] [CrossRef]
  20. Bu, L.; Du, G.; Hou, Q. Prediction of the compressive strength of recycled aggregate concrete based on artificial neural network. Materials 2021, 14, 3921. [Google Scholar] [CrossRef]
  21. Asteris, P.G.; Moropoulou, A.; Skentou, A.D.; Apostolopoulou, M.; Mohebkhah, A.; Cavaleri, L.; Rodrigues, H.; Varum, H. Stochastic vulnerability assessment of masonry structures: Concepts, modeling and restoration aspects. Appl. Sci. 2019, 9, 243. [Google Scholar] [CrossRef]
  22. Blanco, J.; Rodriguez, J.D.; Couce, A.; Lamas, M.I. Proposal of a nature-inspired shape for a vertical axis wind turbine and comparison of its performance with a semicircular blade profile. Appl. Sci. 2021, 11, 6198. [Google Scholar] [CrossRef]
  23. Damota, J.B.; García, J.D.D.R.; Casanova, A.C.; Miranda, J.T.; Caccia, C.G.; Galdo, M.I.L. Analysis of a nature-inspired shape for a vertical axis wind turbine. Appl. Sci. 2022, 12, 7018. [Google Scholar] [CrossRef]
  24. Blackwell, B.F.; Sheldahl, R.E.; Feltz, L.V. Wind Tunnel Performance Data for Two- and Three-Bucket Savonius Rotors; Sandia Laboratories: Springfield, VA, USA, 1977. [Google Scholar]
  25. Ross, I.J. Wind Tunnel Blockage Corrections: An Application to Vertical-Axis Wind Turbines. Master’s Thesis, University of Dayton, Dayton, OH, USA, 2010. [Google Scholar]
  26. Savonius, S.J. The S-rotor and its applications. Mech. Eng. 1931, 53, 333–338. [Google Scholar]
  27. Lamas, M.I.; Rodriguez, C.G. Hydrodynamics of biomimetic marine propulsion and trends in computational simulations. J. Mar. Sci. Eng. 2020, 8, 479. [Google Scholar] [CrossRef]
  28. Lamas Galdo, M.I.; Rodriguez Vidal, C.G.; Rodriguez Garcia, J.D. Optimization of the efficiency of a biomimetic marine propulsor using CFD. Ing. Investig. 2014, 34, 17–21. [Google Scholar]
  29. Lamas, M.I.; Rodriguez, J.D.; Rodriguez, C.G. CFD analysis of biologically-inspired marine propulsors. Brodogradnja 2012, 63, 125–133. [Google Scholar]
  30. Lamas, M.; Rodríguez, J.; Rodríguez, C.; González, P. Three-dimensional CFD analysis to study the thrust and efficiency of a biologically-inspired marine propulsor. Pol. Marit. Res. 2011, 18, 10–16. [Google Scholar] [CrossRef]
  31. Sheldahl, R.E.; Blackwell, B.F.; Feltz, L.V. Wind tunnel performance data for two- and three-bucket Savonius rotors. J. Energy 1978, 2, 160–164. [Google Scholar] [CrossRef]
  32. Saha, U.K.; Thotla, S.; Maity, D. Optimum design configuration of Savonius rotor through wind tunnel experiments. J. Wind Eng. Ind. Aerodyn. 2008, 96, 1359–1375. [Google Scholar] [CrossRef]
  33. Zhao, Z.; Zheng, Y.; Xu, X.; Liu, W.; Hu, G. Research on the Improvement of the Performance of Savonius Rotor Based on Numerical Study. In Proceedings of the 2009 International Conference on Sustainable Power Generation and Supply, Nanjing, China, 6–7 April 2009; pp. 1–6. [Google Scholar] [CrossRef]
  34. Bhatt, A.N.; Shrivastava, N. Application of artificial neural network for internal combustion engines: A state of the art review. Arch. Comput. Methods Eng. 2022, 29, 897–919. [Google Scholar] [CrossRef]
  35. Özcan, E.; Danışan, T.; Yumuşak, R.; Eren, T. An artificial neural network model supported with multi criteria decision making approaches for maintenance planning in hydroelectric power plants. Eksploat. Niezawodność.-Maint. Reliab. 2020, 22, 400–418. [Google Scholar] [CrossRef]
  36. Golmohammadi, D. Neural network application for fuzzy multi-criteria decision making problems. Int. J. Prod. Econ. 2011, 131, 490–504. [Google Scholar] [CrossRef]
  37. Lamas Galdo, M.I.; Telmo Miranda, J.; Rebollido Lorenzo, J.M.; Caccia, C.G. Internal modifications to optimize pollution and emissions of internal combustion engines through multiple-criteria decision-making and artificial neural networks. Int. J. Environ. Res. Public Health 2021, 18, 12823. [Google Scholar] [CrossRef] [PubMed]
  38. Rodriguez, C.G.; Lamas, M.I.; Rodriguez, J.D.; Abbas, A. Analysis of the pre-injection system of a marine diesel engine through multiple-criteria decision-making and artificial neural networks. Pol. Marit. Res. 2022, 28, 88–96. [Google Scholar] [CrossRef]
  39. Sietsma, J.; Dow, R.J.R. Creating artificial neural networks that generalize. Neural Netw. 1991, 4, 67–79. [Google Scholar] [CrossRef]
  40. Yuan, Z.; Shi, X.; Jiang, D.; Liang, Y.; Mi, J.; Fan, H. Data-based engine torque and NOx raw emission prediction. Energies 2022, 15, 4346. [Google Scholar] [CrossRef]
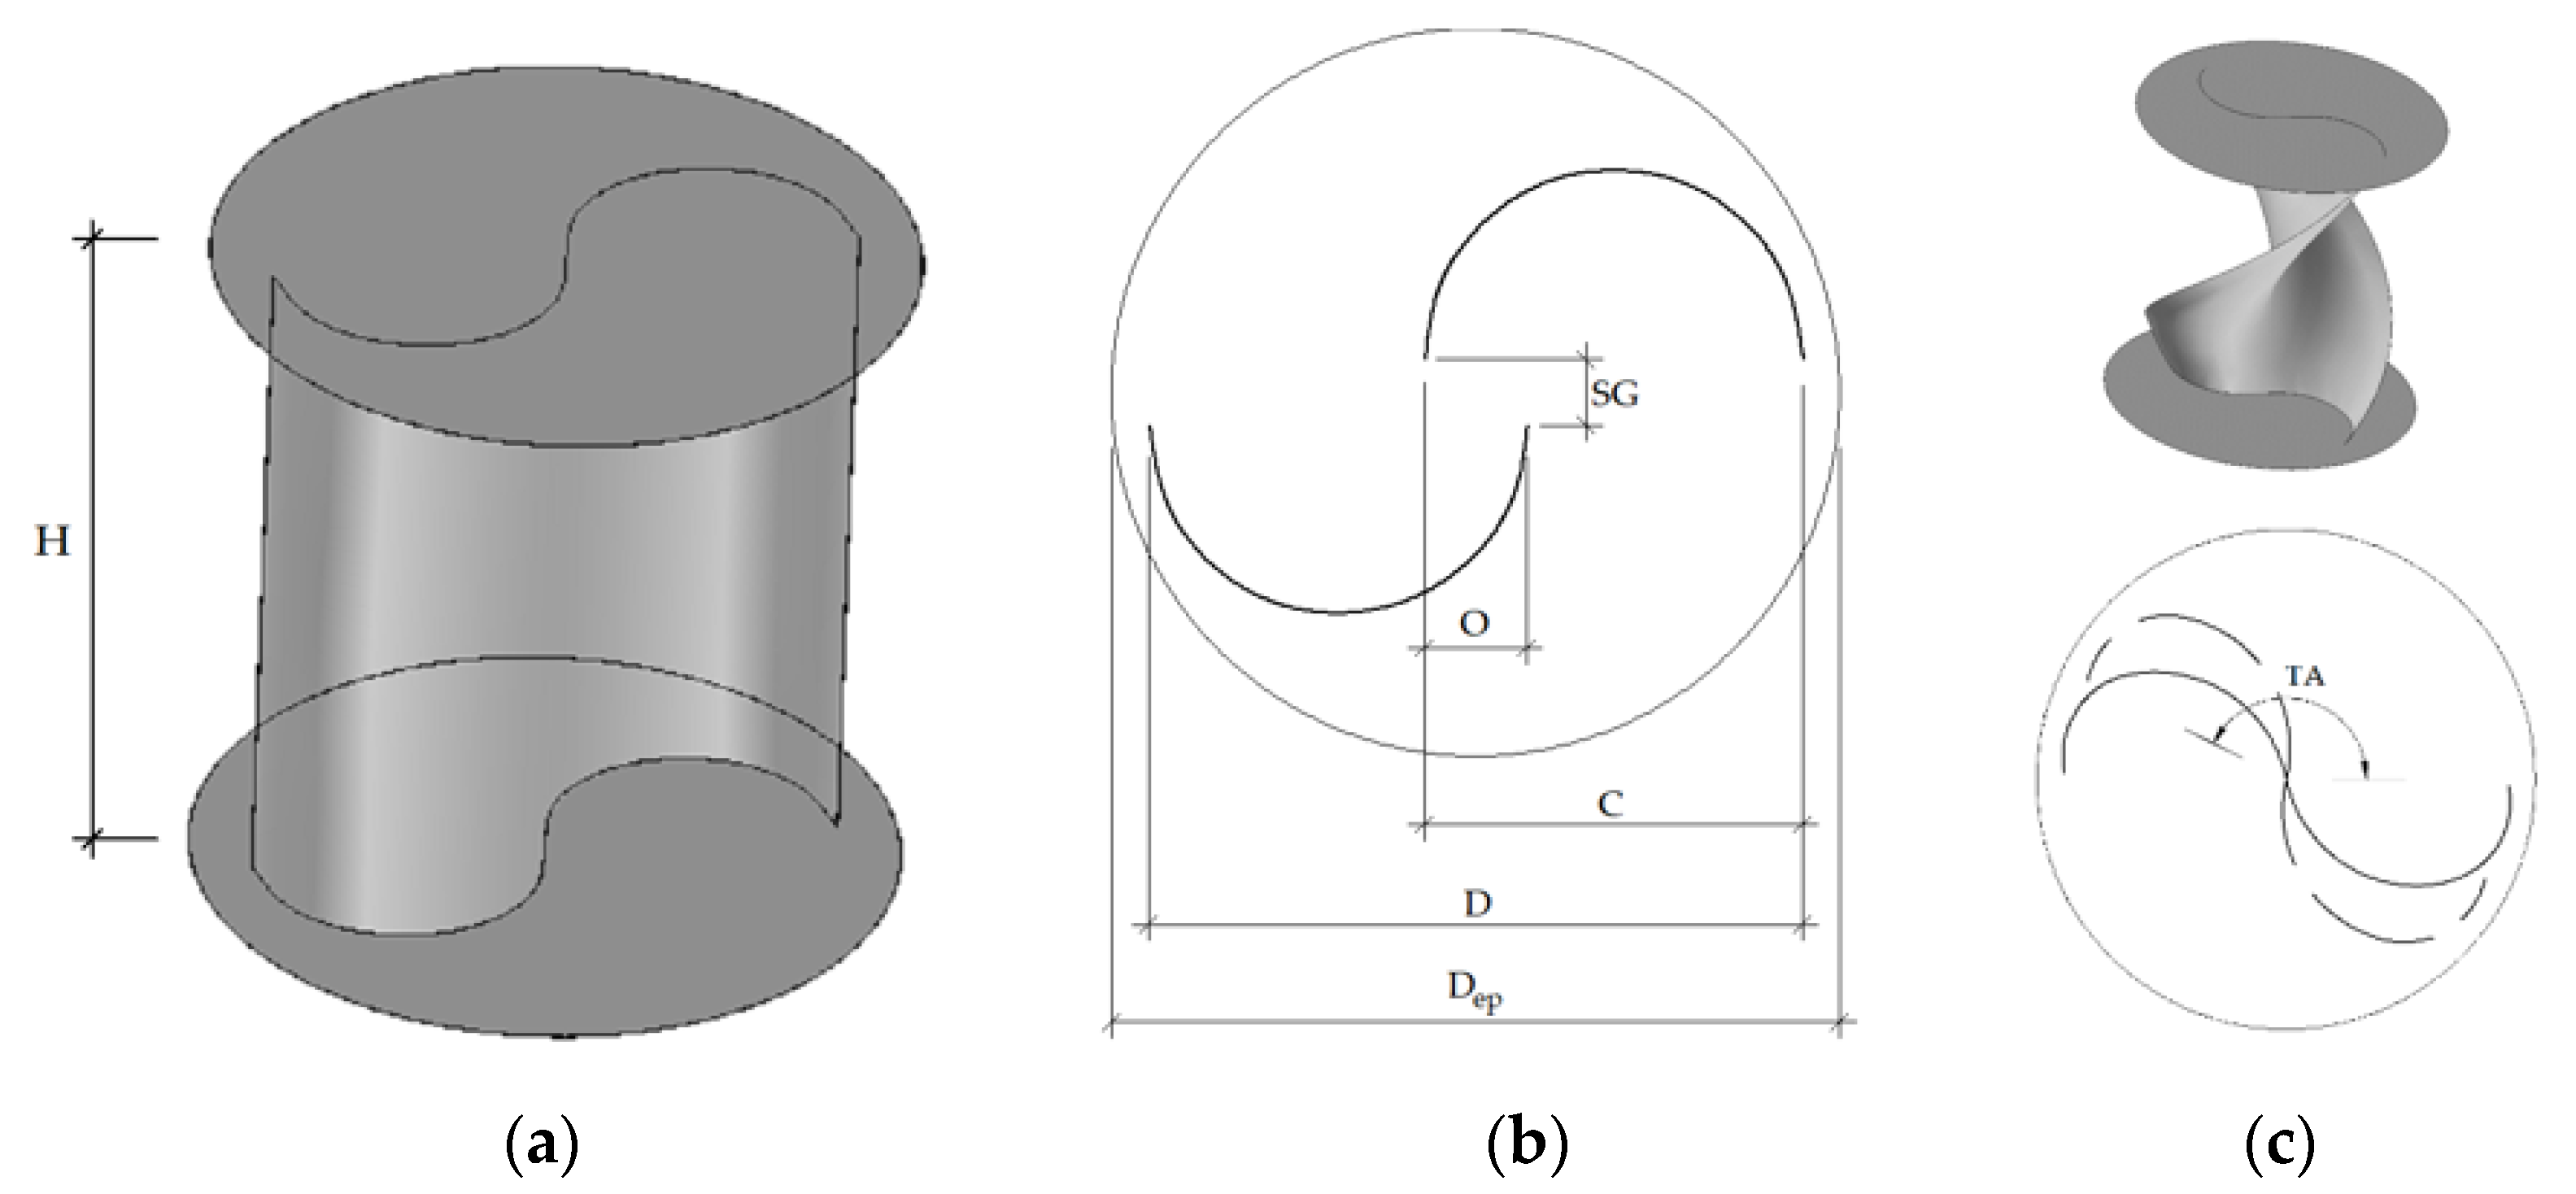
Figure 1. Savonius turbine; (a) 3D view; (b) lateral section of a Savonius turbine with non-zero overlap and separation gap; (c) illustration of the twist angle. H: height, C: chord length, O: overlap, SG: separation gap, D: rotor diameter, Dep: end plate diameter, TA: twist angle.
Applsci 12 08037 g001
Figure 2. Computational mesh. (a) 3D view; (b) middle plane.
Applsci 12 08037 g002
Figure 3. Comparison between numerical and experimental results; (a) CP against TSR; (b) CT against TSR.
Applsci 12 08037 g003
Figure 4. Fibonacci spiral in a seashell.
Applsci 12 08037 g004
Figure 5. Fibonacci spiral; (a) two consecutive terms; (b) turbine obtained from Fibonacci spirals used in the present work; (c) graphical representation of the golden ratio.
Applsci 12 08037 g005
Figure 6. Comparison between the Fibonacci and original Savonius blade profiles; (a) CP against TSR; (b) CT against TSR.
Applsci 12 08037 g006
Figure 7. Performance of Fibonacci and original Savonius blade profiles along a rotor cycle; (a) C; (b) C.
Applsci 12 08037 g007
Figure 8. ANN structure for the present work.
Applsci 12 08037 g008
Figure 9. Schematic representation of biological neurons in the human brain.
Applsci 12 08037 g009
Figure 10. Structure of the ANN employed for the present analysis.
Applsci 12 08037 g010
Figure 11. Data fitting performance; (a) appropriate fitting; (b) underfitting; (c) overfitting.
Applsci 12 08037 g011
Figure 12. Graphical representation of the 125 cases analyzed through the CFD model.
Applsci 12 08037 g012
Figure 13. Maximum power coefficient against O/C and AR. TA = 0.
Applsci 12 08037 g013
Figure 14. Maximum power coefficient against TA and O/C. AR = 1.
Applsci 12 08037 g014
Figure 15. Maximum power coefficient against AR and TA. O/C = 0.
Applsci 12 08037 g015
Figure 16. Regression graphs of the ANN.
Applsci 12 08037 g016
Figure 17. Comparison between the base and the optimum cases.
Applsci 12 08037 g017
Table 1. Characteristics of the turbine employed for the validation procedure.
ParameterValue
Diameter (m)1
Height (m)1
Number of blades2
Overlap (m)0
Separation gap (m)0
Twist angle (°)0
Table 2. Optimum and base case solutions.
ARO/CTACpmax
Base case1000.2465
Optimum7.50.11251120.3263
Publisher’s Note: MDPI stays neutral with regard to jurisdictional claims in published maps and institutional affiliations.