Abstract
Phenolic compounds are responsible for color and, with it, the quality of red wines. Its content will depend, among other factors, on the oenological techniques applied in the winery and, among them, the maceration time. Long maceration times can generate logistical problems at the moment of maximum grape entry into the winery. Applying techniques that accelerate the extraction of phenolic compounds from the grape solid parts to the must-wine would allow reducing the maceration time. Among the techniques of interest, microwaves use electromagnetic waves to produce dipole rotation and ion conduction, which can increase the elasticity of cell walls and cause the destruction of the cell membrane, facilitating the phenolic compound extraction. To study this effect, crushed grapes of the Cabernet Sauvignon variety were treated with this technology, macerated for 72 h and 7 days, and compared with respect to a control wine without any treatment. The results showed that the application of microwaves to the crushed grape favored a rapid extraction of the phenolic compounds, increasing the color of the wine and with only 72 h of maceration, the wines from treated grapes showed a similar phenolic content and chromatic characteristics to a control wine with 7 maceration days. The extraction of the less astringent skin tannins and the formation of stable pigments was also favored indicating that this technology may allow reducing the maceration time during the winemaking process without affecting the quality and stability of the wine.
1. Introduction
The maceration process is one of the most important steps in red winemaking since the extraction of phenolic compounds and to a lesser extent, of some aroma compounds is dependent on this step. Given its importance, many studies have dealt with the influence of different maceration conditions on the content of the final wine phenolic composition [1,2]. Traditionally, enologists have used variables such as maceration length, temperature, or the use of enzymes, among others, to achieve the best extraction. Nowadays, new technologies are being developed to optimize this phenolic extraction and/or for reducing the length needed to achieve the best results. These new methods include pulse electric fields [3,4], high power ultrasound [5,6,7], thermovinification [8,9], or the use of microwaves (MW).
Many techniques in food processing (pasteurization, sterilization, drying, thawing, blanching, and stunning) are assisted by microwave energy [10,11]. Microwave-assisted extraction uses electromagnetic waves in the frequency spectrum between 300 MHz and 300 GHz, which causes the crushed grapes to heat up due to two main mechanisms: ionic conduction and dipole rotation. Grape skin cells, where most of the phenolic compounds are located, undergo changes under the electromagnetic field created by microwaves since, and according to several authors, the rapid oscillations of the electric field may exceed the elasticity of the cell wall and cause the destruction of the cell membrane, facilitating the phenolic compound extraction [12,13,14]. Moreover, it seems clear that although a thermal effect may be present, this is not the most important effect. Carew et al. [15] conducted a histological examination of grape skins and they found more substantial intracellular damage in microwave-macerated skins than in heat-macerated and control skins.
The studies found in the literature on the use of microwaves applied to red wines are mostly coincident with the fact that they facilitate the extraction of phenolic compounds during maceration [14,15,16,17]. However, some studies have also shown that a varietal effect may exist since the application of MW to different varieties (Cabernet Sauvignon, Merlot, and Syrah grapes) led to different degrees of success. It has been reported that MW treatment failed to increase color in wines from Cabernet Sauvignon and Merlot treated grapes, but it did so in Syrah [18] and in Pinot Noir, with a reported fourfold increase in tannin concentration [16].
Another advantage of the use of microwaves during the prefermentative phase of vinification could be a shortening in the length of maceration time needed to achieve a high phenolic content, improving, in this way, the efficiency of winery operations.
In this study, our objective is to determine if previous negative results of the application of MW to Cabernet Sauvignon grapes before the skin maceration step could be related to a varietal effect or operational effect and determined if, in our conditions, we could improve the phenolic extraction and, therefore, the wine chromatic characteristics, and if this technology could be useful for reducing the time needed to get a certain phenolic content in the final wines.
2. Materials and Methods
2.1. Reagent and Standards
Methylcellulose, ammonium sulphate, phloroglucinol, sodium acetate, ascorbic acid, lithium chloride, gallic acid, and caffeic acid the last two pure compounds being employed as standards, were obtained from Sigma-Aldrich (St. Louis, MI, USA).
Hydrochloric acid (12 M and 0.1 M), glacial acetic acid 99%, acetaldehyde 99%, and acetonitrile HPLC quality were obtained from Panreac AppliChem-ITW Reagents SL (Barcelona, Spain).
Formic acid and methanol (both HPLC quality) were obtained from JTBaker-Fisher Scientific SL (Madrid, Comunidad de Madrid, Spain), and N,N-dimethylformamide HPLC quality was obtained from Scharlab, SL (Barcelona, Spain).
Catequin, epicatechin, epigallocatechin gallate, malvidin-3-glucoside chloride, and quercetin-3-glucoside, used as standards, were obtained from Extrasynthèse (Genay, Lyon, France).
2.2. Microwave Treatment and Microvinification
Once optimum ripeness was achieved, 150 kg of red Cabernet Sauvignon grapes from the 2019 vintage of the vineyards of the Instituto de la Vid y el Vino de Castilla-La Mancha (IVICAM, Tomelloso, Ciudad Real, Spain) was harvested and quickly transported to the laboratory for processing. The grape clusters were destemmed and crushed and the must was sulfited at 50 mg/L SO2. The must, divided into two batches, was destined for different types of vinification. One of the must batches was used as a control (C) and the other (MW) was treated with microwaves, with 12 min applications at 700 W (3 intervals of 4 min) using a domestic microwave oven LG MJ3965ACS (LG electronics, Madrid, Spain), in order to avoid raising the temperature above 40 ºC. Between treatments, the batches were shaken and the temperature was determined. Once the treatments were developed, Saccharomyces cerevisiae yeast (CECT no. 10835) was inoculated as a starter culture at 22 °C (±2 °C) in both batches of must. The whole fermentation process (which included the maceration process) was carried out in 10 L glass vessels, maintaining the same proportion of must and grape skins in all tanks. The cap was pushed twice a day. Two different maceration times were studied for both trials: 72 hours (72 h) and 7 days (7 d), after which time the wine was obtained without solid remains. All assays were developed in triplicate. Once fermentation was completed, the wines were decanted and filtered. The SO2 dosage was adjusted to 25 mg/L free SO2 and finally, the wines were bottled. All analyses were carried out at the time of bottling.
2.3. Analysis
2.3.1. Spectrophotometric Parameters
Different chromatic parameters of the wines previously filtered through 0.45 μm nylon filters were analyzed using a HEλIOS α spectrophotometer (ThermoSpectronic, Waltham, MA, USA).
In order to determine the color intensity (CI), the method of Glories [19] was used, measuring the absorbance of the sample at 620, 520, and 420 nm in 2 mm cuvettes. Since the samples contained sulfites, 10% acetaldehyde was added and a 45 min wait was performed before measuring. For the determination of total and polymeric anthocyanins (TA, PA), the method of Ho et al. [20] was followed, determining the absorbance at 520 nm in acidified wine samples using 0.1M hydrochloric acid (TA), or potassium bisulphite (added as potassium metabisulphite) (PA). To determine the total polyphenol index (TPI), the Ribéreau-Gayon et al. method [21] was used, measuring the wine absorbance at 280 nm, and the determination of methylcellulose precipitable tannins (MCPT) was carried out thanks to the Smith method [22]. The assay is based upon methyl cellulose–tannin interactions resulting in the formation of insoluble polymer tannin complexes which then precipitate. The concentration of tannins is obtained by subtracting the absorbance values at 280 nm of solutions both with and without polymer precipitation.
2.3.2. Determination of Tannins by HPLC
To carry out the determination of tannin concentration and composition, the phloroglucinolysis method was used, following the Busse-Valverde et al. [23] protocol for sample preparation and analysis, using as reagents a mixture of phloroglucinol with ascorbic acid dissolved in hydrochloric acid 0.2 N and a solution of sodium acetate 200 mM. A Waters 2695 system (Waters, Milford, MA, USA) equipped with a Waters 2996 photodiode array detector was used for the analysis. The column used was Atlantis dC18 (250 × 4.6 mm, 5 µm packing) protected with a guard column of the same material (20 mm × 4.6 mm, 5 µm packing) (Waters, Milford, MA, USA). The solvents used in the elution were water/formic acid (98:2, v/v) (A) and acetonitrile/solvent A (80:20 v/v) (B), employing a flow rate of 0.8 mL/min at an oven temperature of 30 °C. Elution started with 100% A for 5 min, linear gradient from 100 to 90% A in 30 min, and gradient from 90 to 80% in 30 min, followed by washing and re-equilibration of the column. The injection volume was 10 µL. By this method, the total tannin concentration (TTp) was determined as well as the mean degree of polymerization (mDP), calculated as the sum of all subunits (flavan-3-ol monomer and phloroglucinol adducts, in moles) divided by the sum of all flavan-3-ol monomers. The percentage of galloylation (%Gal) was also determined, as well as the percentage of epigallocatechin (%EGC) subunit.
2.3.3. Determination of Phenolic Compounds by HPLC
The separation of anthocyanins, pyranoanthocyanins, flavonols, phenolic acids, and flavan-3-ols in wine was carried out in a Waters Acquity Arc liquid chromatograph (Waters, Milford, MA, USA) equipped with a Waters 2998 diode array detector (Waters, Mildford, MA, USA). The column used was a Poroshell120 EC-C18 core-shell column (150 mm × 2.1 mm, 2.7 µm, Agilent Technologies, Santa Clara, CA, USA). The composition of the mobile phases was: 1% formic acid in water (A) and 1% formic acid in 1:1 (v/v) methanol: acetonitrile (B). The elution gradient started with 100% A for 2 min, linear increase from 0 to 15% B in 33 min, from 15 to 21% B in 15 min, and from 21 to 30% B in 20 min followed by washing and re-equilibration of the column. The column oven was maintained at 55 °C, the flow rate was 0.3 mL/min, and the injection volume was 5 µL.
Compounds were identified by comparing their UV spectra recorded with the diode array detector and those reported in the literature. In addition, an HPLC–MS analysis was conducted to confirm each peak identity. For this, a liquid chromatograph coupled to a QDA mass detector (Waters, PA, USA) was used. Elution was performed with the HPLC analysis conditions detailed above. The mass spectrometer operated in positive-ion mode for anthocyanin and pyranoanthocyanin confirmation, with a capillary voltage of 1.5 kV and in negative-ion mode for flavonol, phenolic acid and flavan-3-ol confirmation, with a capillary voltage of 0.3 KV. In both modes, the cone voltage was 30 V, and the desolvation temperature of 350 °C. Mass scans (MS) were measured from m/z 100 up to m/z 1200.
The quantification of different phenolic compounds was conducted by external standards. Concretely, anthocyanins and pyranoanthocyanins were quantified at 520 nm as malvidin-3-glucoside chloride. Gallic acid and flavan-3-ols were quantified at 280 nm, using the pure compounds as external standards. The hydroxycinnamic derivatives were quantified as caffeic acid at 320 nm and flavonols at 360 nm as quercetin-3-glucoside.
2.4. Determination of Phenolic Compounds by SEC
For the determination of phenolic compounds by size exclusion chromatography (SEC), the method of Kennedy and Taylor [24], adapted by Castro-López et al. [25], was carried out. Methanolic extracts obtained as indicated above and diluted (1/3 v/v) with N,N-dimethylformamide were used for determining the phenolic profile of the different wines.
The isocratic method used for the analysis employed as mobile phase a solution of glacial acetic acid (1% v/v), MilliQ water (5% v/v), and lithium chloride (0.15 M) in N,N-dimethylformamide. The injection volume was 10 µL and the flow rate used was 1 mL/min. A double column of PLgel (styrene-divinylbenzene copolymers in ethylbenzene; 300 × 7.5 mm each, 5 µm, with 100 and 500 Å individual pore size, effective molecular mass range up to 4000 using polystyrene standards) was used protected by a precolumn of the same material (50 × 7.5 mm, 5 µm) both provided by Polymer Labs (Amherst, MA, USA). The column was maintained at a controlled temperature of 60 °C and the samples were monitored at 280 nm.
2.5. Statistical Analysis
A one-factor analysis of variance was performed using the statistical package Statgraphics Centurion XVI.3 (Statpoint Technologies, Inc., The Plains, VA, USA).
3. Results and Discussion
The results shown in Table 1 indicated a significant increase in wine color intensity in the wines made from microwaved grapes, the differences being already significant when maceration lasted only 72 h, with a 13.5% color increase in the wine from treated grapes compared with its control wine.

Table 1.
Chromatic parameters analyzed by spectrophotometry at the time of bottling.
Also, total phenol content, total anthocyanins, and the tannin concentration were positively affected by the prefermentative treatment. Other studies had already shown that microwave maceration was highly effective in the extraction of phenolic compounds and also for the sanitization of the must, and therefore, its use could reduce the need for the must sulfation [16]. Wojdyło et al. [26] also found that a high amount of total polyphenols was measured in a must pre-treated with microwaves, even higher than when maceration enzymes or thermomaceration was used. Carew et al. [16], also applied microwave maceration in red grape cv. Pinot Noir must, and demonstrated a more effective extraction of polyphenols (total polyphenols, anthocyanin, and tannin content) from grapes to musts and the positive results were maintained even after 6 and 18 months of bottle aging.
The largest increases were observed in tannin content, a 30% increase being recorded if maceration lasted 72 h and almost 40% when maceration lasted seven days. Carew et al. [15] also reported that microwave maceration applied to Pinot Noir in four cycles of 1 min, up to a peak temperature of 71 °C, resulted in a twofold increase in the concentration of tannin. These authors expressed their concern, given the high tannin concentration observed in microwave-macerated wines, regarding an over-extraction of tannins. We have to be aware that too high tannin concentration may impart bitterness and a high astringency to wine, but Carew et al. [16], performing an informal tasting of the microwave and control wines, found both wines to be free of faults, and the microwave wines to have a fuller, softer mouthfeel and greater palate length than the control wines. Similar to the results of these authors, the aroma and sensory characteristics of these same wines were also studied by Muñoz-Garcia et al. [27] and they reported that grape MW treatment significantly increased the free and bound fraction of most varietal compounds in the must and the wines from microwave maceration showed an increase in some volatile compounds of sensory relevance and they reached higher scores in the sensory assessment.
One other important point is that the traditional maceration method requires winery tank space, and this space can be a limitation for winery productivity at the peak moments of harvest. Therefore, techniques that speed up the phenolic extraction during red wine vinifications could improve the winery performance [28,29]. Our results showed that the use of microwaves could clearly reduce the maceration time. When comparing the chromatic parameters of the wine obtained from grapes treated with microwaves and 72 h of maceration and the control wine made with 7 days of skin maceration, it can be clearly observed that no significant differences could be found in any of the measured chromatic parameters.
The wine tannins were also analyzed by phloroglucinolysis (Table 2), to determine how microwaves treatment could affect their composition. Similar to the results measured for MCPT in Table 1, the prefermentative microwaves treatment clearly increased tannin content at both maceration time and again, the tannin content from the wine made with treated grapes and 72 h of maceration did not differ from the values determined in control wine with seven days of maceration.
Table 2.
Concentration and composition of the wine tannins using the phloroglucinolysis method (HPLC) at the time of bottling.
When maceration lasted 72 h, the MW treatment did not modify the mDP of the wine tannins, nor the %EGC or the %Gal, indicating that although the tannin content was increased, the profile of the tannins did not change. However, with a maceration time of seven days, the mDP of the tannins, both in control and treated wine, decreased as did the percentage of EGC, and the %Gal increased, indicating a higher extraction of seed tannins as maceration time increased. These increases were even more important in the wines made from MW-treated grapes and seven days of maceration. It seems that the grape treatment, similarly to what it has been described in US-treated grapes [5], favored the extraction of seed tannins in long maceration periods.
Table 3 shows the concentration of individual phenolic compounds determined by HPLC. The results confirmed the higher extraction of anthocyanins, both monomeric and acylated ones, in wines from control and MW-treated grapes, after 7 days of maceration, although no significant differences were found. These results do not coincide with those obtained in the analysis of total anthocyanins by spectrophotometry, which encompasses the detection of monomeric as well as polymeric anthocyanins, indicating an increase in the polymerization of these compounds due to the use of MW.
Table 3.
Phenolic compounds (mg/L) measured by HPLC.
The MW treatment led to wines with a higher concentration of type A pyranoanthocyanins and only slightly increased the vitisin B and malvidin-(6-coumaroyl)-3-glucoside acetaldehyde content, possibly also due to the participation of acetaldehyde in the formation of other pigments such as ethyl-linked flavanol-anthocyanin adducts, which showed the highest concentration in wines of treated grapes with 7 maceration days or even in the flavanol pyranoanthocyanins, only found in these latest wines. Moreover, the peonidin-3-glucoside-4-vinylphenol (a hydroxyphenyl pyranoanthocyanin or pinotin) was presented in the greatest amount in grape MW-treated wines and especially with increasing the maceration time. Casassa et al. [14] also found that MW favored the formation of pyranoanthocyanins. The main interest in the formation of these pigments is that they have a greater color intensity and stability against pH changes and SO2 bleaching than the monomeric anthocyanins [30] contributing to the progressive shift of the red-purple color of young wines to a more orangish color.
Flavonols are important wine phenolic compounds, especially for their antioxidant effects and for their contribution to copigmentation in young wines. Their wine concentration increased when the grapes were treated with MW, those wines presenting, at both maceration time assayed, a higher concentration of these compounds, the increase being very marked when maceration lasted 7 days. Myricetin and quercetin-3-glucoside and quercetin-3-glucuronide were the flavonols present at higher concentration. The concentration of flavonols in the wine from treated grapes and 72 h of maceration did not differ from the concentration measured in control wine with 7 days of maceration whereas the wine with MW treated grapes and 7 days of maceration presented a 22% increase in flavonols, compared with its control wine. Wojdyło et al. [26] also reported an important extraction of flavonols in must pre-treated with microwaves.
Phenolic acids, which come mainly from grape pulp [31] were also affected by microwave treatment, with higher values of these compounds compared to control wine when maceration lasted 72 h. Gallic, caftaric, and caffeic acids were found in high concentrations, although an increase in maceration time only increased the content of gallic and p-coumaric acids. The increase observed in p-coumaric acid may be due to a partial hydrolysis of cutaric acid, which occurs during the fermentation process [32], while gallic acid can also proceed from the hydrolysis of galloylated tannins [33,34], which are extracted in great quantity from grape seeds [23]. The presence of phenolic acids can contribute to the color stabilization of red wines due to the copigmentation effect and/or participate in the formation of anthocyanin-derived pigments (i.e., pinotins and portisins) [35,36].
Monomeric flavanols were also increased with microwaves. These compounds can be extracted from both the skin and the seeds of the grape or even can proceed with the condensed tannin depolymerization, which takes place at the pH value of wine [23,37]. In this case, only catechin concentration increased with 72 h of maceration, showing values even higher than those found in the control wine with 7 maceration days, although the highest values of this compound and its isomer, epicatechin, were reached in wines from MW-treated grapes with 7 maceration days. These compounds seem to show a greater capacity to react with the anthocyanins than the tannins [38,39], favoring the formation of stable pigments and therefore, contributing to the color stabilization of wine.
The analysis of the wines with size exclusion chromatography allowed to determine how the grape microwave treatment affected the profile of the wine phenolic compounds and their molecular weight distribution. The results can be observed in Figure 1, and they reflected the data from the tables; that is, maceration time and grape microwave treatments did increase the concentration of wine phenolic compounds.
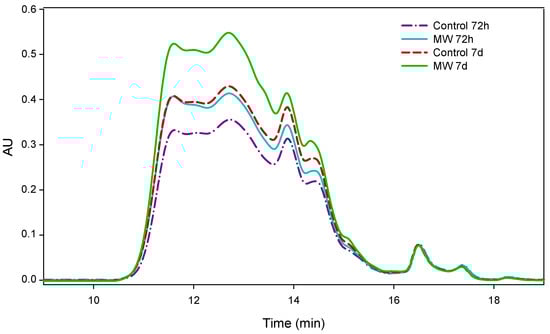
Figure 1.
Mass distribution of the phenolic compounds analyzed by SEC at the time of bottling.
The largest differences in the area under the curves were observed between 11 and 15 min, where the large and medium molecular weight phenolic compounds were eluted, the highest values were observed in the wine made with MW-treated grapes, and 7 days of skin maceration and the lowest in the control wine with 72 h of maceration. Similar to the data shown in the tables, the control wine with seven days of maceration and the wine made with treated grapes and 72 h of maceration presented almost the same profile, indicating how the MW treatment of the grapes and only 72 h of maceration allowed to obtain a wine similar to the control wine with seven days of maceration.
4. Conclusions
The results of this study confirm, contrary to previous results, that MW treatment of Cabernet Sauvignon grapes increased wine chromatic characteristics, significantly increasing the content of anthocyanins, tannins, and stable pigments, resulting in wines with greater color and stability over time. In addition, with only 72 h of maceration, the wines from treated grapes showed a similar phenolic content and chromatic characteristics to control wine from untreated grapes with 7 maceration days. Moreover, the tannins of treated grape wine showed a higher average degree of polymerization, due to a greater extraction of tannins from the skin and a lower participation of tannins from the seeds (which can more negatively affect the sensations of astringency and bitterness). Therefore, these results show the potential of microwaves as a winery technology for increasing wine phenolic content and/or reducing maceration time, without negatively affecting wine sensory characteristics.
Author Contributions
P.P.-P. formal analysis, methodology, writing—original draft, E.G.-P. conceptualization, investigation, writing—original draft, data curation, writing—review and editing, R.M.G. formal analysis, methodology, writing—original draft, M.C.D.-M. conceptualization, investigation, writing—review and editing, J.D.M.-O. formal analysis, methodology, writing—review and editing, were in charge of the conceptualization as well as in the investigation, helped by A.B.B.-O. conceptualization, investigation, writing—original draft, data curation, writing—review and editing. All authors have read and agreed to the published version of the manuscript.
Funding
This research was funded by the Ministerio de Ciencia, Innovación y Universidades from the Spanish Government and Feder Funds, grant number RTI2018-093869-B-C21 and B-C22.
Conflicts of Interest
The authors declare no conflict of interest. The funders had no role in the design of the study; in the collection, analyses, or interpretation of data; in the writing of the manuscript; or in the decision to publish the results.
References
- Sacchi, K.L.; Bisson, L.F.; Adams, D.A. A review of the effect of winemaking techniques on phenolic extraction in red wines. Am. J. Enol. Vitic. 2005, 56, 197–206. [Google Scholar]
- Bautista-Ortín, A.B.; Fernández-Fernández, J.I.; López-Roca, J.M.; Gómez-Plaza, E. The effects of enological practices in anthocyanins, phenolic compounds and wine colour and their dependence on grape characteristics. J. Food Compos. Anal. 2007, 20, 546–552. [Google Scholar] [CrossRef]
- Puértolas, E.; Hernández-Orte, P.; Saldaña, G.; Álvarez, I.; Raso, J. Improvement of winemaking process using pulsed electric fields at pilot-plant scale. Evolution of chromatic parameters and phenolic content of Cabernet Sauvignon red wines. Food Res. Int. 2010, 43, 761–766. [Google Scholar] [CrossRef]
- Maza, M.A.; Martínez, J.M.; Delso, C.; Camargo, A.; Raso, J.; Álvarez, I. PEF-dependency on polyphenol extraction during maceration/fermentation of Grenache grapes. Inn. Food Sci. Emerg. Technol. 2020, 60, 102303. [Google Scholar] [CrossRef]
- Pérez-Porras, P.; Bautista-Ortín, A.B.; Jurado, R.; Gómez-Plaza, E. Using highpower ultrasounds in red winemaking: Effect of operating conditions on wine physicochemical and chromatic characteristics. LWT 2021, 138, 110645. [Google Scholar] [CrossRef]
- Oliver Simancas, R.; Díaz-Maroto, M.C.; Alañón Pardo, M.E.; Pérez Porras, P.; Bautista-Ortín, A.B.; Gómez-Plaza, E.; Pérez-Coello, M.S. Effect of power ultrasound treatment on free and glycosidically-bound volatile compounds and the sensorial profile of red wines. Molecules 2021, 26, 1193. [Google Scholar] [CrossRef] [PubMed]
- Martínez-Lapuente, L.; Guadalupe, Z.; Ayestarán, B.; Pérez-Porras, P.; Bautista-Ortín, A.B.; Gómez-Plaza, E. Ultrasound treatment of crushed grapes: Effect on the must and red wine polysaccharide composition. Food Chem. 2021, 356, 129669. [Google Scholar] [CrossRef]
- Gao, L.; Girard, B.; Mazza, G.; Reynolds, A.G. Changes in anthocyanins and color characteristics of Pinot noir wines during different vinification processes. J. Agric. Food Chem. 1997, 45, 2003–2008. [Google Scholar] [CrossRef]
- Girard, B.; Kopp, T.P.; Reynolds, A.G.; Cliff, M. Influence of vinification treatments on aroma constituents and sensory descriptors of Pinot noir wines. Am. J. Enol. Vitic. 1997, 48, 198–206. [Google Scholar]
- Guzik, P.; Kulawik, P.; Zając, M.; Migdał, W. Microwave applications in the food industry: An overview of recent developments. Crit. Rev. Food Sci. Nutr. 2021, 10, 1–20. [Google Scholar] [CrossRef]
- Lik Hii, C.; Pheng Ong, S.; Ying Yap, J.; Putranto, A.; Mangindaan, D. Hybrid drying of food and bioproducts: A review. Dry. Technol. 2021, 39, 1554–1576. [Google Scholar]
- Barba, F.J.; Brianceau, S.; Turk, M.; Boussetta, N.; Vorobiev, E. Effect of Alternative Physical Treatments (Ultrasounds, Pulsed Electric Fields, and High-Voltage Electrical Discharges) on Selective Recovery of Bio-compounds from Fermented Grape Pomace. Food Bioproc. Technol. 2015, 8, 1139–1148. [Google Scholar] [CrossRef]
- Miljić, U.; Puškaš, V.; Vučurović, V. Investigation of technological approaches for reduction of methanol formation in plum wines. J. Inst. Brew. 2016, 1224, 635–643. [Google Scholar] [CrossRef]
- Casassa, L.; Sari, S.; Bolcato, E.; Fanzone, M. Microwave-Assisted Extraction Applied to Merlot Grapes with Contrasting Maturity Levels: Effects on Phenolic Chemistry and Wine Color. Fermentation 2019, 5, 15. [Google Scholar] [CrossRef]
- Carew, A.L.; Gill, W.; Close, D.C.; Dambergs, R.G. Microwave Maceration with Early Pressing Improves Phenolics and Fermentation Kinetics in Pinot noir. Am. J. Enol. Vitic. 2014, 65, 401–406. [Google Scholar] [CrossRef]
- Carew, A.L.; Sparrow, A.M.; Curtin, C.D.; Close, D.C.; Dambergs, R.G. Microwave Maceration of Pinot Noir Grape Must: Sanitation and Extraction Effects and Wine Phenolics Outcomes. Food Bioproc. Technol. 2013, 7, 954–963. [Google Scholar] [CrossRef]
- Carew, A.L.; Close, D.C.; Dambergs, R.G. Yeast strain affects phenolic concentration in Pinot noir wines made by microwave maceration with early pressing. J. Appl. Microbiol. 2015, 118, 1385–1394. [Google Scholar] [CrossRef]
- Casassa, L.F.; Huff, R.; Miller, E. Effect of Stem Additions and Microwave Extraction of Musts and Stems on Syrah, Merlot, and Cabernet Sauvignon Wines. In Proceedings of the 68th American Society for Enology and Viticulture National Conference, Seattle, WA, USA, 26–29 June 2017. [Google Scholar]
- Glories, Y. La couleur des vins rouges. lre Partie. Les équilibres des anthocyanes et des tanins. OENO One 1984, 18, 253–271. [Google Scholar] [CrossRef]
- Ho, P.; Da Silva, M.; Hogg, T.A. Changes in colour and phenolic composition during the early stages of maturation of port in wood, stainless steel and glass. J. Sci. Food Agric. 2001, 81, 1269–1280. [Google Scholar] [CrossRef]
- Ribéreau-Gayon, P.; Pontallier, P.; Glories, Y. Some interpretations of colour changes in young red wines during their conservation. J. Sci. Food Agric. 1983, 34, 505–516. [Google Scholar] [CrossRef]
- Smith, P.A. Precipitation of tannin with methyl cellulose allows tannin quantification in grape and wine samples. Tech. Rev. AWRI 2005, 158, 3–7. [Google Scholar]
- Busse-Valverde, N.; Gómez-Plaza, E.; López-Roca, J.M.; Gil-Muñoz, R.; Fernández-Fernández, J.I.; Bautista-Ortín, A.B. Effect of different enological practices on skin and seed proanthocyanidins in three varietal wines. J. Agric. Food Chem. 2010, 58, 11333–11339. [Google Scholar] [CrossRef]
- Kennedy, J.A.; Taylor, A.W. Analysis of proanthocyanidins by high-performance gel permeation chromatography. J. Chromatogr. A 2003, 995, 99–107. [Google Scholar] [CrossRef]
- Castro-López, L.; Gómez-Plaza, E.; Ortega-Regules, A.; Lozada, D.; Bautista-Ortín, A.B. Role of cell wall deconstructing enzymes in the proanthocyanidin–cell wall adsorption–desorption phenomena. Food Chem. 2016, 196, 526–532. [Google Scholar] [CrossRef] [PubMed]
- Wojdyło, A.; Samoticha, J.; Chmielewska, J. Effect of different pre-treatment maceration techniques on the content of phenolic compounds and color of Dornfelder wines elaborated in cold climate. Food Chem. 2021, 339, 127888. [Google Scholar] [CrossRef] [PubMed]
- Muñoz García, R.; Oliver Simancas, R.; Díaz-Maroto, M.C.; Alañón Pardo, M.E.; Pérez-Coello, M.S. Effect of Microwave Maceration and SO2 Free Vinification on Volatile Composition of Red Wines. Foods 2021, 10, 1164. [Google Scholar] [CrossRef] [PubMed]
- Pérez-Porras, P.; Bautista-Ortín, A.B.; Jurado, R.; Gómez-Plaza, E. Combining high-power ultrasound and enological enzymes during winemaking to improve the chromatic characteristics of red wine. LWT 2022, 156, 113032. [Google Scholar] [CrossRef]
- Paranjpe, S.S.; Ferruzzi, M.; Morgan, M.T. Effect of a flash vacuum expansion process on grape juice yield and quality. LWT 2012, 48, 147–155. [Google Scholar] [CrossRef]
- Marquez, A.; Serratosa, M.P.; Merida, J. Pyranoanthocyanin Derived Pigments in Wine: Structure and Formation during Winemaking. J. Chem. 2013, 2013, 713028. [Google Scholar] [CrossRef]
- Garrido, J.; Borges, F. Wine and grape polyphenols—A chemical perspective. Food Res. Int. 2013, 54, 1844–1858. [Google Scholar] [CrossRef]
- Somers, T.C.; Vérette, E.; Pocock, K.F. Hydroxycinnamate esters of Vitis vinifera: Changes during white vinification, and effects of exogenous enzymic hydrolysis. J. Sci. Food Agric. 1987, 40, 67–78. [Google Scholar] [CrossRef]
- Revilla, I.; Gonzalez-SanJose, M.L. Compositional changes during the storage of red wines treated with pectolytic enzymes: Low molecular-weight phenols and flavan-3-ol derivative levels. Food Chem. 2003, 80, 205–214. [Google Scholar] [CrossRef]
- Zou, H.; Kilmartin, P.A.; Inglis, M.J.; Frost, A. Extraction of phenolic compounds during vinification of Pinot Noir wine examined by HPLC and cyclic voltammetry. Aust. J. Grape Wine Res. 2002, 8, 163–174. [Google Scholar] [CrossRef]
- Bloomfield, D.G.; Heatherbell, D.A.; Nikfardjam, M.P. Effect of p-coumaric acid on the color in red wine. Mitt. Klost. 2003, 53, 195–198. [Google Scholar]
- He, F.; Liang, N.N.; Mu, L.; Pan, Q.H.; Wang, J.; Reeves, M.J.; Duan, C.Q. Anthocyanins and their variation in red wines II. Anthocyanin derived pigments and their color evolution. Molecules 2012, 17, 1483–1519. [Google Scholar] [CrossRef]
- Kontoudakis, N.; González, E.; Gil, M.; Esteruelas, M.; Fort, F.; Canals, J.M.; Zamora, F. Influence of Wine pH on Changes in Color and Polyphenol Composition Induced by Micro-oxygenation. J. Agric. Food Chem. 2011, 59, 1974–1984. [Google Scholar] [CrossRef]
- Saucier, C.; Lopes, P.; Mirabel, M.; Guerra, C.; Glories, Y. Tannin–anthocyanin interactions: Influence on wine color. In Red Wine Color; Revealing the Mysteries; ACS Symposium Series; Kennedy, J.A., Waterhouse, A., Eds.; American Chemical Society: Washington, DC, USA, 2004; Volume 886, pp. 265–274. [Google Scholar]
- Timberlake, C.F.; Bridle, P. Interactions between anthocyanins, phenolic compounds, and acetaldehyde and their significance in red wines. Am. J. Enol. Vitic. 1996, 27, 97–105. [Google Scholar]
Publisher’s Note: MDPI stays neutral with regard to jurisdictional claims in published maps and institutional affiliations. |
© 2022 by the authors. Licensee MDPI, Basel, Switzerland. This article is an open access article distributed under the terms and conditions of the Creative Commons Attribution (CC BY) license (https://creativecommons.org/licenses/by/4.0/).