Abstract
The present study explores the structural pavement design techniques related to pavement distresses in terms of pavement rutting, cracking and International Roughness Index (IRI) based on the materials properties, roadbed characteristics, climate and traffic loads for highway network of Saudi Arabia (KSA). The study was focused on selected site conditions at four regions in KSA: Central (Riyadh); Eastern (Al-Ahsa); Western (Jeddah) and Northern (Arar). Mechanistic-Empirical Pavement Design Guide (MEPDG) software was used to calibrate and predict pavement design life according to the mentioned distresses for different regions in the KSA. This is the first time where the exact weather stations were selected to run analysis on the software determining realistic pavement distresses. In the study, the pavement structure design is different for low traffic (700 AADTT) and high traffic (2000, 6000, and 10,000 AADTT). The tests were run on the MEPDG software to analyze the distresses predicted by the software for an interval of 5, 10, 15, and 20 years. The results predicted by the software show that the preliminary example design satisfies all the target distresses for the mentioned design life, even for 20 years. The study provides a base pavement design for pavement designers that can be modified as per project requirements using the specific data for traffic, material properties, thickness, and distress limit to achieve target design life.
1. Introduction
The modern day pavements in Saudi Arabia (KSA), and mostly all around the world, have experienced under-design due to financial constraints or unexpected traffic growth. The hot mix asphalt (HMA) pavement structures, also known as flexible pavements, require a more economic and suitable design as compared to other engineering structures. The engineers today face the challenge of building not only longer lasting stronger pavements but also in a restrained budget to full fill the demand of transporting people and goods from one place to another. Transportation has been playing a vital role in the advancement of the society, and the most widely used mode of transportation is the land mode and specifically highway mode. Therefore, a pavement not designed for a higher level of loading will fail earlier than the design life costing more money for repair. Currently, in KSA, AASHTO Guide for Design of Pavement Structure [1] along with the Marshall method are commonly used for structural design of asphalt pavements. These procedures are empirical, developed as long as half a century ago for much lighter traffic and low tire pressures compared to the existing conditions in KSA. Therefore, these procedures are incapable of providing reliable designs for existing heavy axle loads and tire pressure. AASHTO highway design method was not able to precisely predict paving efficiency; since the procedure was established using constrained testing of AASHTO roadways during the 1960s [2,3]. The use of AASHTO procedure for designing asphalt concrete pavements in KSA has been under discussion since the very start of asphaltic pavements. The mechanistic-empirical approach is promising but for it to produce satisfactory and cost-efficient asphalt mix design with appropriate equipment and local distress models its field verification has become essential. Actually, AASHTO Mechanistic-Empirical Pavement Design Guide (MEPDG) does a great job of predicting paving efficiency using more factors of available local resources, such factors as current traffic loads and climatic conditions, in contrast to conventional systems of empirical design [4,5]. Using AASHTO MEPDG provides meaningful results, which significantly improved pavement design, as well as resulting in savings from selecting more cost-effective material mixtures [6]. There are very restrictive literature, focused on a single location, available that address the actual climate data prevalent in KSA to ensure precise design using the AASHTO MEPDG. Precisely, ascertaining climate data for four different real location region conditions in KSA is the subject of this research. The introduction of different models for hot mix asphalt (HMA) dynamic modulus (E*) prediction, focused on the implementation of the ME Design in the KSA by developing a database containing mechanical properties of a wide variety of HMA mixtures is not the focus of the study [7]. Different studies have been conducted to calibrate rutting and IRI models, and results reveal that the adjusted coefficients are appropriate because the new coefficients of the rutting models reduced the bias from 4.90 to 0.03 and SSE from 317.68 to 61.71 while the new coefficients of the IRI model reduced the bias and SSE from 0.44, 0.31 to 0, 0.03 respectively. The major focus is to analyze the variable temperature of the actual variable climatic conditions in different parts of KSA [8]. Another study aimed to prepare data for calibration of MEPDG in Central Saudi Arabia. The goal was to collect data for the design of asphaltic pavement from the local conditions in Riyadh region [9]. Albuaymi also prepared a set of inputs required by the AASHTOWare for the central region of KSA. The validation of the AASHTOWare distress prediction models were conducted after calibration [10].
AASHTO MEPDG method is developed on mechanical and experiential basis [11]. It assumes that pavement can be modelled as a multi-layered elastic structure, and the design procedure carried out as a staged process over time. Critical stresses and strains within the structure are estimated by structural analysis at each time step, followed by the use of distress models for estimating incremental distresses such as rut depth, cracks, and roughness to the previously calculated stresses and strains. The empirical design method for the pavement performance was developed using predictions using laboratory-developed models to observe the differences between field performances and the predicted one. In addition, they utilized a significant amount of pavement segments of the long-term pavement performance program (LTPP) throughout North America [12,13]. Calibration of these models is therefore essential in order to implement them, considering environmental conditions, local materials, and traffic information. Factually, locally based calibration consideration factors are included in the AASHTO MEPDG distress modelling only to consider the differences in maintenance policies, material specifications, and construction practices across the USA [14]. Confirmation of predicted performance models is a critical step in order to establish reliability prior to their adoption for designing practices [15]. A biased model with significant cost effects consistently produces over designed or poorly designed pavements. An inaccurate model leads to inefficiencies for design performance [16]. AASHTO MEPDG prediction model validation conducted for ensuring calibrating paving models yield accurate and robust paving failure predictions for different cases compared to the ones used in calibrating.
Roads are an essential part of any country infrastructure, and researchers have devoted great effort over recent decades to improve the structure design of flexible pavements. Figure 1 presents the evolution of pavement design methods (only the well-known methods) through the previous decades. Currently, the US Departments of Transportation (DOTs) implement different pavement structure design methods, and most DOTs implement more than one method of design for the same pavement type. A recent survey, in 2014 revealed that the AASHTO empirical methods (1993 and earlier versions) are by far the most used design methods among the US transportation agencies [17].
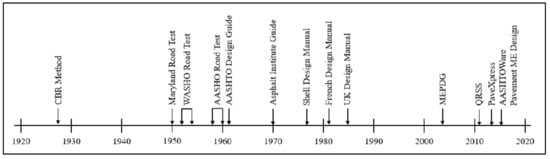
Figure 1.
The development of flexible pavement design methods [18].
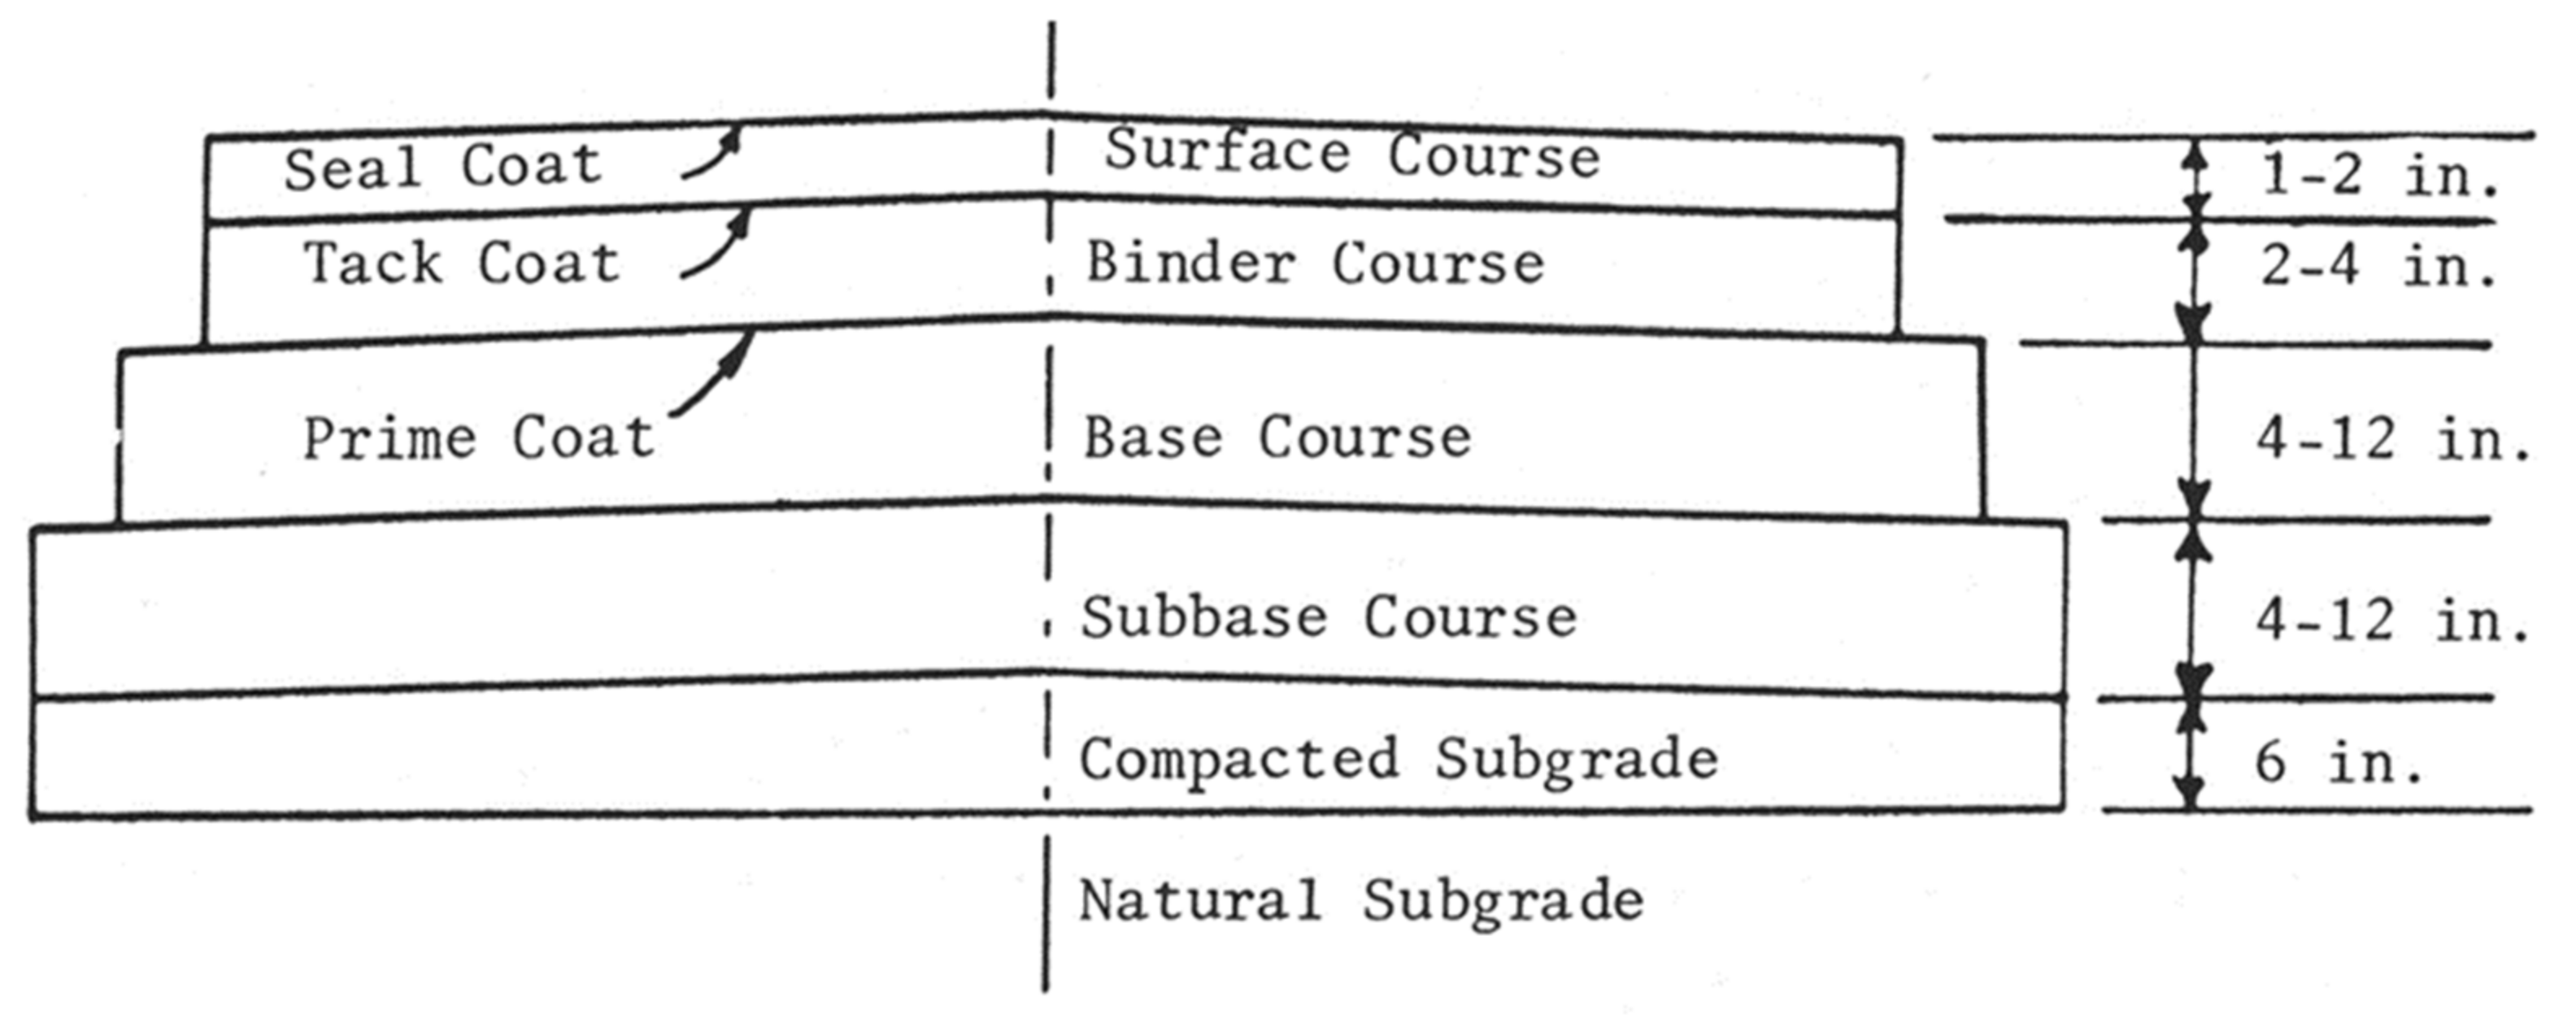
The design of flexible pavements has progressively evolved from an art to a complicated science but the empirical approach still has an important role in the pavement design process. In earlier days up to 1920s, the thickness of the pavement was determined based on experience or certain thumb rules and the same thickness of the pavement was used for a particular section of the pavement irrespective of the varying underlying soil conditions. As time passed and more and more experience was gained, different agencies started to develop various methods to determine the thickness required for a particular pavement. The load applied on top of the flexible pavement causes different stresses and strains throughout the layers from top to the bottom decreasing in magnitude. The typical cross section of the layered system in a flexible pavement is shown in Figure 2. The mechanistic-empirical method is based on the mechanical properties of the materials that give a relation between the input, in the form of loading, and the output, in the form of stresses and strains in the pavement. The stress strain values, response values, are used to determine the distress from laboratory and field data. This approach is much better as the performance cannot be determined by theory alone.

Figure 2.
Typical cross section of the layered system in conventional flexible pavement [19].
The main objective of this study was the implementation of the new AASHTO Mechanistic-Empirical Pavement Design Guide (MEPDG) for pavement design in KSA. The MEPDG procedures are intended for designing and analyzing new and rehabilitated pavement structures. Empirical transfer functions use the critical responses with material properties to estimate pavement performance throughout the pavement design life. Pavement performance is expressed in the form of rutting, longitudinal and alligator fatigue cracking, thermal cracking, and pavement roughness. The prediction precision of the empirical models depends heavily on the hierarchical input levels of the design parameters and the calibration of transfer functions [20,21]. In MEPDG (the latest production software version in AASHTOWare Pavement ME Design) [22], the performance models for rutting and alligator fatigue cracking with the calibration coefficients are explained briefly [21]. This main objective took into consideration the changes in the materials along with prevailing environmental and traffic loading in various regions of KSA. The primary objective of the design of a hot mix asphalt (HMA) pavement is to resist the rutting of the subgrade and the bottom-up fatigue cracking. In a traditional approach while designing a pavement, the thickness of the pavement must increase with an increase in the design load, and this traditional approach is based on the concept that in the case of thicker pavements bottom-up cracking does not occur. Distress is the most important factor to consider in the pavement design as it is directly related to the pavement performance. Each of the failure criteria defined under distresses needs to be used in the mechanistic-empirical design approach. Among the various distress, some are caused due to the deficits in materials, construction, and proper maintenance and are not related to the pavement design directly. The distress evaluation in pavements is an important part of the pavement management system, if the pavements are evaluated properly and a strategy is developed in an effective method then proper maintenance and rehabilitation can be performed at the right time.
Typical pattern observed in deterioration of HMA pavements is rutting, this develops rapidly in the initial years and then levels off to a much slower rate. The fatigue cracking usually does not occur until several repeated loadings, once it starts then it increases rapidly as the pavement is weakened. Generally, the main causes of the failure of HMA pavements are the defect in quality of material used along with the method of construction and quality control during construction. Moreover, four main causes of failures are the surface and subsurface drainage problem, increase in traffic volume and the magnitude of wheel load, deformation in foundation, and the environmental factors including heavy rainfall, snow, rising water table, frost action. The distresses in pavement are classified into three major groups named as cracking, deformation, and surface defects [19]. Although the concept of pavement structural design may vary from country to country, but the input is found to be similar. The damage models were also found to be common including the following:
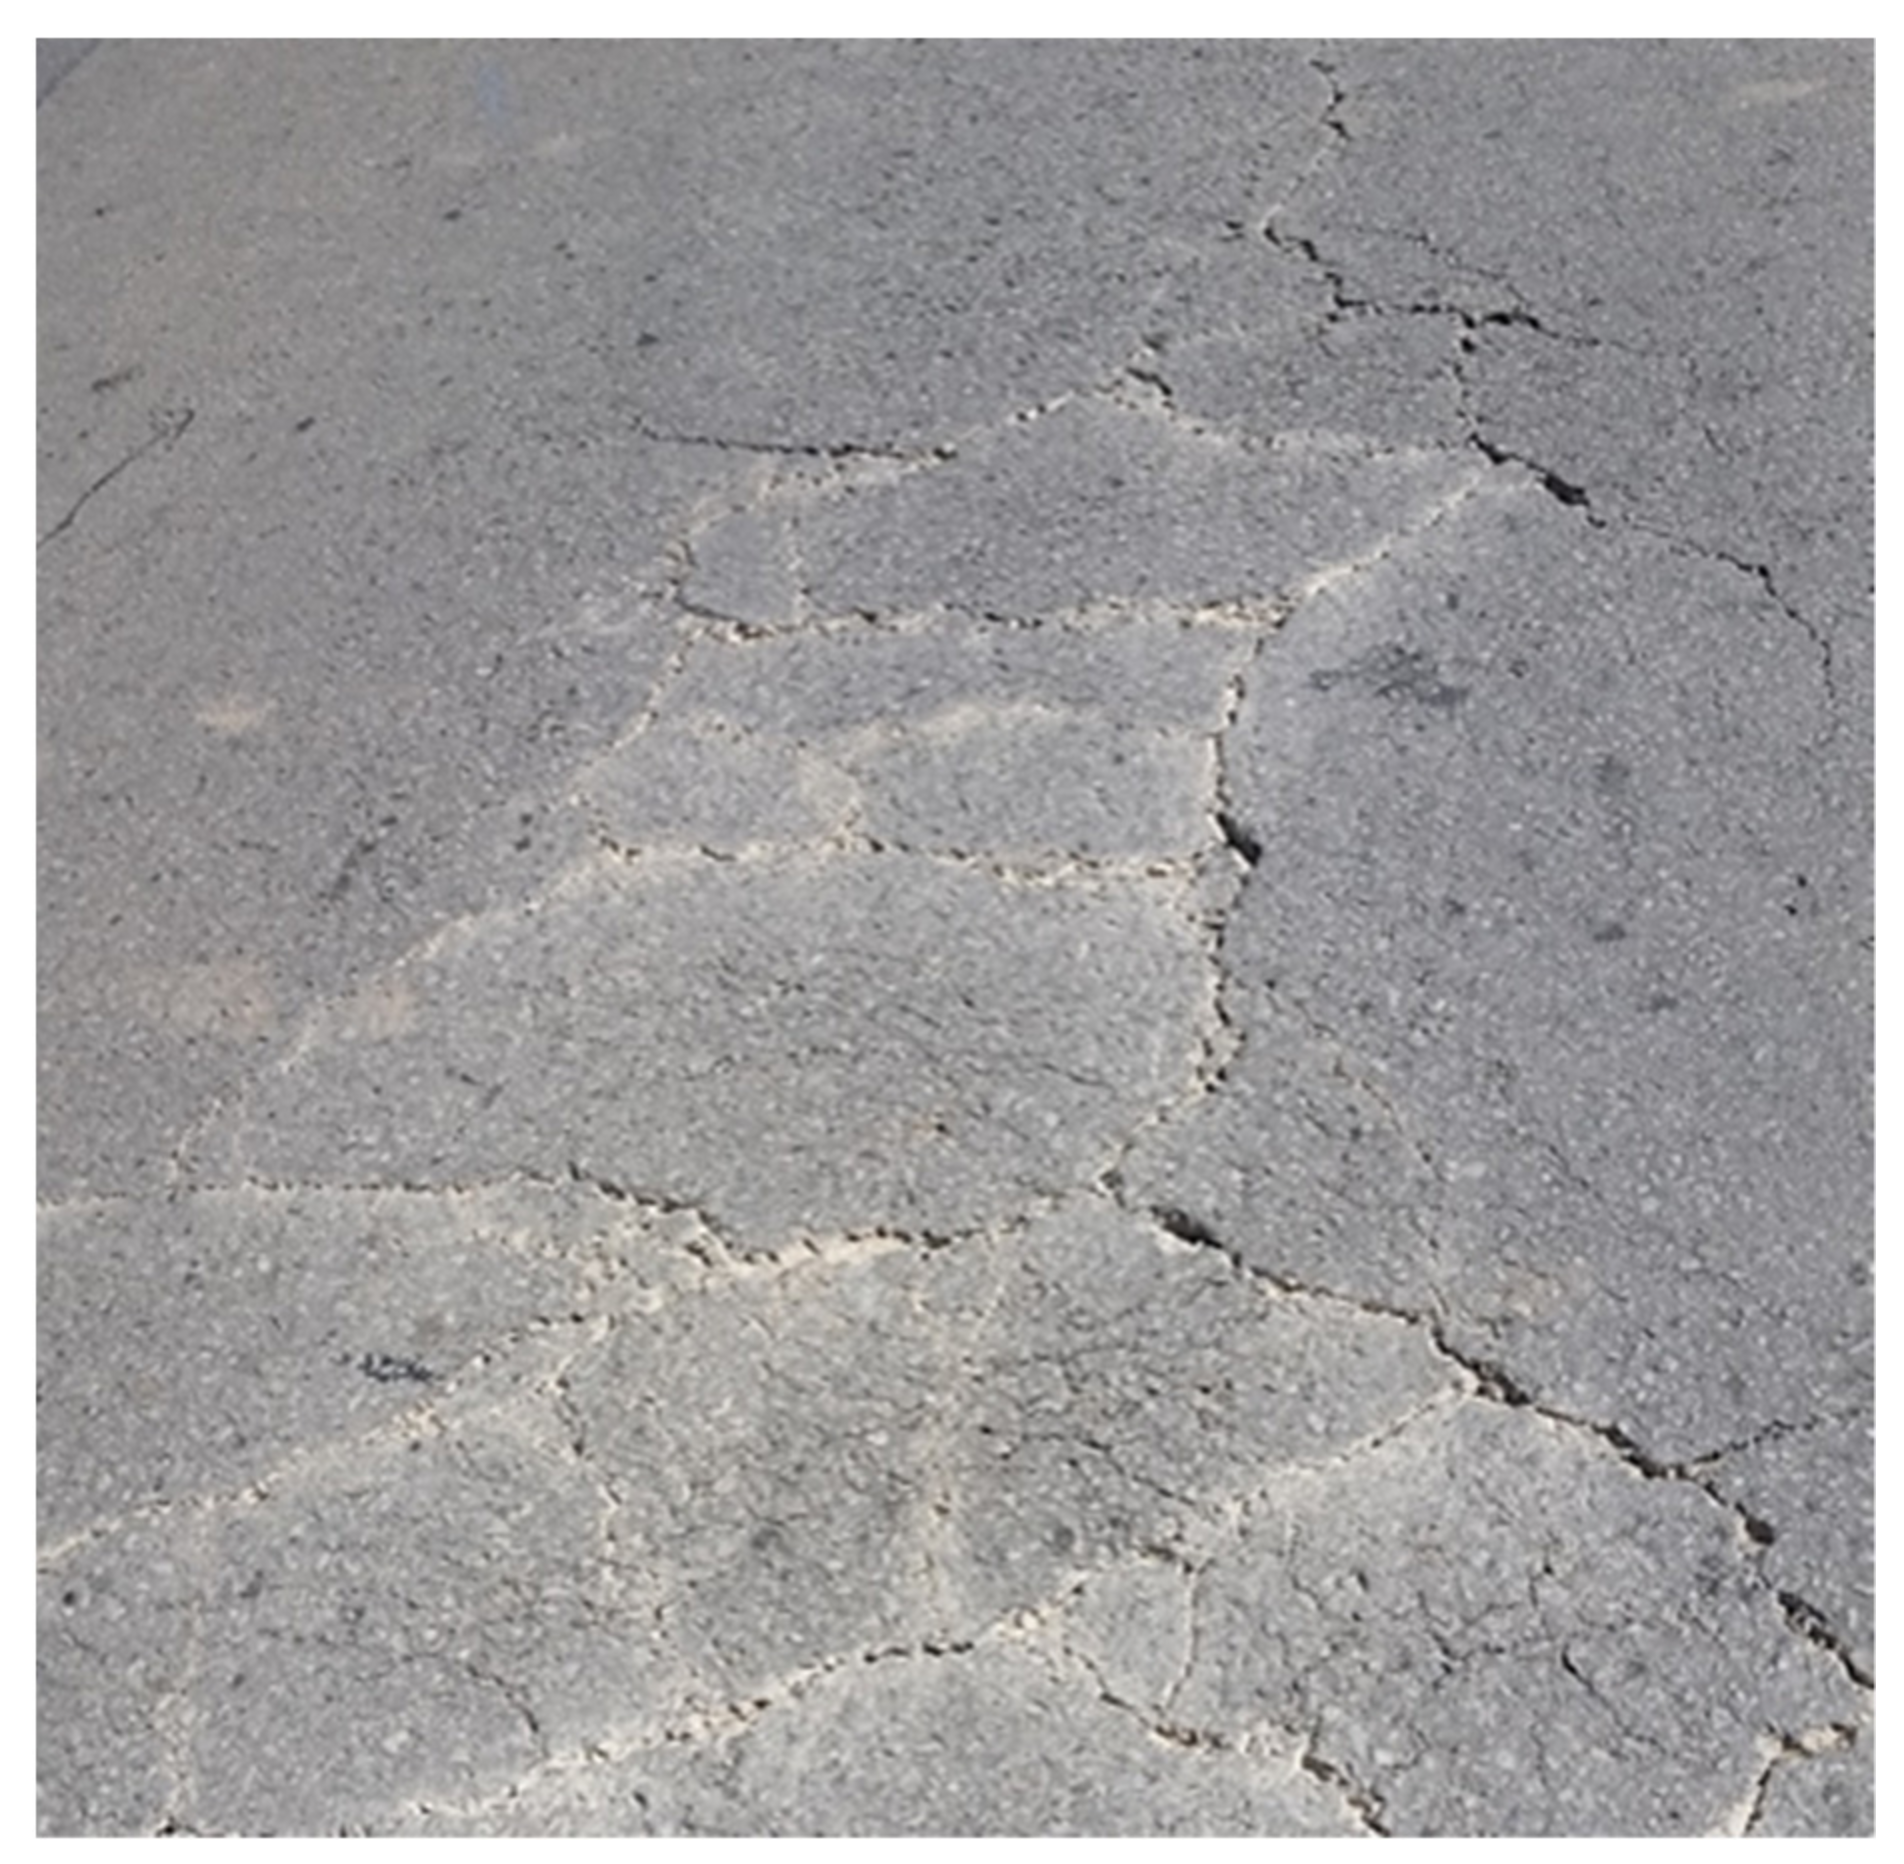
- Rutting (asphalt layer), Figure 3;
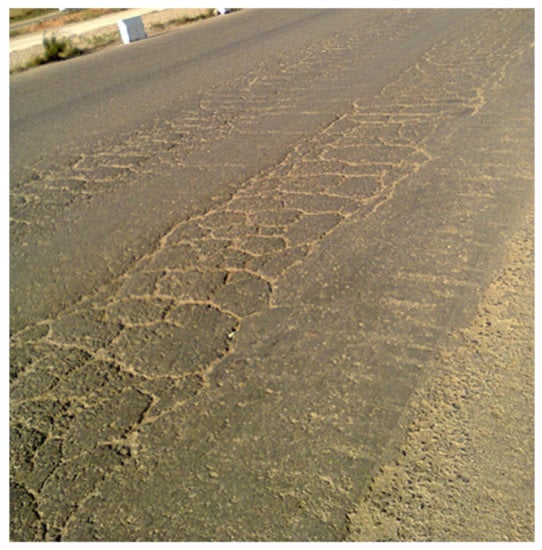 Figure 3. Example of rutting in flexible pavement.
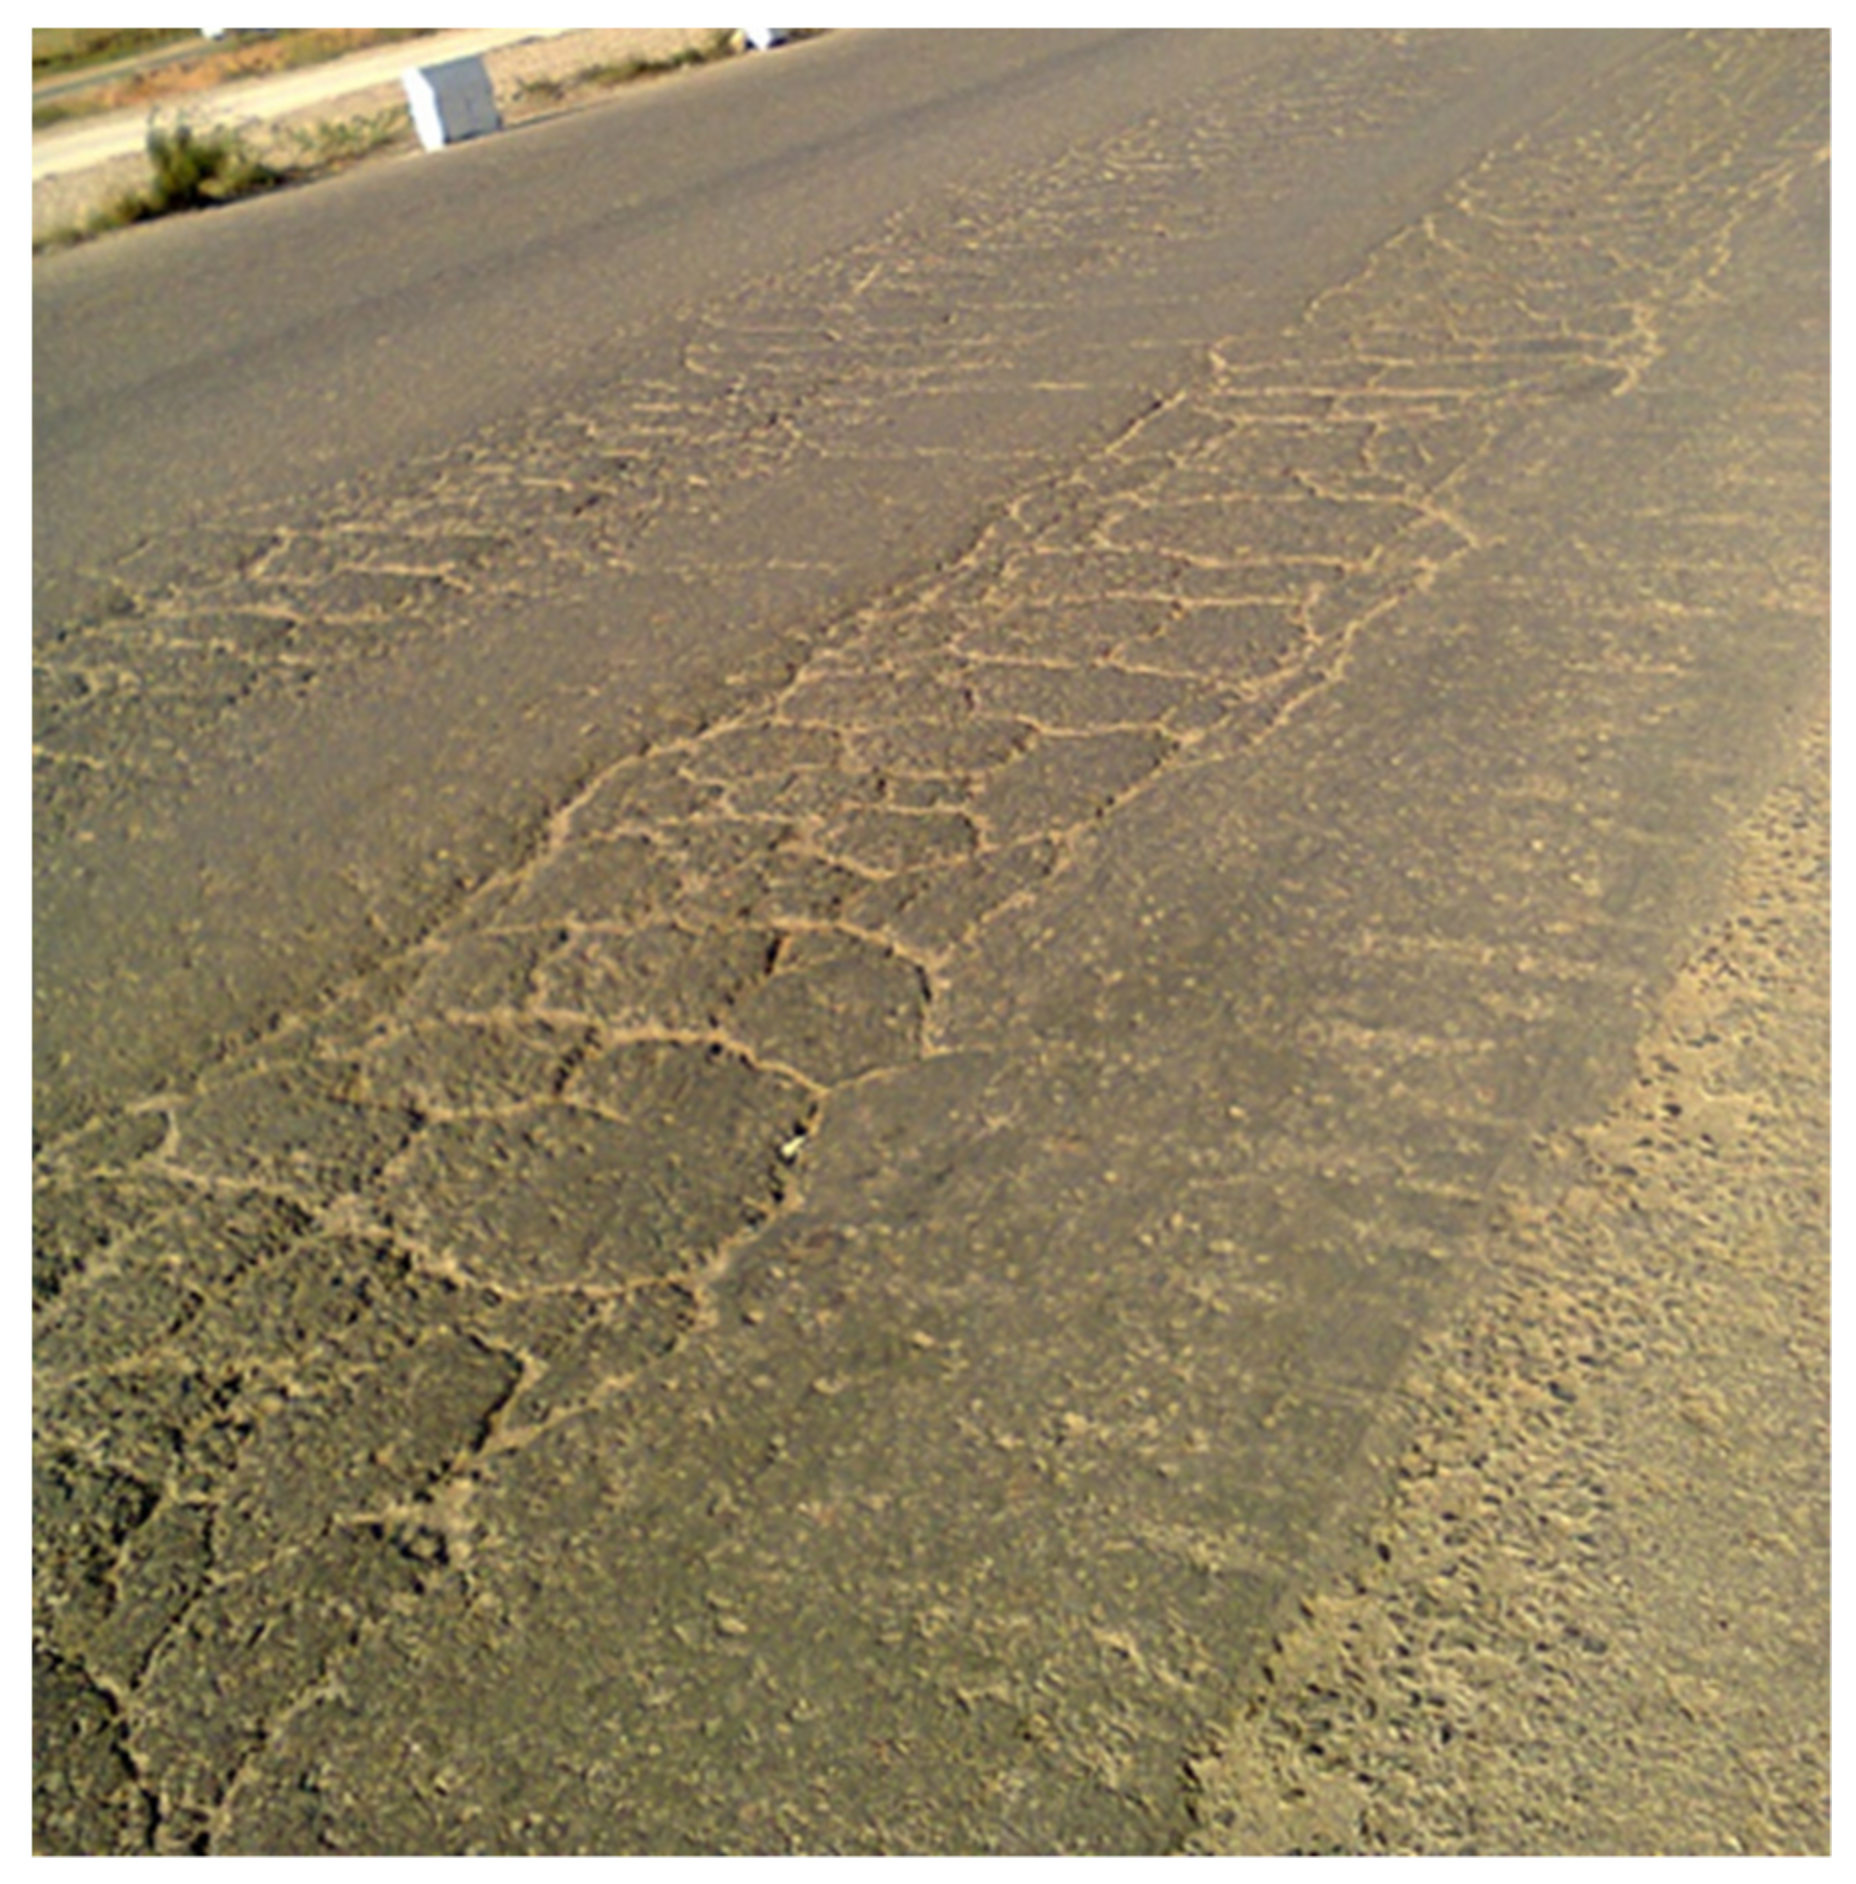
 - Fatigue is parallel to the road (asphalt layer and stabilized soil), Figure 4;
 Figure 4. Example of fatigue and thermal cracking in flexible pavement.
 - Thermal cracking is perpendicular to the road (asphalt layer), Figure 4.
2. Background of Study
AASHTO MEPDG is believed to provide meaningful results which significantly improved paving design, as well as resulting in savings from selecting more cost-effective material mixtures. Hence the software application can be found in several countries around the globe namely: India, China, Costa Rica, Qatar, UAE, Egypt, Korea, Hungary, Argentina, Peru, and Germany [23,24,25,26,27,28,29,30,31,32,33,34]. No calibration coefficients are known that address the conditions prevalent in Saudi Arabia to ensure precise design with the AASHTO MEPDG. For that purpose, ascertaining calibration factors for conditions in Saudi Arabia is the subject of this research. The specific research objectives for the project are as following:
- Literature review of local studies for calibration of MEPDG and comparison of results with this study.
- Collection of climatic and traffic data and study their influence in the model and overall design.
- Performing calibration and validation of MEPDG Software in local condition.
3. Methodology
The research methodology adopted, shown in Figure 5, for the project was very specific and organized to achieve all the research objectives determined initially. The output intended from the project is to develop generic regional guidelines for pavement structure to satisfy existing conditions in KSA in terms of the traffic, climate, and material characterization. The current licensed software provides access to various climatic files available on the AASHTOWare website. The process on how to select different location and download the climate files is elaborated in the manual for the software. There is an option to select the desired location online and download the updated climate data base files for the particular location through the website from Modern-Era Retrospective Analysis for Research and Applications (MERRA) for MEPDG Inputs. Hence, MERRA data covers the entire globe, climate data for the four regions in KSA, which can be readily selected from the software for design. Based on the literature review and data collected from Ministry of Transport (MOT), MEPDG Software was used to predict pavement distresses in terms of pavement rutting, fatigue cracking, and International Roughness Index (IRI) for the local conditions. Figure 5 shows the flow-chart for the methodology which was implemented to progress work according to the plan.
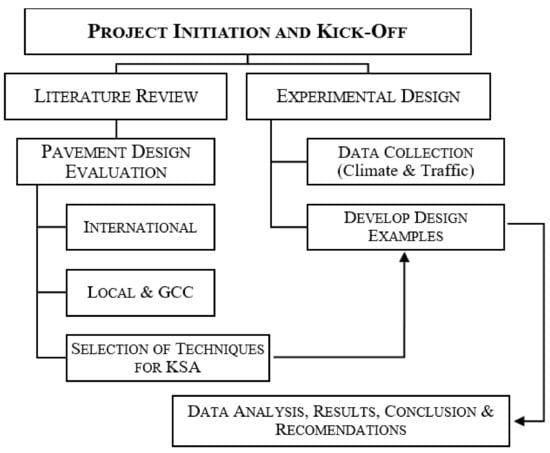
Figure 5.
Flow-chart for the activities.
To adopt the mechanistic-empirical design method to develop structural pavement deign in KSA, there is a need to consider the influence of site conditions (different climatic regions), traffic loading and asphalt mixture characteristics including binder properties. The MEPDG allows engineers to predict pavement performance (i.e., development of distresses such as rutting and alligator cracking over the design period) because the software incorporates more fundamental material characteristics (such as the dynamic modulus (|E*|) master curve), climate data, axle-load spectra, and other advances. The overall pavement design framework of the MEPDG is shown in Figure 6.
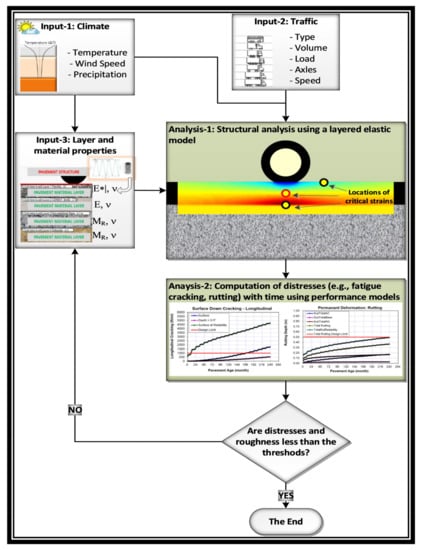
Figure 6.
Overall framework of MEPDG [35].
Due to the complexity of material inputs required, a hierarchical input data scheme has been implemented in the AASHTO MEPDG Software. Level 1 inputs are site-specific and considered the most accurate as they are determined from actual measurements of the materials used in a specific project. Level 2 inputs are used when the designer has a modest understanding of the input parameters for the software. This level is used when limited resources and data are available. Level 3 inputs are used when the designer has insufficient materials data for the project and is forced to use default values. In summary, Level 1 is considered the most accurate and normally involves comprehensive laboratory and field testing. In contrast, Level 3 is the simplest and considered the least accurate, as it requires estimate of input vales based on experience with no testing. Inputs at Level 2 are estimated through correlation with other material properties that are measured in the laboratory or field, which is the method that was used in this study.
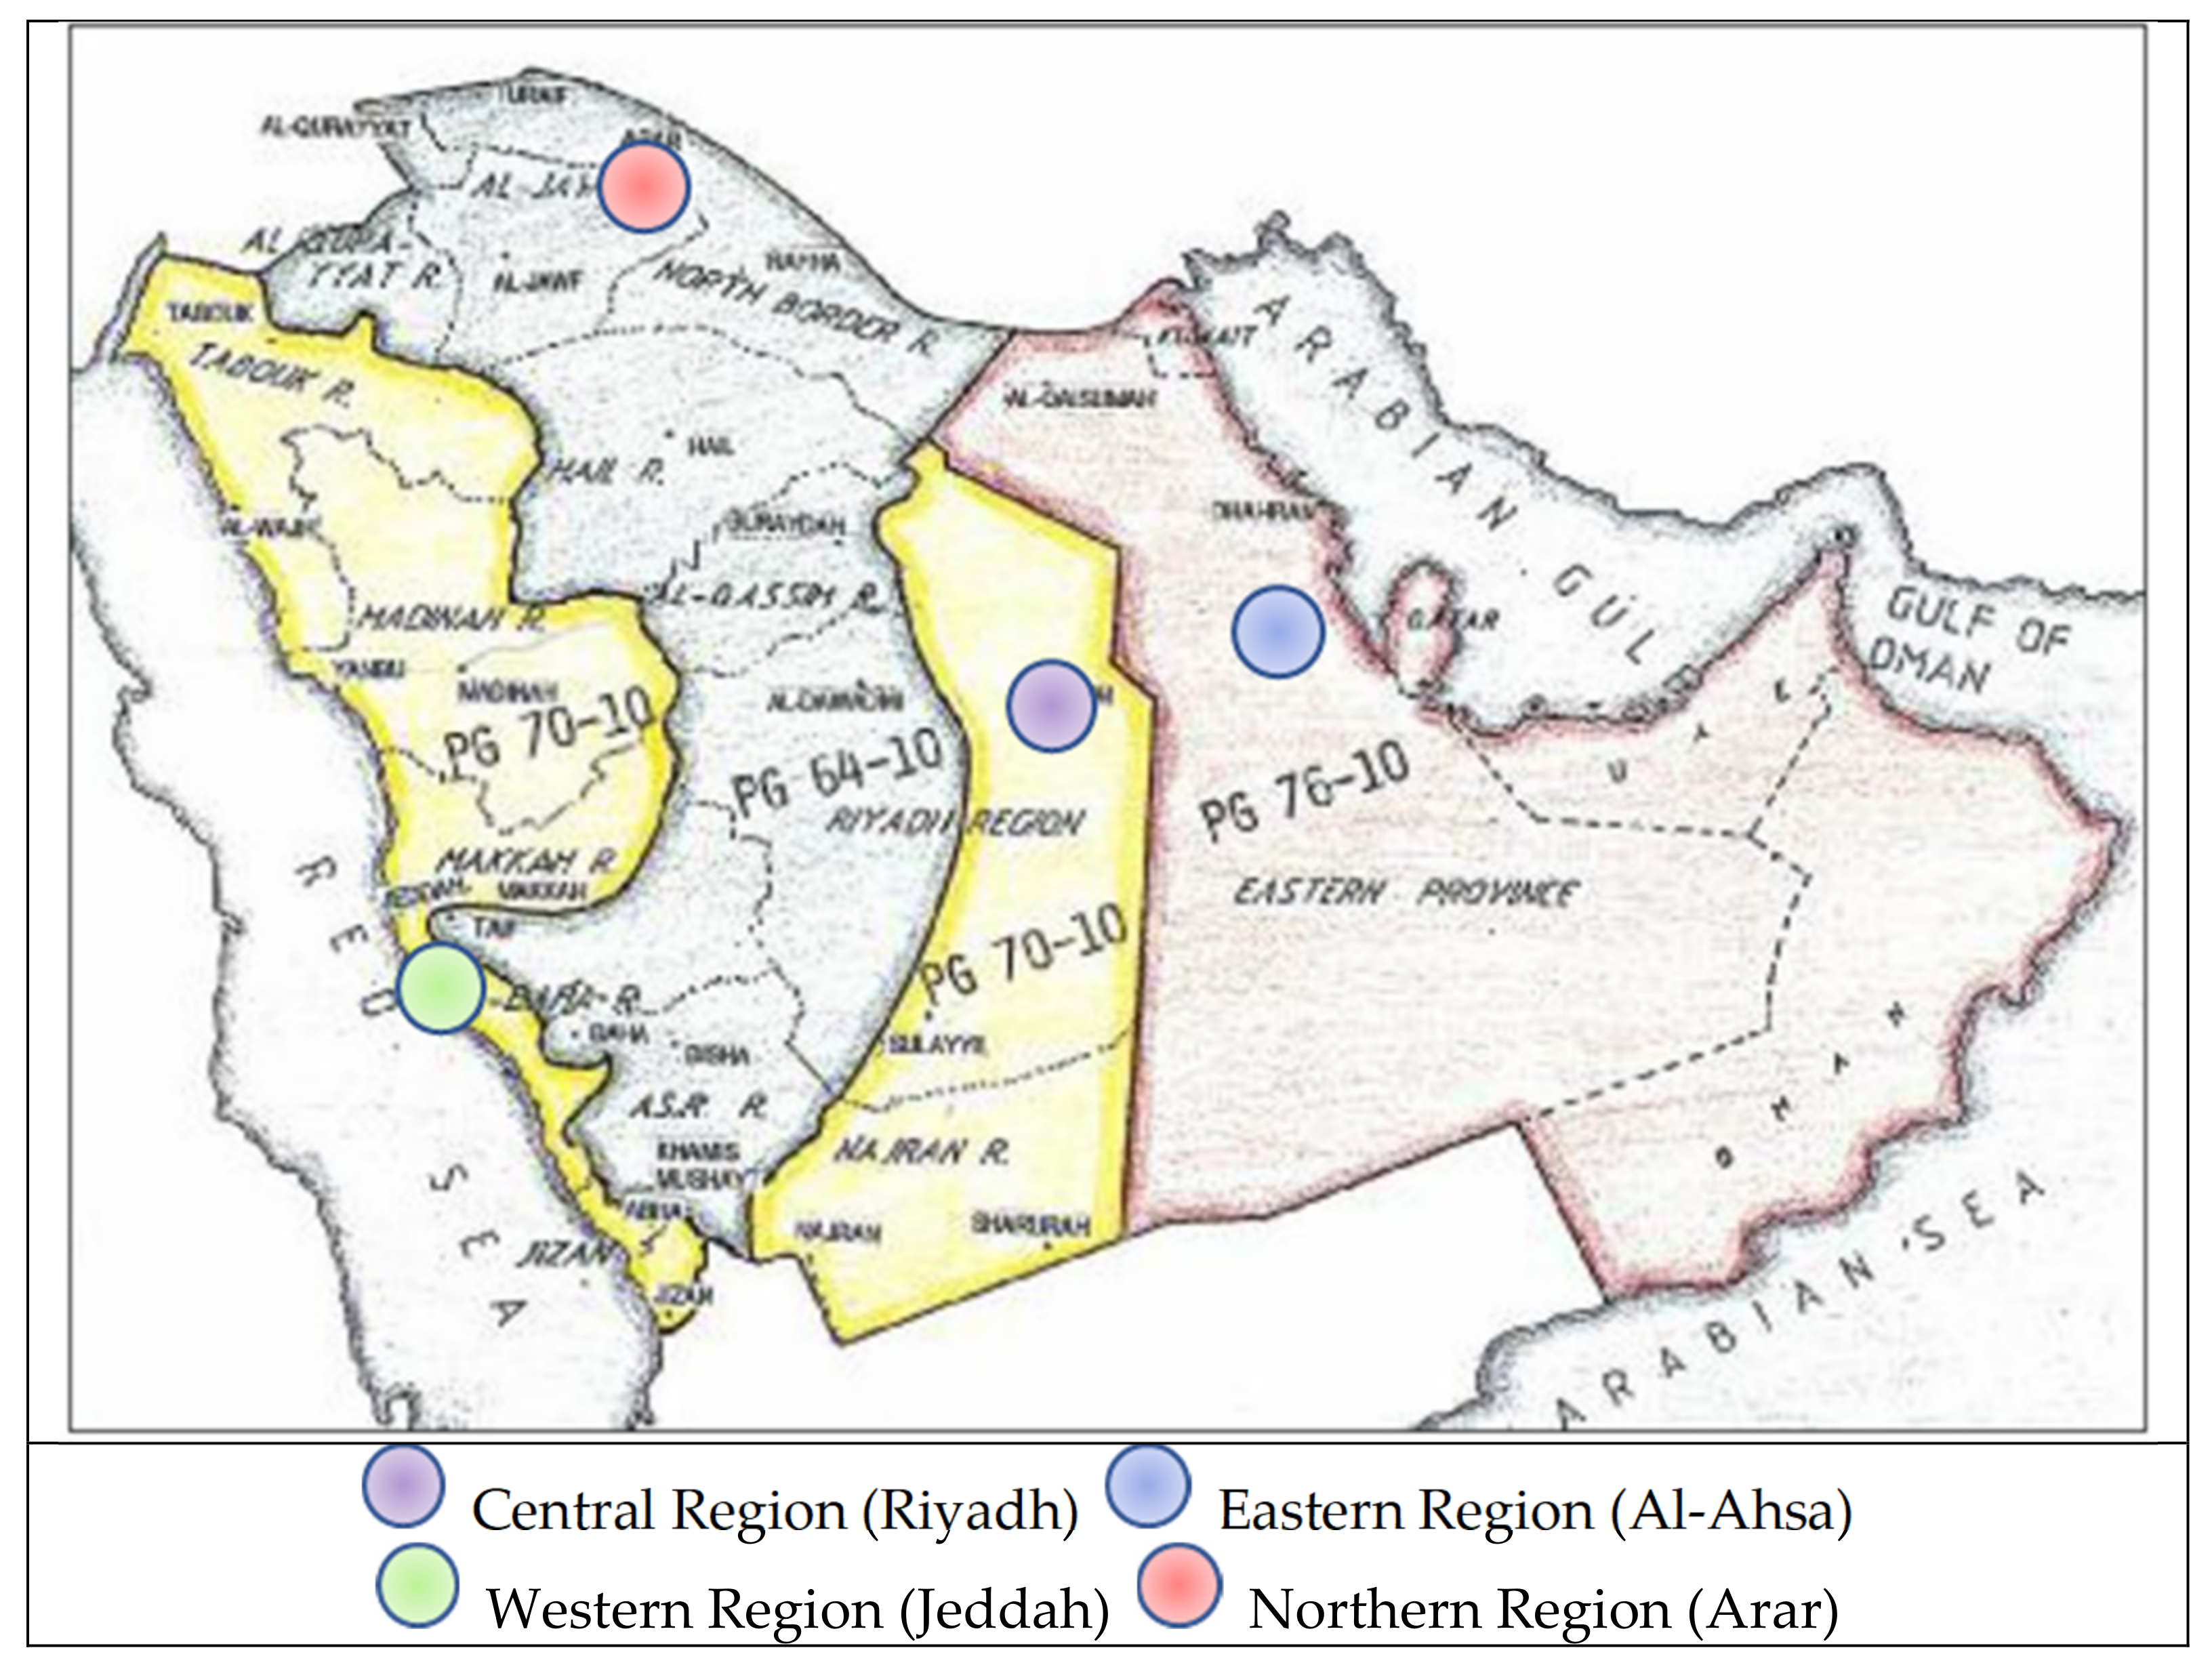
The selection of the locations for the project are dependent on various parameters, mainly the temperature zoning map of Saudi Arabia as shown in Figure 7. The team restricted the site conditions at four regions in KSA. These were: Central Region (Riyadh); Eastern Region (Al-Ahsa); Western Region (Jeddah); and Northern Region (Arar) shown with dots in Figure 7. It has well been established and known that these four regions encompass different environmental zones.

Figure 7.
Temperature zoning map according to performance grading for KSA [18].
The Federal Highway Administration (FHWA) in the USA classifies vehicles into thirteen different classes, 4 through 13 are accounted for in MEPDG using the vehicle class distribution (VCD) as shown in Table 1. The VCD is calculated by dividing the annual average daily truck traffic for each truck class (AADTT) by the annual average daily truck traffic (AADTT) for all trucks as listed below [35]:
- AADTT = 10,000 Trucks (about 138,000,000 ESALs for 20 years)
- AADTT = 6000 Trucks (about 83,000,000 ESALs for 20 years)
- AADTT = 2000 Trucks (about 28,000,000 ESALs for 20 years)
- AADTT = 700 Trucks (about 10,000,000 ESALs for 20 years)

Table 1.
Vehicle classes in the United States—Federal Highway Administration (FHWA) [35].
Table 1.
Vehicle classes in the United States—Federal Highway Administration (FHWA) [35].
| FHWA Vehicle Class | Description | Example Vehicle Configuration |
|---|---|---|
| 4 | Two Axle Buses |  |
| 5 | Two Axle, Six Tire, Single Unit Trucks |  |
| 6 | Three Axle Single Unit Trucks |  |
| 7 | Four or More Axle Single Unit Single Unit Trucks |  |
| 8 | Four or Fewer Axel Single Trailer Trucks |  |
| 9 | Five Axle Single trailer Trucks |  |
| 10 | Six or More Axle Single Trailer Trucks |  |
| 11 | Five or Fewer Axle Multi Trailer Trucks |  |
| 12 | Six Axle Multi Trailer Trucks |  |
| 13 | Seven or More Axle Multi Trailer Trucks | 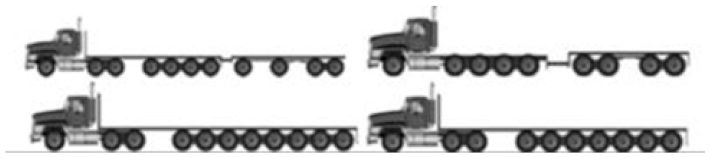 |
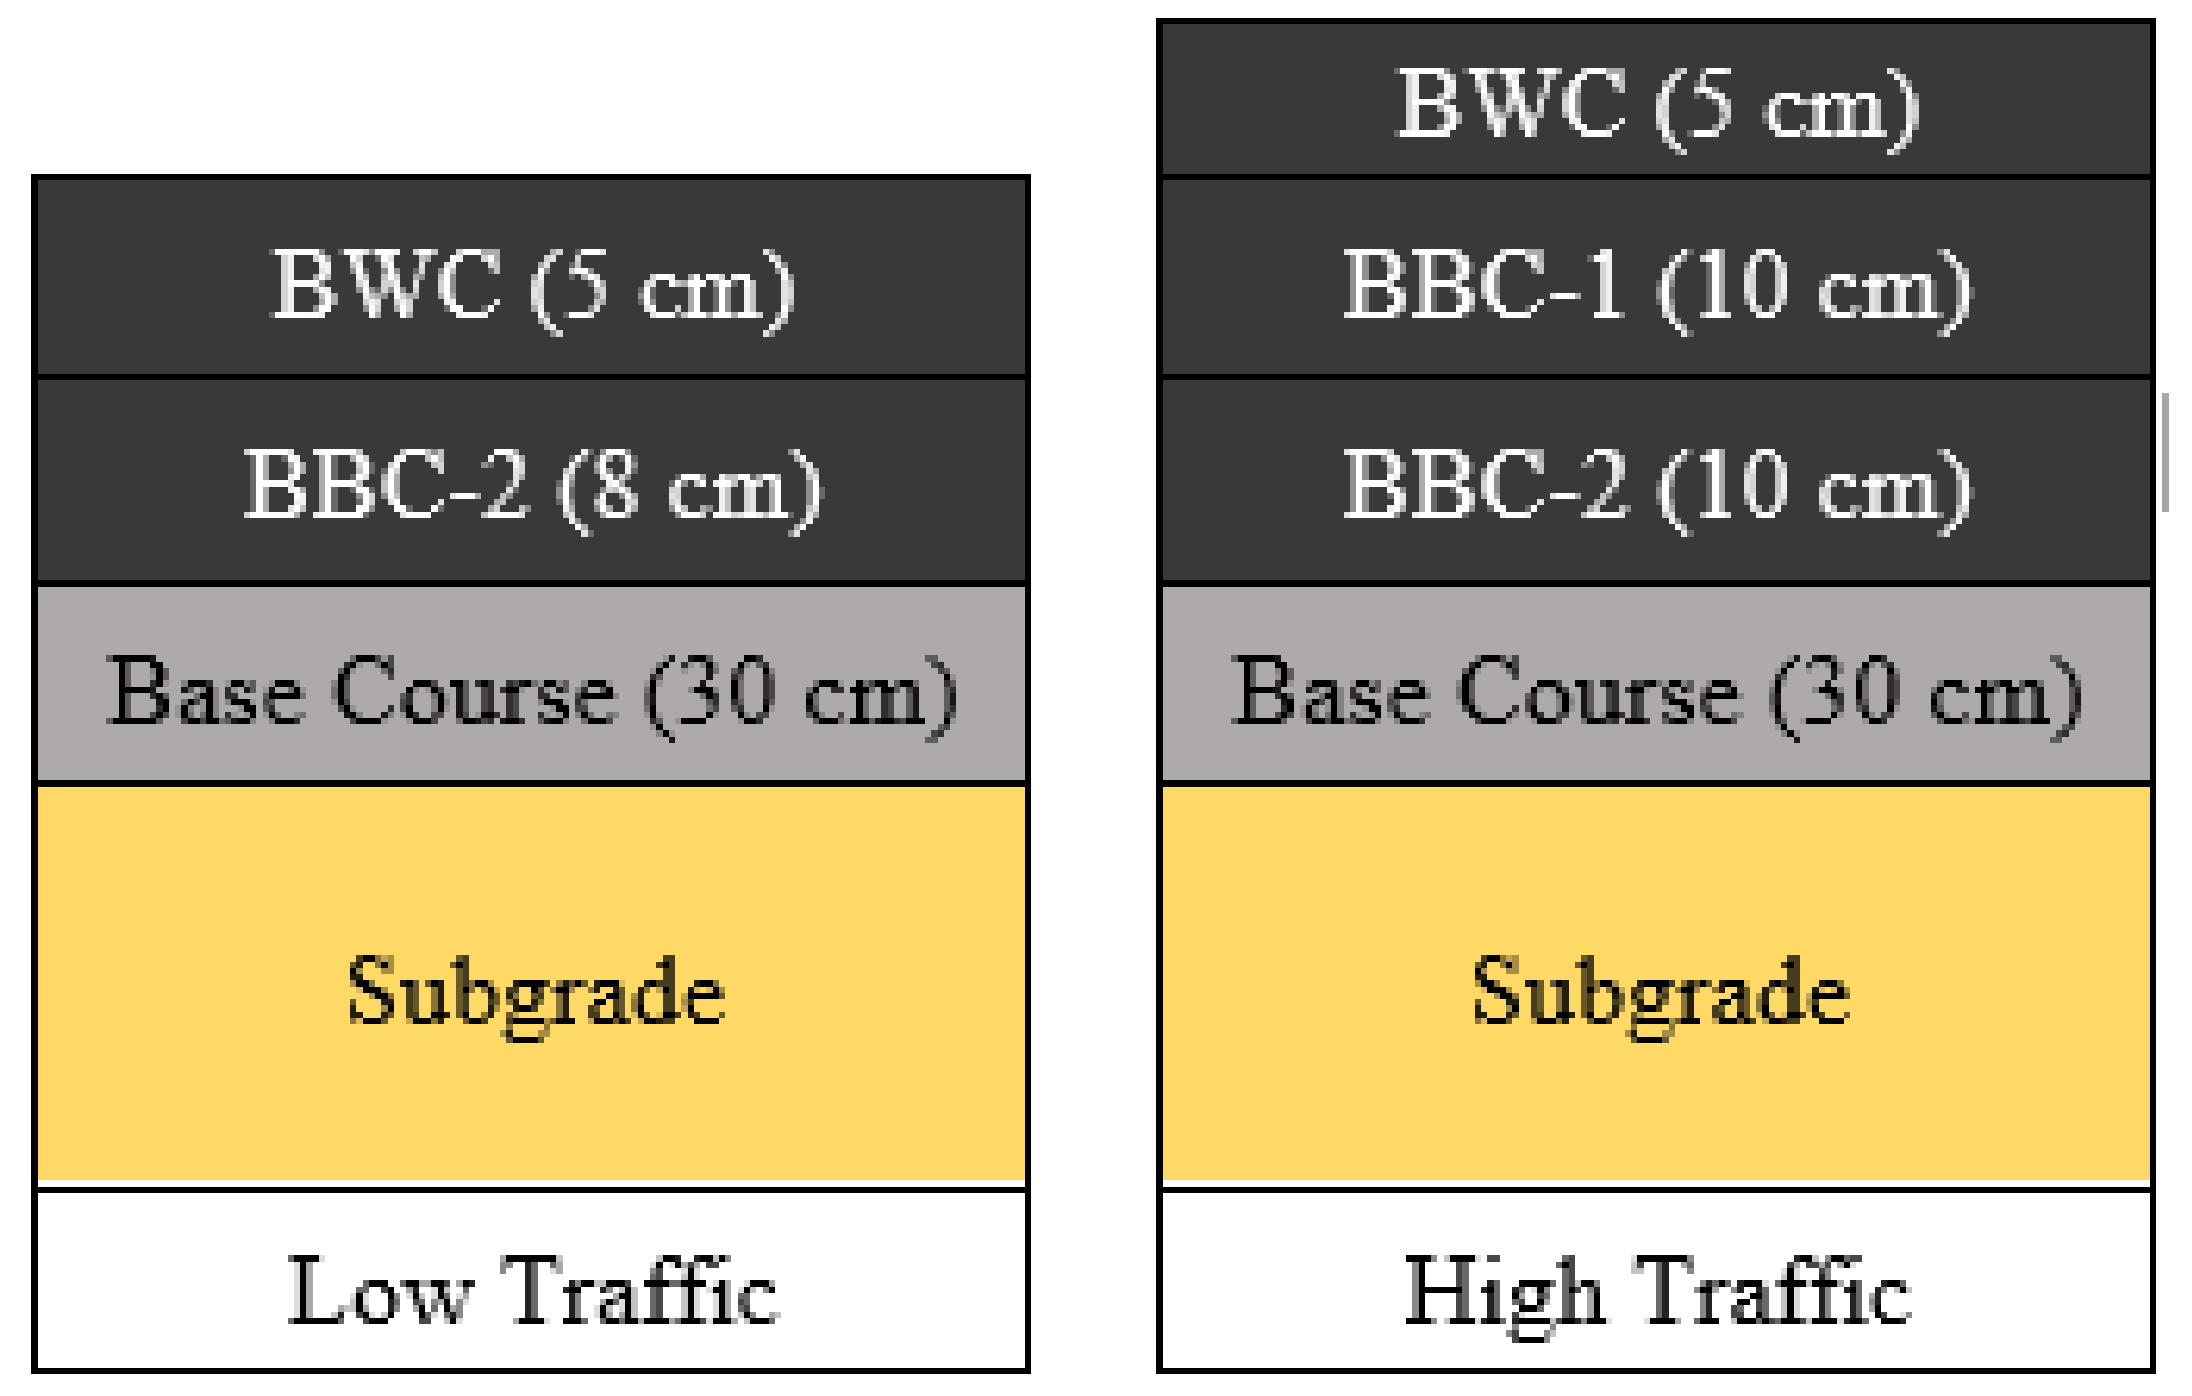
Although it is not too difficult to determine a wheel or an axle load for an individual vehicle, it becomes quite complicated to determine the number and types of wheel/axle loads that a particular pavement will be subject to over its design life. In addition, the traffic loading was limited to two distinct levels; low traffic and high traffic. The high and low traffics were further classified into four different AADTT (average annual daily truck traffic—two way) selected based on the reports for various roads in KSA. The values are listed in the following experimental design (Table 2). Figure 8 shows the typical pavement cross section used in KSA which has also been adopted for this project. As mentioned in the experimental design, for the high traffic the California bearing ratio (CBR) of the base and subgrade layers was assumed to be 80% and 25%, respectively. For the low traffic, the CBRs of the base and subgrade layers were assumed to be 70% and 15%, respectively.
Table 2.
Experimental design of the study variables.
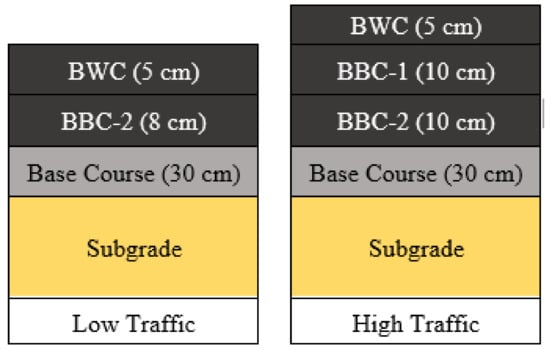
Figure 8.
Typical pavement cross section used in the study for high and low traffic.
4. Results and Discussion
The project focused on several preliminary design alternatives that could be used as an initial input for MEPDG software in KSA. It should be noted that the example designs are not recommended to be used as pavement catalogues, since many of the MEPDG inputs can change from different locations and project requirement and would affect the results of the design. The preliminary example pavement design were performed for four different climatic zones mentioned in the experimental design.
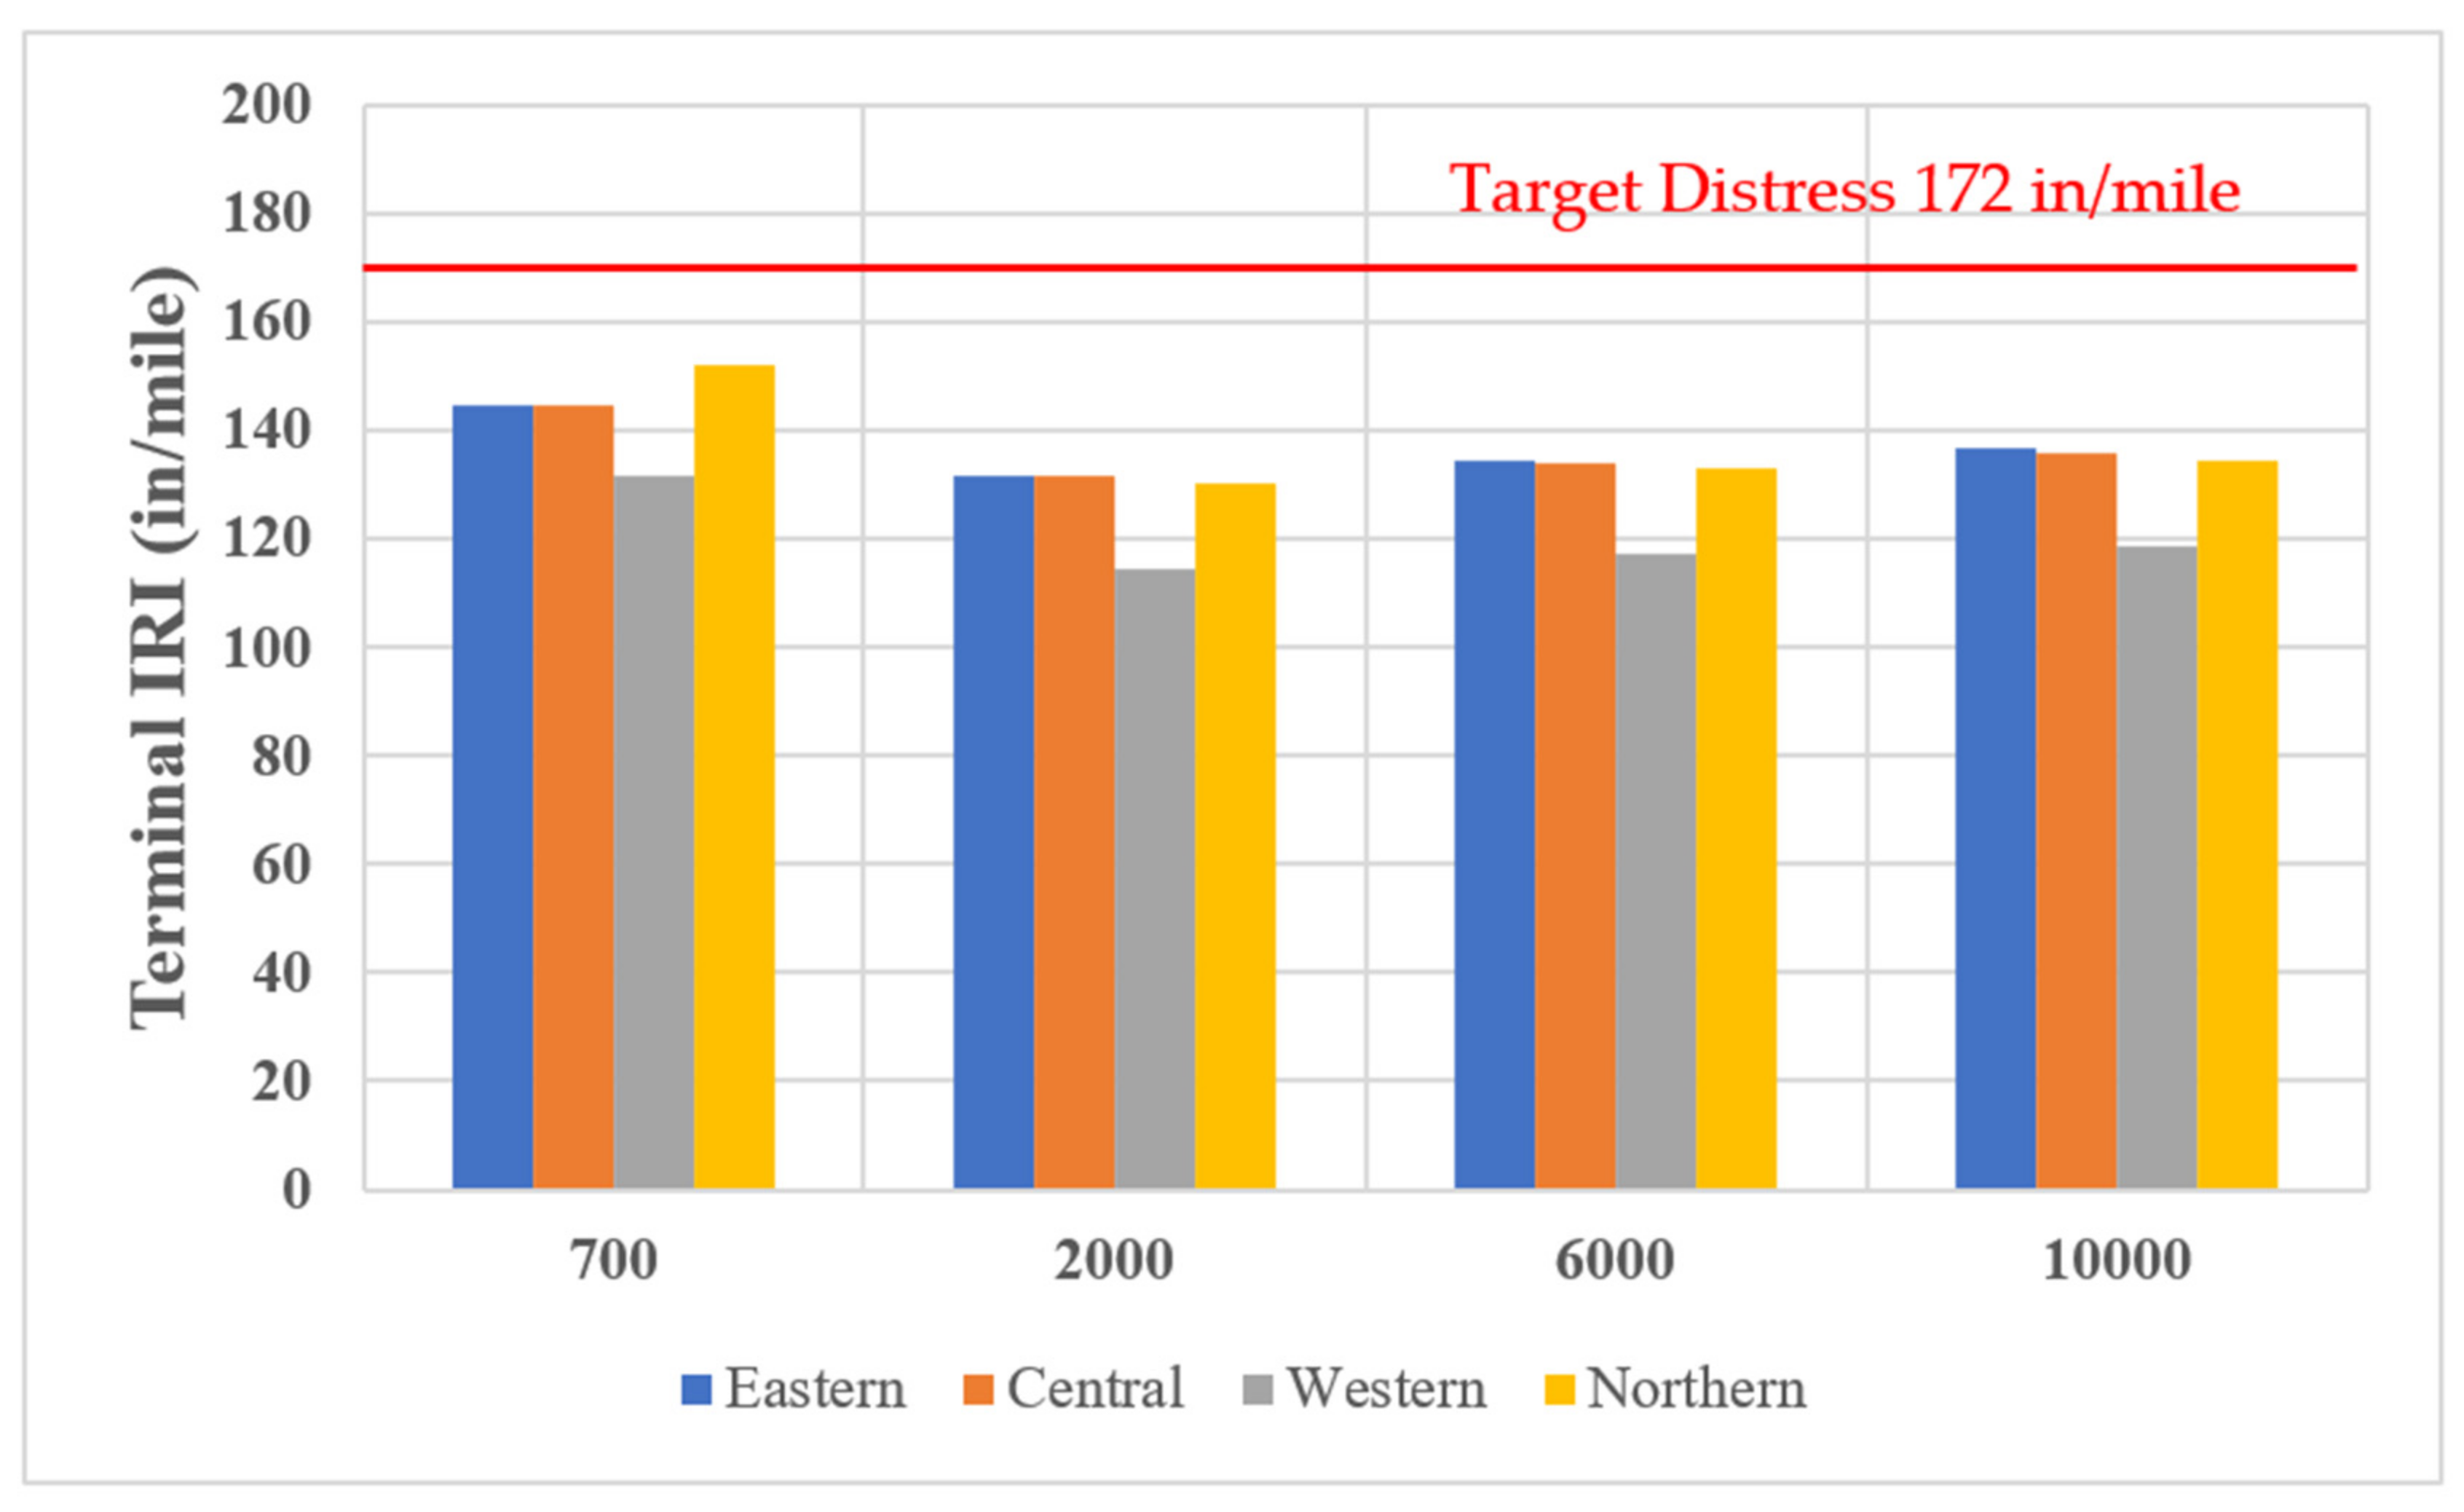
It is important to note that MEPDG software consistently predicted high values of thermal and top-down cracking in KSA as the prediction is based on models using temperature difference through the year. During the literature review and collection of reports from the field data, top-down cracking is not observed in KSA. As a result, the thermal and top-down cracking was not included in the results of the example designs. The MEPDG software, AASHTOWare Pavement ME Design 2.5.5 (US), was used to predict the 16 different scenarios as elaborated in the experimental design. The results of the predicted distresses for a design life of 20 years are as shown in Figure 9, Figure 10 and Figure 11. As discussed earlier in the experimental design, the pavement structure is different for low traffic (700 AADT) and high traffic (2000, 6000, and 10,000). The increase in traffic shows an increase in terminal IRI, rutting and cracking parameters as expected. The western region performs well as compared to the other regions selected for the study.

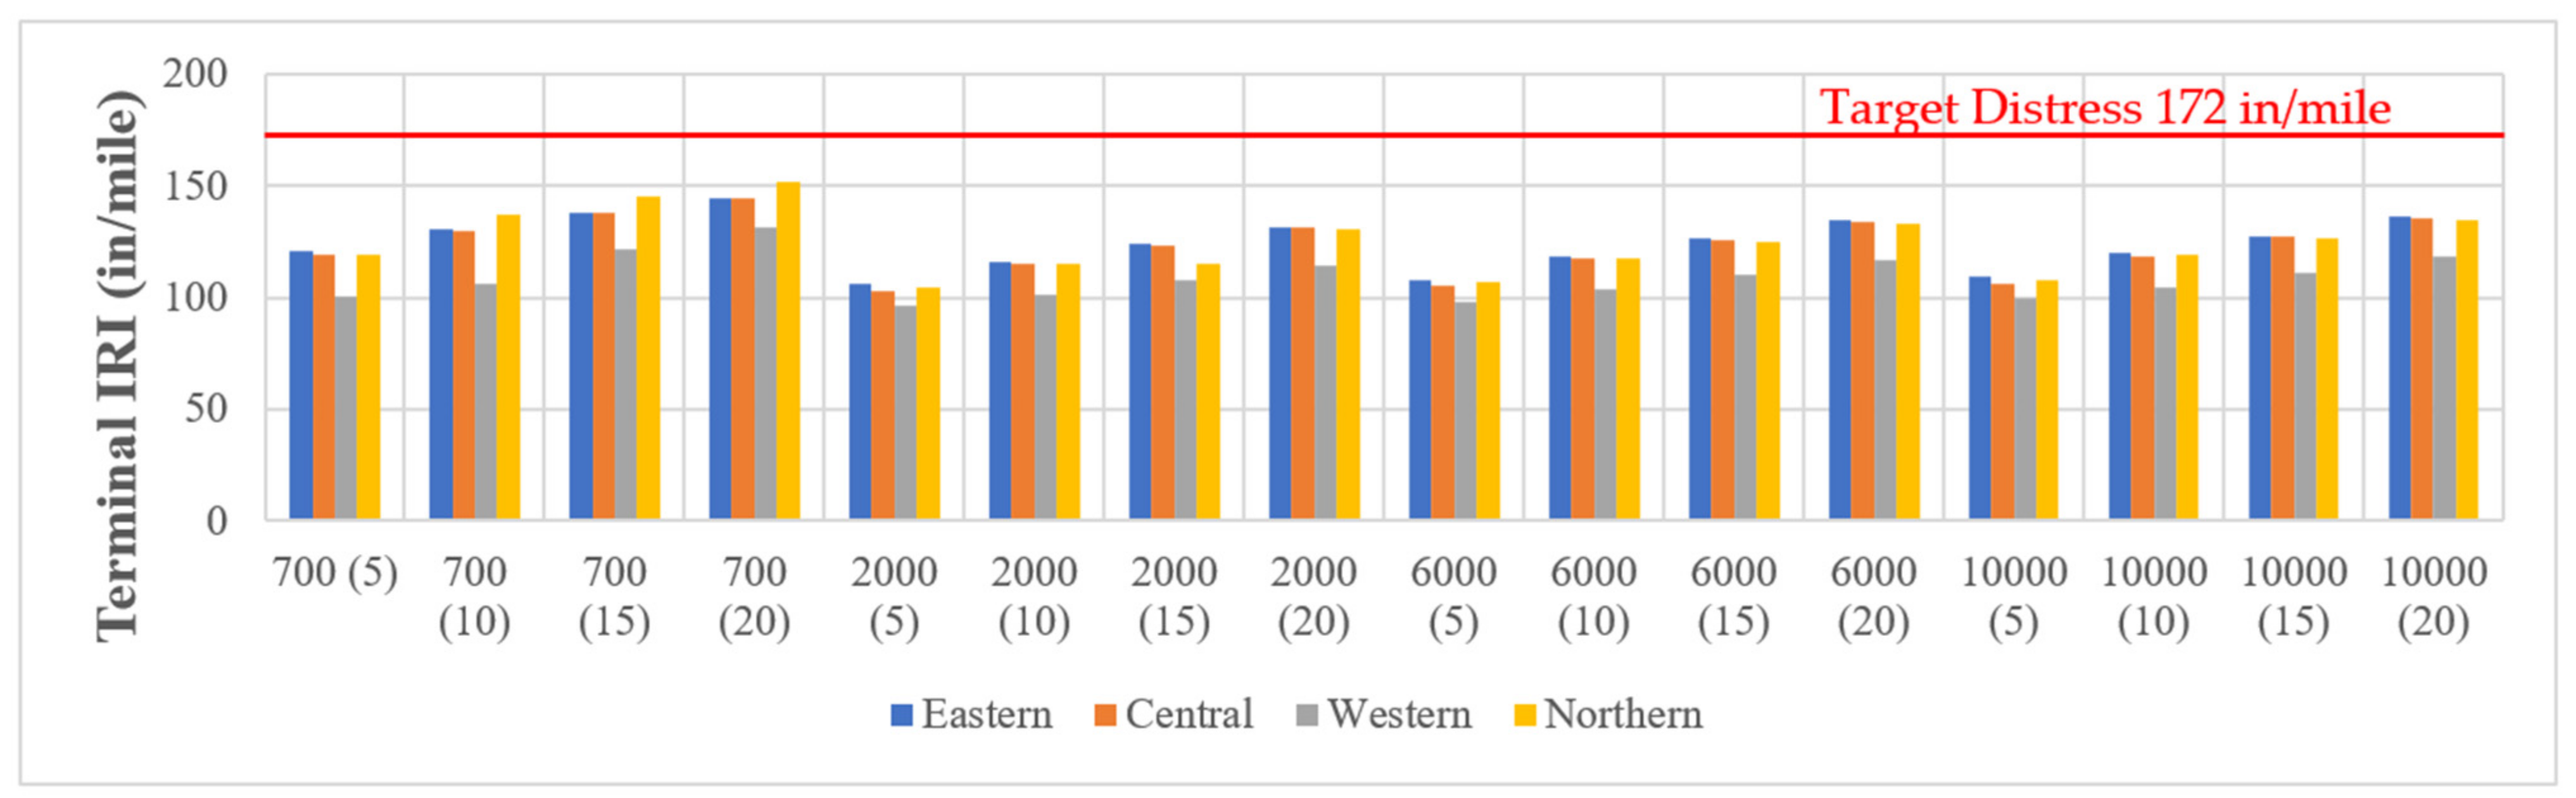
Figure 9.
Terminal IRI (in/mile) for all different types of traffic for all the regions for 20 years design life.

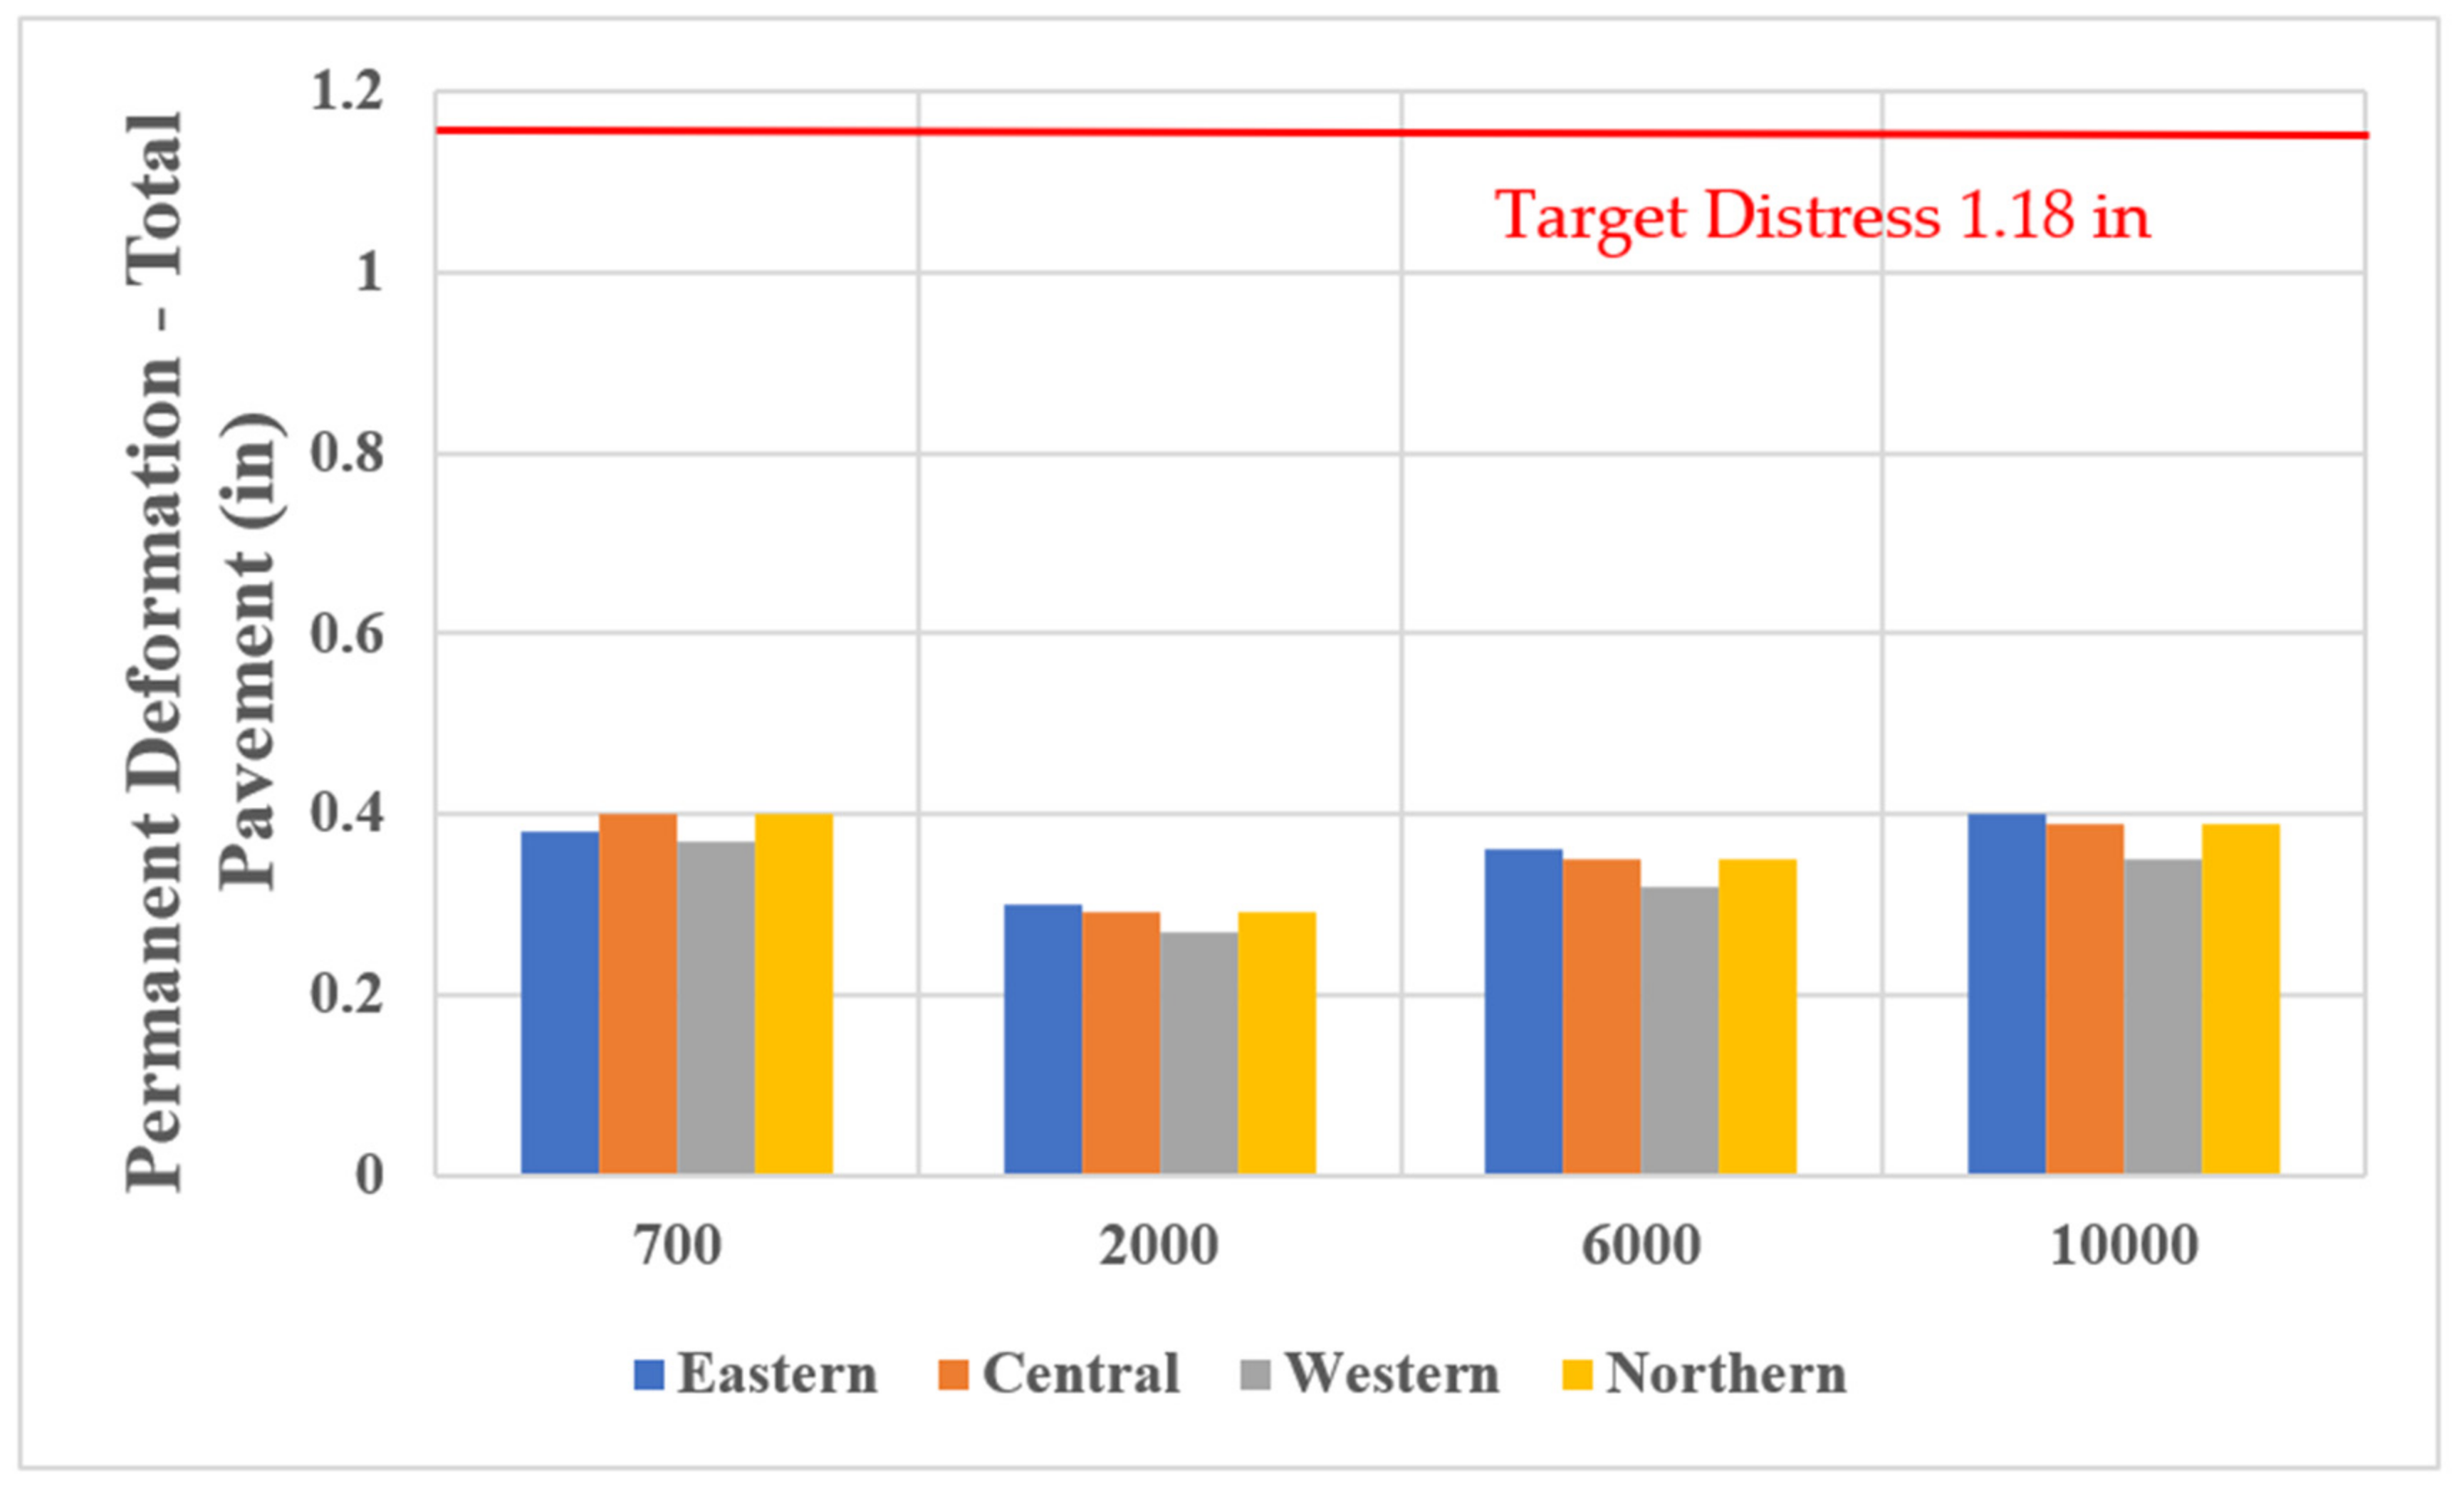
Figure 10.
Permanent deformation of total pavement (in) for all different types of traffic for all the regions for 20 years design life.
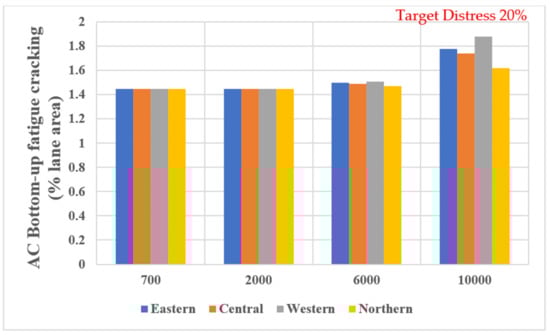
Figure 11.
AC Bottom-up fatigue cracking (% lane area) for all different types of traffic for all the regions for 20 years design life.
The western region has the best asphalt pavement performance comparing with the other regions in real life. The reason of the best pavement performance is using basalt aggregates that work very well with high temperatures. In agreement with Al-Khateeb et al.’s paper, basalt is better than limestone in terms of asphalt pavement performance against rutting resistance even in the high temperatures [36]. On the other regions, their asphalt pavements have low durability because the limestone aggregates are used. In this study, aggregate type inputs in the MEPDG are constant for all regions (Table 2); and the western region still has the lowest terminal IRI (Figure 9), and permanent deformation (rutting, Figure 10) results comparing with other regions. That means weather plays a significant role that must be considered during the pavement design.
Further, the test was run on the MEPDG software to analyze the distresses predicted by the software for an interval of 5, 10, and 15 years. The combined results of the analysis for the predicted distresses are shown in Figure 12, Figure 13 and Figure 14. Similar trends can be observed for the distresses against varying AADT for an interval of 5, 10, and 15 years. The western region consistently performs well as compared to other regions, while the eastern region has the harshest climate of all with respect to high temperatures, so the distress responses are also as expected.
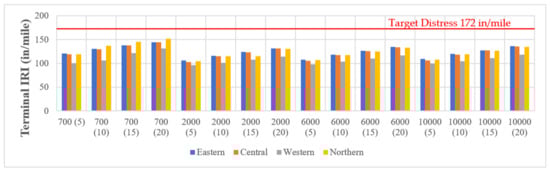
Figure 12.
Terminal IRI (in/mile) for an interval of 5, 10, 15, and 20 years.
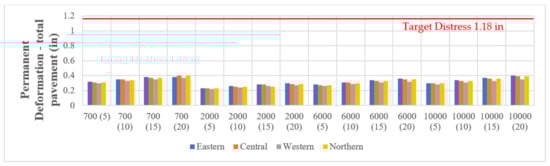
Figure 13.
Permanent deformation—total pavement (in) for an interval of 5, 10, 15, and 20 years.
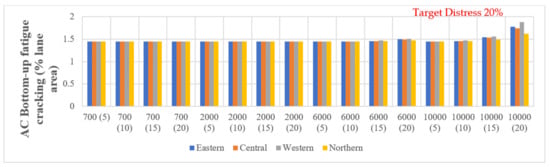
Figure 14.
AC Bottom-up fatigue cracking (% lane area) for an interval of 5, 10, 15, and 20 years.
5. Conclusions
The best results for pavement design using the MEPDG software are with western region for withstanding terminal IRI, and permanent deformation (rutting), even though all four regions have the same inputs except climatic data inputs that depend on location condition. This indicates eastern, central, and northern regions have worse climate conditions than western region; so, climate is an essential parameter in the software to predict the optimum pavement design that can last for years with the minimum distresses. However, overall, the predicted results for all regions by the MEPDG software show that the preliminary example design satisfies all the target distresses for the design life of 5, 10, 15, and 20 years. As mentioned earlier, this design of pavement structure can be used as an initial input by the designers for the mentioned regions. The designers can modify traffic, material properties, thickness, and distress limit to achieve target design life. It needs to be noted that the pavement structure design is different for low traffic (700 AADTT) and high traffic (2000, 6000, and 10,000 AADTT). As per the results, the pavement design can be adopted as a reference throughout KSA, giving the designers a starting point to optimize the thicknesses as per the local material and site conditions.
Author Contributions
Formal analysis, A.F.A.F. and M.A.G.; Funding acquisition, A.F.A.F.; Investigation, M.A. and M.A.G.; Methodology, M.A.G.; Resources, M.A.; Software, M.A.G.; Supervision, M.A.G.; Validation, M.A.G.; Visualization, M.A.; Writing–original draft, M.A.G.; Writing–review & editing, M.A. All authors have read and agreed to the published version of the manuscript.
Funding
This research was funded by Saudi Standards, Metrology and Quality Organization (SASO), grant number 1608 under the MoU signed between King Faisal University, Al-Ahsa and SASO.
Conflicts of Interest
The authors declare no conflict of interest.
References
- AASHTO. Guide for Design of Pavement Structures; American Association of State Highway and Transportation Officials: Washington, DC, USA, 1993. [Google Scholar]
- Kang, M.; Adams, T.M. Local calibration of the fatigue model in the mechanistic-empirical pavement design guide. In Proceedings of the Transportation Research Board 87th Annual Meeting (CD-ROM), National Research Council, Washington, DC, USA, 13–17 January 2008. [Google Scholar]
- Muthadi, N.R.; Kim, Y.R. Local calibration of mechanisticempirical pavement design guide for flexible pavement design. Transp. Res. Rec. 2008, 2087, 131–141. [Google Scholar] [CrossRef]
- Flintsch, G.W.; Loulizi, A.; Diefenderfer, S.D.; Diefenderfer, B.K. Asphalt materials characterization in support of mechanistic empirical pavement design guide implementation efforts in Virginia. In Proceedings of the Transportation Research Board 87th Annual Meeting (CD-ROM), National Research Council, Washington, DC, USA, 13–17 January 2008. [Google Scholar]
- Souliman, M.; Mamlouk, M.; El-Basyouy, M.; Zapata, C. Calibration of the AASHTO MEPDG for flexible pavement for Arizona conditions. In Proceedings of the Compendium of Papers of the 89th TRB Annual Meeting (CD-ROM), Transportation Research Board, Washington, DC, USA, 10–14 January 2010. [Google Scholar]
- Tarefder, R.A.; Sumee, N.; Rodriguez, I.H.; Sriram, A.; Benedict, K. Development of a Flexible-Pavement Database for Local Calibration of MEPDG; Final Report ORA 456–204; Research Bureau, New Mexico Department of Transportation: Santa Fe, NM, USA, 2012; pp. 1–304.
- El-Badawy, S.M.; Elmwafi, M. Evaluation of Witczak E* predictive models for the implementation of AASHTOWare-Pavement ME Design in the Kingdom of Saudi Arabia. Constr. Build. Mater. 2014, 64, 360–369. [Google Scholar]
- Al-Qaili, A.H.; Al-Solieman, H. Enhancing MEPDG distress models prediction for Saudi Arabia by local calibration. Road Mater. Pavement Des. 2021, 23, 1681–1693. [Google Scholar]
- Al-Qaili, H.A.; Al-Solieman, H. Preparing data for calibration of mechanistic-empirical pavement design guide in central Saudi Arabia. Int. J. Urban Civ. Eng. 2017, 11, 248–255. [Google Scholar]
- Albuaymi, M.I.A. Implementation of AASHTOWare Pavement ME Design in Saudi Arabia. Ph.D. Thesis, Arizona State University, Tempe, AZ, USA, 2021. [Google Scholar]
- National Research Council. Guide for Mechanistic-Empirical Design of New and Rehabilitated Pavement Structures; MEPDG Documentation, National Cooperative Highway Research Program; Transportation Research Board (TRB): Washington, DC, USA, 2010. [Google Scholar]
- Long-Term Pavement Performance (LTPP) Products Online. Long-Term Pavement Performance (LTPP) Database. 2012. Available online: http://www.ltpp-products.com/LTPPProducts.aspx (accessed on 15 March 2012).
- Aguiar-Moya, J.P.; Hong, F.; Prozzi, J.A. Upgrading the Texas LTPP database to support the M-E pavement design guide. In Proceedings of the Transportation Research Board 88th Annual Meeting (CD-ROM), National Research Council, Washington, DC, USA, 21–25 January 2008. [Google Scholar]
- Mehta, Y.A.; Sauber, R.W.; Owad, J.; Krause, J. Lessons learned during implementation of mechanistic-empirical pavement design guide. In Proceedings of the Transportation Research Board 87th Annual Meeting (CD-ROM), Washington, DC, USA, 13–17 January 2008. [Google Scholar]
- Zhou, F.; Hu, S.; Hu, X.; Scullion, T.; Mikhail, M.; Walubita, L. Development, calibration, and verification of a new mechanistic empirical reflective cracking model for HMA overlay thickness design and analysis. J. Transp. Eng. 2010, 136, 353–369. [Google Scholar] [CrossRef]
- Caliendo, C. Local calibration and implementation of the mechanistic-empirical pavement design guide for flexible pavement design. J. Transp. Eng. 2012, 138, 348–360. [Google Scholar] [CrossRef]
- Timm, D.H.; Robbins, N.; Tran, C. Flexible Pavement Design-State of the Practice; National Center for Asphalt Technology, Auburn University: Auburn, AL, USA, 2014; Available online: http://www.ncat.us/files/reports/2014/rep14-04.pdf (accessed on 23 September 2021).
- Hamad, A.; Farahat, M.; Ibrahim, D.; Ibrahim, M.A. Adaptation of SHRP Performance-Based Asphalt Specification to the Gulf Countries; The Final Report; King Abdul Aziz City for Science and Technology: Riyadh, Saudi Arabia, 1996. [Google Scholar]
- Saltan, M.; Findik, F. Stabilization of subbase layer materials with waste pumice in flexible pavement. Build. Environ. 2008, 43, 415–421. [Google Scholar] [CrossRef]
- ARA. Guide for Mechanistic Empirical Design of New and Rehabilitated Pavement Structures; National Cooperative Highway Research Program: Springfield, IL, USA, 2004. [Google Scholar]
- ARA. A Manual of Practice; American Association of State Highway and Transportation Officials; ARA: Antioch, IL, USA, 2008. [Google Scholar]
- PVD. AASHTOWare Pavement ME Design v2.5.5; ARC, Inc.: Boise, ID, USA, 2010; Available online: https://me-design.com/MEDesign/Home.aspx (accessed on 2 June 2020).
- Ghosh, A.; Padmarekha, A.; Krishnan, J. Implementation and proof-checking of mechanistic-empirical pavement design for Indian highways using AASHTOWARE pavement ME design software. Procedia-Soc. Behav. Sci. 2013, 104, 119–128. [Google Scholar] [CrossRef]
- Zhao, Y.; Tan, Y.; Zhou, C. Determination of axle load spectra based on percentage of overloaded trucks for mechanistic-empirical pavement design. Road Mater. Pavement Des. 2012, 13, 850–863. [Google Scholar] [CrossRef]
- Loria, L.; Badilla, G.; Acuna, M.; Elizondo, F.; Aguiar-Moya, J. Experiences in the Characterization of Materials Used in the Calibration of the AASHTO Mechanistic-Empirical Pavement Design Guide (MEPDG) for Flexible Pavement for Costa Rica. In Proceedings of the Transportation Research Board 90th Annual Meeting, Washington, DC, USA, 23–27 January 2011. [Google Scholar]
- Sadek, H.; Masad, E.; Sirin, O.; Al-Khalid, H.; Little, D. The implementation of mechanistic-empirical pavement design method to evaluate asphalt pavement design in Qatar. In Proceedings of the 5th Eurasphalt & Eurobitume Congress, Istanbul, Turkey, 13–15 June 2012; pp. 13–15. [Google Scholar]
- Sadek, H.A.; Masad, E.A.; Sirin, O.; Al-Khalid, H.; Sadeq, M.A.; Little, D. Implementation of mechanistic-empirical pavement analysis in the State of Qatar. Int. J. Pavement Eng. 2014, 15, 495–511. [Google Scholar] [CrossRef]
- Alzaabi, A.; Hassan, A. Development of a Flexible Pavement Design Protocol for the UAE Based on the Mechanistic-Empirical Pavement Design Guide. Ph.D. Thesis, The University of Texas at Arlington, Arlington, TX, USA, 2019. [Google Scholar]
- Behiry, A.; Beltagy, A.Y. Mechanistic-Empirical Study of Sensitivity of Truck Tire Pressure to Asphalt Pavement Thickness in Egypt. Int. J. Eng. Res. Appl. 2013, 3, 1760–1771. [Google Scholar]
- Le, A.; Lee, H.; Park, H.M.; Kim, T.W. Development of Korean Pavement Design Guide for Asphalt Pavements Based on the Mechanistic-Empirical Design Principle. Balt. J. Road Bridge Eng. 2011, 6, 169–173. [Google Scholar] [CrossRef]
- Tóth, C.; Primusz, P. New Hungarian Mechanistic-Empirical Design Procedure for Asphalt Pavements. Balt. J. Road Bridge Eng. 2020, 15, 161–186. [Google Scholar] [CrossRef]
- Bustos, M.; Cordo, O.; Girardi, P.; Pereyra, M.O. Calibration of Distress Models from the Mechanistic–Empirical Pavement Design Guide for Rigid Pavement Design in Argentina. Transp. Res. Rec. 2011, 2226, 12–13. [Google Scholar] [CrossRef]
- Romero, M.; Garro, N.M.; Zevallos, G.G. Implementation of the mechanistic–empirical pavement design in northern Peru using a calibration coefficient for the International Roughness Index. Constr. Build. Mater. 2016, 102, 270–280. [Google Scholar] [CrossRef]
- Leischner, S.; Falla, G.C.; Wellner, F.; Oeser, M. Analytical Design of Thin Surfaced Asphalt Pavements in Germany. In Airfield and Highway Pavements; ASCE: Reston, VA, USA, 2016. [Google Scholar]
- Final Report—Study of Structural Pavement Design for Saudi Arabian Roads—Volume I of III; King Abdulaziz City for Science and Technology General Directorate of Research Grants Programs: Riyadh, Saudi Arabia, 2019.
- Al-Khateeb, G.; Khedaywi, T.; Obaidat, T.; Najib, A. Laboratory Study for Comparing Rutting Performance of Limestone and Basalt Superpave Asphalt Mixtures. Am. Soc. Civ. Eng. 2013, 25, 21–29. [Google Scholar] [CrossRef]


Publisher’s Note: MDPI stays neutral with regard to jurisdictional claims in published maps and institutional affiliations. |
© 2022 by the authors. Licensee MDPI, Basel, Switzerland. This article is an open access article distributed under the terms and conditions of the Creative Commons Attribution (CC BY) license (https://creativecommons.org/licenses/by/4.0/).