Article

Non-Imaging Fall Detection Based on Spectral Signatures Obtained Using a Micro-Doppler Millimeter-Wave Radar

1
Faculty of Engineering, Ariel University, Ariel 40700, Israel
2
Department of Electrical and Electronic Engineering, Ort Braude College of Engineering, Karmiel 2161002, Israel
*
Author to whom correspondence should be addressed.
Appl. Sci. 2022, 12(16), 8178; https://doi.org/10.3390/app12168178
Submission received: 26 June 2022 / Revised: 11 August 2022 / Accepted: 12 August 2022 / Published: 16 August 2022
(This article belongs to the Special Issue Applications of Terahertz Sensing and Imaging)

Abstract

:
Falls are the leading cause of accidents among the elderly population. In recent years, radar has been employed in fall detection due to its superior sensing capabilities, small dimensions, low cost and primarily non-intrusive sensing capabilities in addition to its robustness under a range of heat and lighting conditions. In this paper, we present a technique for identifying when a person is falling using a low-power millimeter-wave radar operating in the W-band. This detection, conducted in real time, is based on the transmission of a continuous wave and heterodyning of the received signal reflected from the person to obtain micro-Doppler shifts associated with the person’s motion. These results make it possible to obtain a high-quality time-frequency distribution and spectrogram, from which the person’s unique fall movement characteristics can be determined. In this paper, we present experimental results based on 94 GHz real radar data obtained from a falling person. This carrier frequency is higher than that of current systems, allowing higher frequency resolution and more accurate results. Compared to other tracking systems, this sensor does not simulate or violate privacy. However, the high-frequency system enables high-resolution realizations with high reliability.

1. Introduction

Global aging is a phenomenon known to have resulted from increasing longevity. Every year, the proportion population aged over 65 is growing [1,2]. The aging process is characterized by unfavorable changes in the body’s systems and organs, which may cause impaired coordination and loss of balance during changes in body position. These changes increase the chance of falls. Falls are the most common cause of accidents among the elderly [3] and are responsible for various injuries, including serious injuries that frequently lead to functional dependencies. The most common such injury is hip fracture. One of the circumstances influencing the severity of fall consequences in the elderly is the length of time for which the victim is waiting, immobile on the ground, for help. Less time spent waiting for help is related to less-severe health consequences and a higher chance of successful recovery and return to normal life.
Consequently, experts are increasingly working toward the development of effective fall detection systems and techniques. Several fall detection systems have recently been proposed in the literature [4,5]. Most studies divide fall detectors into two main categories: wearable and non-wearable. Wearable devices [4,5,6] are inexpensive but have some significant disadvantages, including the need to remember to wear the device. An elderly person may forget to put on the device or refuse to wear it for comfort reasons. Moreover, push-button devices are battery-operated and require the individual to be able to press the button after a fall. Fall detection systems that are non-wearable seem to be more promising than those that are wearable, because they do not require additional effort from the individual after the system has been installed at the user’s home.
Non-wearable fall detection methods are non-obtrusive and can be optical (e.g., video-based) [4,7] or non-optical, based on ultrasonic [8], pressure [9] or vibration sensors [10], among others. In this work, we focus on fall detection based on millimeter-wave (MMW) radar.
Recent technological developments have resulted in MMW radar becoming an increasingly commercialized and applicable technology. This radar is employed as a detection measure in many applications, such as in collision avoidance radars in automobiles [11] and in stand-off remote sensors in homeland security applications [12,13,14]. Detection of a person using Doppler MMW radar has several advantages compared to other remote sensing technologies. Due to its high transmission frequency, the transmission power is low, its dimensions are small and the transmission angle is wide.
The micro-Doppler signature of a moving person is a time-varying frequency shift caused by the relative movement of separate parts of the body; it can be studied to extract additional information on an individual’s movement characteristics [13]. Several works exploiting micro-Doppler signatures for human identification have been published [13,15,16]. To enable the detection of a fall incident, we started with the development of motion classification algorithms. These provide the system with knowledge regarding various types and forms of motion and enable it to identify specific patterns and detect anomalies. This paper is concerned with practical issues involving efficient algorithm system implementations. The goal of this study was to develop a motion classifier and build a fall detection application that can be further developed and deployed in users’ homes.
This paper is organized as follows: In Section 2, we describe the principles of continuous-wave micro-Doppler radar operation. In Section 3, we explain how to create an optimal spectrogram using short-time Fourier transform. The experimental setup is presented in Section 4. In Section 5, we describe the method of fall detection using spectral signatures and present the experimental results. In Section 6, we summarize and conclude the paper.

2. Continuous-Wave Micro-Doppler Radar

In this study, fall detection is based on a continuous-wave (CW) micro-Doppler millimeter-wave (MMW) radar. A CW is a sine wave of constant amplitude and frequency, and it is considered to be of infinite duration. The Doppler effect refers to the shift in frequency caused by a moving object. An additional shift in frequency can be caused by the object vibrating or spinning. When this happens, the Doppler-shifted signal becomes modulated; this is known as the micro-Doppler effect. This modulation can have a specific pattern or signature for which algorithms can be developed for required applications; this will be expanded on later.
Figure 1 presents the basic scheme of the CW micro-Doppler radar used in this study. A CW signal, E T , with a constant carrier frequency f 0 is transmitted toward an object:
Figure 1. A general scheme of a continuous-wave (CW) micro-Doppler radar.
Applsci 12 08178 g001
E T ( t ) = ( A T e j 2 π f 0 t )
where t indicates the dependence on time, ( · ) denotes the real part of the complex number and A T is the amplitude of the transmitted signal. The received signal returning from the moving object at distance r ( t ) is:
E R ( t ) = { A R e j [ 2 k · r ( t ) θ ] · e j 2 π f 0 t }
where A R is the amplitude of the received signal, k = 2 π f 0 / c is the wavenumber, c is the speed of light and θ is a constant for the phase shift. A factor of 2 is applied to account for the path from the radar to the object and the return. At the radar, the transmitted signal (1) is multiplied with the received signal (2). After low pass filtering (LPF), the intermediate frequency (IF) signal obtained is:
V ( t ) = E T ( t ) · E R ( t ) = { A T A R e j [ 2 k · r ( t ) θ ] }
From this equation, it can be seen that the resulting phase changes over time:
φ ( t ) = 2 k · r ( t ) θ
Through the use of (4) and the familiar connections from mechanics, d d t r ( t ) = v ( t ) and 1 2 π φ ( t ) t = f d ( t ) , it is possible to express the instantaneous Doppler frequency shift as:
f d ( t ) = 1 2 π φ ( t ) t = 1 2 π 2 k · v ( t ) · c o s α = 2 f 0 c · v ( t ) · c o s α
where α is the angle between the direction of the transmitted/reflected signal and the direction of moving of the person. The resulting instantaneous Doppler frequency f d ( t ) of the IF signal obtained at the multiplier output is proportional to the object velocity v ( t ) .

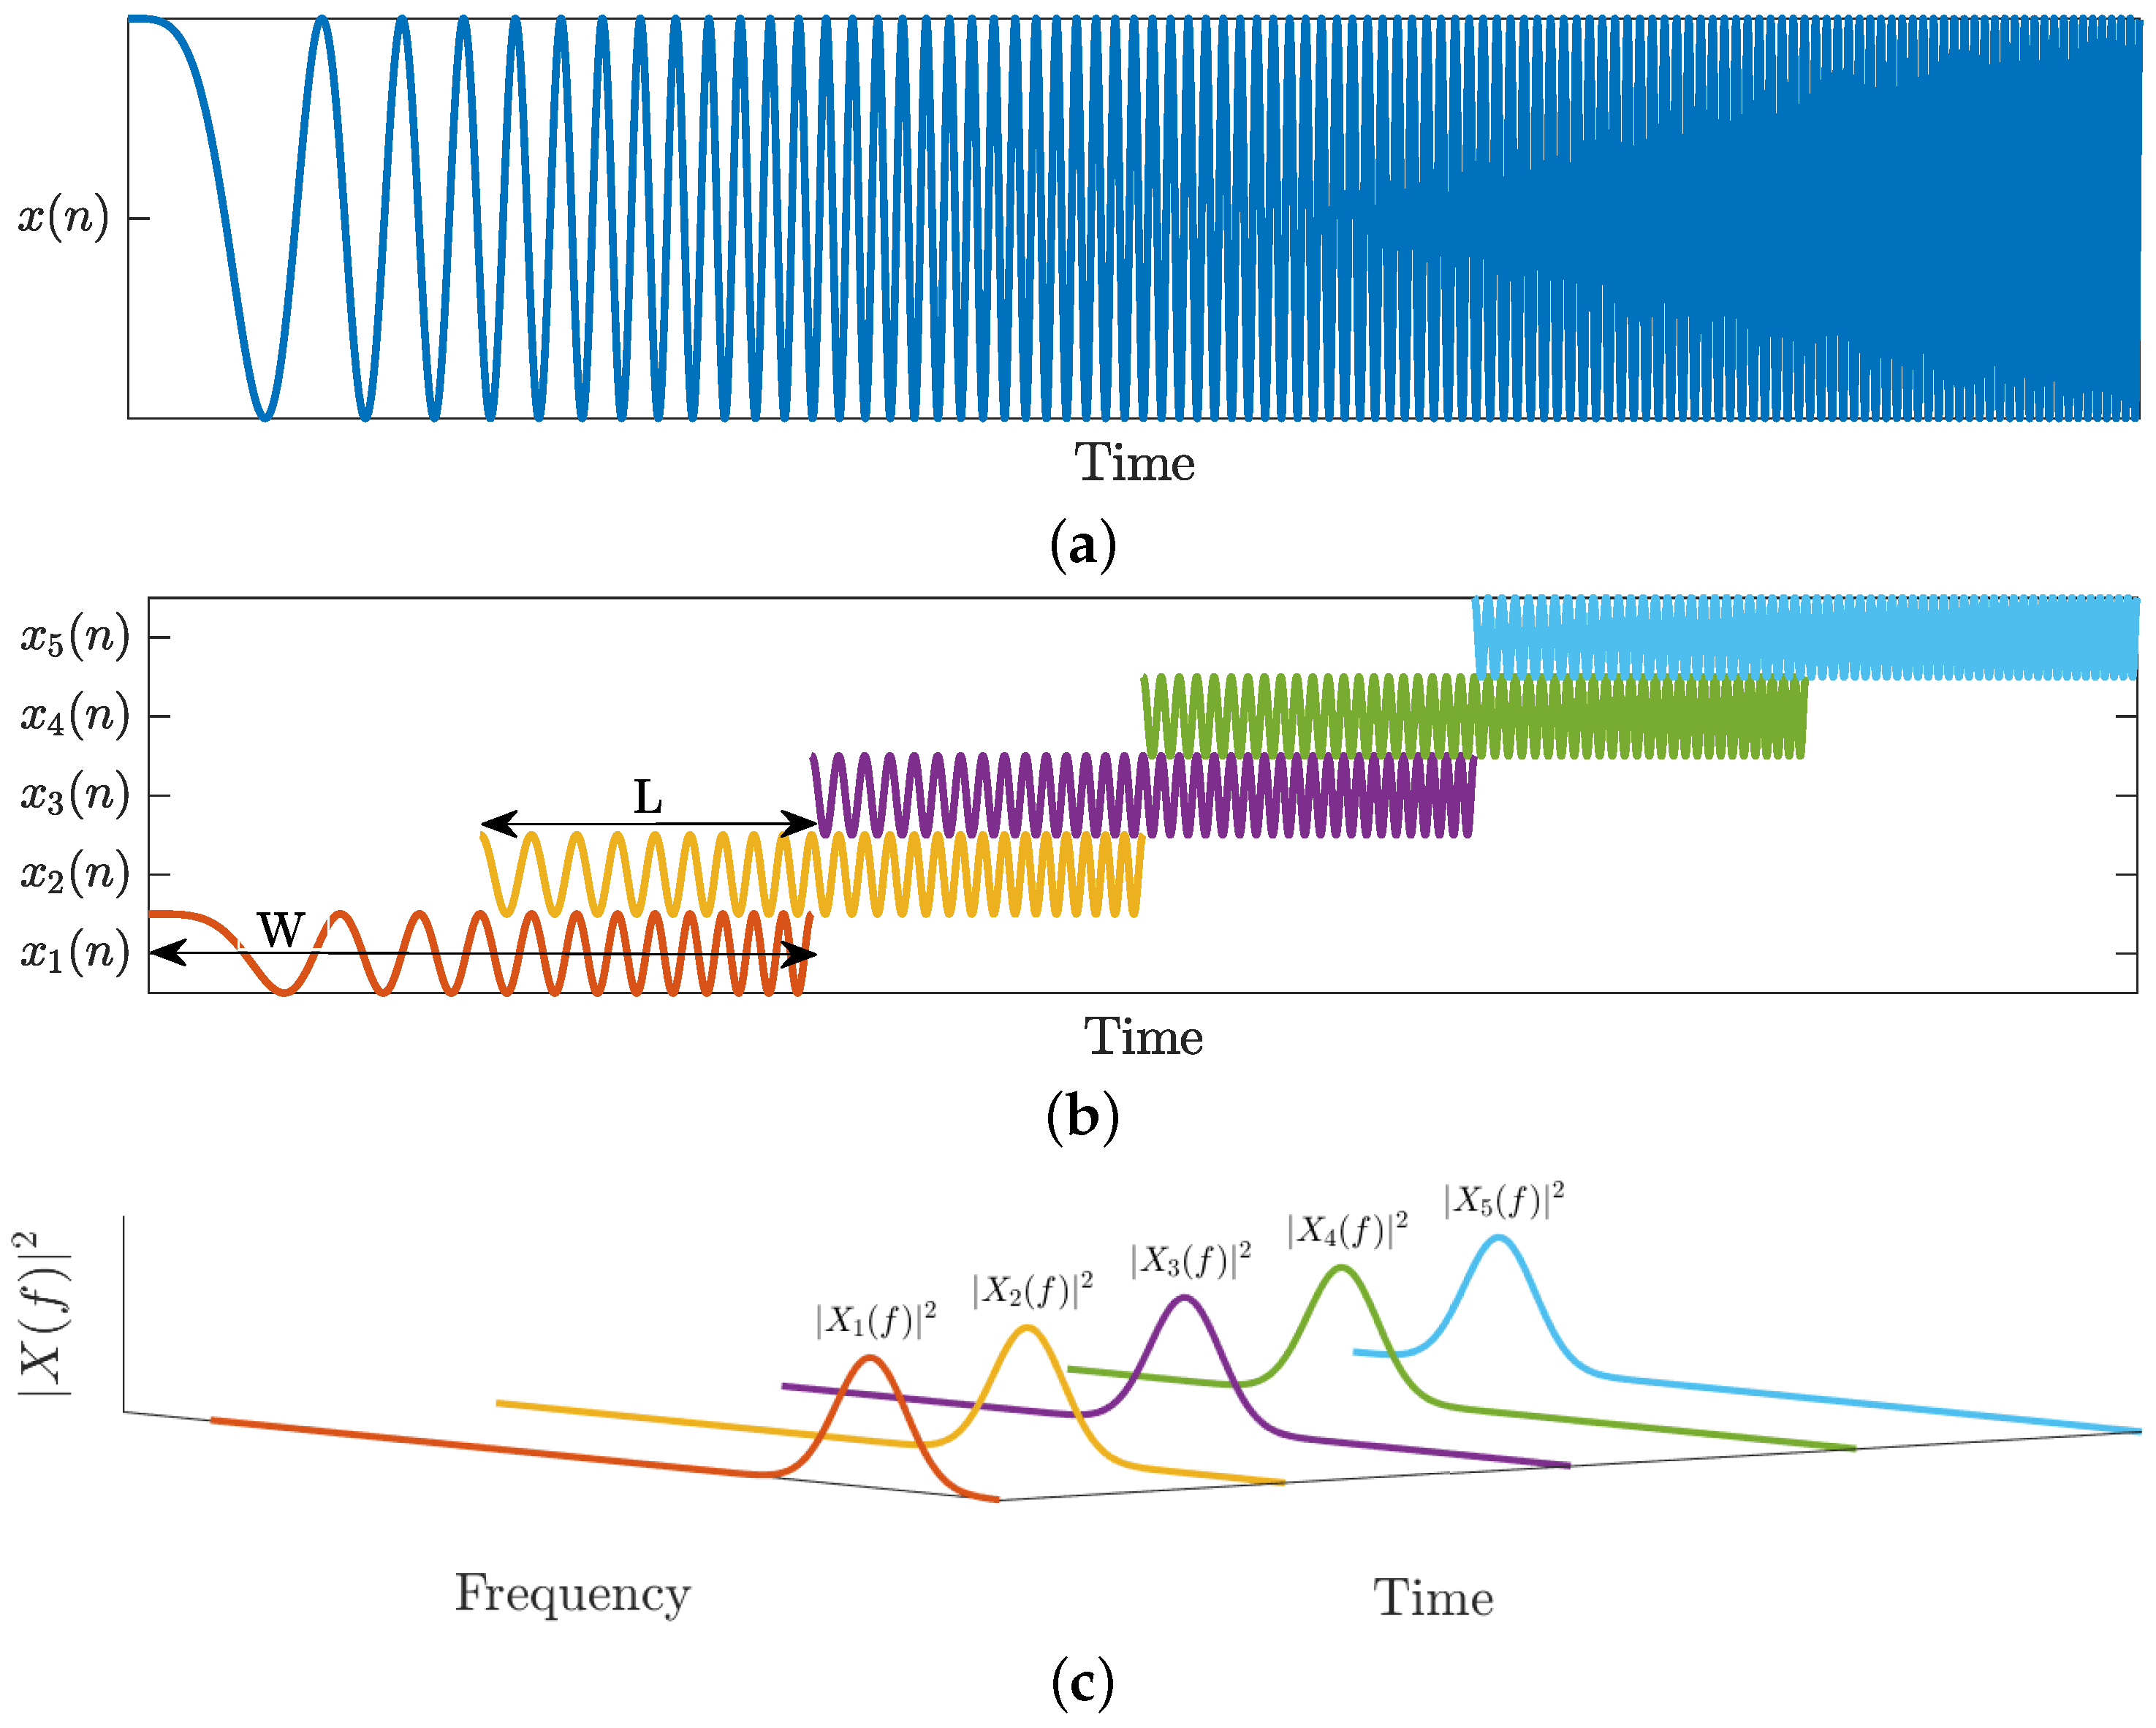
3. Creating an Optimal Spectrogram

The product obtained from the radar output is a time-dependent voltage. Short-time Fourier transform (STFT) is performed to extract the instantaneous Doppler frequency f d ( t ) , which is directly proportional to the object velocity v ( t ) . STFT is used to analyze how the Doppler frequency of a non-stationary signal (i.e., the radar’s output voltage) changes over time. The STFT of a signal is calculated by sliding a window of length W over the signal and calculating the discrete Fourier transform (DFT) of the windowed data. The window has an overlap of length L over the previous window. For example, Figure 2a shows a non-stationary signal, chirp, in which a cosine signal frequency linearly increases. Figure 2b illustrates the signal distribution to the windows and the overlap between them. Figure 2c shows the DFT of each windowed segment; here, it can already be seen how the Doppler frequency content changes over time. We used Matlab to perform the STFT calculations and generate different graphs.
The final spectrogram is the same as Figure 2c but taking a different view. The intensity of the detected signal is represented by color. Blue represents low-level intensities, while red is for higher IF signal strength. The choice of the window length on which the DFT will be performed is highly important in creating an optimal spectrogram. The window should be long enough to achieve the resolution required to identify the different micro-Doppler frequency shifts, but not so long as to enable following the temporal behavior of the instantaneous frequency. For example, if the selected window is too short when obtaining the spectrogram for the chirp signal, we sample a tiny part of the signal at a time, corresponding to an approximately square signal. Therefore, we obtain a sequence of sinc signals in the spectrogram, as shown in Figure 3a. If the selected window is too long, we sample a wide number of frequencies at a time, thus obtaining several frequencies in each window and a non-continuous graph as the spectrogram result, as shown in Figure 3c. Finally, Figure 3b shows when the window selection is suitable, and the result of the spectrogram is continuous and smooth.

4. CW Micro-Doppler MMW Radar

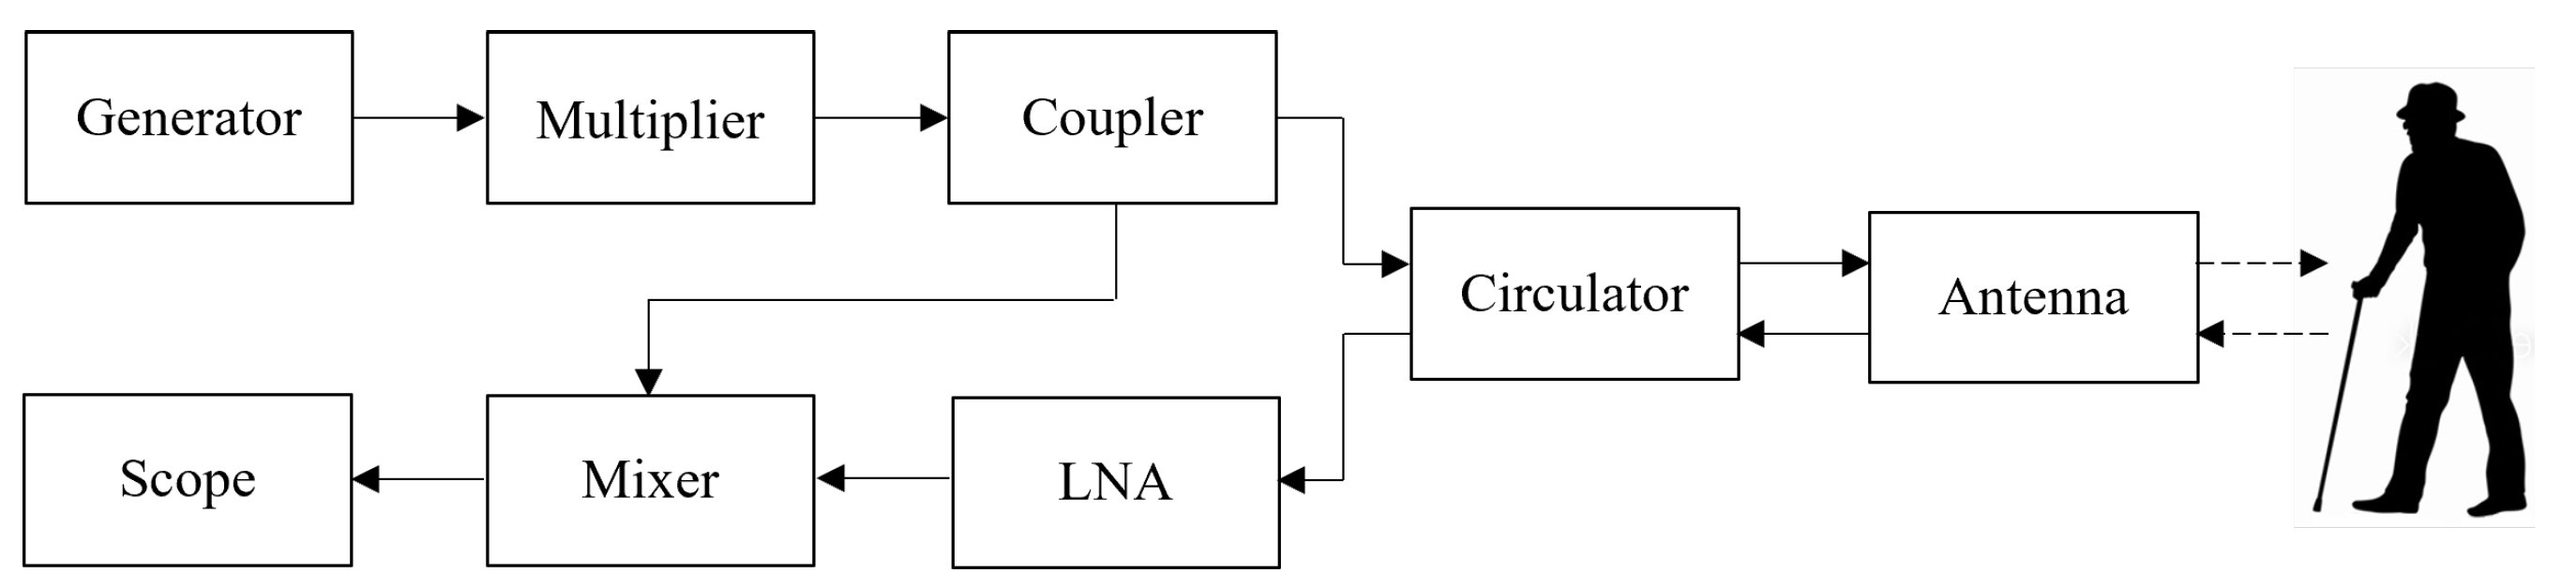
4.1. CW Micro-Doppler MMW Radar Experimental Setup

A schematic illustration of the MMW radar is shown in Figure 4. First, an RF signal generator produces a CW signal at 15.67 GHz. Next, the signal frequency is up-converted by an X6 multiplier to the W-band regime, resulting in a 94 GHz CW carrier. The output signal is then coupled to a circulator and a mixer serving as a product detector. The signal is transmitted from the circulator to the target. The received signal, scattered from the moving target, is amplified by a low noise amplifier (LNA) and inserted into the mixer. Finally, the Doppler frequency is transmitted to the scope, where the information is processed into a spectrogram.

4.2. Advantages of Using MMW in Radar Fall Detection

MMW or extremely high frequency (EHF) refers to the band of frequencies in the electromagnetic spectrum from 30 to 300 gigahertz (GHz). Our radar system operates at 94 GHz. There are several advantages to using MMW in radar fall detection in comparison to the approaches used in other published studies. First, MMW allows higher frequency resolution and more accurate results. Second, it enables the utilization of small-aperture directive antennas, resulting in smaller systems. Finally, at 94 GHz, the atmospheric attenuation is low (i.e., within the atmospheric transmission window). Therefore, this radar can perform in places where the atmosphere is not optimal for camera sensors, such as saunas.

5. Fall Detection Application

Table 1 compares the various modes of fall detection systems, showing the classifications and disadvantages. These are useful for system design.

5.1. Method of Fall Detection Using Spectral Signature

Since the system uses a CW radar, the proposed model is the most simplistic for application when the expected reflected signal frequency is up to about 10 kHz, and there are no stringent requirements for signal processing units. Therefore, the signal processing performed on a simple microcontroller can be implemented. The disadvantages of the system are that fall detection occurs only for movement perpendicular to the radar system. Therefore, the Doppler received signal will be only the distraction levy on the radial axis for movement not perpendicular to the distraction [13]. However, several mechanisms can overcome this problem. For example, installing two systems on two perpendicular walls or identifying the object’s location by calculating the angle relative to the radar system [17]. The spectral signature describing a person’s movement can be detected using the CW micro-Doppler MMW radar described in Section 4.1 and to generate the spectrogram described in Section 3. By examining these spectral signatures detected by the radar, it is possible to identify the kind of user movement. We measured four different kinds of motion: falling, sitting, walking and falling while walking. The differences between the spectral signatures detected using the radar could be seen for these four movements. As a result of these differences, we determined that is possible to identify and distinguish a falling person using the radar.
In order to demonstrate the accuracy of the spectral signature results obtained using the radar, we simultaneously performed measurements with video processing. We filmed the person’s movement with a simple camera, and using the “Tracker” program, we followed the movements of various body parts. “Tracker” is a free video analysis and modeling tool built on the Open Source Physics. Next, we compared the results obtained from the two different measurement modalities.

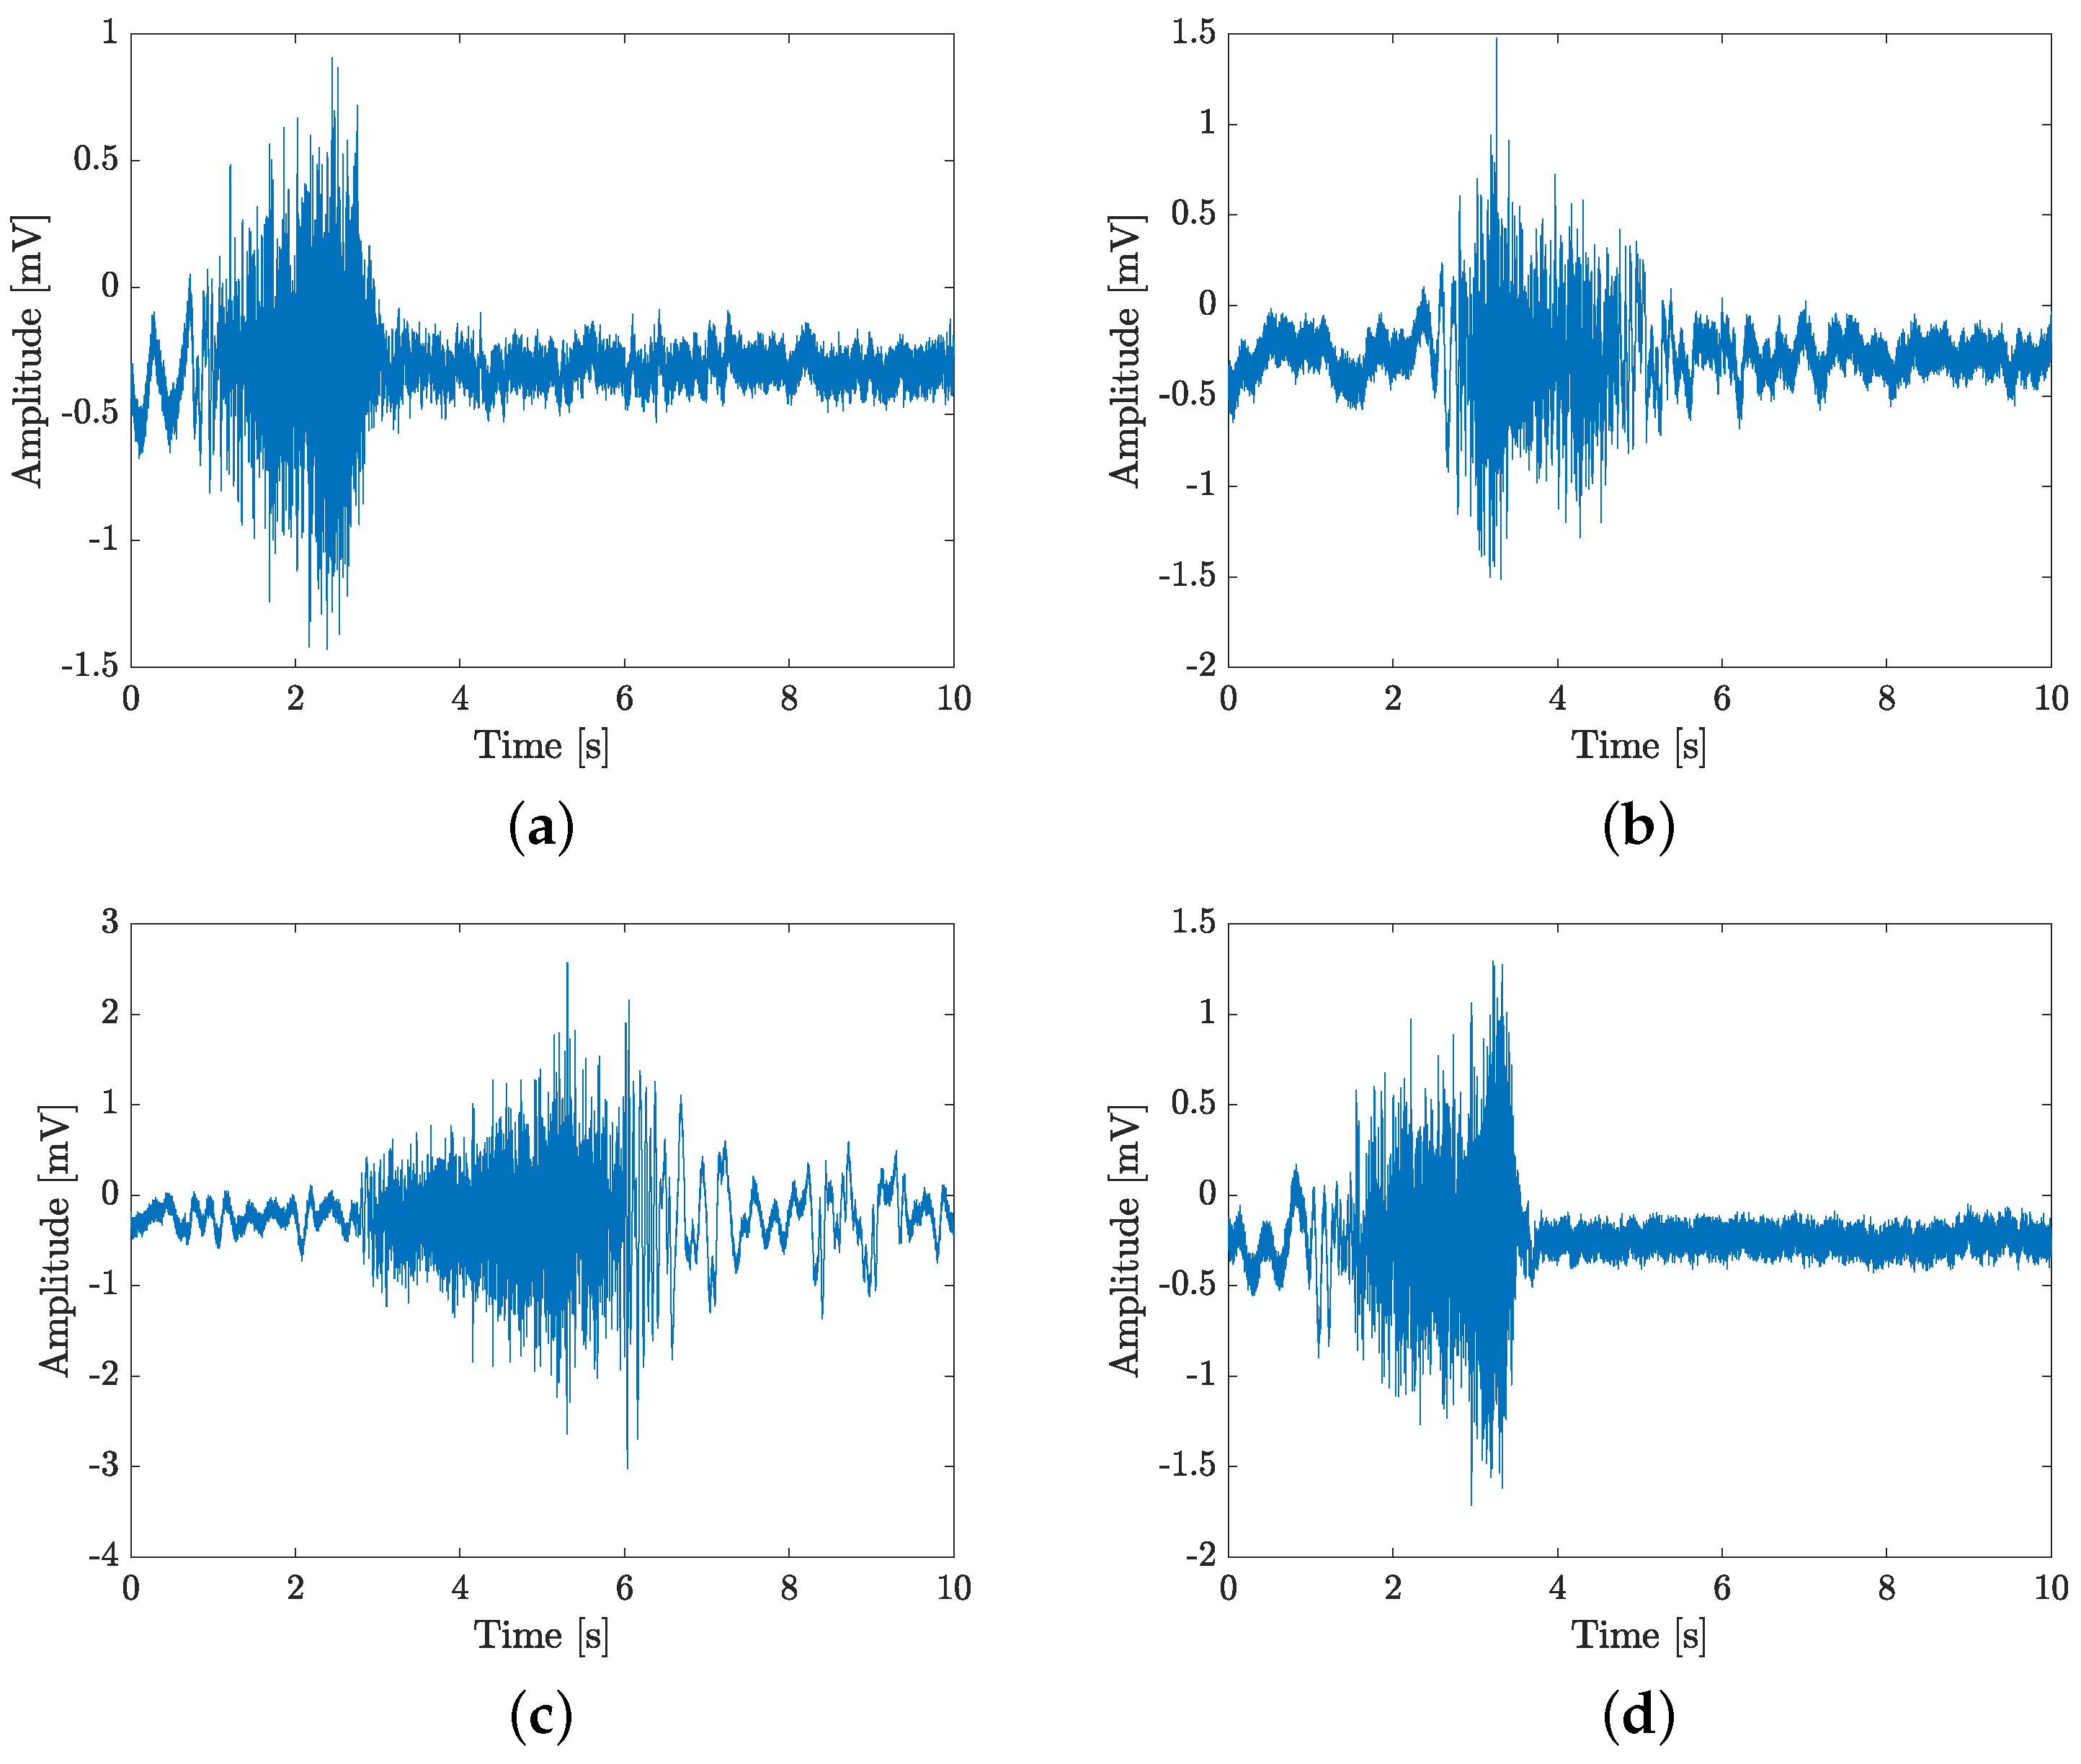
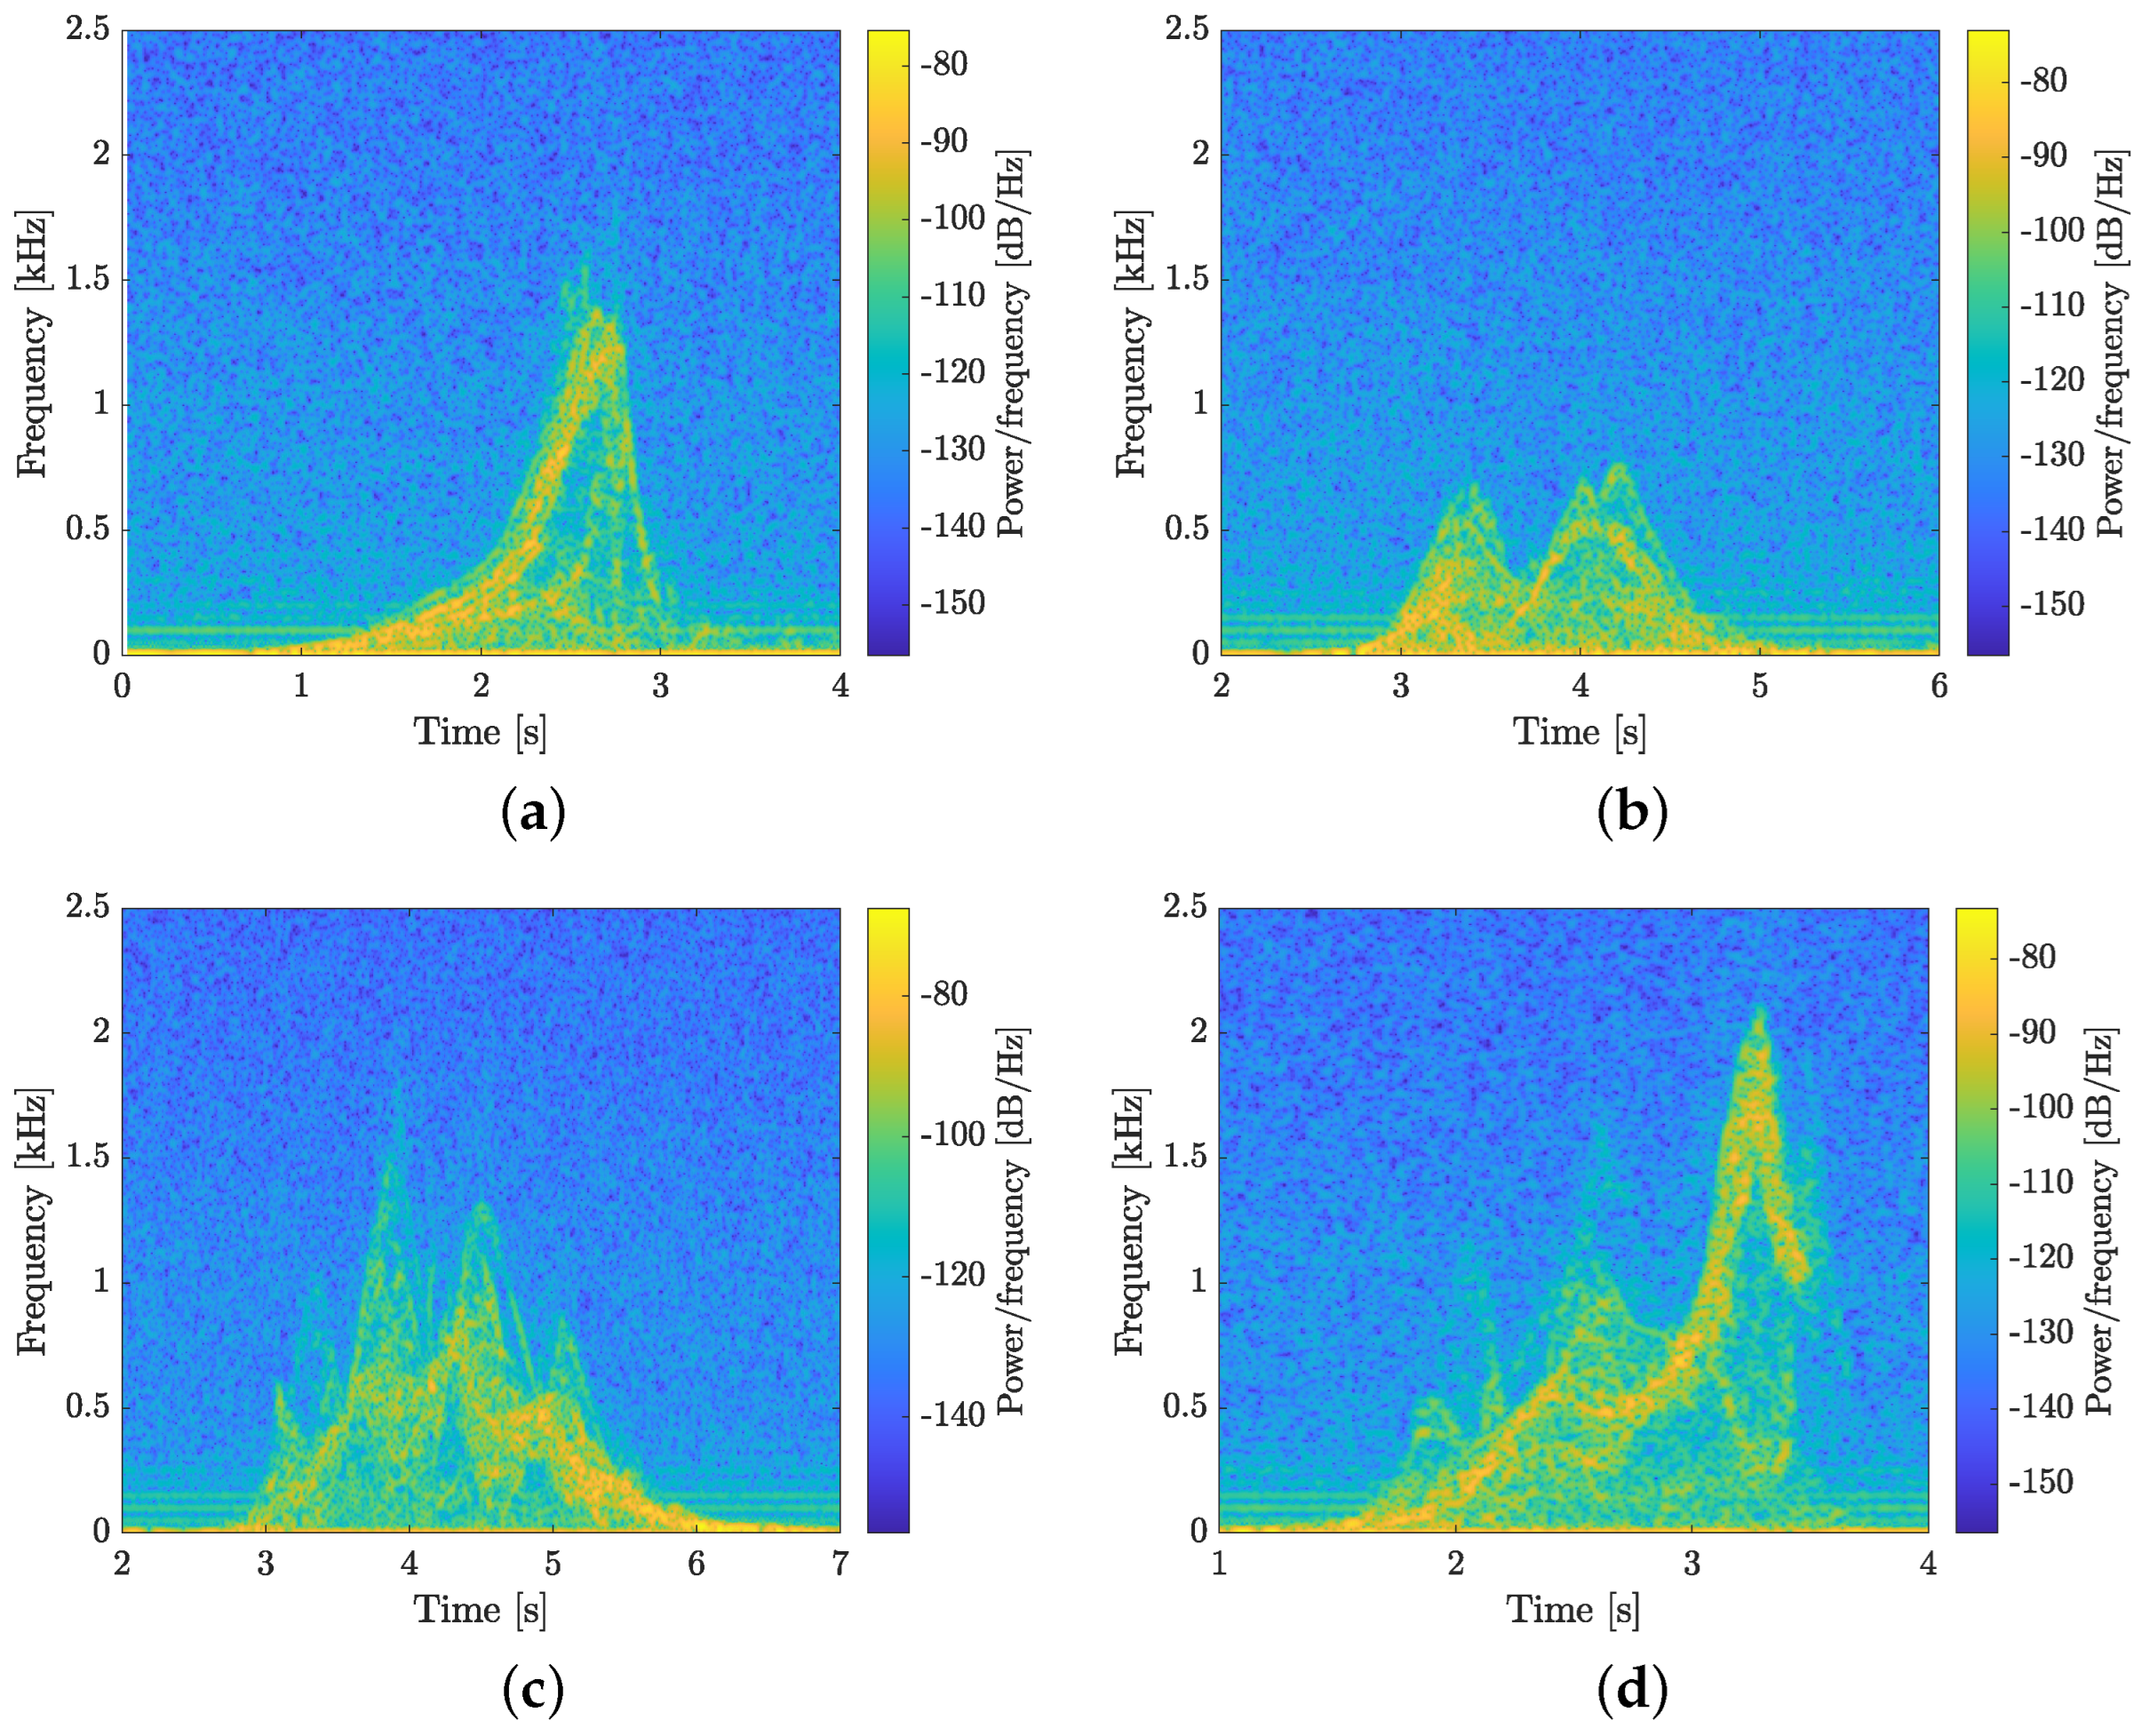
5.2. Experimental Results

Typical time domains of the IF signals resulting from the four different motions are shown in Figure 5. We generated a spectrogram for each type of motion, as can be seen in Figure 6. These spectrograms contain valuable information related to human motion characteristics. The results are obtained consistently for a specific target but depend on the target’s characteristics, such as height, and the system’s characteristics, such as the transmission frequency and the viewing angle.

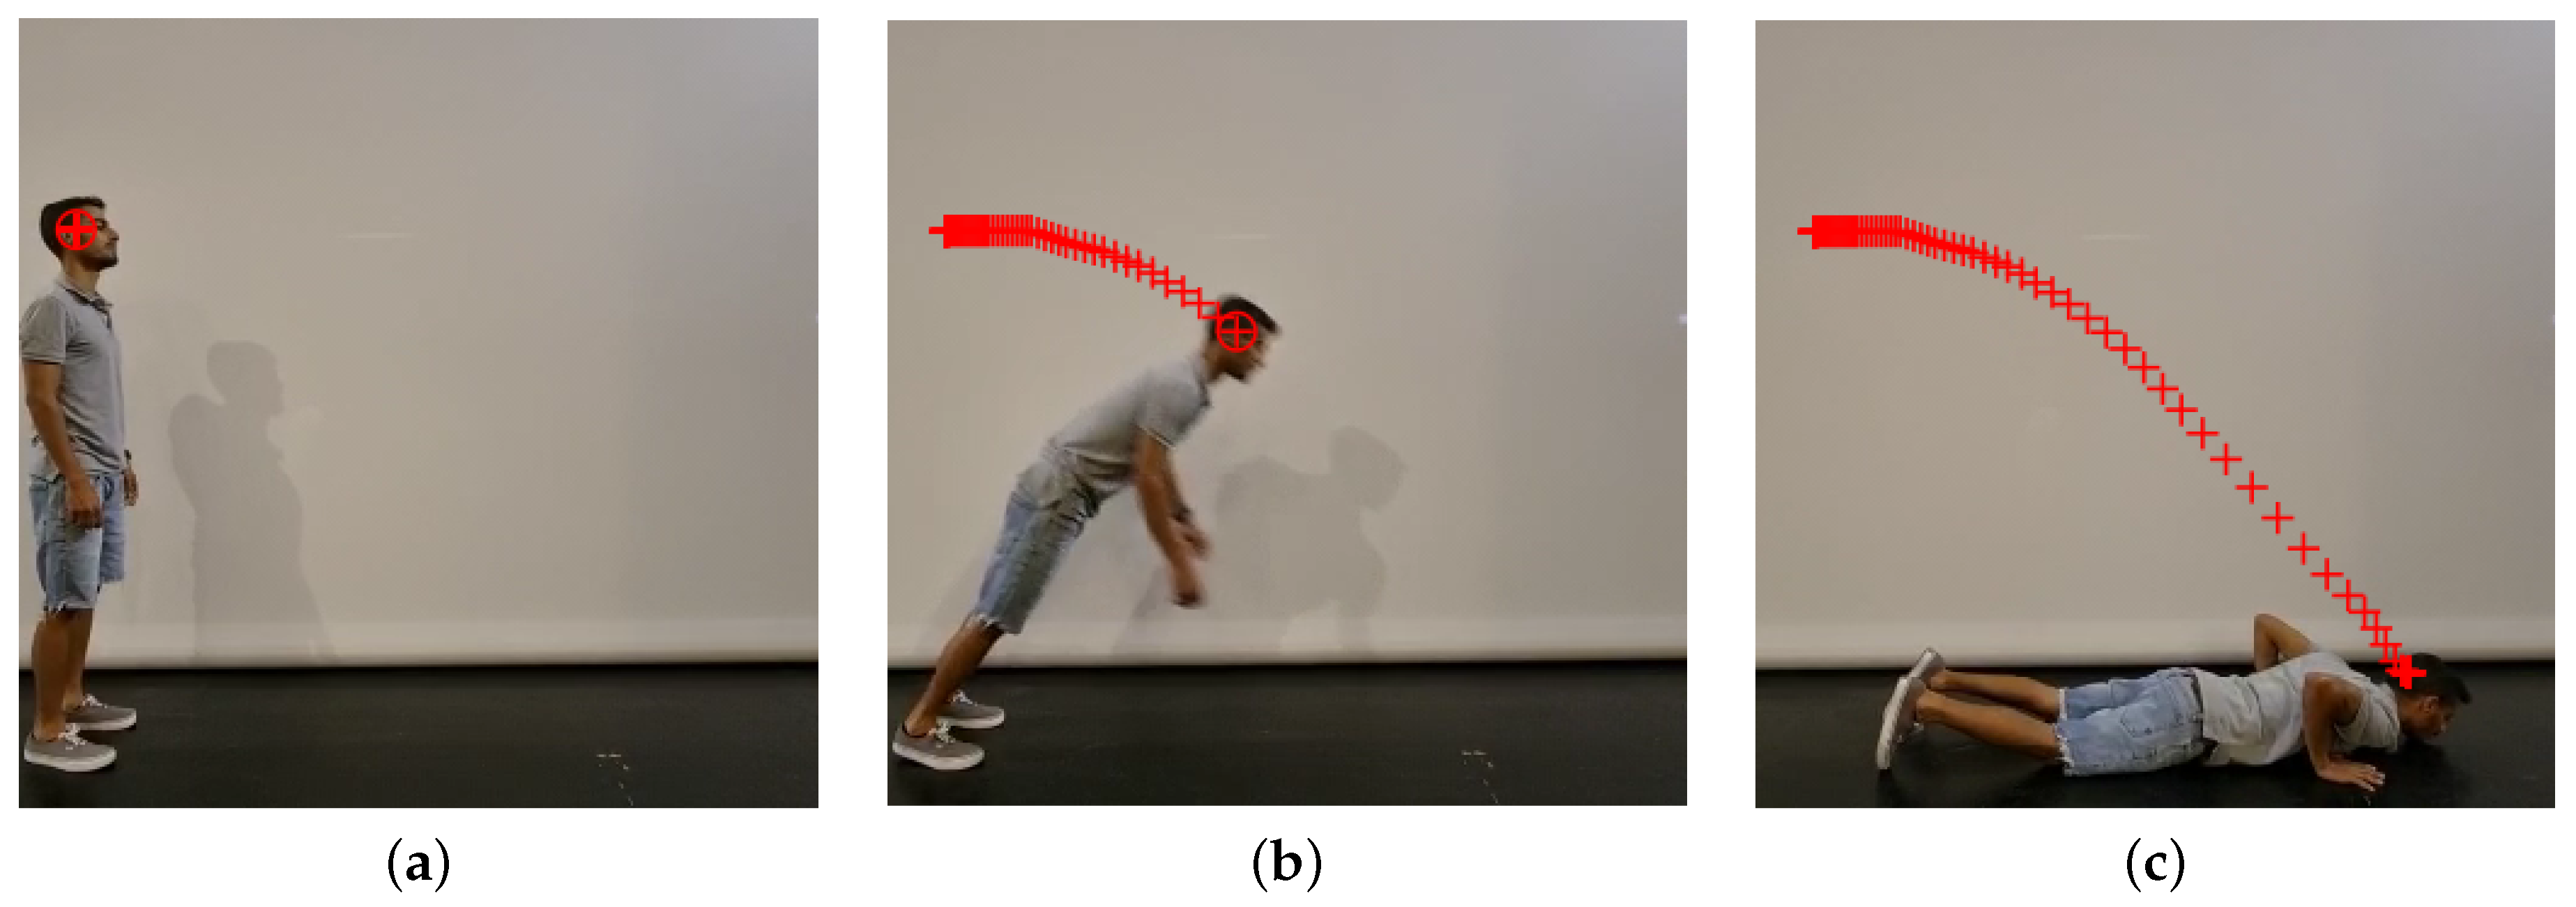
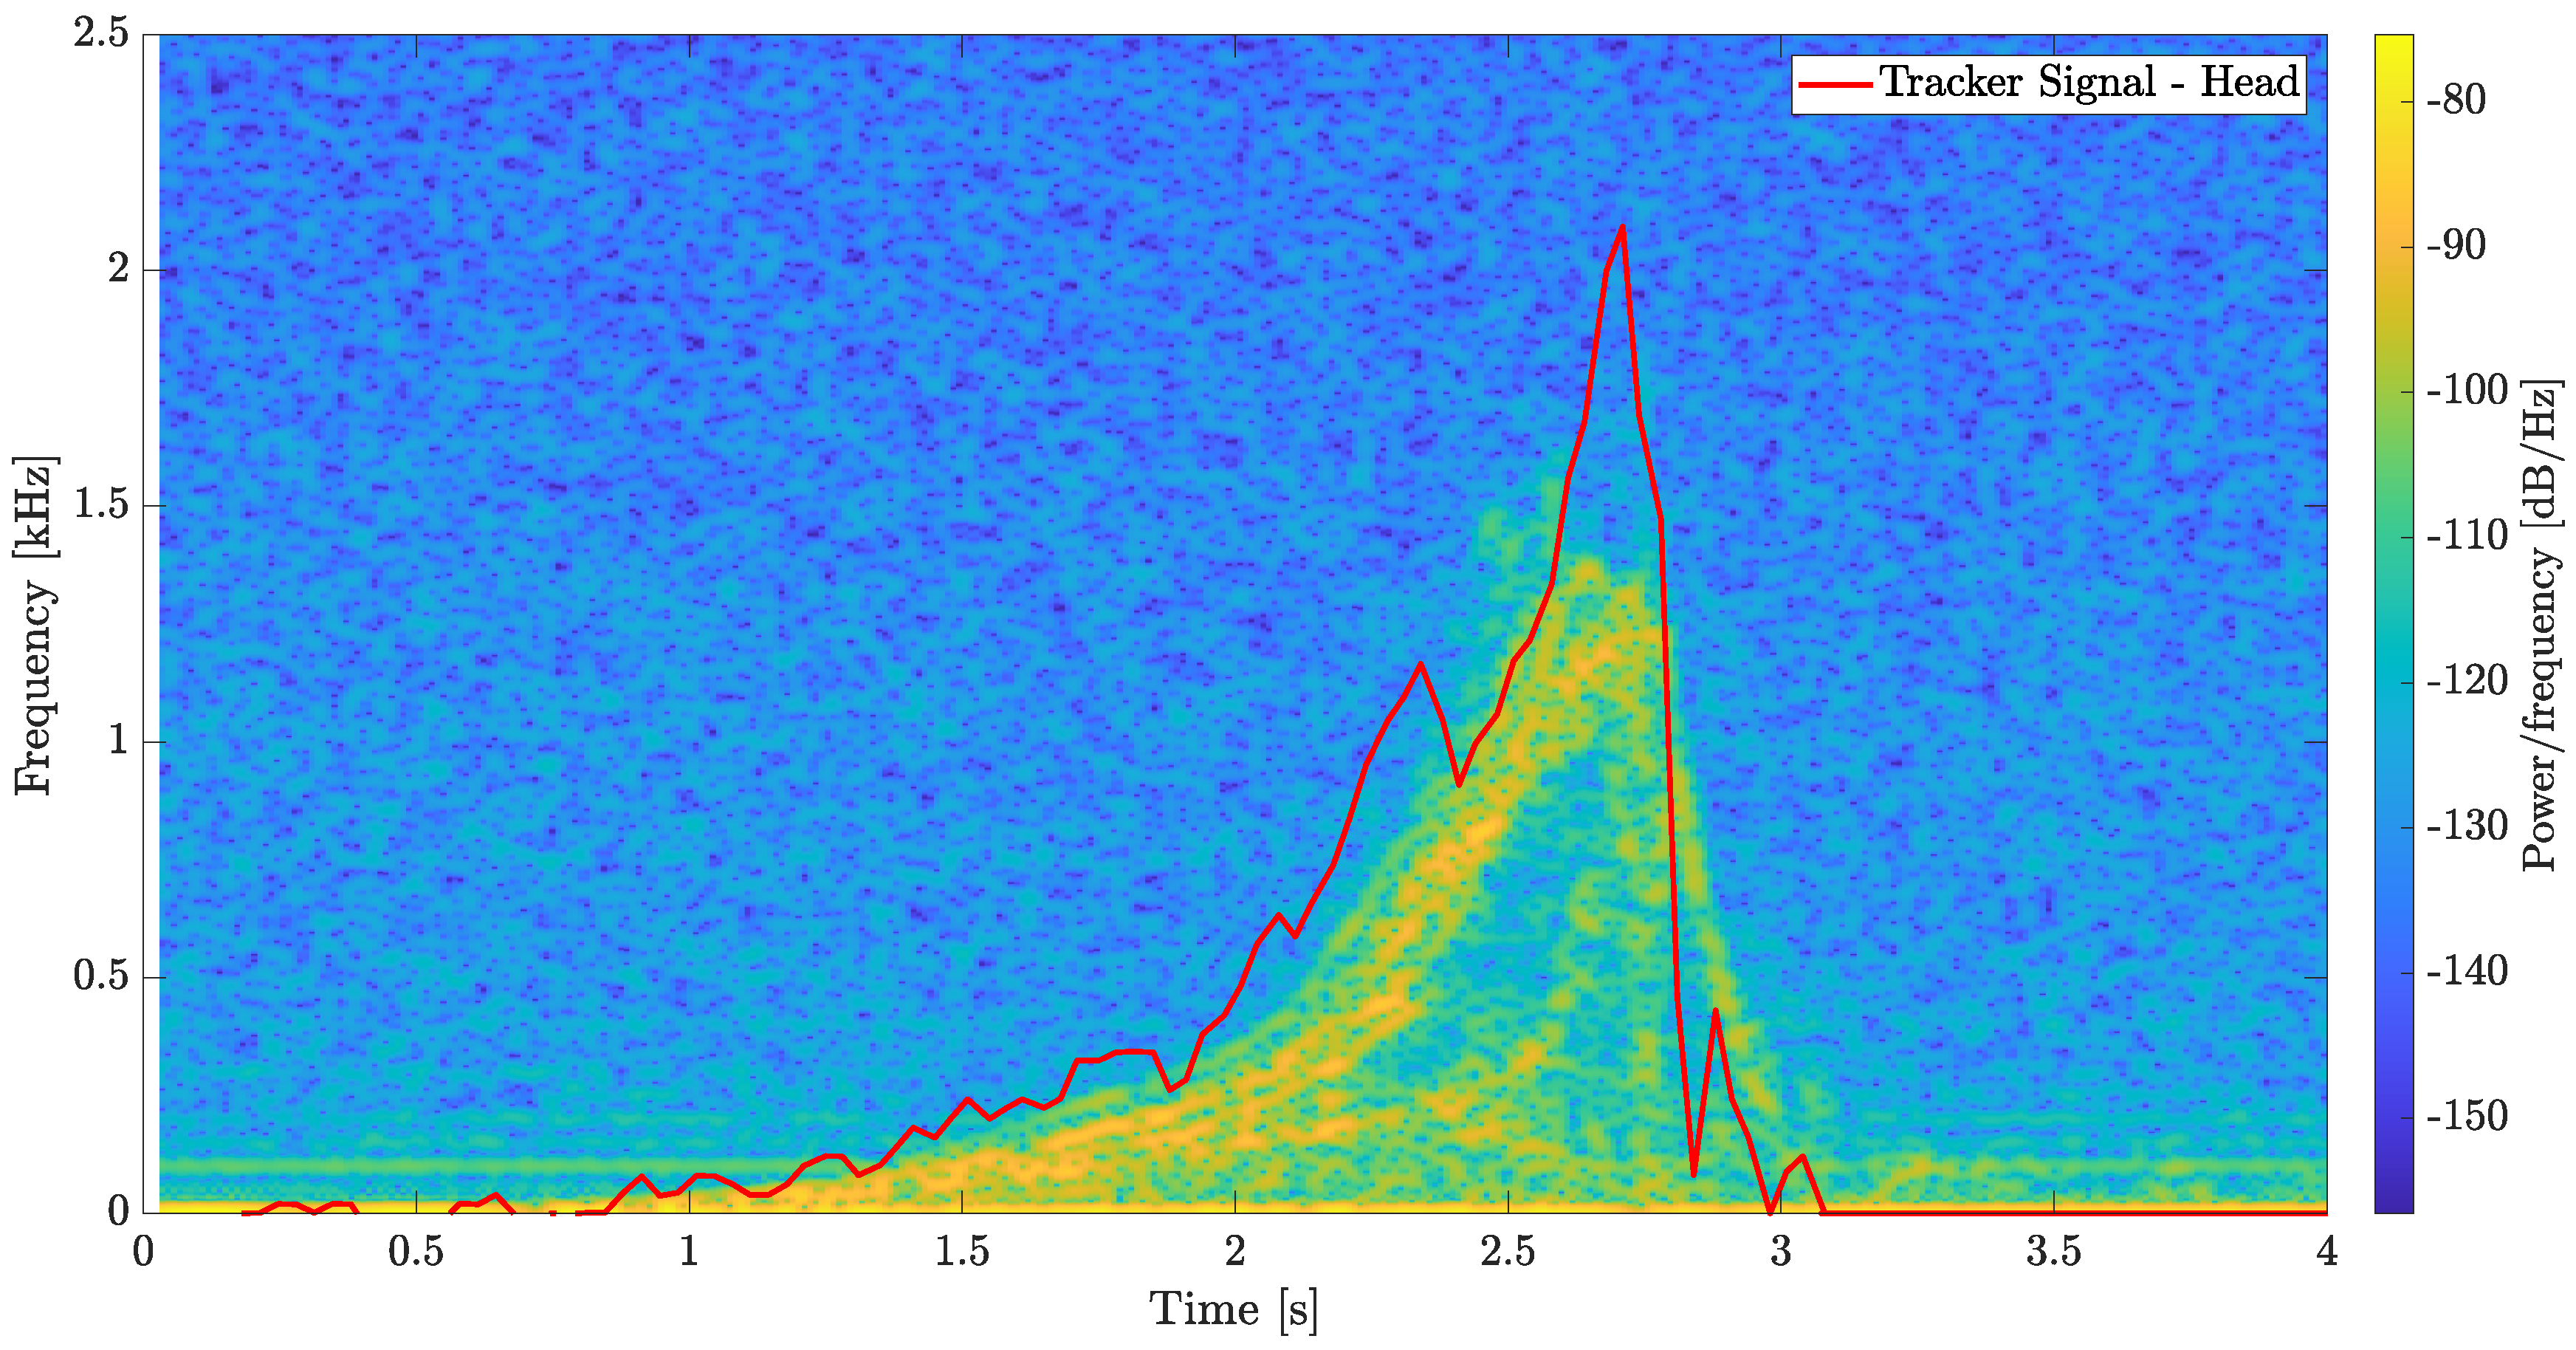
5.2.1. Falling Experiment

For the scenario of a person falling, we measured an individual’s spectral signature using the radar, as shown in Figure 6a. In addition, we tracked the movement of the head using video processing. Figure 7 shows three frames from the video of the falling person; the red markings indicate the head movement tracking. Figure 8 shows the results of the two experiments described above.
It can be seen that the shape of the analyzed video signal fits the spectrogram from the radar. The inaccuracy of the slopes and the maximum point are attributed to the video camera’s low frame rate. From the spectrogram, the duration of a person’s fall was determined to be T 1 = 1.96 s and the maximum frequency f m a x = 1.6 kHz. Using Equation (5), and in the case that α = 0 , i.e., the person’s motion is in the direction of the radar, it is possible to calculate the maximum speed during this motion v m a x = 2.55 m/s. The time taken for the frequency to decrease back to f = 0 was T 2 = 0.425 s; thus, the decreasing slope was m n = 3.764 kHz/s. Note that, in reality, the expected slope should be steeper, because the subject in this experiment stopped himself before hitting the ground in order to avoid injury.

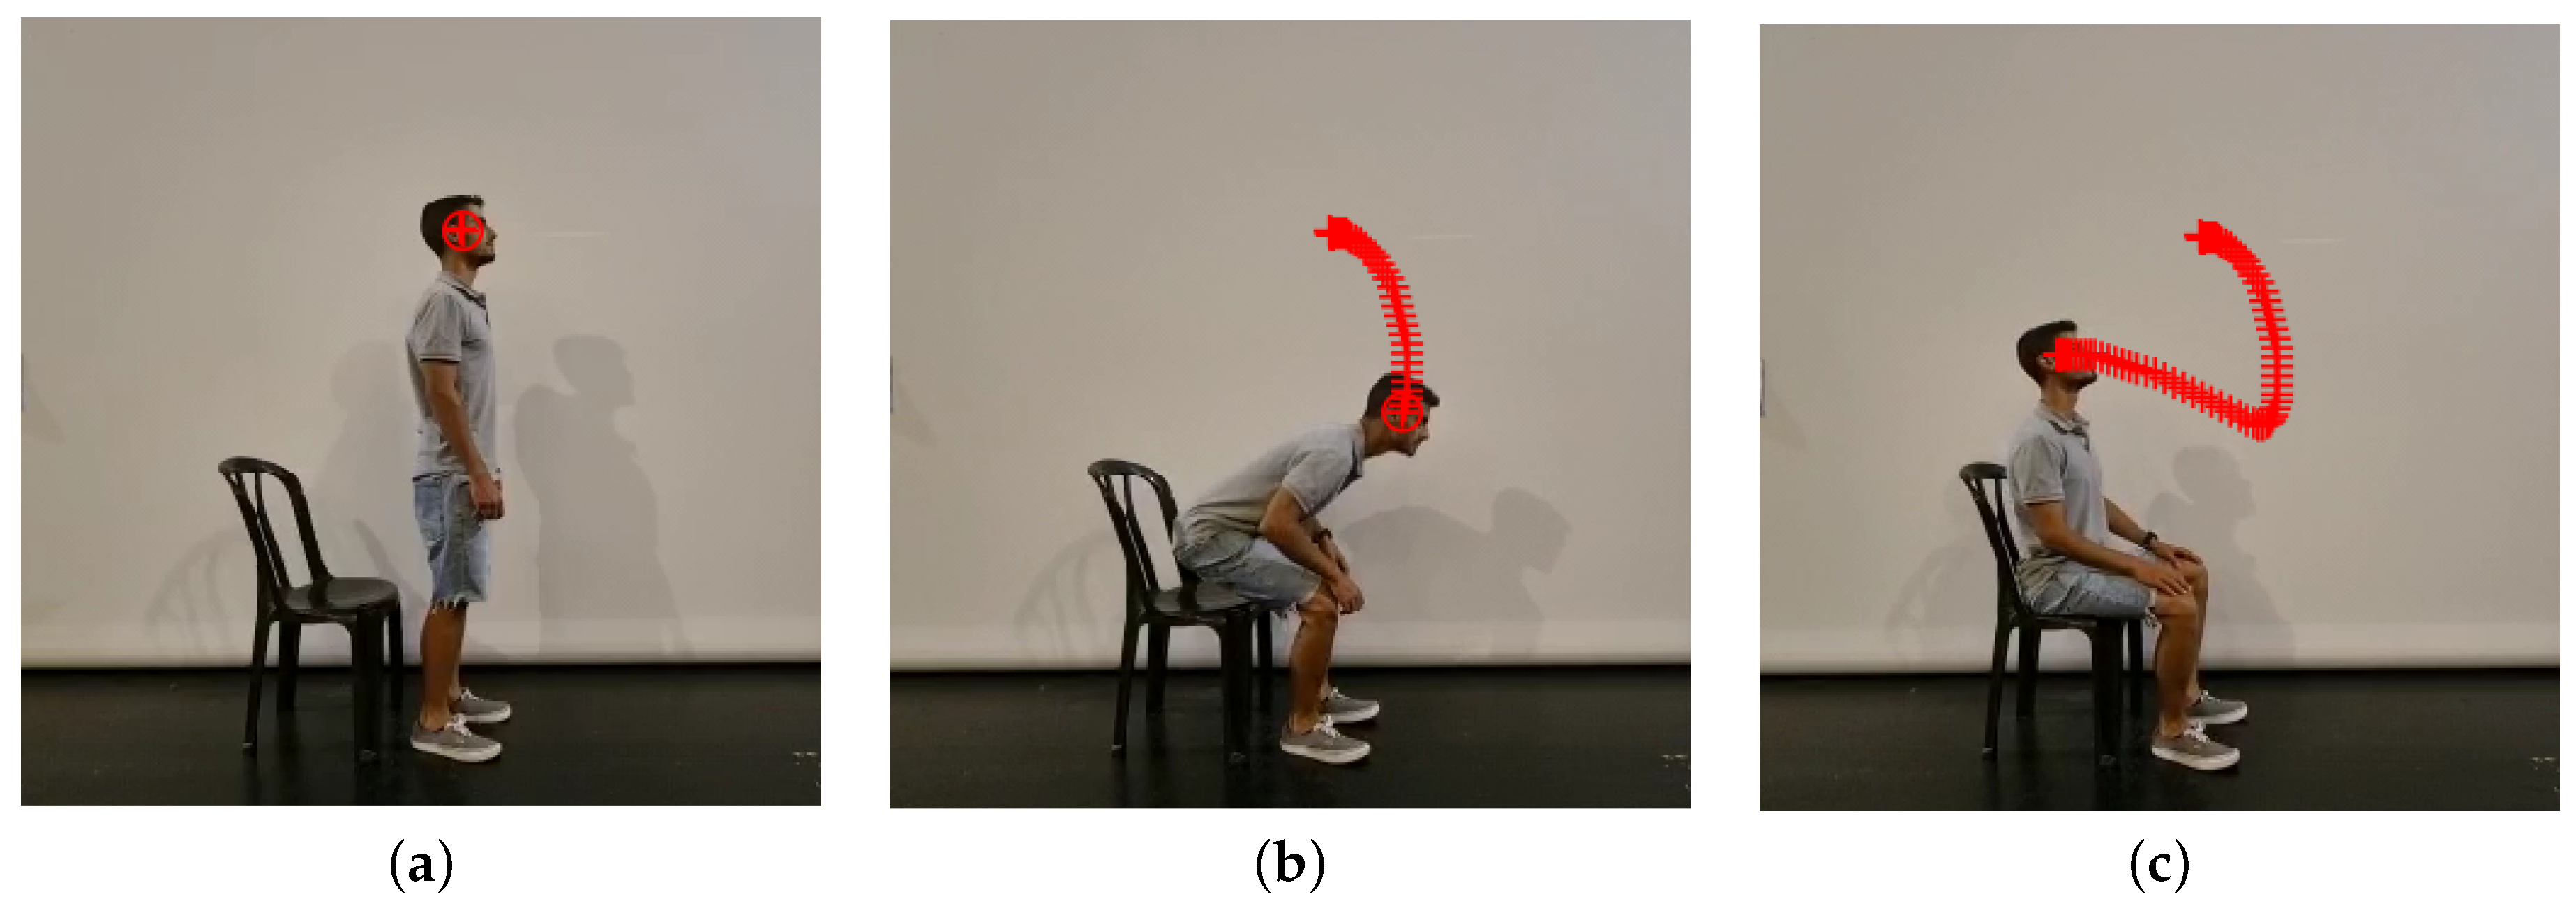
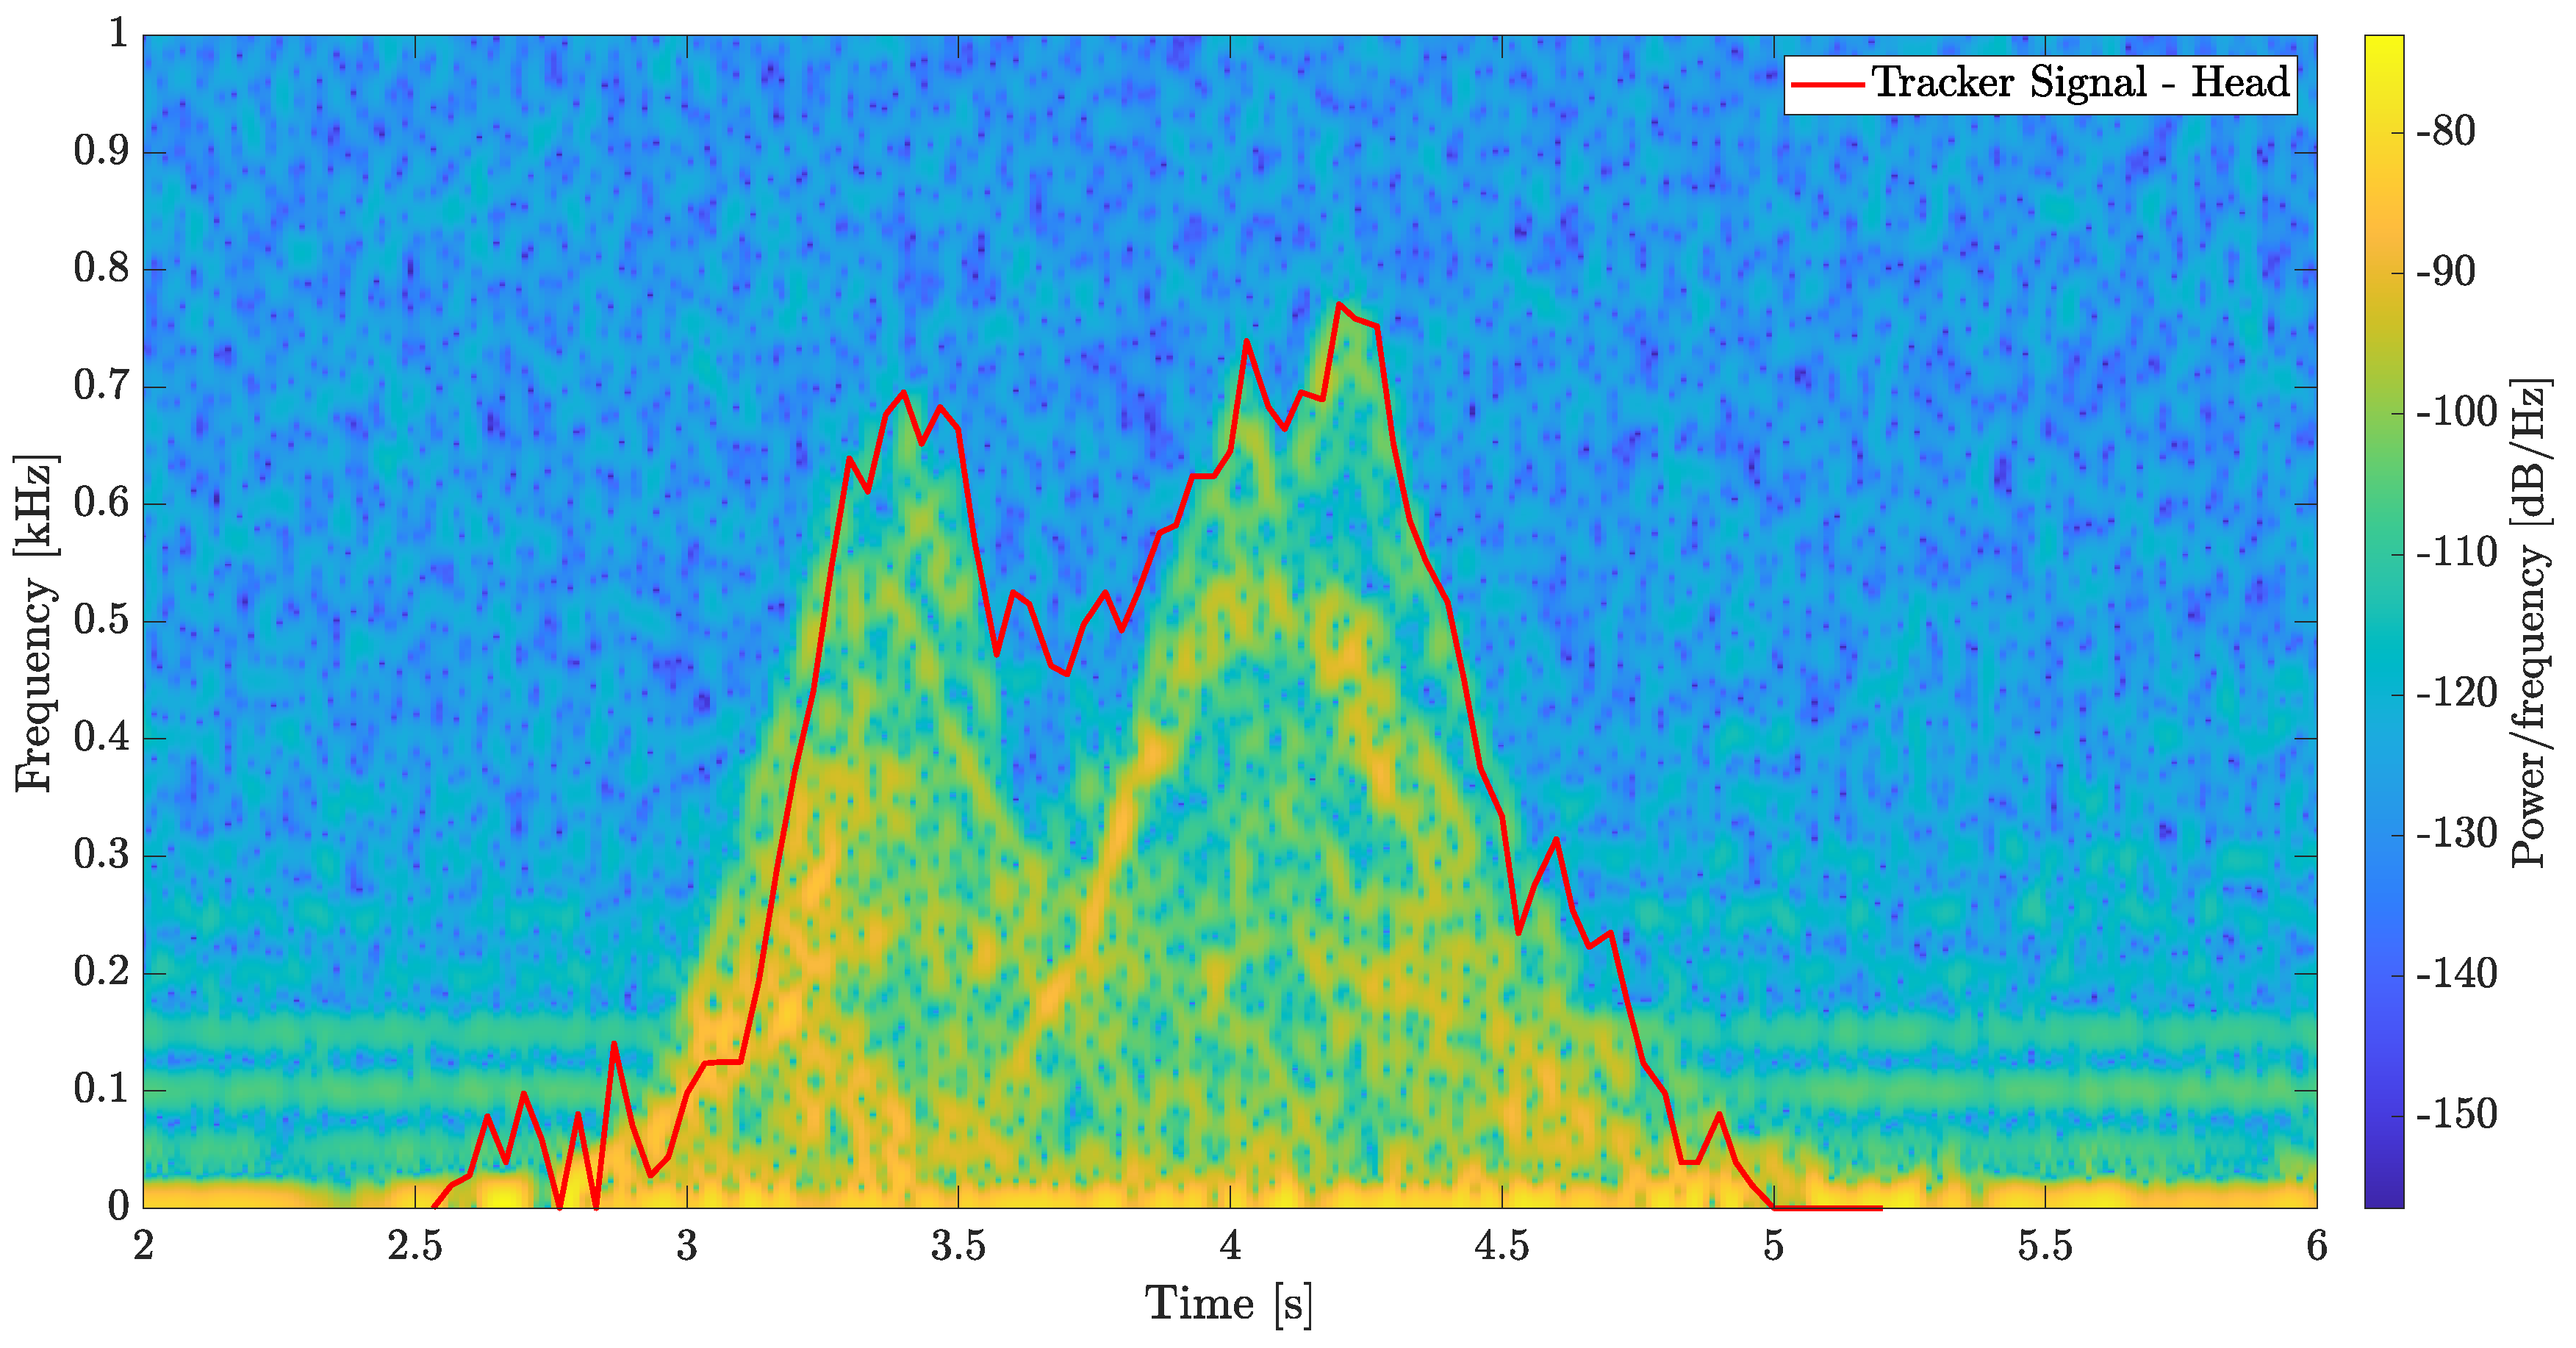
5.2.2. Sitting Experiment

For the scenario of a sitting person, we measured the test subject’s spectral signature using the radar, as shown in Figure 6b. We also tracked the movement of his head using video processing. Figure 9 shows three frames from the video of the sitting test subject; the red markings show the tracking of his head movement. We chose to track the head because it is the uppermost part of the body and therefore has the highest velocity during this motion. Figure 10 shows the results of the two experiments described above.
The fusion of the sensor’s radar and video helps to verify the results. However, in practice, the system will be radar-based only. Therefore, the following analysis deals with the results obtained from the spectrogram. Figure 10 clearly shows the accuracy of the spectrogram result. We split the head motion into four parts in order to better understand the spectrogram result. First, in the time interval 2.6 s < t < 3.4 s , the head is accelerating forward with the test subject’s body and the frequency changes in the range 0 < f d < 0.695 kHz; therefore, there is a positive slope of m p = 0.868 kHz/s. Second, in the time interval 3.4 s < t < 3.7 s , the subject accelerated backward while their velocity was still in a forward direction up to the point where their velocity reached 0. The Doppler frequency, from the spectrogram, decreased to f d = 0.38 kHz and the slope of this part was m n = 0.393 kHz/s. Third, in the time interval 3.7 s < t < 4.2 s , the subject’s head movement and velocity were in a backwards direction. The frequency increased to f d = 0.8 kHz with a slope of m p = 0.814 kHz/s. Finally, in the time interval 4.2 s < t < 5 s , the frequency decreased to f d = 0 . In this interval, the frequency has a decreasing slope of m n = 1 kHz/s.

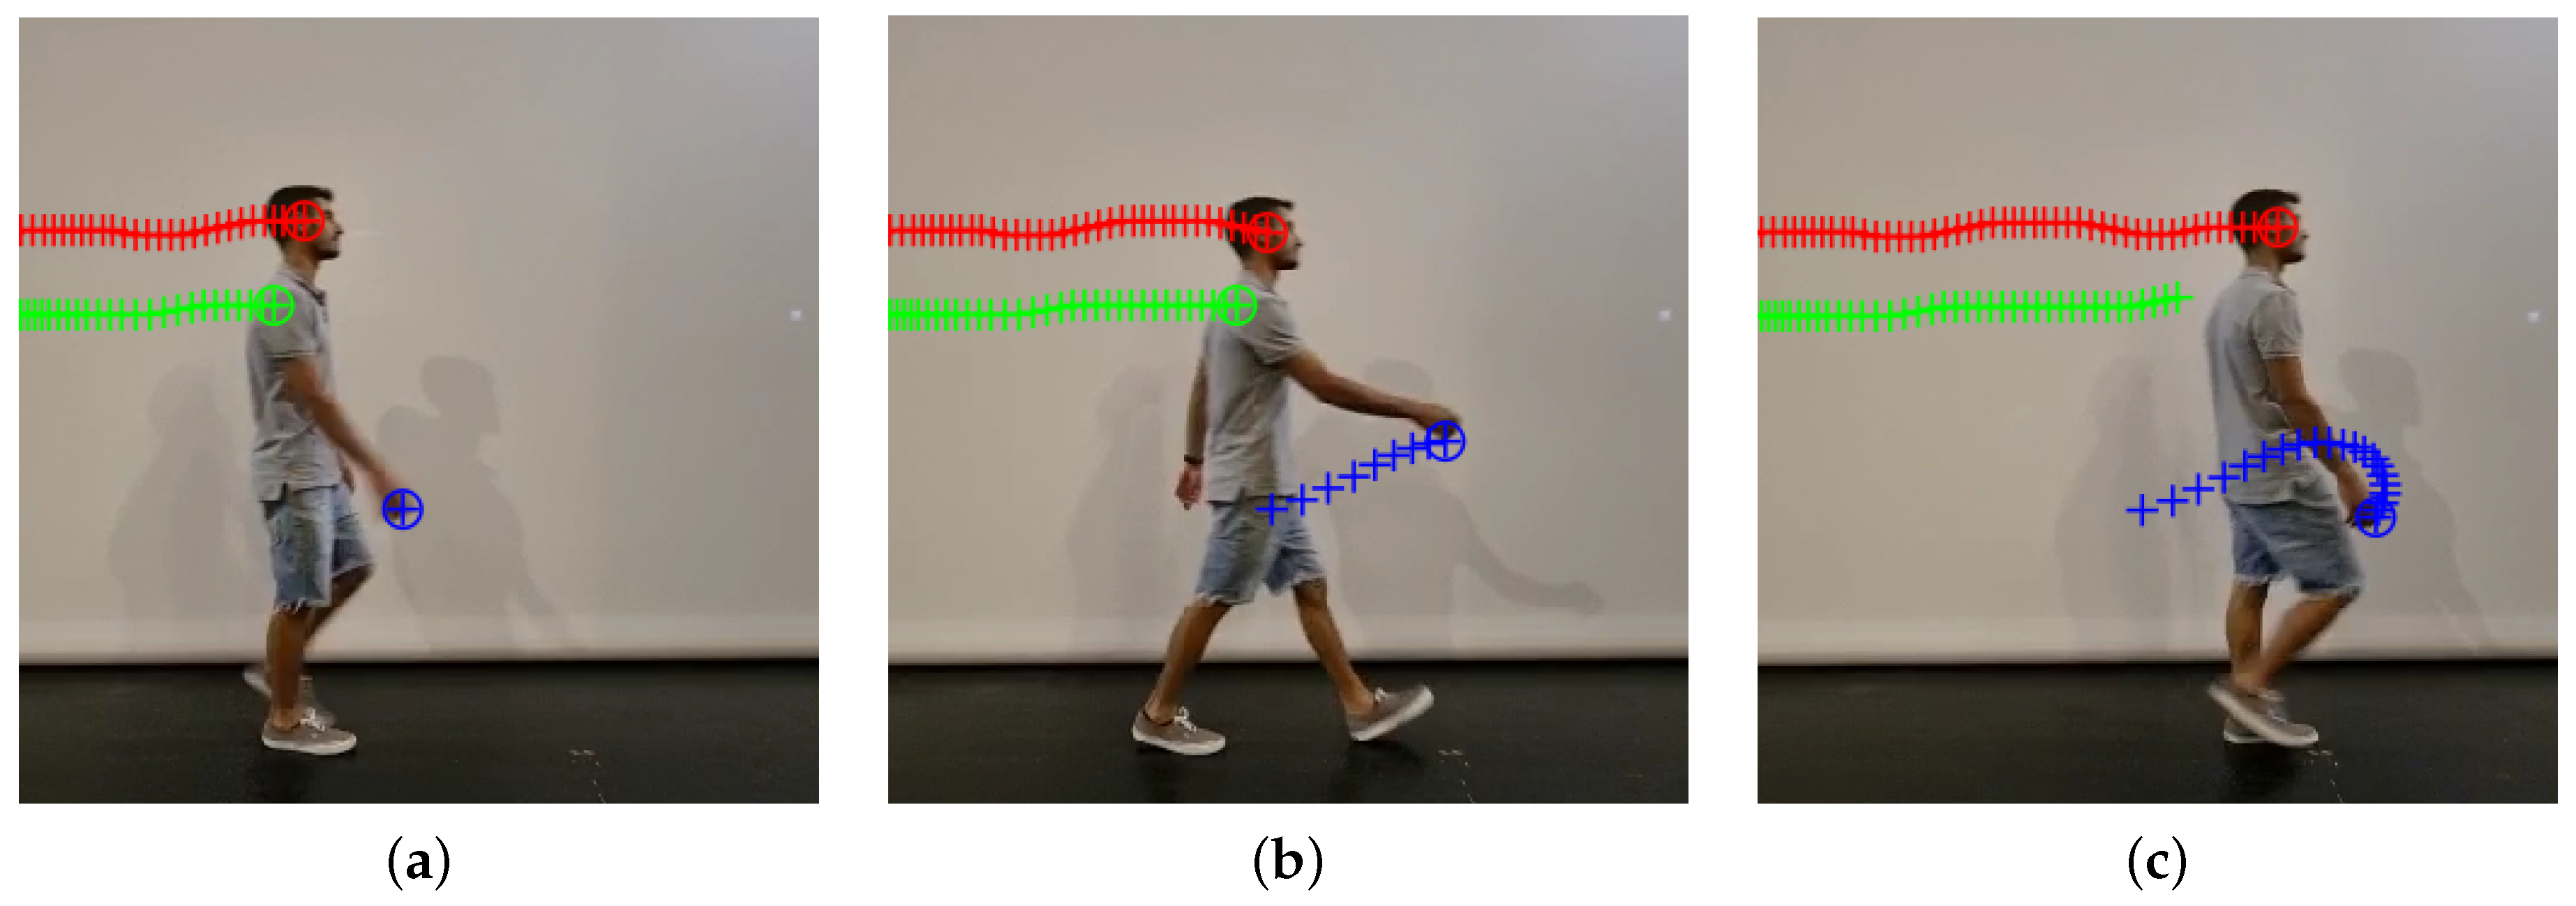
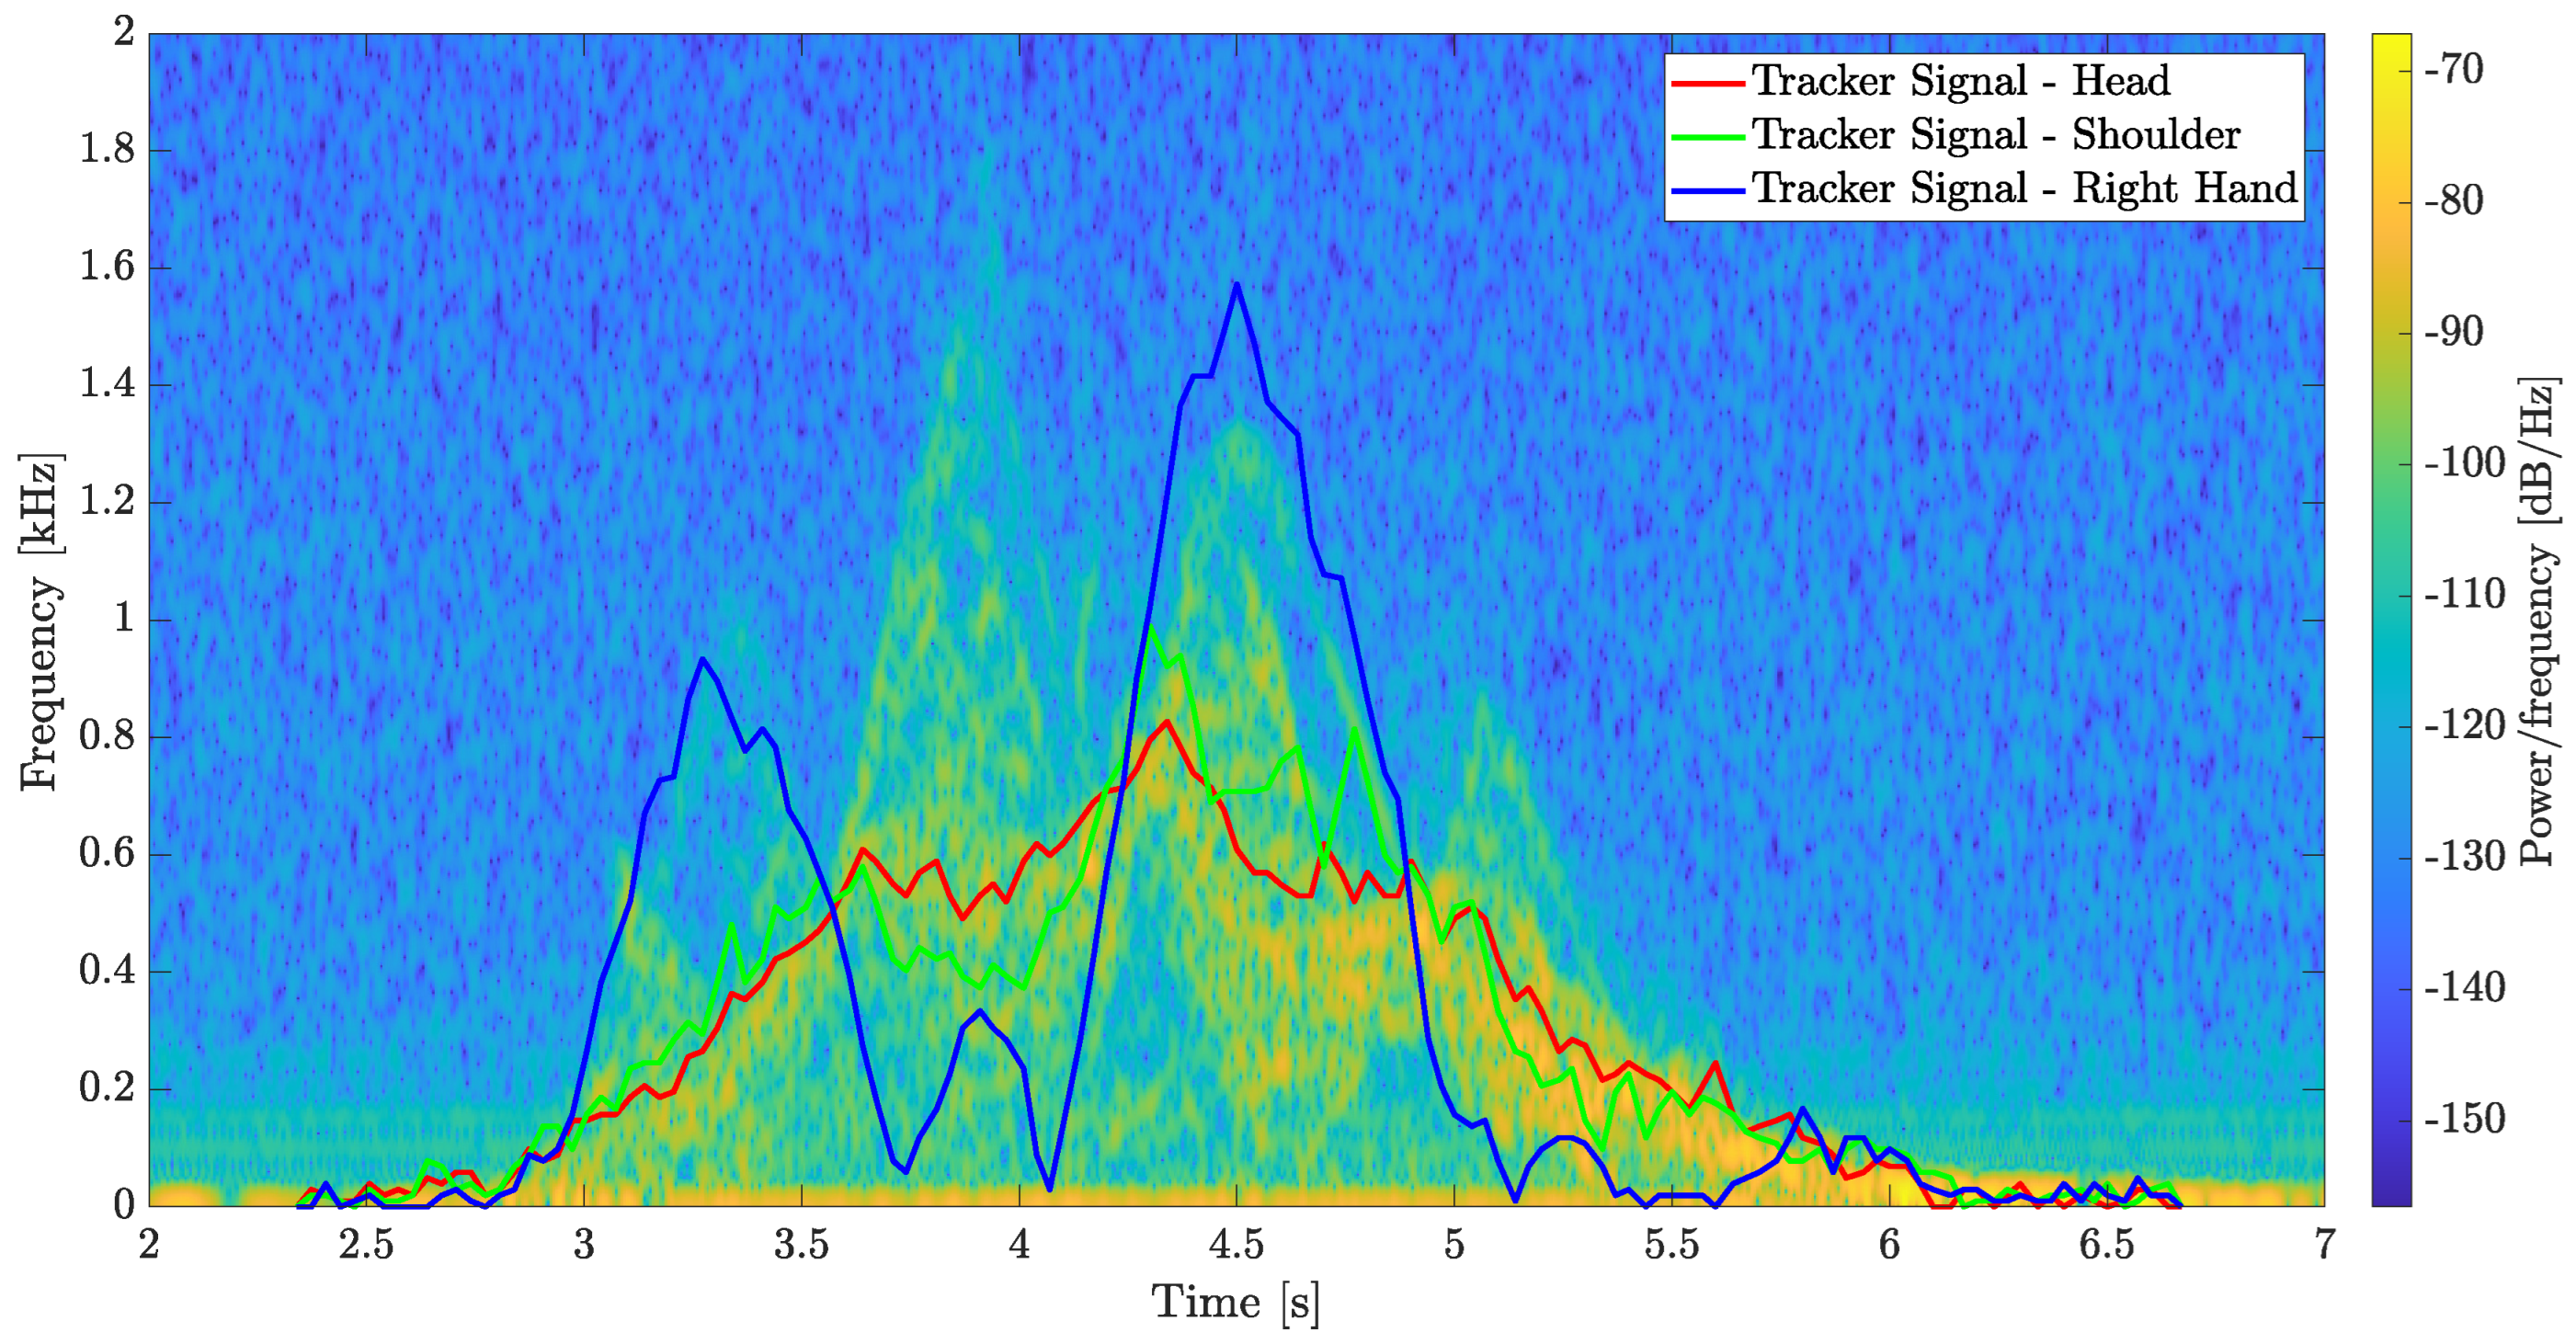
5.2.3. Walking Experiment

For the scenario of a walking person, we measured the subject’s spectral signature using the radar, as shown in Figure 6c. We also tracked the movement of his head, shoulder and right hand through video processing. Figure 11 shows three frames from the video of the walking person; the tracking of the head movement is indicated by red markers, shoulder tracking by green markers and tracking of the right hand by blue markers.
Figure 12 shows the results obtained in the experiments described above. In this figure, correspondence between the spectrogram and the video analysis results can be seen. In the movement of the right hand, indicated as a blue line, two “hills” can be seen. The second hill is in the time interval 4.07 s < t < 5.14 s . In the time interval 4.07 s < t < 4.5 s , the frequency increases from 0 to its highest value of f d = 1.4 kHz; thus, there is a positive slope of m p = 3.25 kHz/s. In the time interval 4.5 s < t < 5.14 s , the frequency decreased to 0 with a slope of m n = 2.18 kHz/s. The two other “hills” observed in the spectrogram, which look similar to those attributed to the right-hand tracker signal, are due to movement of the left hand.
The power due to shoulder and head movement is higher than the power due to right-hand movement, but their characteristics are different from those of the falling spectrogram. Therefore, head and shoulder movement during walking is not likely to cause an erroneous result for radar detection.

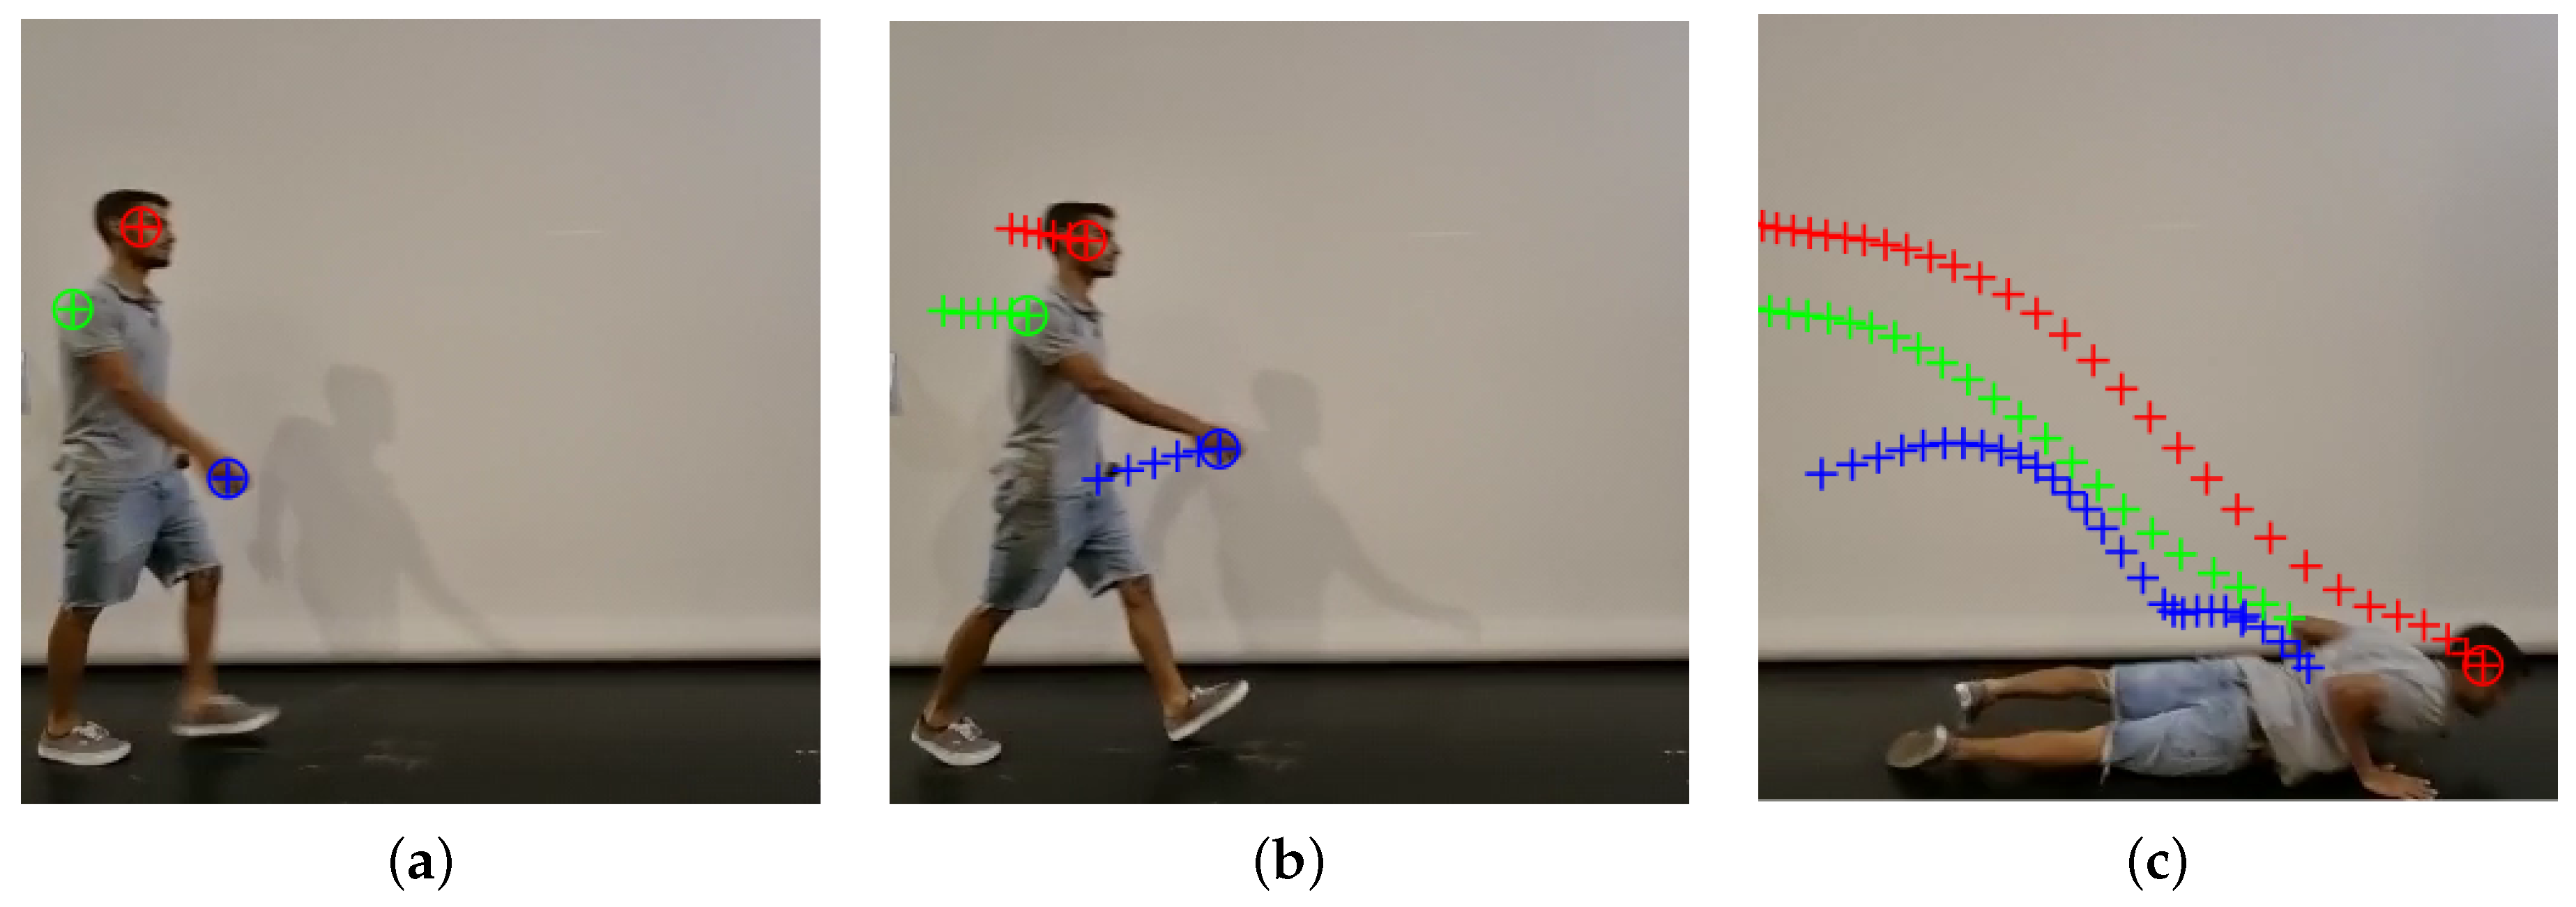
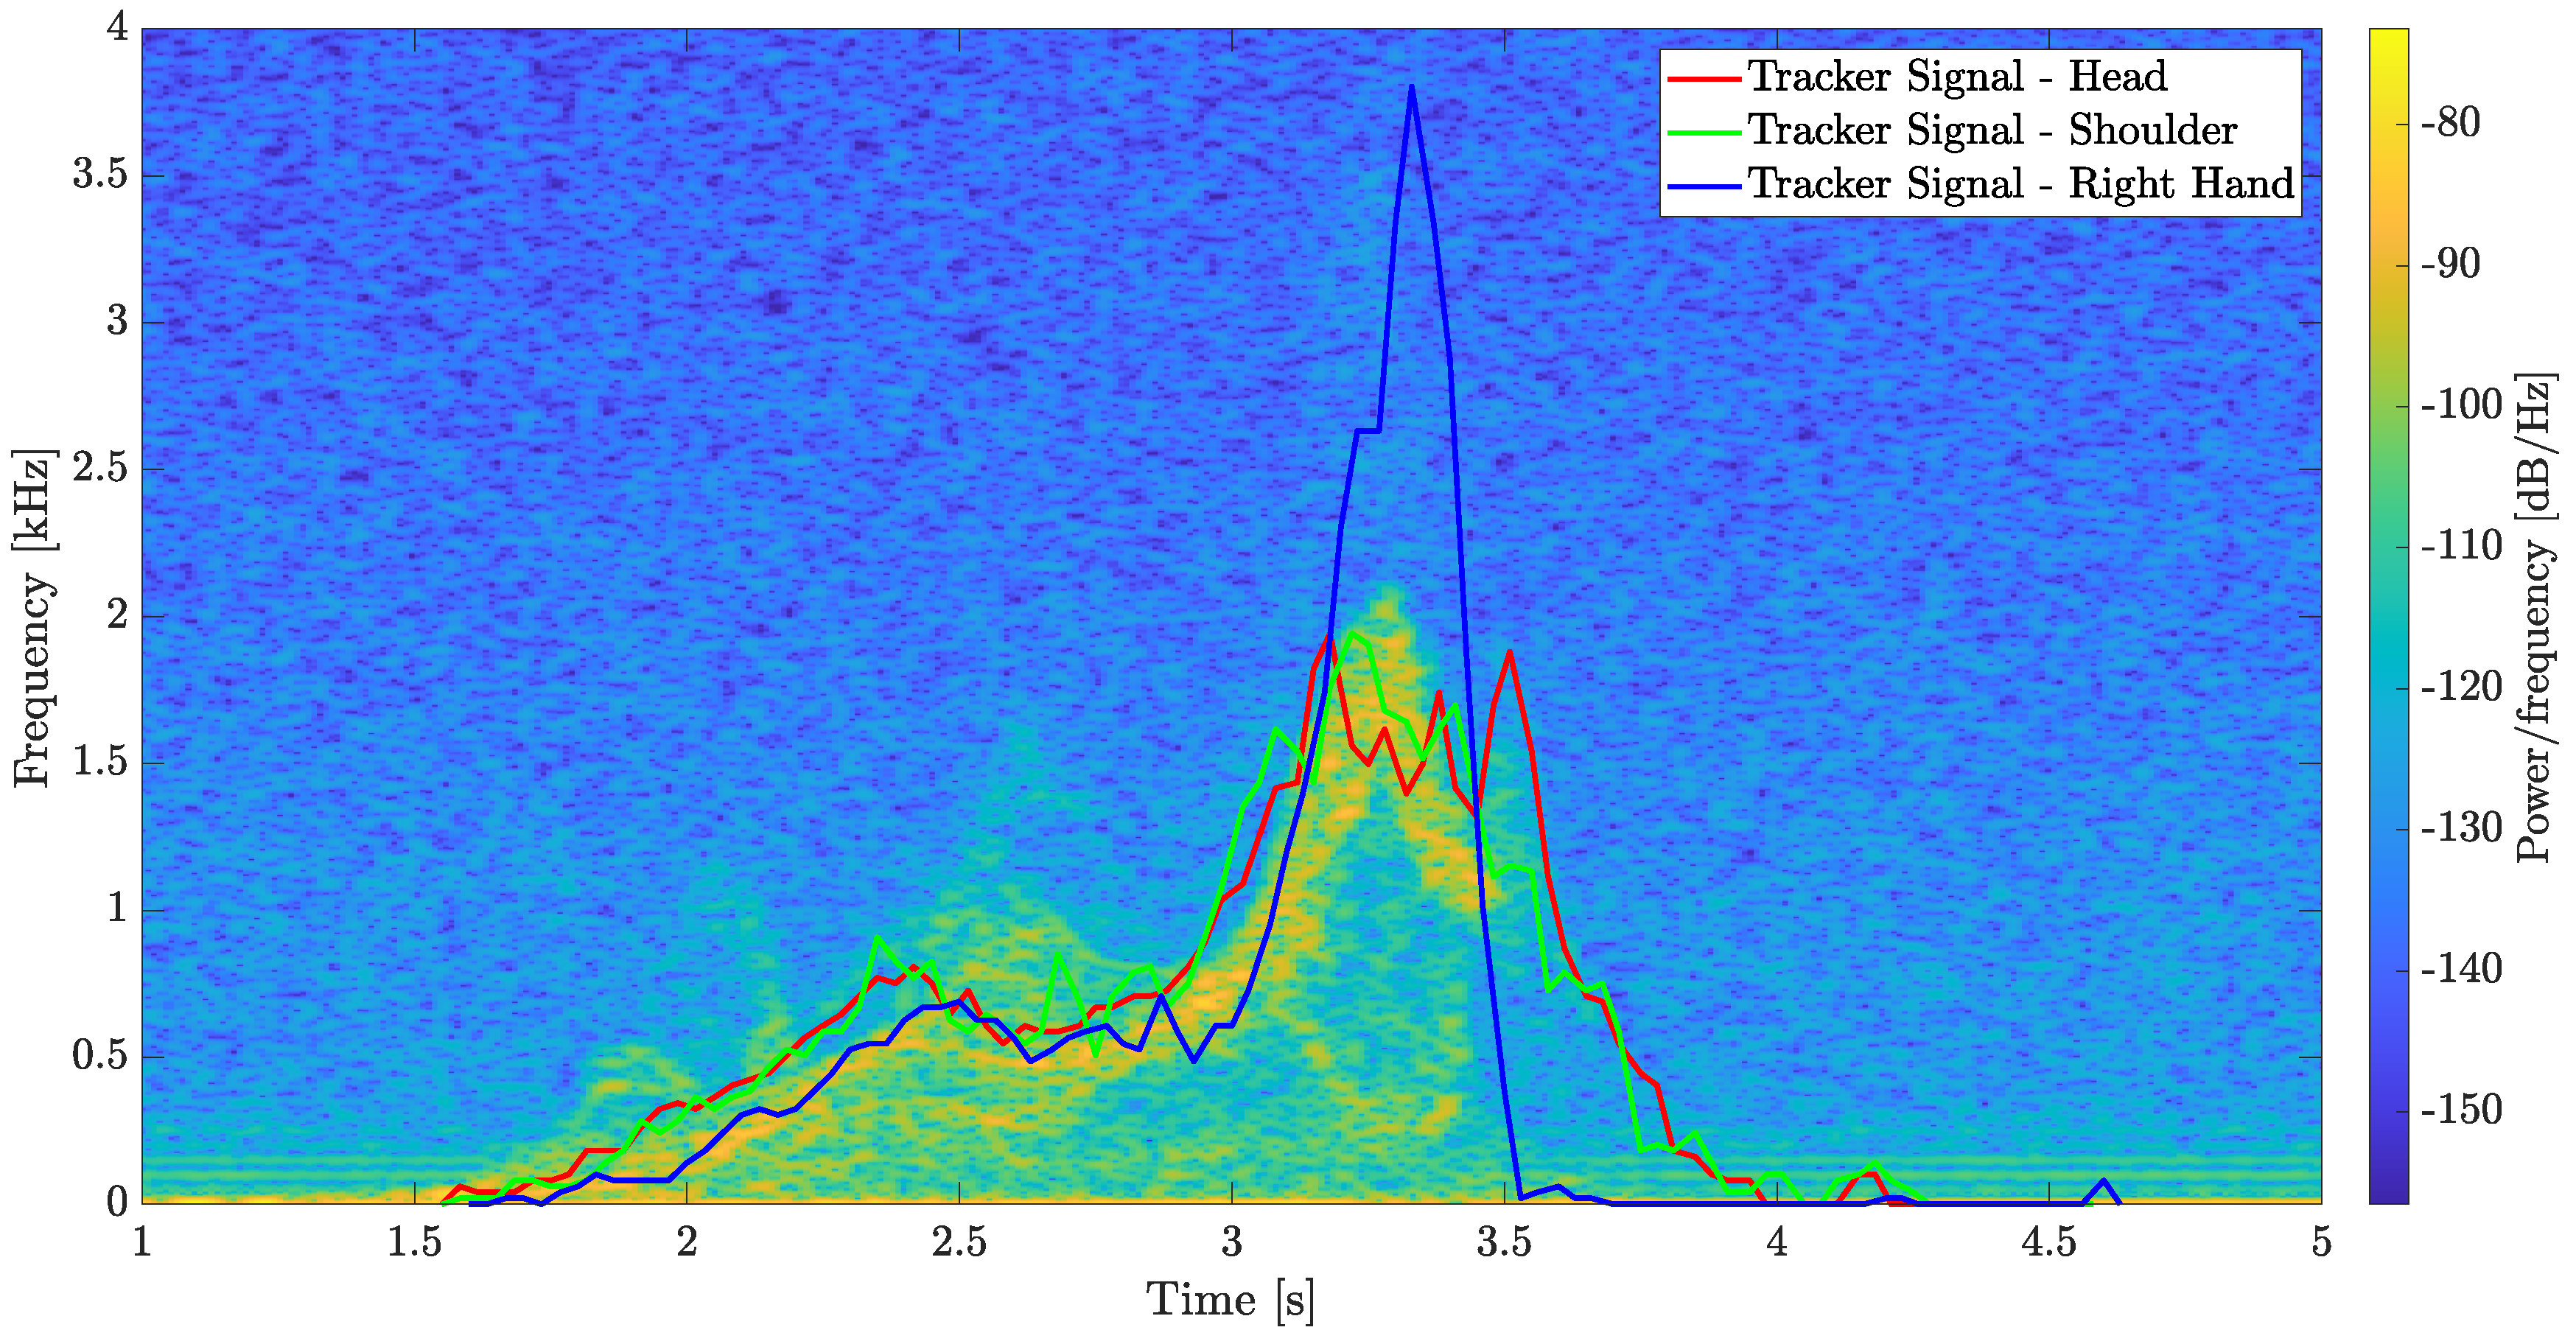
5.2.4. Falling while Walking Experiment

For the scenario of a person falling while walking, we measured the test subject’s spectral signature using the radar, as shown in Figure 6d. We also tracked the movement of the subject’s head, shoulder and right hand using video processing. Figure 13 shows three frames from the video of the person falling while walking; the red markers show the tracking of the head movement, the shoulder tracking is shown with green markers and right-hand tracking is shown with blue markers.
Figure 14 shows that the video analysis signals have the same shape as the signals in the spectrogram, but with a higher frequency value because of the video camera’s relatively low frame rate. The walking part of this motion is similar to the results of person when only walking, as discussed in Section 5.2.4. Therefore, only the fall time of this motion will be discussed in the following. In the falling time interval 2.608 s < t < 3.28 s , the frequency changed in the range 0.515 kHz < f d < 2.11 kHz , and the slope was m p = 2.37 kHz/s. Afterwards, in the time interval 3.28 s < t < 3.647 s , the Doppler frequency decreased to 0 with a slope of m n = 5.86 kHz/s.

5.2.5. Experimental Summary Results

Table 2 summarizes the results of the experiments. For each type of movement, the table shows the relevant times and their corresponding slopes. It is possible to see the characteristics of the falling movement and the features of the other movements that can disturb the effectiveness of radar application.The results shown are a typical adult target. The results depend on the characteristics of the target, such as height and age; see for example, [13]. Similar results were obtained from measurements of different heights of 150 cm to 190 cm, with up to 10% difference.
From Table 2, it can be seen that the slopes for the falling scenarios are significantly higher than those for the other movements. This suggests that the scenario of a falling person can be discerned with certainty using the MMW radar. An application condition could be defined as m n > 3.7 kHz/s—that is, when a movement occurs in which the negative slope meets this condition, a fall would be detected by the radar.

6. Conclusions

In this paper, we describe the development of an MMW- adar for application in fall detection. We examined four radar signals corresponding to four user movements: falling, sitting, walking and falling while walking. Using Matlab, STFT calculations were conducted on the received radar signals, yielding spectrograms with different spectral signatures for each type of movement. The experimental spectrogram results show that the negative slope for the falling movement was unique because of its high slope value. Therefore, a condition for detecting a falling person using the MMW radar could be implemented to send alerts when a user has fallen.
Moreover, we performed video processing simultaneously with the radar detection. We filmed the test subject’s movement by camera and then used the “Tracker” program to follow the movements of various body parts. The comparison results obtained from the two different modalities showed a high correlation.
Our MMW radar fall detection system operating at 94 GHz has several advantages over other tools in the current literature, allowing higher frequency resolution and more accurate results. It enables the utilization of small-aperture directive antennas, resulting in the possibility of developing smaller systems. It can perform in places where the atmosphere is not optimal for camera sensors. Finally, it does not simulate or infringe on privacy.

Author Contributions

Conceptualization, N.B.; methodology, N.B.; software, Y.B. and A.Y.; validation, Y.B. and A.Y.; formal analysis, Y.B. and A.Y.; investigation, Y.B. and A.Y.; resources, Y.B. and A.Y.; data curation, A.Y.; writing—original draft preparation, Y.B. and A.Y.; writing—review and editing, N.B.; visualization, Y.B.; supervision, N.B.; project administration, N.B. All authors have read and agreed to the published version of the manuscript.

Funding

This research received no external funding.

Data Availability Statement

Not applicable.

Conflicts of Interest

The authors declare no conflict of interest.

References

  1. Kinsella, K. Demographic dimensions of global aging. J. Fam. Issues 2000, 21, 541–558. [Google Scholar] [CrossRef]
  2. Kinsella, K.G.; Phillips, D.R. Global Aging: The Challenge of Success; Population Reference Bureau: Washington, DC, USA, 2005; Volume 60. [Google Scholar]
  3. Fuller, G.F. Falls in the elderly. Am. Fam. Physician 2000, 61, 2159. [Google Scholar] [PubMed]
  4. Debard, G.; Karsmakers, P.; Deschodt, M.; Vlaeyen, E.; Dejaeger, E.; Milisen, K.; Goedemé, T.; Vanrumste, B.; Tuytelaars, T. Camera-based fall detection on real world data. In Outdoor and Large-Scale Real-World Scene Analysis; Springer: Berlin/Heidelberg, Germany, 2012; pp. 356–375. [Google Scholar]
  5. Casilari, E.; Oviedo-Jiménez, M.A. Automatic fall detection system based on the combined use of a smartphone and a smartwatch. PLoS ONE 2015, 10, e0140929. [Google Scholar] [CrossRef] [PubMed]
  6. Muro-De-La-Herran, A.; Garcia-Zapirain, B.; Mendez-Zorrilla, A. Gait analysis methods: An overview of wearable and non-wearable systems, highlighting clinical applications. Sensors 2014, 14, 3362–3394. [Google Scholar] [CrossRef] [PubMed]
  7. Espinosa, R.; Ponce, H.; Gutiérrez, S.; Martínez-Villaseñor, L.; Brieva, J.; Moya-Albor, E. A vision-based approach for fall detection using multiple cameras and convolutional neural networks: A case study using the UP-Fall detection dataset. Comput. Biol. Med. 2019, 115, 103520. [Google Scholar] [CrossRef] [PubMed]
  8. Nadee, C.; Chamnongthai, K. Ultrasonic array sensors for monitoring of human fall detection. In Proceedings of the 2015 12th International Conference on Electrical Engineering/Electronics, Computer, Telecommunications and Information Technology (ECTI-CON), Hua Hin, Thailand, 24–27 June 2015; pp. 1–4. [Google Scholar]
  9. Tolkiehn, M.; Atallah, L.; Lo, B.; Yang, G.Z. Direction sensitive fall detection using a triaxial accelerometer and a barometric pressure sensor. In Proceedings of the 2011 Annual International Conference of the IEEE Engineering in Medicine and Biology Society, Boston, MA, USA, 30 August–3 September 2011; pp. 369–372. [Google Scholar]
  10. Okumura, N.; Yamanoi, Y.; Kato, R.; Yamamura, O. Fall detection and walking estimation using floor vibration for solitary elderly people. In Proceedings of the 2019 IEEE International Conference on Systems, Man and Cybernetics (SMC), Bari, Italy, 6–9 October 2019; pp. 1437–1442. [Google Scholar]
  11. Etinger, A.; Balal, N.; Litvak, B.; Einat, M.; Kapilevich, B.; Pinhasi, Y. Non-imaging MM-wave FMCW sensor for pedestrian detection. IEEE Sensors J. 2013, 14, 1232–1237. [Google Scholar] [CrossRef]
  12. Balal, N.; Balal, Y.; Richter, Y.; Pinhasi, Y. Detection of low RCS supersonic flying targets with a high-resolution MMW radar. Sensors 2020, 20, 3284. [Google Scholar] [CrossRef] [PubMed]
  13. Balal, Y.; Balal, N.; Richter, Y.; Pinhasi, Y. Time-Frequency Spectral Signature of Limb Movements and Height Estimation Using Micro-Doppler Millimeter-Wave Radar. Sensors 2020, 20, 4660. [Google Scholar] [CrossRef] [PubMed]
  14. Balal, N.; Richter, Y.; Pinhasi, Y. Identifying low-RCS targets using micro-Doppler high-resolution radar in the millimeter waves. In Proceedings of the 2020 14th European Conference on Antennas and Propagation (EuCAP), Copenhagen, Denmark, 15–20 March 2020; pp. 1–5. [Google Scholar]
  15. Yang, Y.; Hou, C.; Lang, Y.; Yue, G.; He, Y.; Xiang, W. Person identification using micro-Doppler signatures of human motions and UWB radar. IEEE Microw. Wirel. Components Lett. 2019, 29, 366–368. [Google Scholar] [CrossRef]
  16. Taylor, W.; Dashtipour, K.; Shah, S.A.; Hussain, A.; Abbasi, Q.H.; Imran, M.A. Radar sensing for activity classification in elderly people exploiting micro-doppler signatures using machine learning. Sensors 2021, 21, 3881. [Google Scholar] [CrossRef]
  17. Ahmad, F.; Amin, M.G.; Setlur, P. Through-the-wall target localization using dual-frequency CW radars. In Sensors, and Command, Control, Communications, and Intelligence (C3I) Technologies for Homeland Security and Homeland Defense V; SPIE: Orlando, FL, USA, 2006; Volume 6201, pp. 133–144. [Google Scholar]
Figure 2. Short-time Fourier transform (STFT) calculation: (a) chirp signal; (b) signal distribution for overlapping windows; (c) DFT of each windowed segment.
Applsci 12 08178 g002
Figure 3. Spectrograms calculated for different window lengths that are (a) too short; (b) optimal; (c) too long.
Applsci 12 08178 g003
Figure 4. Scheme of the CW micro-Doppler radar.
Applsci 12 08178 g004
Figure 5. IF signals received by the radar for the evaluated movements of a test subject: (a) falling; (b) sitting; (c) walking; (d) falling while walking.
Applsci 12 08178 g005
Figure 6. Spectrogram of the micro-Doppler frequencies for the evaluated movements of a test subject: (a) falling; (b) sitting; (c) walking; (d) falling while walking.
Applsci 12 08178 g006
Figure 7. Process for the video analysis of a falling man, tracking head motion: (a) standing; (b) falling; (c) lying down.
Applsci 12 08178 g007
Figure 8. Presentation of the measurement results for a falling man. The spectral signature was measured using the MMW radar, and the red line indicates the data obtained through head tracking in a recorded video.
Applsci 12 08178 g008
Figure 9. Process for the video analysis of a sitting man, tracking head motion: (a) standing; (b) sitting; (c) seated.
Applsci 12 08178 g009
Figure 10. Presentation of the measurement results for a sitting man. The spectral signature was measured using the MMW radar, and the red line indicates the data obtained through head tracking in a recorded video.
Applsci 12 08178 g010
Figure 11. Process for the video analysis of a walking man, tracking motion of the head (red markers), shoulder (green markers) and right hand (blue markers) (a) at the beginning of walking; (b) during walking, hand forward; (c) during walking, hand backward.
Applsci 12 08178 g011
Figure 12. Presentation of the measurement results for a walking man. The spectral signature was measured using the MMW radar, and the colored lines indicate the data obtained through tracking the subject’s head, shoulder and right hand in a recorded video.
Applsci 12 08178 g012
Figure 13. Video analysis process of a man falling while walking, tracking motion of the head (red markers), shoulder (green markers) and right hand (blue markers) (a) at the beginning of walking; (b) during walking, hand forward; (c) lying down.
Applsci 12 08178 g013
Figure 14. Presentation of the measurement results for a man falling while walking. The spectral signature was measured using the MMW radar, and the colored lines indicate the data obtained through tracking the subject’s head, shoulder and right hand in a recorded video.
Applsci 12 08178 g014
Table 1. Comparison of fall detection systems.
Type of SensingCostAlgorithm TypeMotion ClassificationDisadvantagesImaging
Wearable sensors-3D accelerometercheapThreshold-basedNot classifiedHigh false rate, no remote sensingNot imaging
Camera-based sensingmediumDetection based on human skeleton, falling angle vertical projectionClassifiedHigh computing resources to process data continuously, not portable, limited sensing areaImaging
Radar-based sensingmediumMicro-Doppler time-frequency analyzeClassifiedlimited sensing areaNot imaging
Table 2. Movement characteristics.
Movement Type m p (kHz/s) T p (s) m n (kHz/s) T n (s)
Falling1.0421.5353.7640.425
Sitting0.8680.810.8
Walking3.250.432.180.64
Falling while walking2.370.6725.860.367
Publisher’s Note: MDPI stays neutral with regard to jurisdictional claims in published maps and institutional affiliations.

