Abstract
To study the influence of near-fault and far-field (FF) ground motions on a curved girder bridge, a 1:10 scale curved bridge shaking table test model was constructed. Three types of ground motions, namely, near-fault pulse (NP), near-fault non-pulse (NN), and FF ground motions, were selected and employed in the test model. The test results indicated that the seismic response of the curved bridge in the excitation of NP ground motion is significantly higher than that in the excitation of NN and FF ground motions, and is destructive to the curved bridge. The displacement of the curved bridge has spatial characteristics in the excitation of NP ground motions. The rotation generated by the curved bridge is easy to cause bearing shedding or girder falling at the low pier. The amplification of pier height increases the displacement response at the high pier.
1. Introduction
A number of investigations have indicated that near-fault earthquakes around the world have brought heavy losses to human life and property. Many earthquakes show that near-fault earthquakes have a great impact on the response of building structures, such as the Los Angeles Northridge earthquake in the USA in 1994, the Hyogo-Ken Nanbu earthquake in Japan in 1995, and the Chi-Chi earthquake in Taiwan in 1999, all of which caused great disasters and losses; consequently, near-fault earthquakes have attracted the attention of many scholars [1,2,3]. In many near-fault earthquakes, near-fault pulse (NP) ground motions have a significant velocity pulse and capacity for destruction, which result in the damage of building structures [4,5,6,7].
To study the characteristics of near-fault earthquakes, researchers have artificially synthesized NP ground motions. For example, Ghahari et al. [8] synthesized NP seismic waves from long-period pulse and high-frequency non-pulse components by using the moving average filtering method. The effectiveness of the method was verified using the wavelet method, and it was applied to the seismic response analysis of engineering structures. Jian et al. [9] synthesized near-fault ground motions with local pulse characteristics by using the S transform method, which proved that the synthesized near-fault ground motions agree well with the parent ground motions and code for the seismic design of buildings in China. Pitarka et al. [10] synthesized near-fault ground motions by using the hybrid Green’s function, which can reflect the source, wave path, and local site, and verified the effectiveness of the method by comparing the empirical formulas with the recorded ground motions. Amiri et al. [11] used the continuous wavelet transform to extract the pulse component and generated the non-pulse component through the wavelet-based nonstationary model. Lastly, the discrete wavelet transform was used to reconstruct the two components to synthesize NP ground motions, which were compared with actual records to verify the accuracy of the method.
Many researchers have used numerical analyses to study the seismic performance of bridges, analyzed the influence laws of near-fault and far-field (FF) ground motions, and achieved considerable research results. For instance, Li et al. [12] analyzed a simply supported bridge with finite element software. The results showed that the bearing is more likely to be damaged in the excitation of NP ground motions, and the impact of NP ground motions on the bridge pier displacement is more significant than that of FF ground motions. Cai et al. [13] established a new composite tall pier bridge model by using midas Civil 2019 finite element software and found that the seismic performances of the new composite bridge for NP ground motion were significantly smaller than those of traditional bridges, indicating better seismic resilience. Mohseni et al. [14] established a reinforced arch bridge finite element model, discussed the seismic response characteristics for near-fault and FF ground motions, and determined that the response of the bridge structure was greater under NP ground motion. Li et al. [15] conducted a numerical analysis on a super-span cable-stayed bridge and found that a near-fault earthquake was highly unfavorable to the structure, especially the high-frequency components of NP ground motion. Zheng et al. [16] established an asymmetrical suspension bridge model and found that NP ground motion is considerably unfavorable to the structure.
With the improvement of shaking table equipment and experimental technology, many scholars have carried out experimental research on the seismic performance of bridges under near-fault earthquakes. Specifically, Sideris et al. [17] established a novel segmental single-span simply supported beam bridge model with a scale of 1:2.39 and analyzed the structural response characteristics under near-fault and FF ground motions. They found that structural displacement increases significantly in the excitation of near-fault ground motion, and vertical seismic action is obvious. Liu et al. [18] analyzed the seismic characteristics of a long-span steel box arch bridge for near-fault spatial seismic excitation by a shaking table test. The study showed that the structural response is significantly affected by the spatial change in near-fault ground motions and should be taken seriously. Chen et al. [19] analyzed the seismic response law of a tall pier bridge in the excitation of NP ground motions with different pulse periods and numbers through shaking table tests. They determined that the seismic fragility of the pier is correlated with pulse period and pier height, while the pulse number is not obvious. Xie et al. [20] established a soil–cable-stayed bridge model with a similarity ratio of 1:70, analyzed the structural response characteristics in the excitation of near-fault and FF ground motions, and compared the model with numerical methods. They found that NP ground motions can increase the structural displacement and the failure probability of the bridge tower. Lin et al. [21] established a 1/10-scale model of three-span steel–concrete composite rigid-frame bridge and carried out a series of shaking table experiments. They identified that NP ground motions can increase structural response, and numerical analysis proved that the steel–concrete composite rigid-frame bridge has enhanced seismic performance. Jiao et al. [22] established a 1:25 curved bridge collision model, analyzed the collision characteristics of the curved bridge under NP, near-fault non-pulse (NN), and FF ground motions, and found that the collision response under NP ground motions was more significant and more unfavorable to the curved bridge.
According to the above literature, the seismic response of bridges is greatly affected by near-fault and FF ground motions. At present, most studies on curved bridges with longitudinal slopes used numerical analyses. Thus, the authors conduct a shaking table test on a 5% longitudinal slope curved bridge with a ratio of 1:10. The main purpose of this paper is to study the seismic performance of continuous curved bridges in excitations of near-fault and FF ground motions by analyzing the dynamic characteristics, mid-span displacement, pier displacement, beam end displacement, and bearing deformation; the results can provide some guidance and data reference for the seismic analysis of curved bridges.
2. Design of Shaking Table Test Model
2.1. Overview of the Prototype Bridge
The research object is a continuous curved bridge with three spans; each span is 40 m, and the longitudinal slope is 5%. The radius of curvature is 50 m. The main girder is composed of a single-box, two-chamber reinforced concrete girder, which uses concrete with a strength of C50. The girder height is 2 m, the girder bottom width is 7.5 m, the flange width is 2.25 m, and the web height is 1.55 m (Figure 1a). The substructure consists of four double-column piers, the pier heights are 15, 17, 19, and 21 m, and the pier diameter is 1.5 m. The pier top is equipped with a cap beam, which uses concrete with a strength of C30 and the elastic modulus is 3.45 × 10⁴ MPa. The reinforcement rate of the longitudinal reinforcement is 3.554%, and the reinforcement rate of the stirrup is 2.264%.
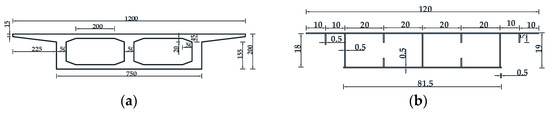
Figure 1.
Section parameters of main girder (unit: cm): (a) Girder dimensions of the reinforced concrete girder; (b) Girder dimensions of the steel girder.
2.2. Design of Similarity Ratio
In accordance with the principle of structural similarity [23] and in consideration of the output capacity (maximum acceleration, 1.5 g) and size (1 × 1 m) of the shaking table, the scale of the curved bridge model is regarded as 1:10 and the equivalent mass density is set to 2. To make the test model comparable to the prototype bridge, the shaking table model is made of the same materials as the prototype; i.e., the material properties are regarded as 1, which can ensure the consistency between the shaking table model and the prototype, and both will be destroyed at the same time. When the shaking table model is damaged, the prototype bridge will also be damaged. On the basis of the known similar parameters, the similar parameters of other physics can be determined. Table 1 shows the similarity relationship between each physical quantity.

Table 1.
Similarity relation of the curve bridge test model.
2.3. Design of the Curved Bridge Test Model
In previous earthquakes, the main girder was rarely damaged and usually showed rigidity, so a steel girder was used instead of an RC girder (Figure 1b). Owing to the quality difference between the two materials, artificial mass is used; i.e., a total of 4.3 tons of artificial mass is arranged in the shaking table model. The piers are double-column piers, which achieve a 5% longitudinal slope of the curved bridge by setting different pier heights. The piers are numbered from pier 1 to pier 4, are arranged symmetrically, and their heights are 1.5, 1.7, 1.9, and 2.1 m (Figure 2a). The longitudinal reinforcement and stirrup adopt the same reinforcement ratio as the prototype structure: the longitudinal reinforcement adopts an HRB335-grade reinforcement with a diameter of 10 mm, the spiral stirrup adopts an R235-grade reinforcement with a diameter of 6 mm, and the spacing between the stirrups is 5 cm. The 28-day average compressive strength of concrete material is determined to be 35.16 MPa. Pier 2 is installed with fixed pot bearings (GPZ(II)0.8MN-GD), and the other piers are installed with sliding pot bearings (GPZ(II)0.8MN-DX). The parameter of the bearings is shown in Figure 3. To prevent the impact of concrete cracking between the concrete platform and the shaking table caused by vibration on the test results, the concrete platform is fixed on the shaking table with channel steel and h bolts (Figure 4e). The installed curved bridge shaking table model is shown in Figure 4a.
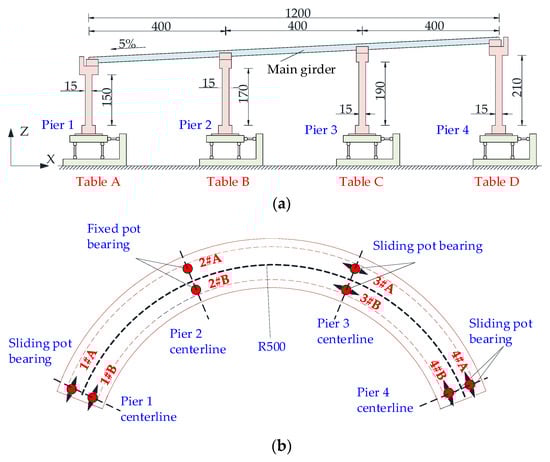
Figure 2.
Layout of the bridge model (Unit: cm): (a) Side view; (b) Plan view.
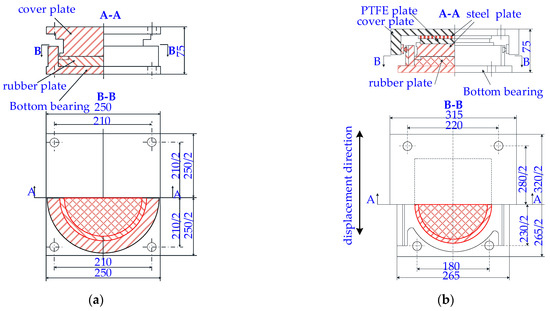
Figure 3.
Details of bearing parameters (unit: mm): (a) Fixed pot bearing; (b) Sliding pot bearing.
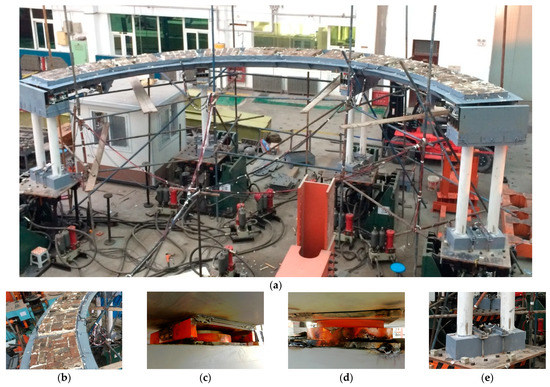
Figure 4.
Photograph for curved bridge test model: (a) Assembled bridge model; (b) Artificial masses; (c) Sliding pot bearing; (d) Fixed pot bearing; (e) Piers fixed to the shaking table.
3. Design of Shaking Table Tests
3.1. Sensor Arrangement
This test is carried out using a shaking table array system, and the test instruments mainly include acceleration (measuring range, ±5 g; accuracy, 0.01 g), displacement (measuring range, ±200 mm, accuracy, 0.4 mm), and pull-wire displacement (measuring range, 0~500 mm, accuracy, 0.01 mm) sensors. The acceleration and displacement sensors are arranged at the fulcrum and mid-span of the main girder, as well as the roof and bottom of the pier, to record the acceleration and displacement at the crucial positions of the main girder and piers. The bridge model is equipped with 16 acceleration and 16 displacement sensors, and 6 pull-wire displacement meters are arranged at the unidirectional sliding pot bearings to record the deformation of the bearings. The signals of all sensors are collected using an IMC dynamic system with a sampling frequency of 1000 Hz.
3.2. Selection of Seismic Waves
NP seismic waves characteristically have significant velocity pulses and high amplitudes, which are significantly destructive to building structures. To avoid different seismic mechanisms affecting the analysis’ results, seismic waves in the same earthquake are selected from the PEER ground motion database [24]. The Taiwan Chi-Chi earthquake in 1999, with a magnitude of Mw = 7.6, was located on a north–south directional thrust fault. The source was on the east side of the Chelongpu fault, creating an 80 km surface rupture zone. A total of 21 seismic waves in three groups of NP, NN, and FF ground motions are selected from the Chi-Chi earthquake as test seismic waves. The parameters of selected seismic waves are presented in Table 2. Figure 5 shows the time histories of typical NP, NN, and FF seismic waves, for which the NF seismic records have significant velocity pulses.
Table 2.
Parameters of selected seismic waves.
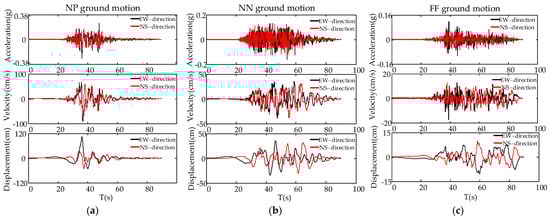
Figure 5.
Time histories of typical seismic waves: (a) TCU102; (b) TCU106; (c) CHY065.
To analyze the spectral characteristics of near-fault and FF ground motions, the acceleration response spectrum of selected seismic waves is calculated, and the curves of the acceleration response spectrum in each group are obtained. Given two mutually perpendicular components in seismic waves, the acceleration spectra of EW and NS component seismic waves are provided in Figure 6. For the EW component, the acceleration response spectrum of NF seismic waves has the largest spectral value, and the FF seismic waves have the smallest spectral value. For the NS component, when the period value of the system is greater than 1.1 s, the acceleration spectrum of NP seismic waves is the largest. NP seismic waves have obvious long-period characteristics.
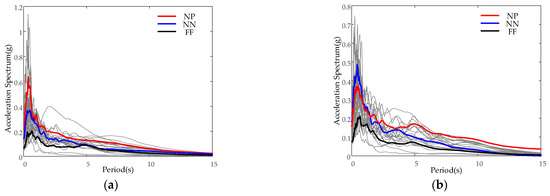
Figure 6.
Acceleration spectrum of selected g seismic waves. (a) Acceleration response spectrum of the EW component; (b) Acceleration response spectrum of the NS component.
3.3. Design of Test Cases
The prototype bridge is assumed to be located in a site category of class II, a seismic fortification intensity of degree VII. The China Seismic Design Code JTG/T B 02-01-2008 [25] stipulates that the PGA is 0.1 g. The seismic records contain two mutually perpendicular components. In accordance with the similar relationship in Table 1, the EW component is scaled to 0.5 g. Meanwhile, the NS component is scaled according to the actual ratio of the two components. The influence of the input direction of the seismic wave on the structure response is also considered. In Case 1, when the connecting direction of the two abutments is the same as the EW-direction, XP and XP + YS are used to represent unidirectional and bidirectional seismic inputs, respectively. In Case 2, when the connecting direction of the two abutments is the same as the NS-direction, YP and XS + YP are used to represent unidirectional and bidirectional seismic inputs, respectively.
4. Test Results
4.1. Dynamic Characteristic Analysis
White noise from 0.1 Hz to 50 Hz is input along the Xp-direction and Yp-direction in the curved bridge test model, and stochastic subspace identification is used to identify the dynamic characteristics of the curved bridge model. Figure 7 shows that the first four-order modal information of the bridge model is identified, and the first fourth-order frequencies are 2.55, 3.31, 5.70, and 13.52 Hz, respectively. The first-order mode shape of the bridge model is that the full bridge moves in the connection direction of the two abutments, the second- and fourth-order mode shapes are transversely symmetric with the axis of symmetry, and the third-order mode shape is transversely antisymmetric vibration. In addition, there were no obvious cracks and damages in the bridge model during the test, and no significant changes in the dynamic characteristics, indicating that the cumulative damage of the structure was small, and it is still in the elastic stage, which has little influence on the seismic performance of the structure.
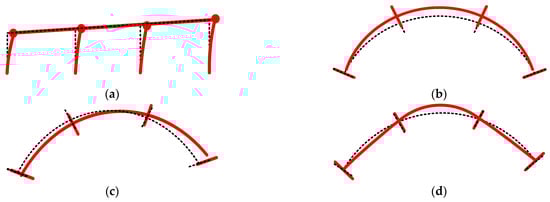
Figure 7.
Mode shapes of the shaking table test model: (a) First mode, f1 = 2.55 Hz; (b) Second mode, f2 = 3.31 Hz; (c) First mode, f3 = 5.70 Hz; (d) First mode, f4 = 13.52 Hz.
4.2. Displacement of Mid-Span
Figure 8 shows the mid-span displacement of the curved bridge in the excitation of near-fault and FF ground motions. When the connecting direction of the two abutments is the same as the EW-direction, the second span produces the largest mid-span displacement in the excitation of XP, while the third span has the smallest mid-span displacement. Given that fixed pot bearings are arranged at pier 2, the curved bridge rotates in the plane while moving horizontally, and the seismic force increases the displacement at the first mid-span through the fixed pot bearings. The mid-span displacement of the curved bridge in the excitation of NP and NN ground motions increases by 82.4% (tangential displacement) and 22.8% (radial displacement) compared with that in the excitation of FF ground motions. When the NP ground motion is excited by XP + YS, the tangential mid-span displacement is significant in the first span. Meanwhile, under the NN and FF ground motions, the displacement is larger in the third span. This result indicates that the bidirectional seismic excitation of NP seismic records stimulates the in-plane rotations of the bridge model. The mid-span displacement of the curved bridge for NP and NN ground motions increases by 135.6% (tangential displacement) and 17.9% (tangential displacement) compared with that for FF ground motions.
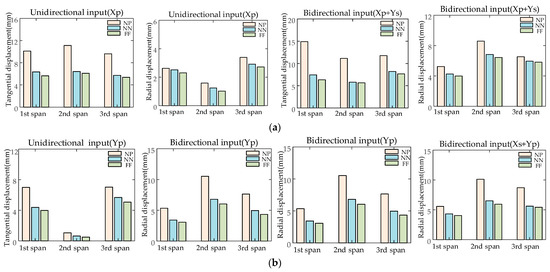
Figure 8.
Mid-span displacement response in the excitation of near-fault and FF ground motions: (a) Mid-span displacement response in case 1; (b) Mid-span displacement response in case 2.
When the connecting direction of the two abutments is the same as the NS-direction, the mid-span displacements of the third span in the excitation of YP and XS + YP are larger than those of the first span. The seismic input in the transverse bridge direction (Y-direction) makes the curved bridge mainly move horizontally, resulting in a smaller plane rotation. Compared with the mid-span displacement of the curved bridge for FF ground motions, the mid-span displacement in the excitation of YP is increased by 112.9% and 29.6% (tangential displacement) for NP and NN ground motions, respectively; in the excitation of XS + YP, the mid-span displacement increases by 90.6% and 17.1% (tangential displacement), respectively.
When the connecting direction of the two abutments is the same as the EW-direction, the motion state of the main girder has a spatial effect due to the excitation of ground motions. In the excitation of XP, the curved bridge generates rotation in the plane; in the excitation of XP + YS, especially the NP ground motion excitation, the curved bridge rotation in the plane can also be stimulated. When the connecting direction of the two abutments is the same as the NS-direction, the whole curved bridge is mainly translational, indicating that the motion state of the main girder is related to the excitation mode of the seismic waves. The mid-span displacement in the excitation of NP and NN ground motions increases significantly. Particularly, it increases the most in the excitation of NP ground motions, implying that the NP ground motions are more destructive.
4.3. Displacement of Beam End
Given that the tops of piers 1, 3, and 4 are installed with a unidirectional sliding pot bearing, the bearing only produces tangential relative displacement, so the tangential displacement of the beam end is discussed in this part. Table 3 shows the beam end displacement of the curved bridge in the excitation of near-fault and FF ground motions. The beam end displacement is the largest in the excitation of NP ground motions and the smallest in the excitation of FF ground motions.
Table 3.
Peak value of beam end displacement (mm).
When the connecting direction of the two abutments is the same as the EW-direction, due to the rotation of the curved bridge in the excitation of XP, the first beam end has a large displacement. The beam end displacement in the excitation of NP and NN ground motions is 1.85 and 1.02 times that in the excitation of FF ground motions, respectively. In the excitation of XP + YS, the curved bridge rotates significantly in the excitation of NP ground motions, resulting in a large displacement at the first beam end. In the excitation of NF and FF ground motions, the displacement of the fourth beam end is significant. The displacement of beam end in the excitation of NP and NN ground motions is 2.26 and 1.18 times that in the excitation of FF ground motions, respectively.
When the connecting direction of the two abutments is the same as the NS-direction, the curved bridge produces a small rotation in the plane, and the whole bridge model is mainly translational. Owing to the amplification effect of pier height, the beam end displacement at pier 4 is increased. In the excitation of YP, the beam end displacement for NP and NN ground motions is 1.76 and 1.10 times that for FF ground motions. In the excitation of XS + YP, the beam end displacement for NP and NN ground motions is 1.62 and 1.12 times that under FF ground motions, respectively.
The analysis shows that the motion state of the curved bridge affects its beam end displacement. Owing to the rotation generated by the curved bridge, the beam end of the curved bridge produces a large displacement at the lower pier, which increases the risk of the beam falling and a collision between the beam end and abutment. Anti-falling and anti-collision measures should be taken to reduce the damage caused by NP ground motions on curved bridges.
4.4. Deformation of Bearing
Figure 9 illustrates that the bearing deformation in the excitation of NP ground motions is the largest. When the connecting direction of the two abutments is the same as the EW-direction (Figure 9a), the rotation generated by the curved bridge in the excitation of XP makes the bearing deformation of pier 1 larger. Compared with FF ground motions, NP and NN ground motions increase by 185.5% and 18.0%, respectively. In the excitation of XP + YS, the bearing deformation of pier 1 is the largest under NP ground motion excitation, while the bearing deformation is the largest at pier 4 under NF and FF ground motion excitation. The reason is that the curved bridge rotates under the XP + YS excitation of NP ground motions, and it mainly moves within the plane under the excitation of NN and FF ground motions. Compared with FF ground motion excitation, NP and NN ground motion excitations increase by 140.1% and 20.7%, respectively.
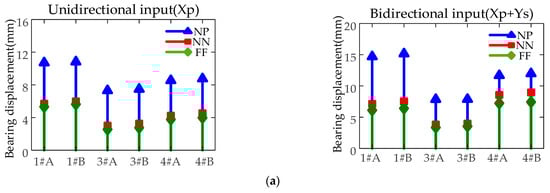
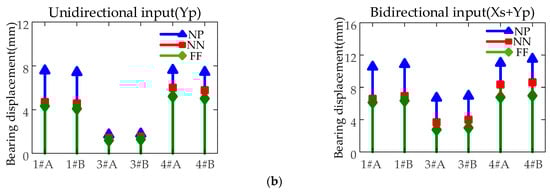
Figure 9.
Bearing deformation: (a) Bearing deformation in case 1; (b) Bearing deformation in case 2.
When the connecting direction of the two abutments is the same as the NS-direction (Figure 9b), the curved bridge is mainly translational. The higher the pier is, the greater the amplifying effect of bearing deformation is, resulting in the maximum bearing deformation at pier 4. Compared with FF ground motion excitation, NP and NN seismic records increase by 81.0% and 20.4%, respectively, under unidirectional seismic excitation and by 142.0% and 33.8%, respectively, under bidirectional seismic excitation.
In summary, bearing deformation is closely related to the motion state of the curved bridge. Owing to the rotation of the curved bridge, the bearings at the lower pier produce a large deformation, which increases the risk of bearing shedding.
4.5. Displacement of Pier
As illustrated in Figure 10, the pier of the curved bridge has the largest displacement under NP ground motion excitation and the smallest displacement under FF ground motion excitation. The pier displacement under unidirectional excitation (XP) of NP and NN ground motions is 1.83 and 1.19 times that of FF ground motions, respectively. Meanwhile, the pier displacement under bidirectional seismic excitation (XP + YS) of NP and NN ground motions is 2.39 and 1.15 times that of FF ground motions, respectively. The pier displacement under unidirectional excitation (YP) of NP and NN ground motions is 1.75 and 1.16 times that of FF ground motions, respectively. The pier displacement under bidirectional seismic excitation (XS + YP) of NP and NN ground motions is 2.39 and 1.15 times that of FF ground motions, respectively.
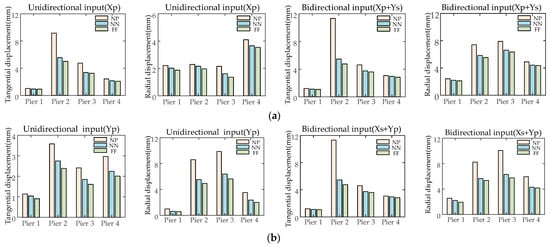
Figure 10.
Pier displacement response: (a) Pier displacement in case 1; (b) Pier displacement in case 2.
Piers 1 to 4 are symmetrically distributed. The height of pier 4 is higher than that of pier 1, and as a result the seismic response at pier 1 is less than that at pier 4. The stiffness of the double-column pier in the radial direction is relatively large, and a fixed pot bearing is installed on pier 2. Hence, the pier and the main girder move synchronously. Most of the seismic force of the main girder is transferred to the pier to make the tangential displacement most significant at pier 2.
In summary, the pier displacement is more significant under NP ground motion excitation, which has a certain amplification effect. Regardless of the relationship between the seismic input direction and the curved bridge, the tangential displacement of the fixed pier is significant, while the radial displacement of the pier is related to the pier height.
5. Conclusions
This work was devoted to studying the seismic performance of a curved bridge shaking table test model in the excitation of near-fault and FF ground motions. A 1/10 scale bridge model was established, and three types of ground motions were used to conduct shaking table tests. The following conclusions were drawn:
- (1).
- The seismic performance of the curved bridge is more significant under NP ground motion excitation, which is more destructive than that under FF ground motion excitation. Therefore, paying attention to the impact of NP ground motions on curved bridges in seismic design is necessary.
- (2).
- The displacement of the curved bridge has spatial characteristics. The curved bridge moves horizontally and rotates in the plane at the same time in unidirectional seismic excitation(XP). NP ground motions in bidirectional excitations (XP + YS) are easy to excite the rotation effect of curved bridges.
- (3).
- The displacement of the beam end and the bearing is significantly affected by the motion state of the curved bridge. The in-plane rotations of the curved bridge likely stimulate the displacement of the beam end and the bearing at the lower pier, which increases the risk of girder unseating and bearing shedding.
- (4).
- The fixed piers produce large tangential displacements under seismic action, are considerably sensitive to seismic action, are detrimental to the structure, and should be paid attention to. The height of piers has a certain amplification effect on the pier displacement, and a larger displacement is more likely to occur at the higher pier.
Author Contributions
Writing—original draft, P.S.; methodology, X.Z.; investigation, Y.C.; supervision, B.X. and B.Z. All authors have read and agreed to the published version of the manuscript.
Funding
This research was supported by the Beijing Natural Science Foundation (8224087) and Central Public-interest Scientific Institution Basal Research Fund (CEAIEF20220206, CEAIEF2022030100). The support is gratefully acknowledged.
Conflicts of Interest
The authors declare no conflict of interest.
References
- Guo, W.; Gao, X.; Hu, P.; Hu, Y.; Zhai, Z.; Bu, D.; Jiang, L. Seismic damage features of high-speed railway simply supported bridge–track system under near-fault earthquake. Adv. Struct. Eng. 2020, 23, 1573–1586. [Google Scholar] [CrossRef]
- Zhou, Y.G.; Xia, P.; Ling, D.S.; Chen, Y.M. A liquefaction case study of gently sloping gravelly soil deposits in the near-fault region of the 2008 M(w)7.9 Wenchuan earthquake. Bull. Earthq. Eng. 2020, 18, 6181–6201. [Google Scholar] [CrossRef]
- Pai, C.H.; Tien, Y.M.; Teng, T.L. A study of the human-fatality rate in near-fault regions using the Victim Attribute Database. Nat. Hazards 2007, 42, 19–35. [Google Scholar] [CrossRef]
- Zhang, J.; Wei, K.; Pang, Y.; Zhang, M.; Qin, S. Numerical Investigation into Hydrodynamic Effects on the Seismic Response of Complex Hollow Bridge Pier Submerged in Reservoir: Case Study. J. Bridge Eng. 2019, 24, 05018016.05018011–05018016.05018013. [Google Scholar] [CrossRef]
- Yazdani, Y.; Alembagheri, M. Seismic vulnerability of gravity dams in near-fault areas. Soil Dyn. Earthq. Eng. 2017, 102, 15–24. [Google Scholar] [CrossRef]
- Liao, W.I.; Loh, C.H.; Wan, S. Earthquake responses of RC moment frames subjected to near-fault ground motions. Struct. Des. Tall Build. 2001, 10, 219–229. [Google Scholar] [CrossRef]
- Akkar, S.; Yazgan, U.; Gulkan, P. Drift estimates in frame buildings subjected to near-fault ground motions. J. Struct. Eng. ASCE 2005, 131, 1014–1024. [Google Scholar] [CrossRef]
- Ghahari, S.F.; Jahankhah, H.; Ghannad, M.A. Study on elastic response of structures to near-fault ground motions through record decomposition. Soil Dyn. Earthq. Eng. 2010, 30, 536–546. [Google Scholar] [CrossRef]
- Jian, F.; Ping, D. Simulation of artificial near-fault ground motions based on the S-transform. In Proceedings of the Cisp 2008: First International Congress on Image and Signal Processing, Sanya, China, 27–30 May 2008; Volume 5, pp. 518–522. [Google Scholar]
- Pitarka, A.; Somerville, P.; Fukushima, Y.; Uetake, T.; Irikura, K. Simulation of near-fault strong-ground motion using hybrid Green’s functions. Bull. Seismol. Soc. Am. 2000, 90, 566–586. [Google Scholar] [CrossRef] [Green Version]
- Amiri, G.G.; Rad, A.A.; Hazaveh, N.K. Wavelet-Based Method for Generating Nonstationary Artificial Pulse-Like Near-Fault Ground Motions. Comput. Aided Civ. Infrastruct. Eng. 2014, 29, 758–770. [Google Scholar] [CrossRef]
- Li, X.L.; Dou, H.J. Study on seismic safety for simple-supported bridge subjected to near-fault earthquake ground motions. Prog. Saf. Sci. Technol. Parts A B 2005, 5, 1501–1506. [Google Scholar]
- Cai, Z.; Wang, Z.; Lin, K.; Sun, Y.; Zhuo, W. Seismic Behavior of a Bridge with New Composite Tall Piers under Near-Fault Ground Motion Conditions. Appl. Sci. 2020, 10, 7377. [Google Scholar] [CrossRef]
- Mohseni, I.; Lashkariani, H.A.; Kang, J.; Kang, T.H.K. Dynamic Response Evaluation of Long-Span Reinforced Arch Bridges Subjected to Near- and Far-Field Ground Motions. Appl. Sci. 2018, 8, 1243. [Google Scholar] [CrossRef] [Green Version]
- Shuai, L.; Fan, Z.; Jing-quan, W.; Alam, M.S.; Jian, Z. Effects of Near-Fault Motions and Artificial Pulse-Type Ground Motions on Super-Span Cable-Stayed Bridge Systems. J. Bridge Eng. 2017, 22, 04016128. [Google Scholar] [CrossRef]
- Zheng, S.-x.; Shi, X.-h.; Jia, H.-y.; Zhao, C.-h.; Qu, H.-l.; Shi, X.-l. Seismic response analysis of long-span and asymmetrical suspension bridges subjected to near-fault ground motion. Eng. Fail. Anal. 2020, 115, 104615. [Google Scholar] [CrossRef]
- Sideris, P.; Aref, A.J.; Filiatrault, A. Experimental Seismic Performance of a Hybrid Sliding-Rocking Bridge for Various Specimen Configurations and Seismic Loading Conditions. J. Bridge Eng. 2015, 20, 04015009. [Google Scholar] [CrossRef]
- Liu, Z.; Zhang, S. Influence of strong spatially varying near fault ground motion on steel box arch bridge. Bull. Earthq. Eng. 2021, 19, 5439–5469. [Google Scholar] [CrossRef]
- Chen, X.; Xiang, N.; Li, J.; Guan, Z. Influence of Near-fault Pulse-like Motion Characteristics on Seismic Performance of Tall Pier Bridges with Fragility Analysis. J. Earthq. Eng. Eng. Vib. 2020, 3, 2001–2022. [Google Scholar] [CrossRef]
- Xie, W.; Sun, L. Experimental and numerical investigations on transverse seismic responses of soil-cable-stayed-bridge system subjected to transverse near-fault ground motions. Eng. Struct. 2021, 226, 111361. [Google Scholar] [CrossRef]
- Lin, Y.; Bi, K.; Zong, Z.; Hao, H.; Lin, J.; Chen, Y. Seismic Performance of Steel-Concrete Composite Rigid-Frame Bridge: Shake Table Test and Numerical Simulation. J. Bridge Eng. 2020, 25, 04020032. [Google Scholar] [CrossRef]
- Jiao, C.; Liu, W.; Wu, S.; Gui, X.; Huang, J.; Long, P.; Li, W. Shake table experimental study of curved bridges with consideration of girder-to-girder collision. Eng. Struct. 2021, 237, 112216. [Google Scholar] [CrossRef]
- Wang, T.W. Structural Testing of Civil Engineering; Wuhan University of Technology Press: Wuhan, China, 2006. [Google Scholar]
- PEER. Pacific Earthquake Engineering Center. Available online: http://ngawest2.berkeley.edu (accessed on 18 March 2022).
- JTG/T B02-01-2008; Guidelines for Seismic Design of Highway Bridges. People’s Transportation Press: Beijing, China, 2008.
Publisher’s Note: MDPI stays neutral with regard to jurisdictional claims in published maps and institutional affiliations. |
© 2022 by the authors. Licensee MDPI, Basel, Switzerland. This article is an open access article distributed under the terms and conditions of the Creative Commons Attribution (CC BY) license (https://creativecommons.org/licenses/by/4.0/).