
Experimental Study on the Impact Dynamics of Cylindrical Baffles with a Rigid Barrier against Debris Flows

Abstract
:1. Introduction
2. Methods
2.1. Scaling
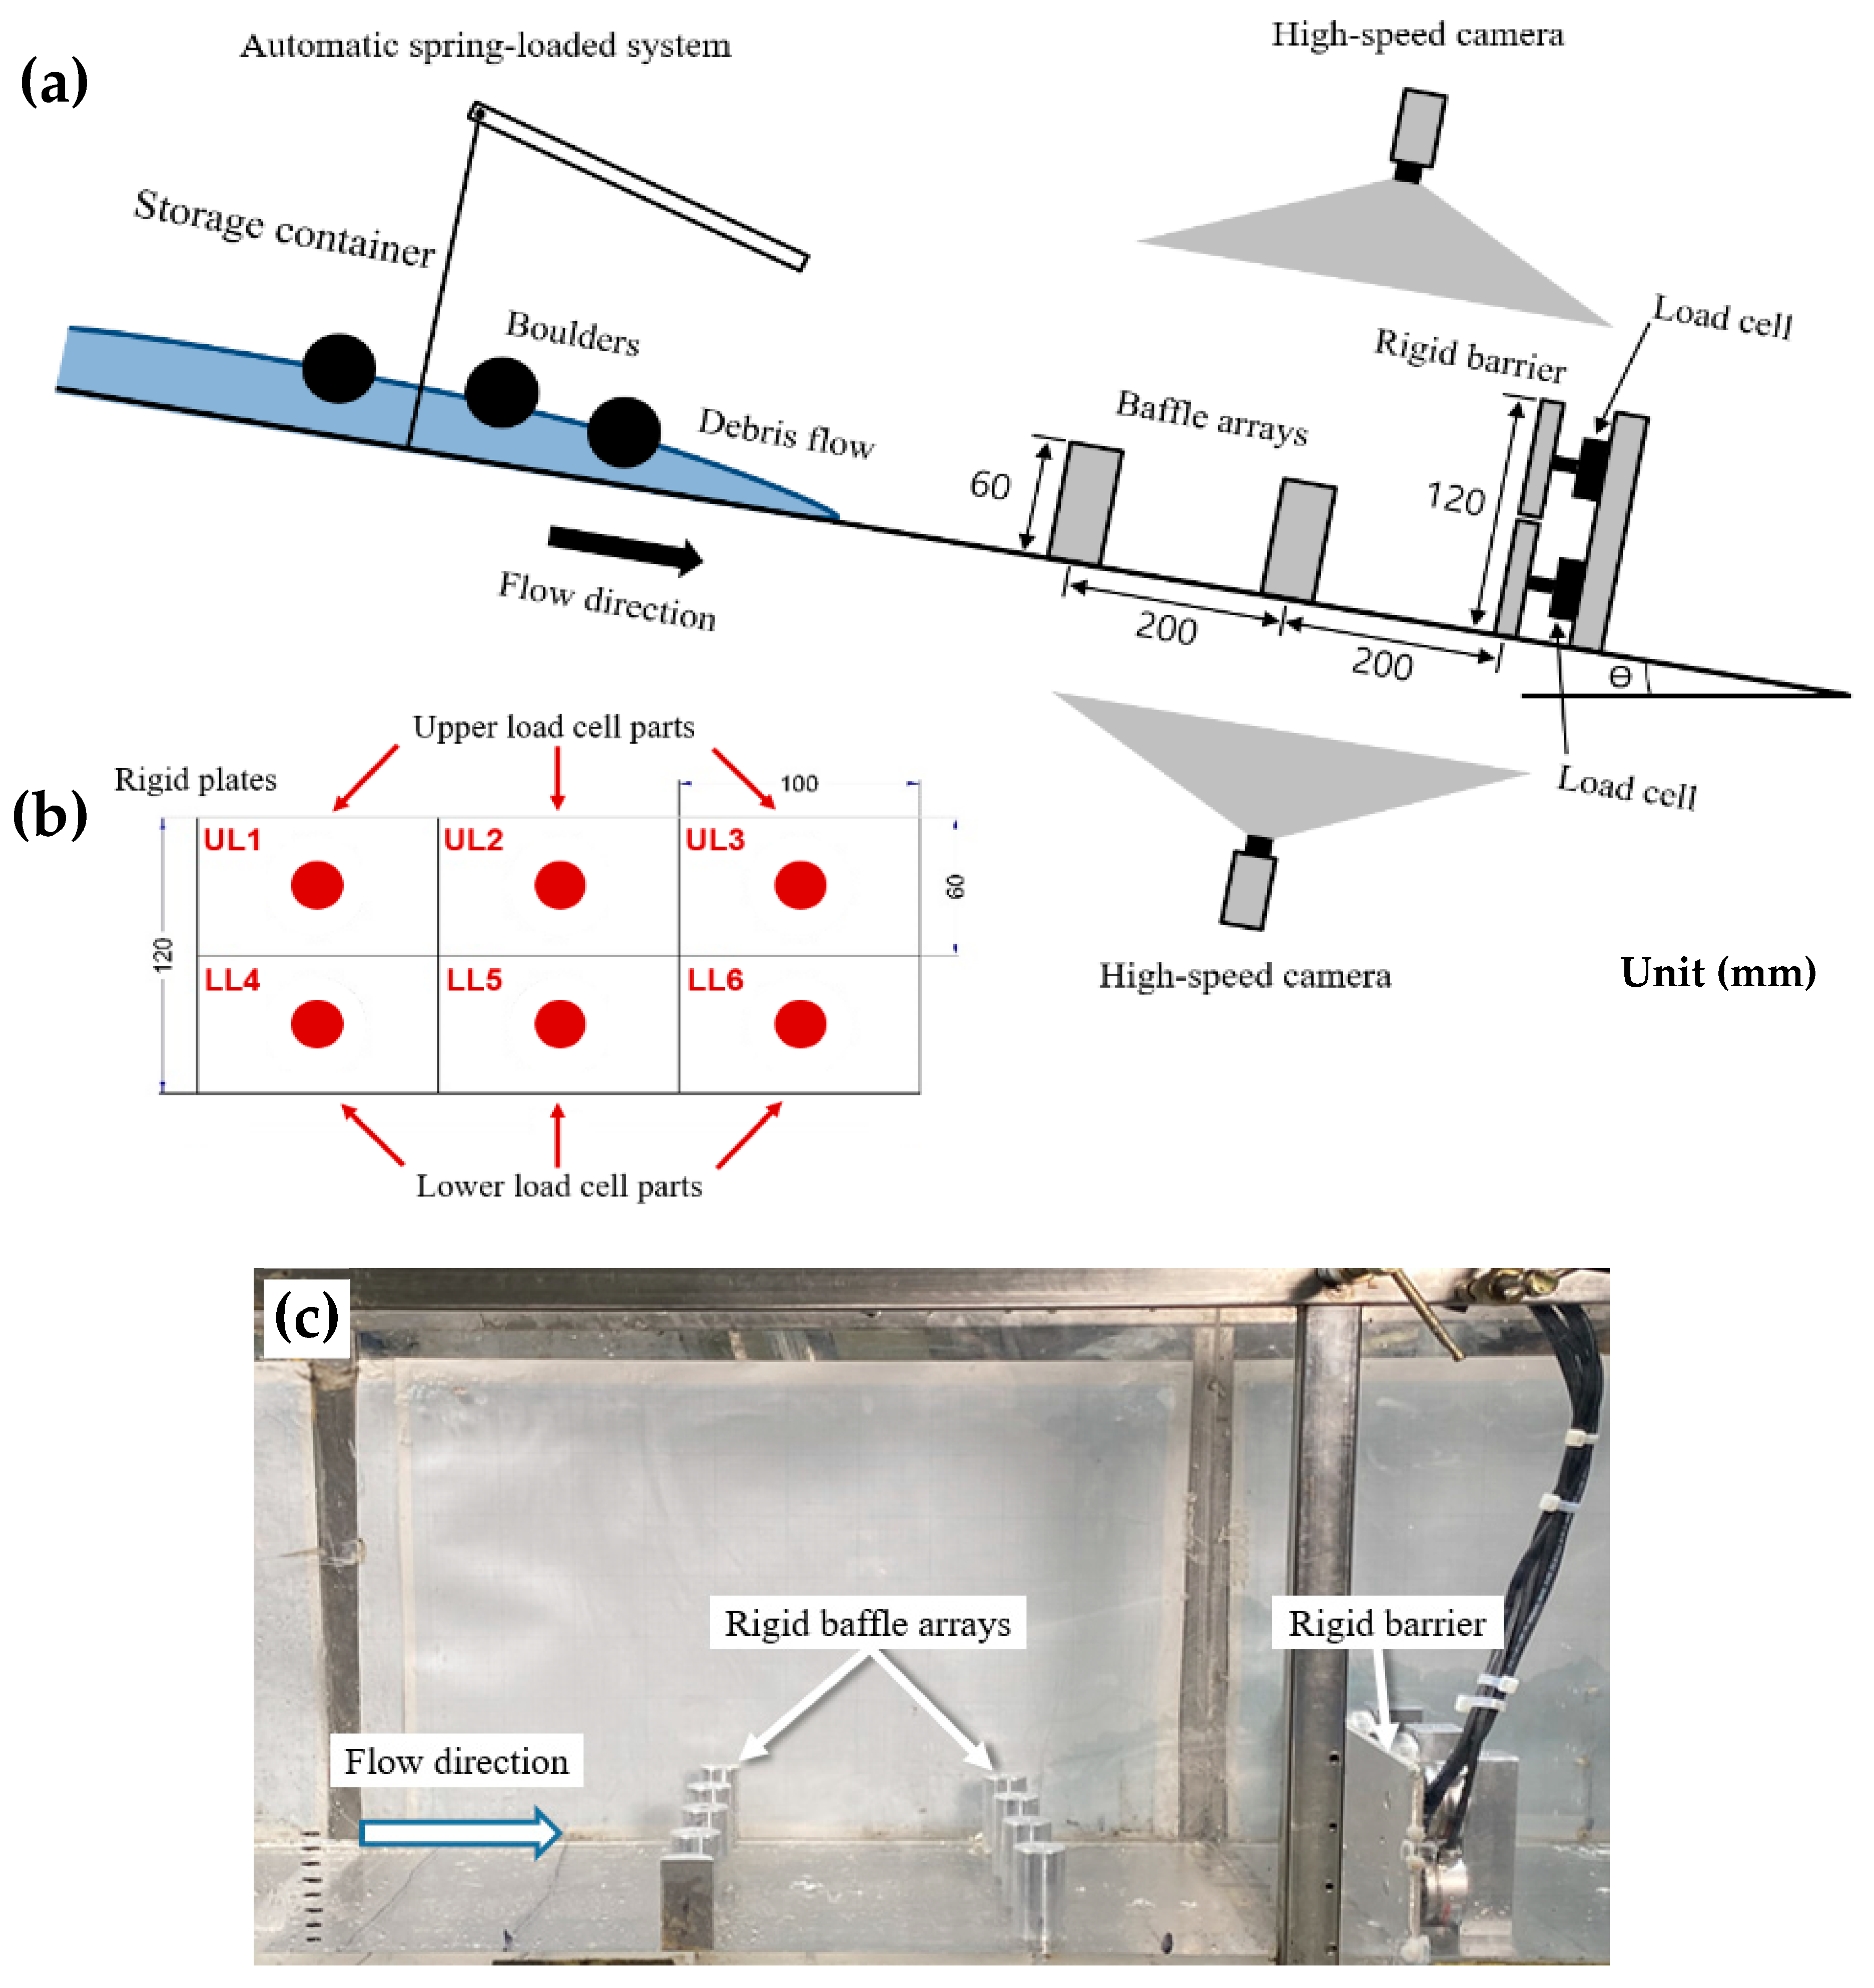
2.2. Flume Model
2.3. Test Conditions and Procedure
3. Results
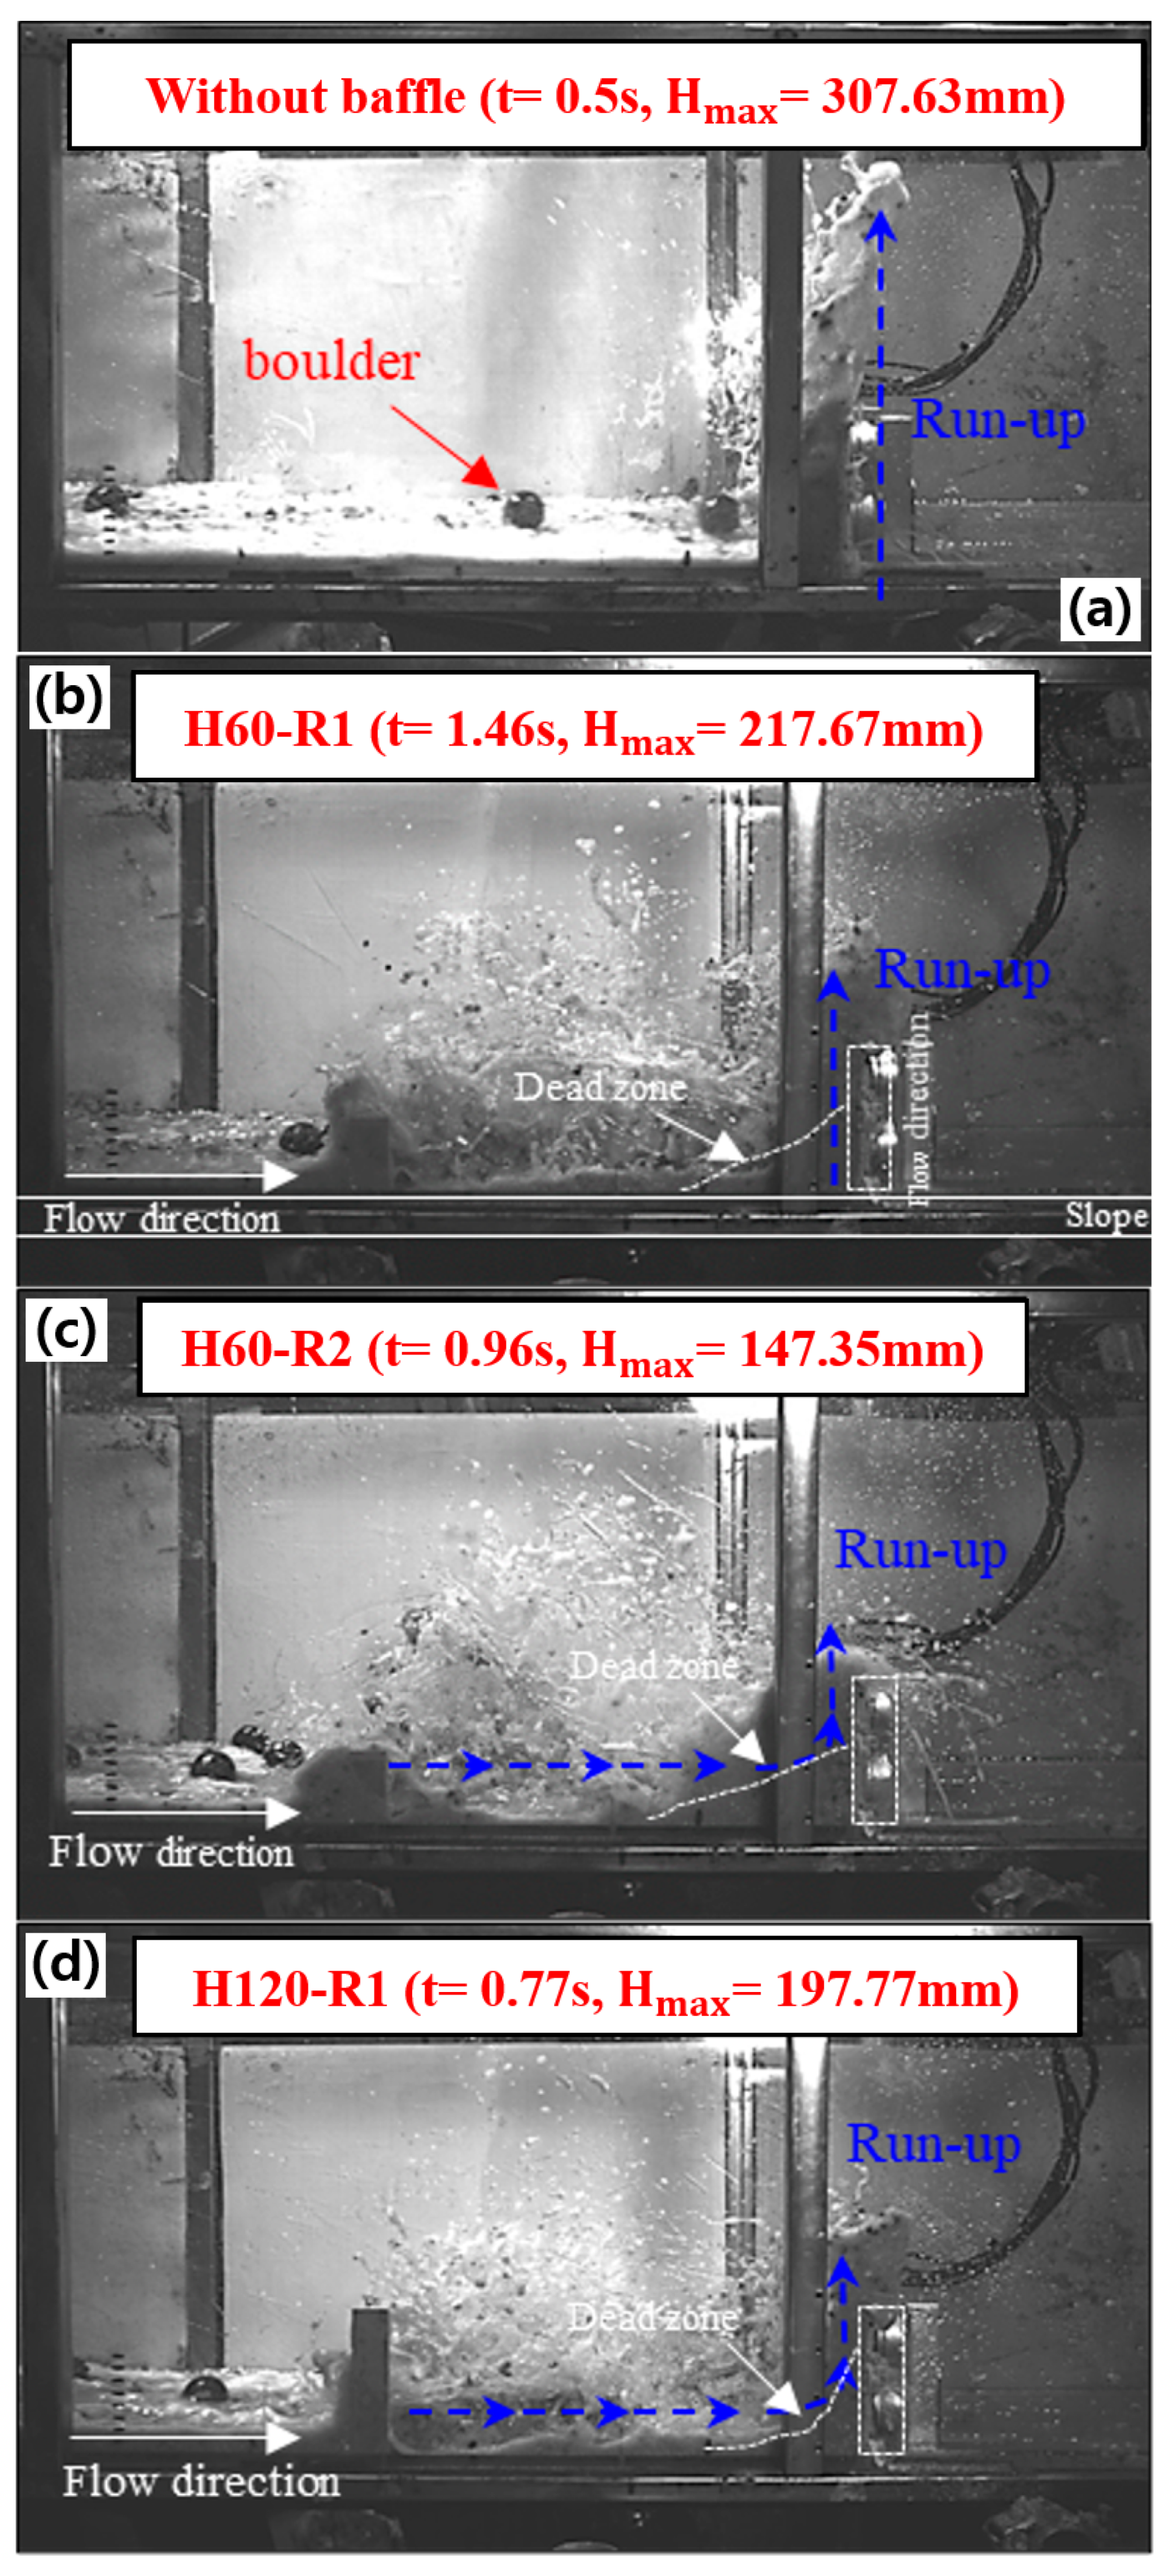
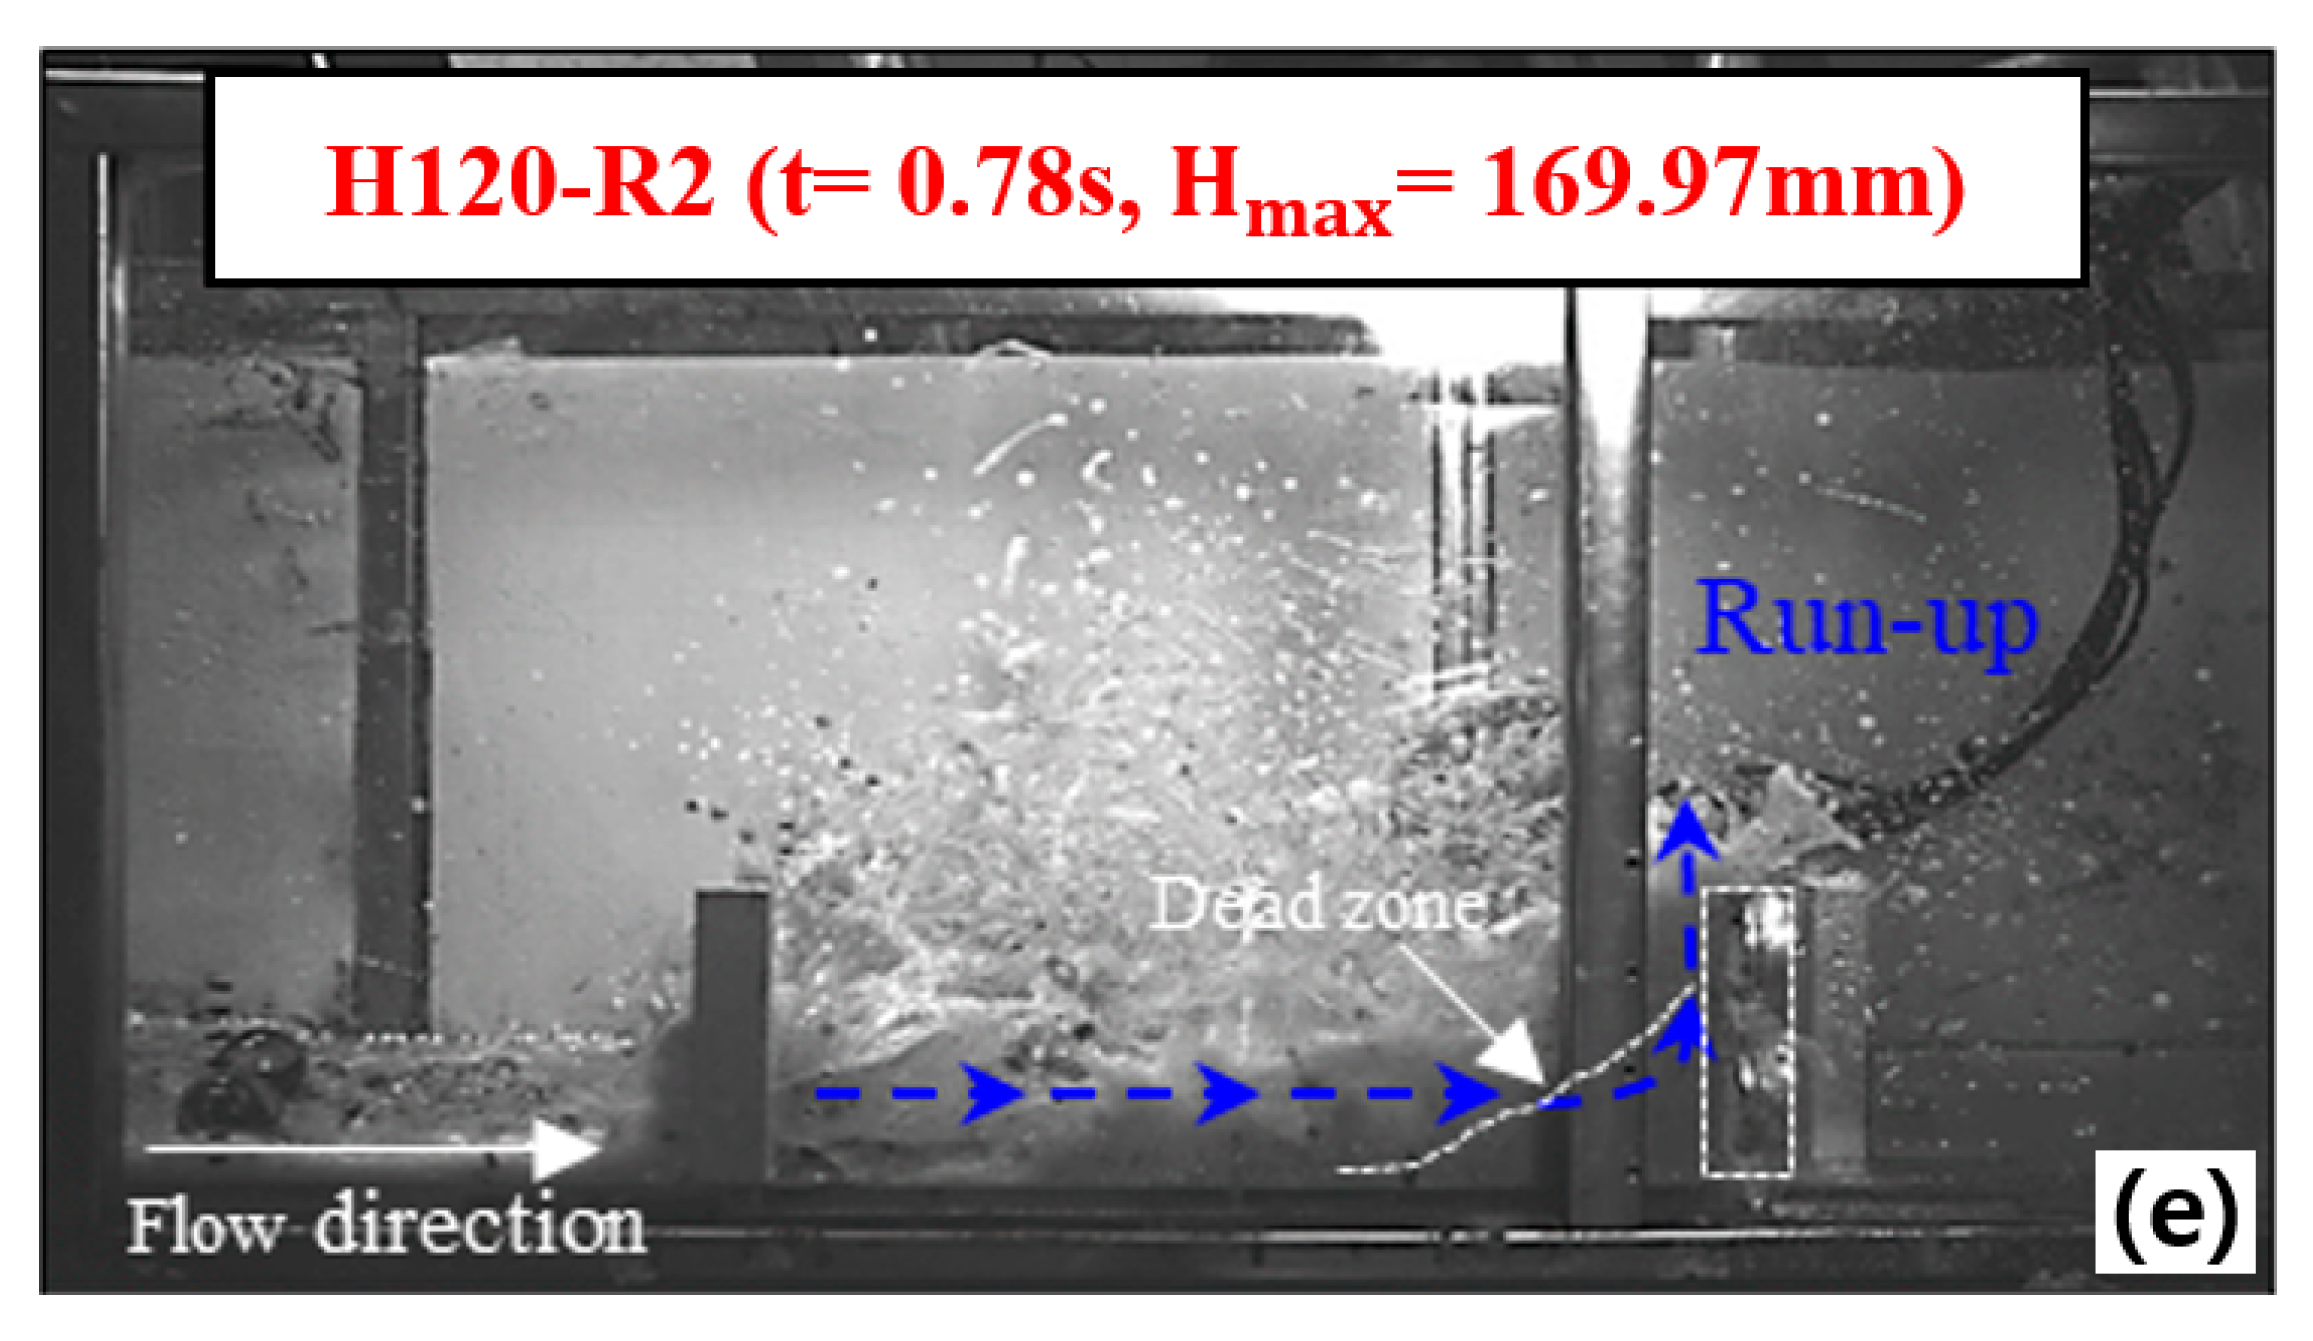
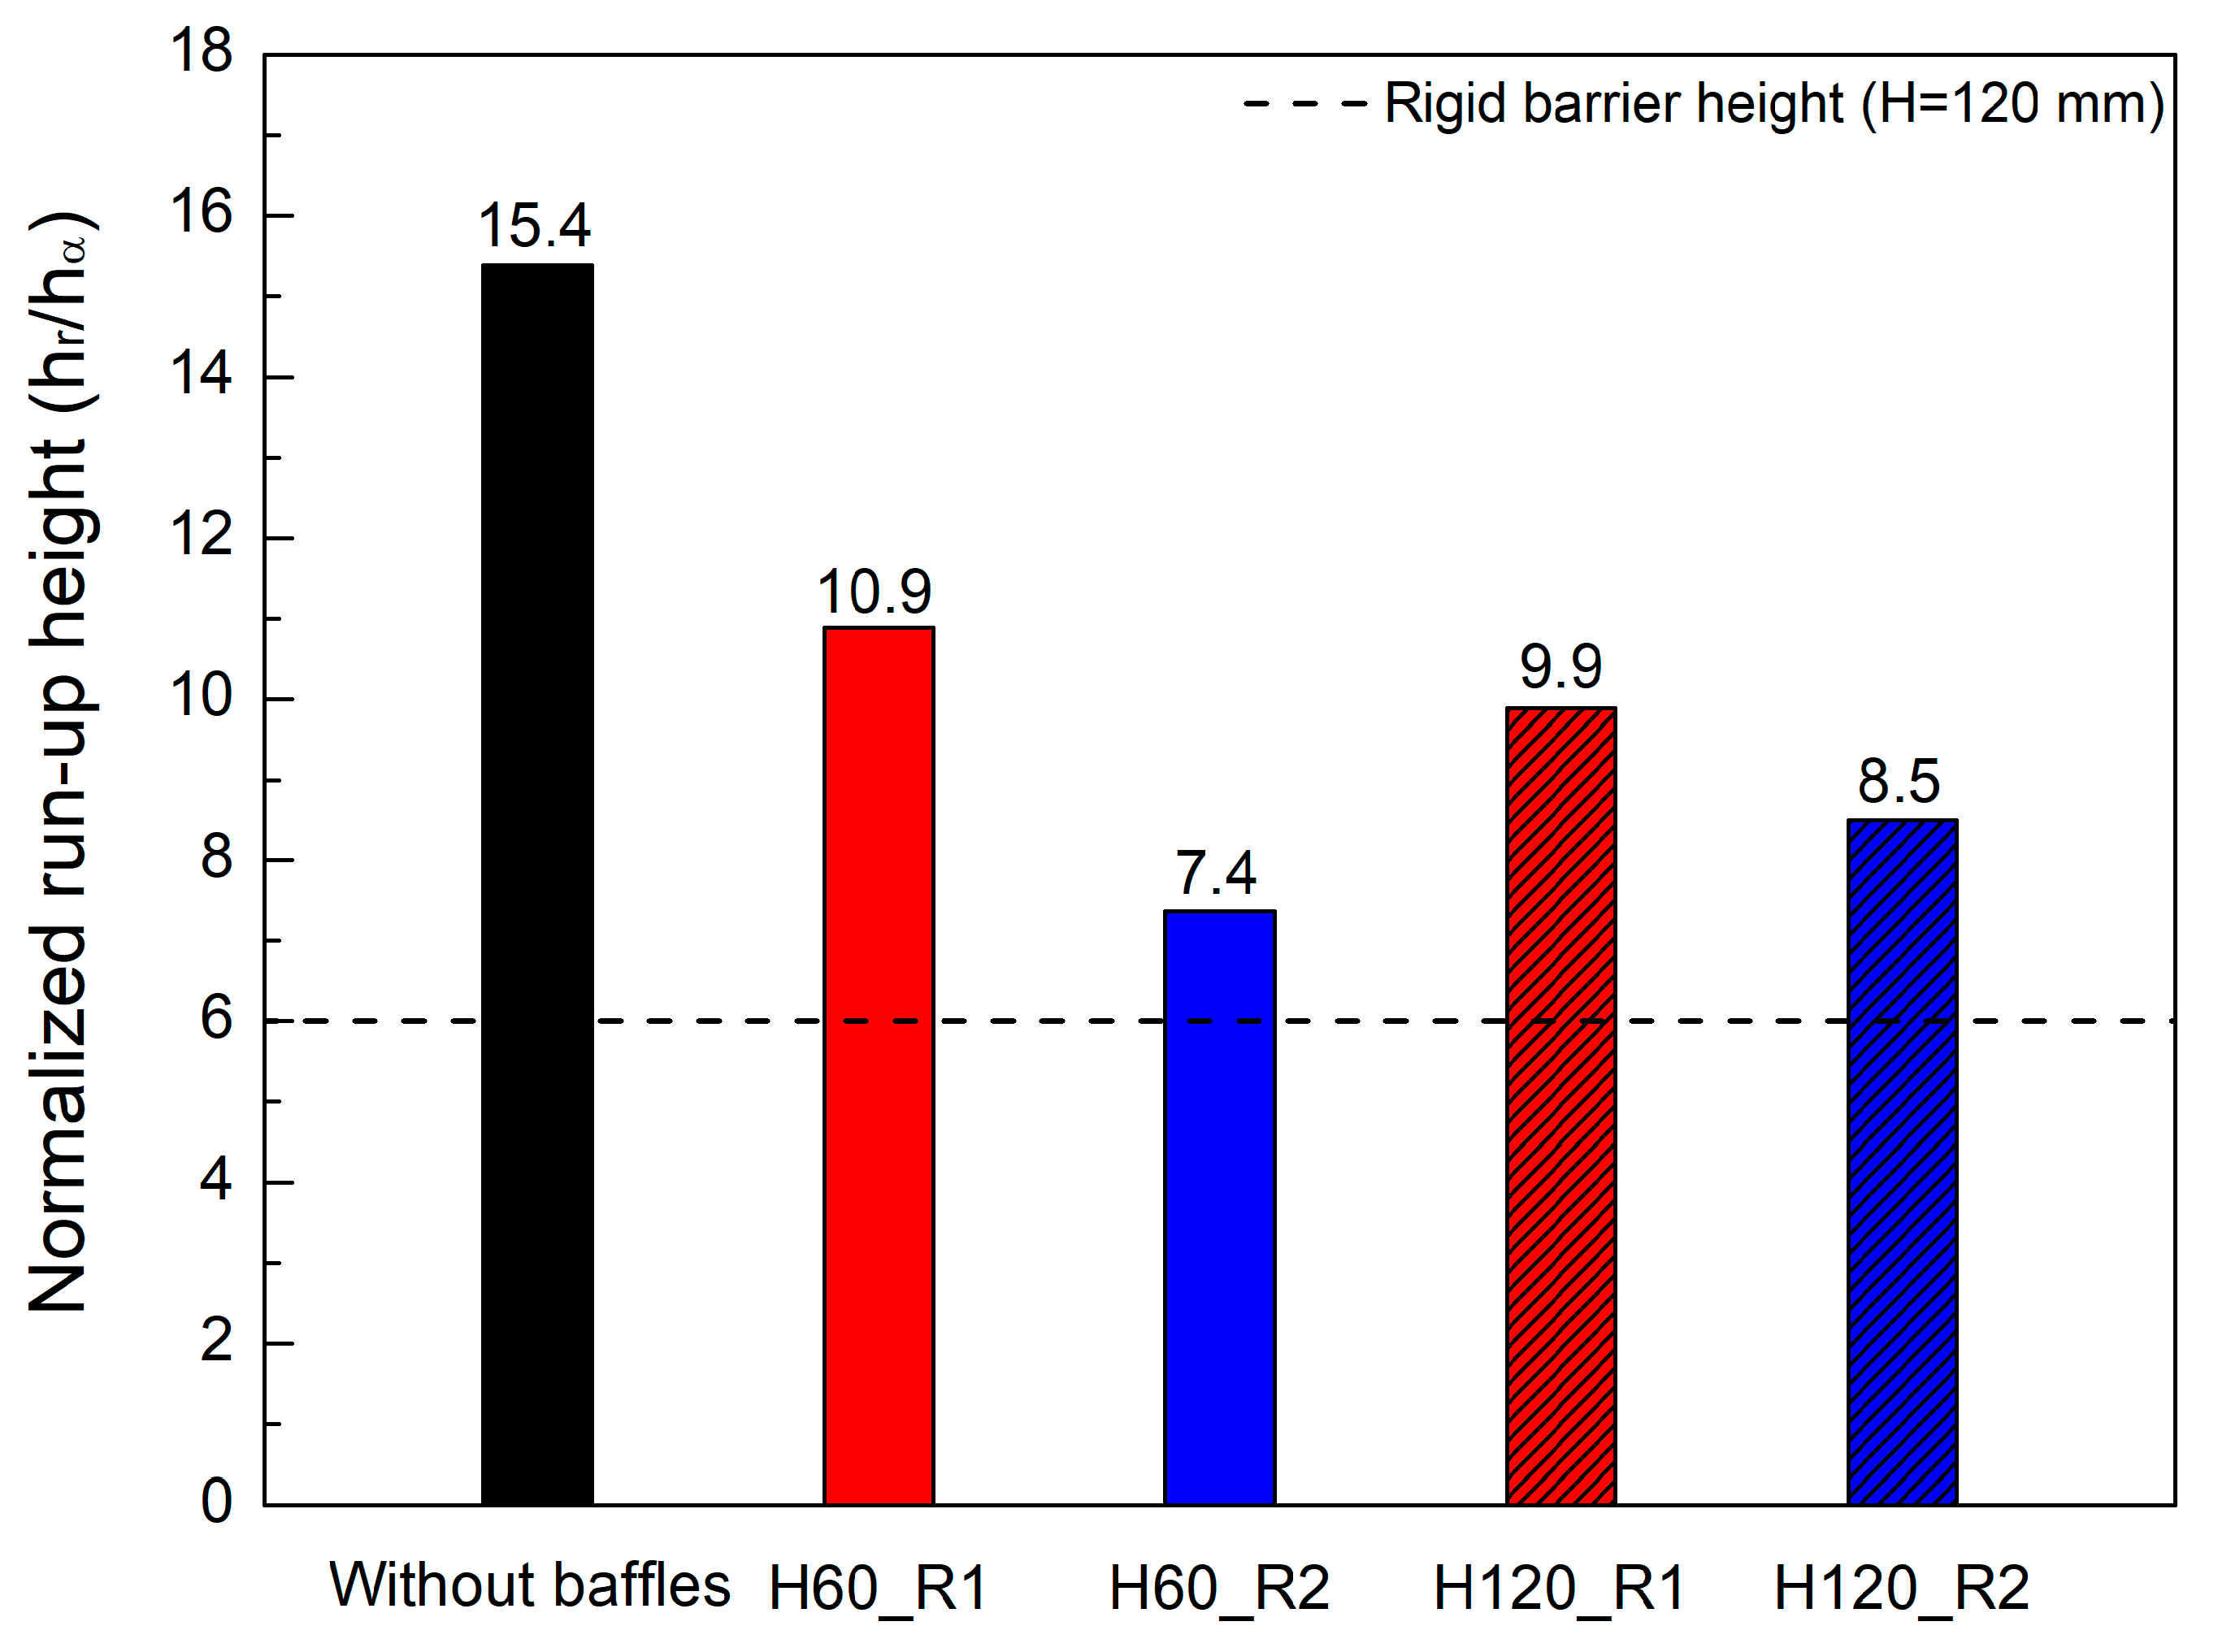
3.1. Run-Up Height
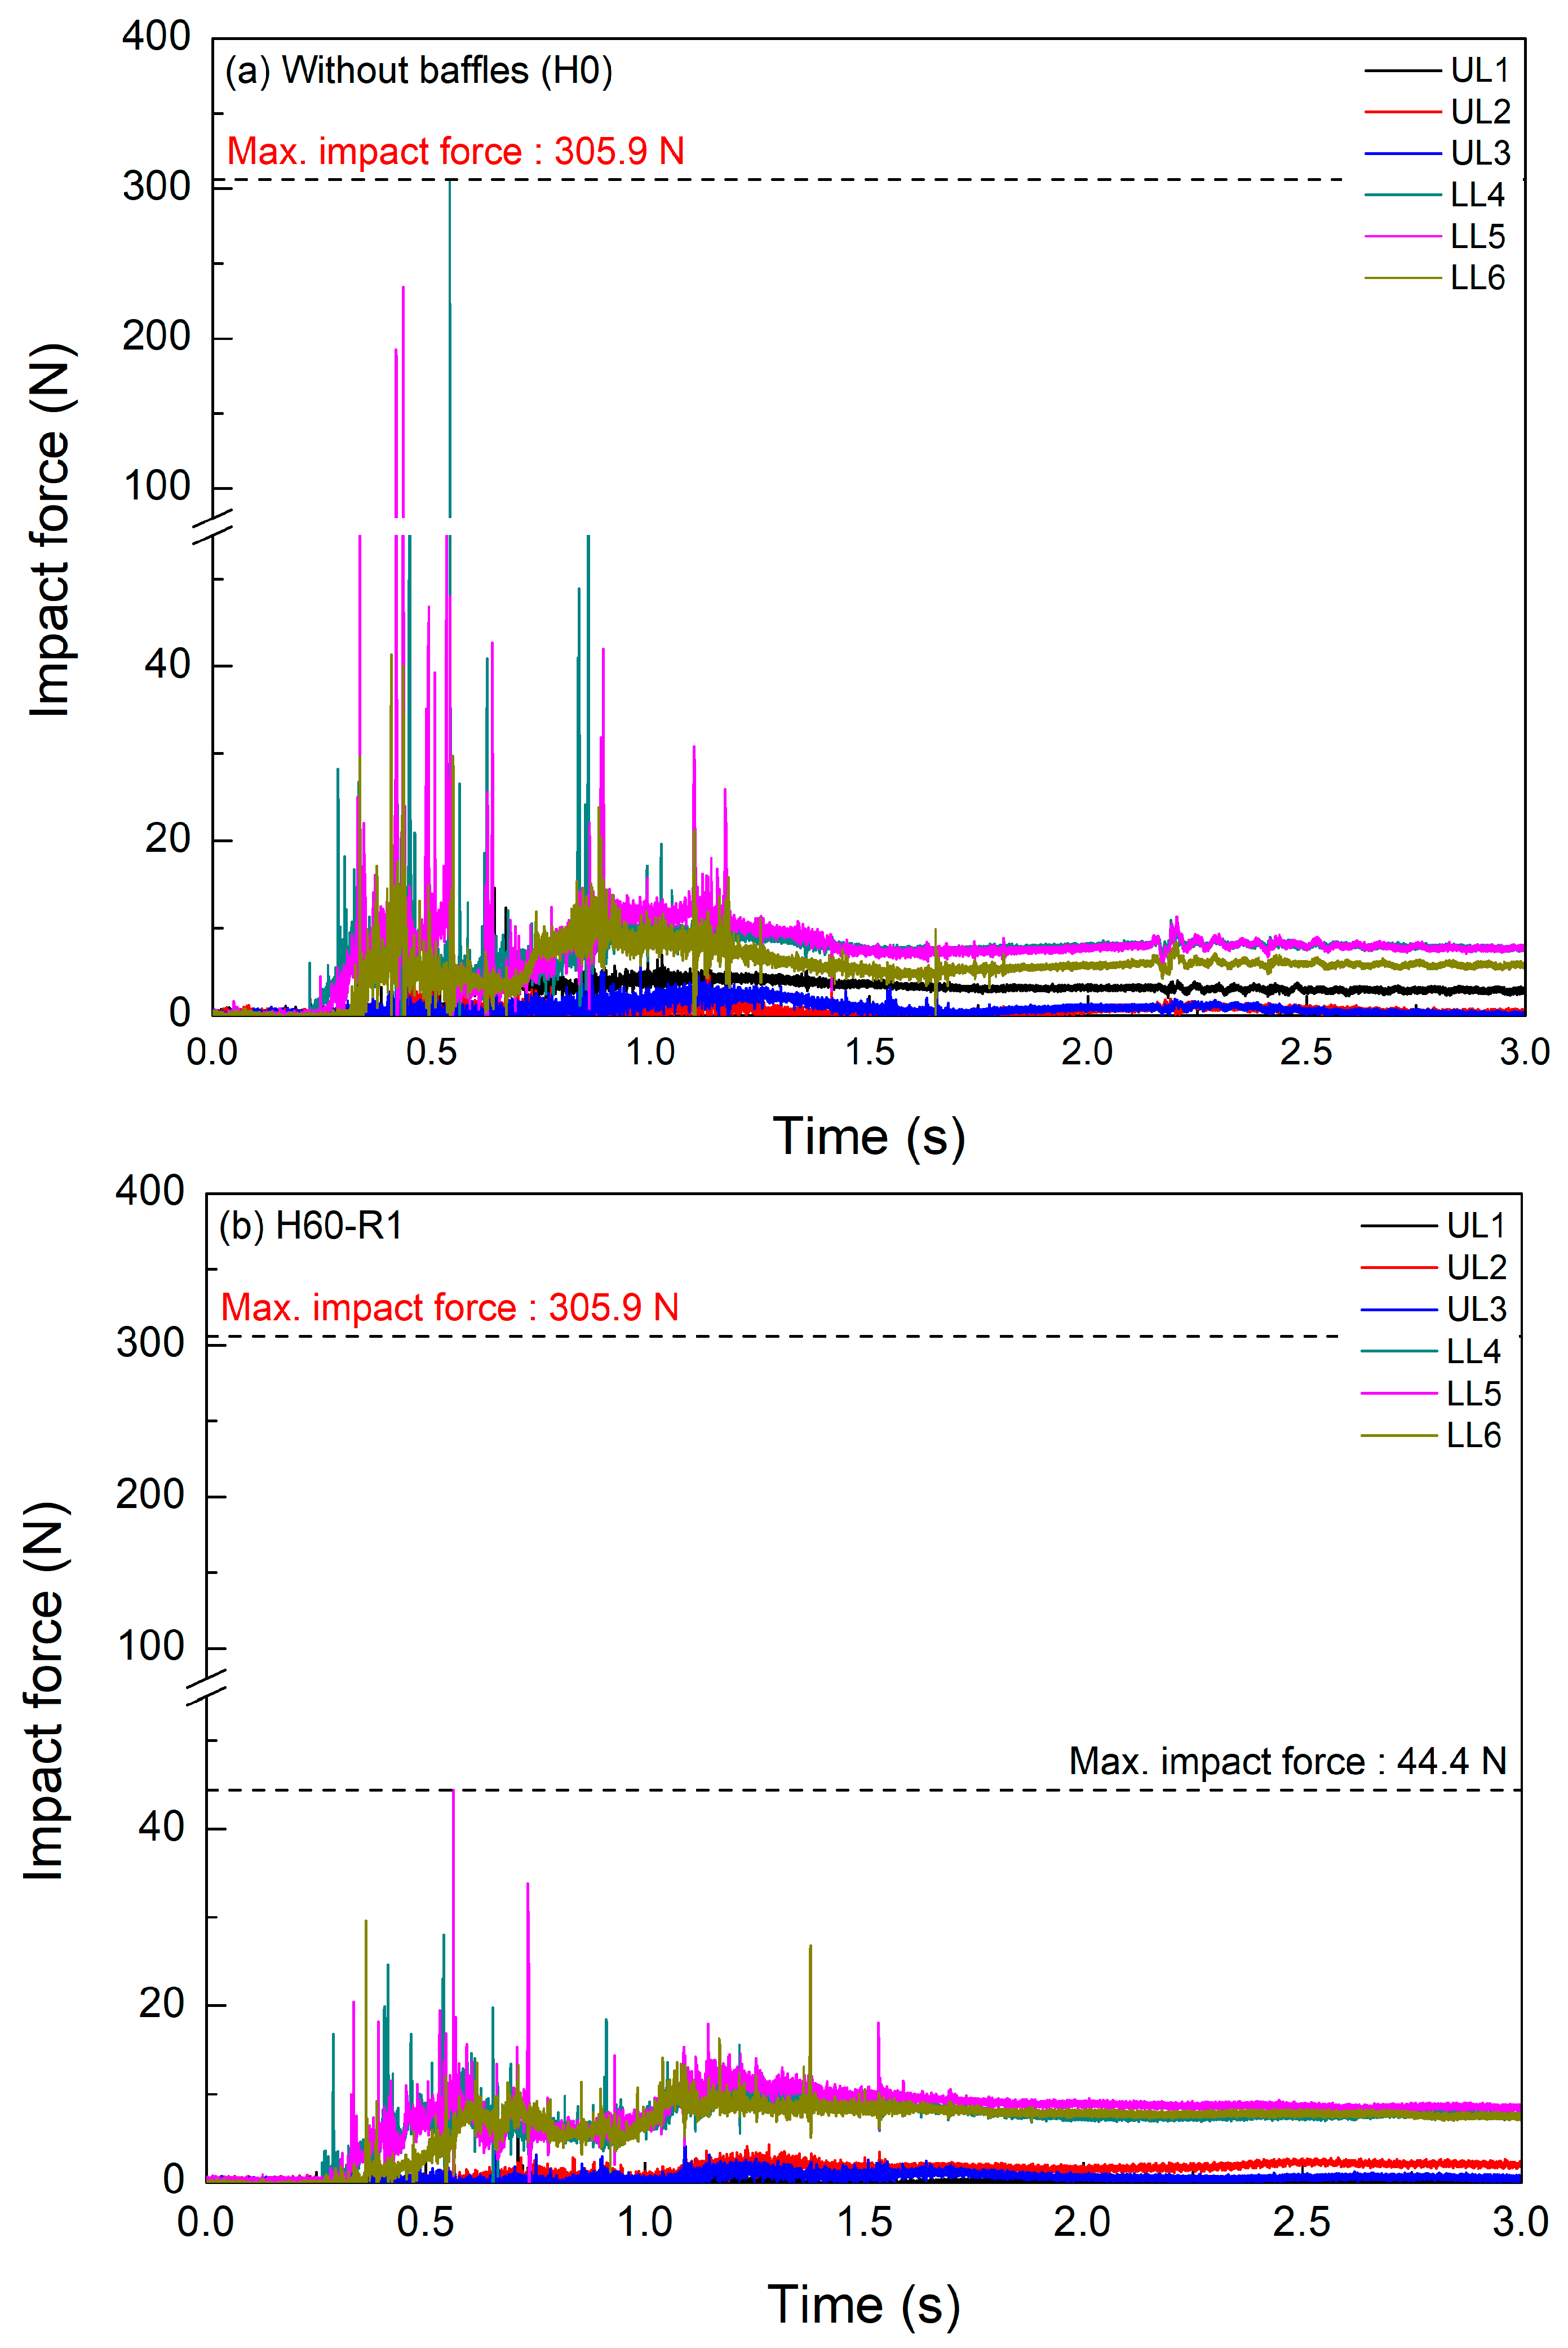
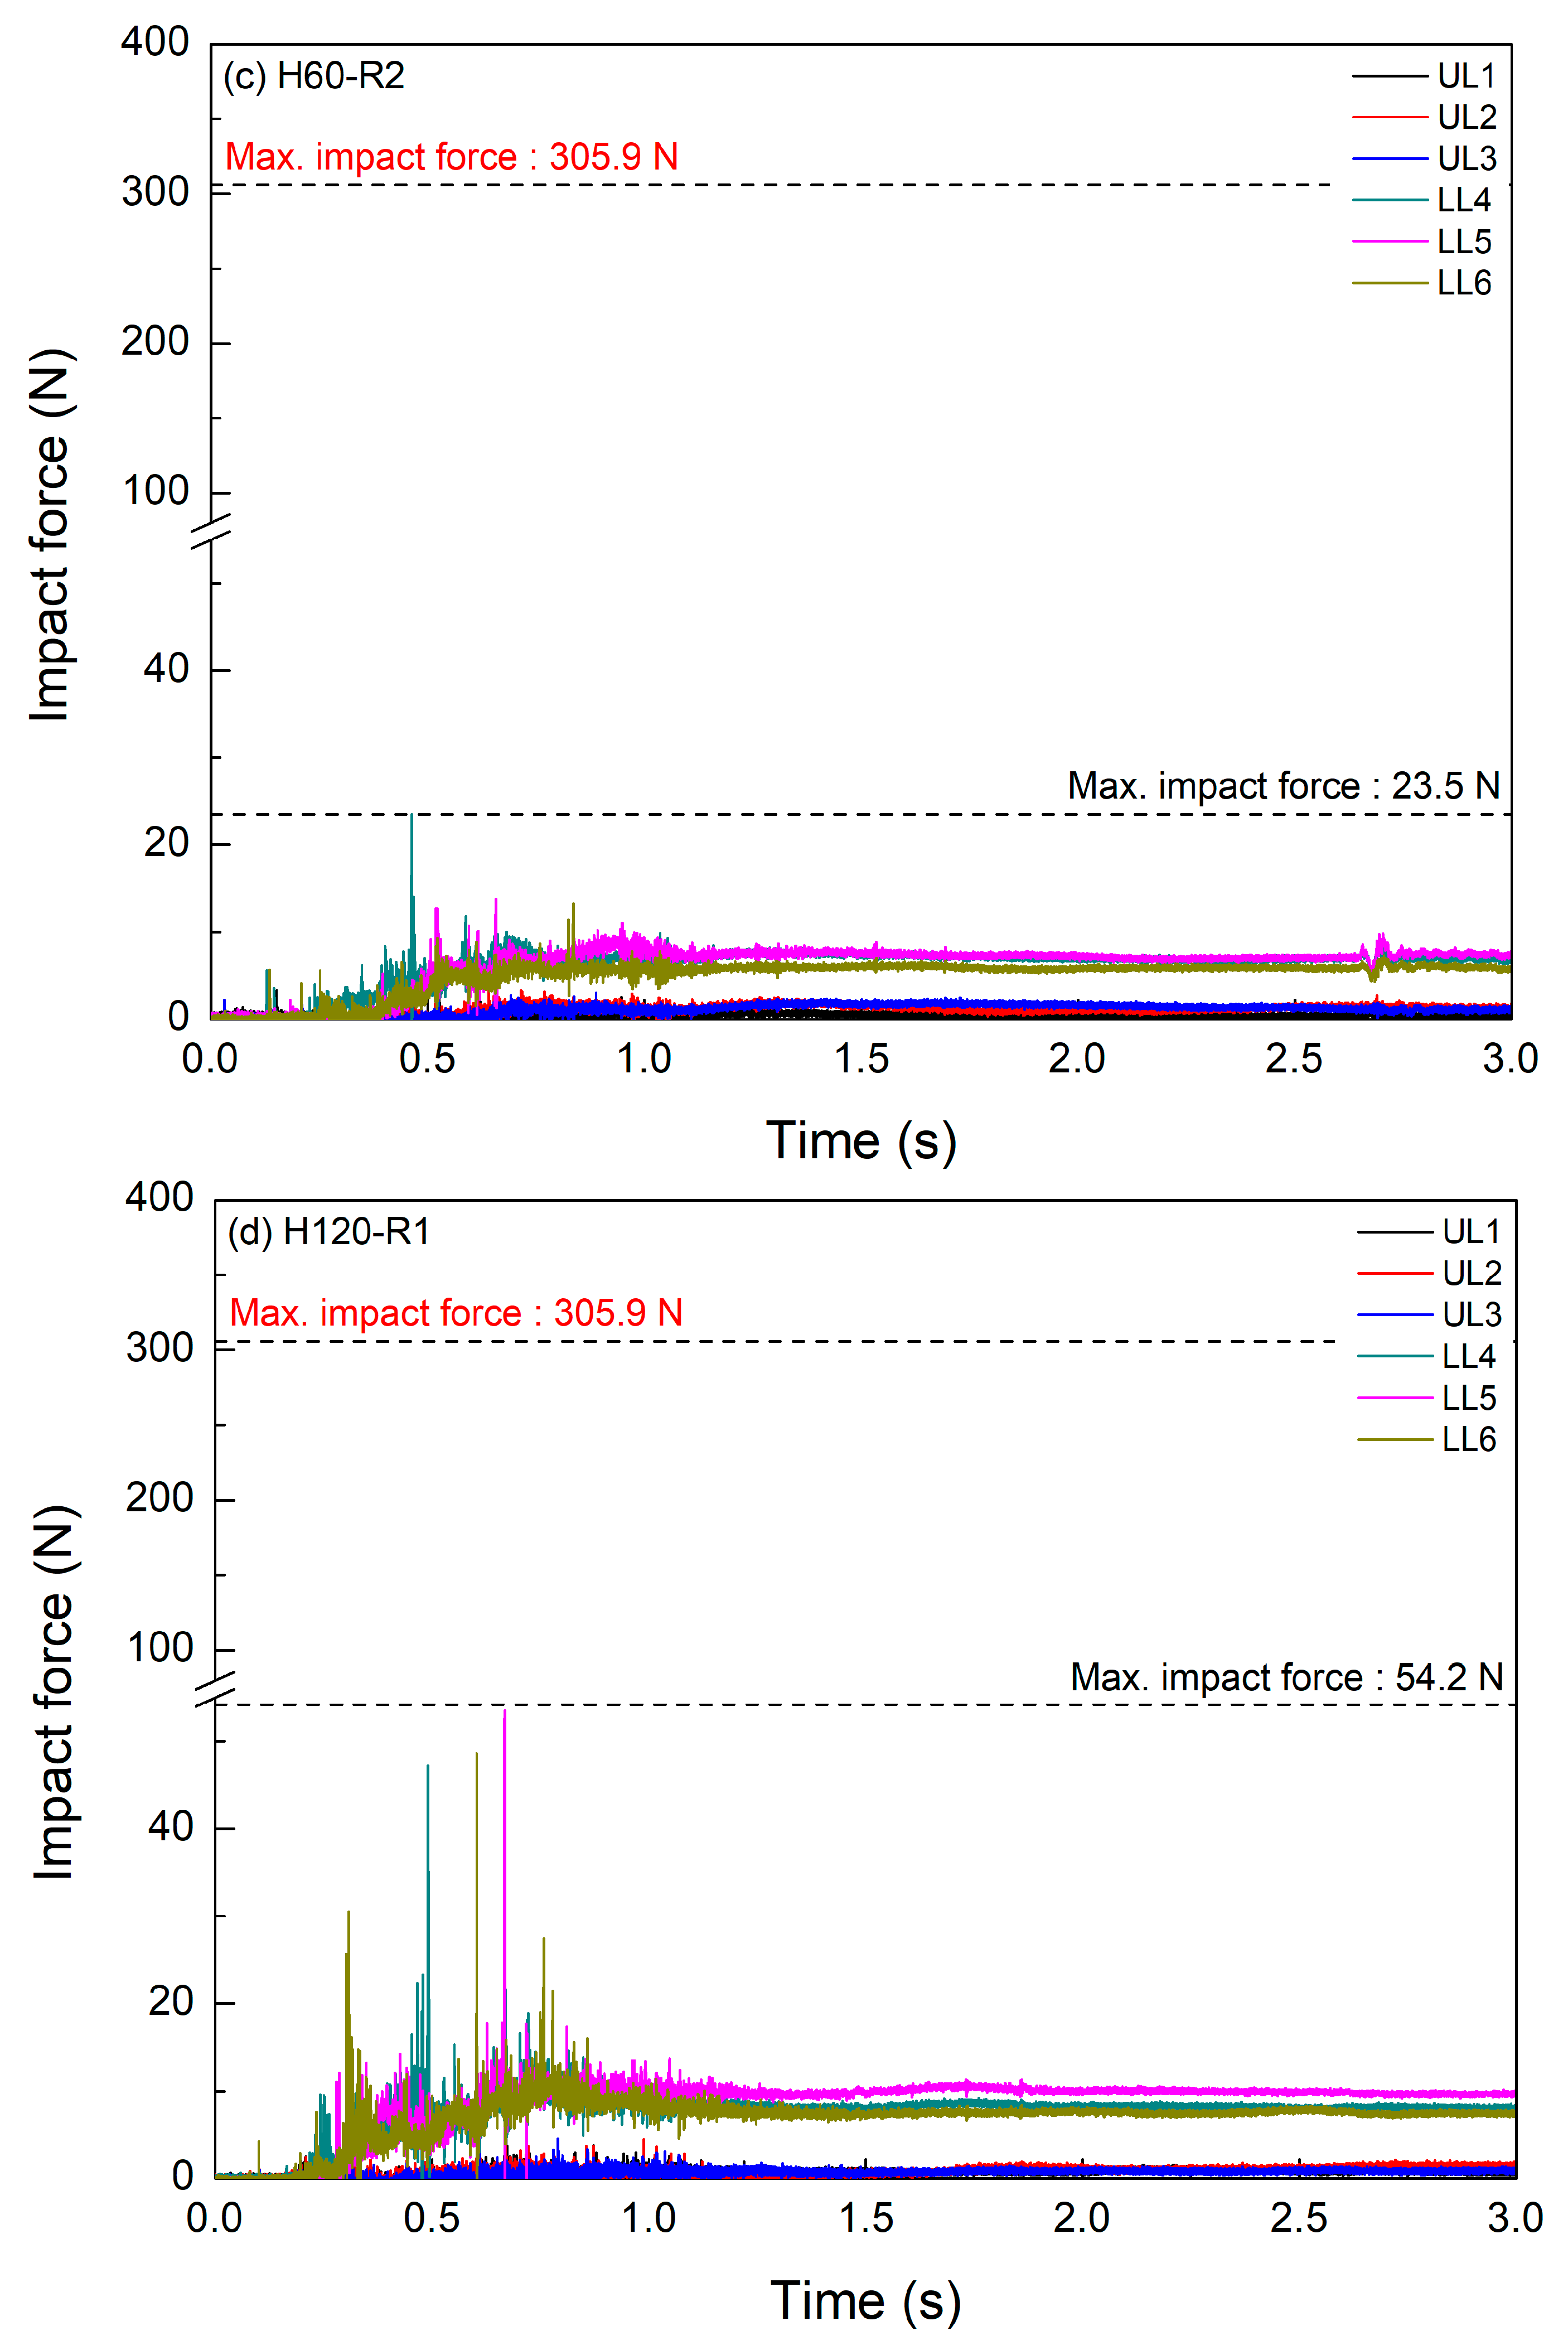
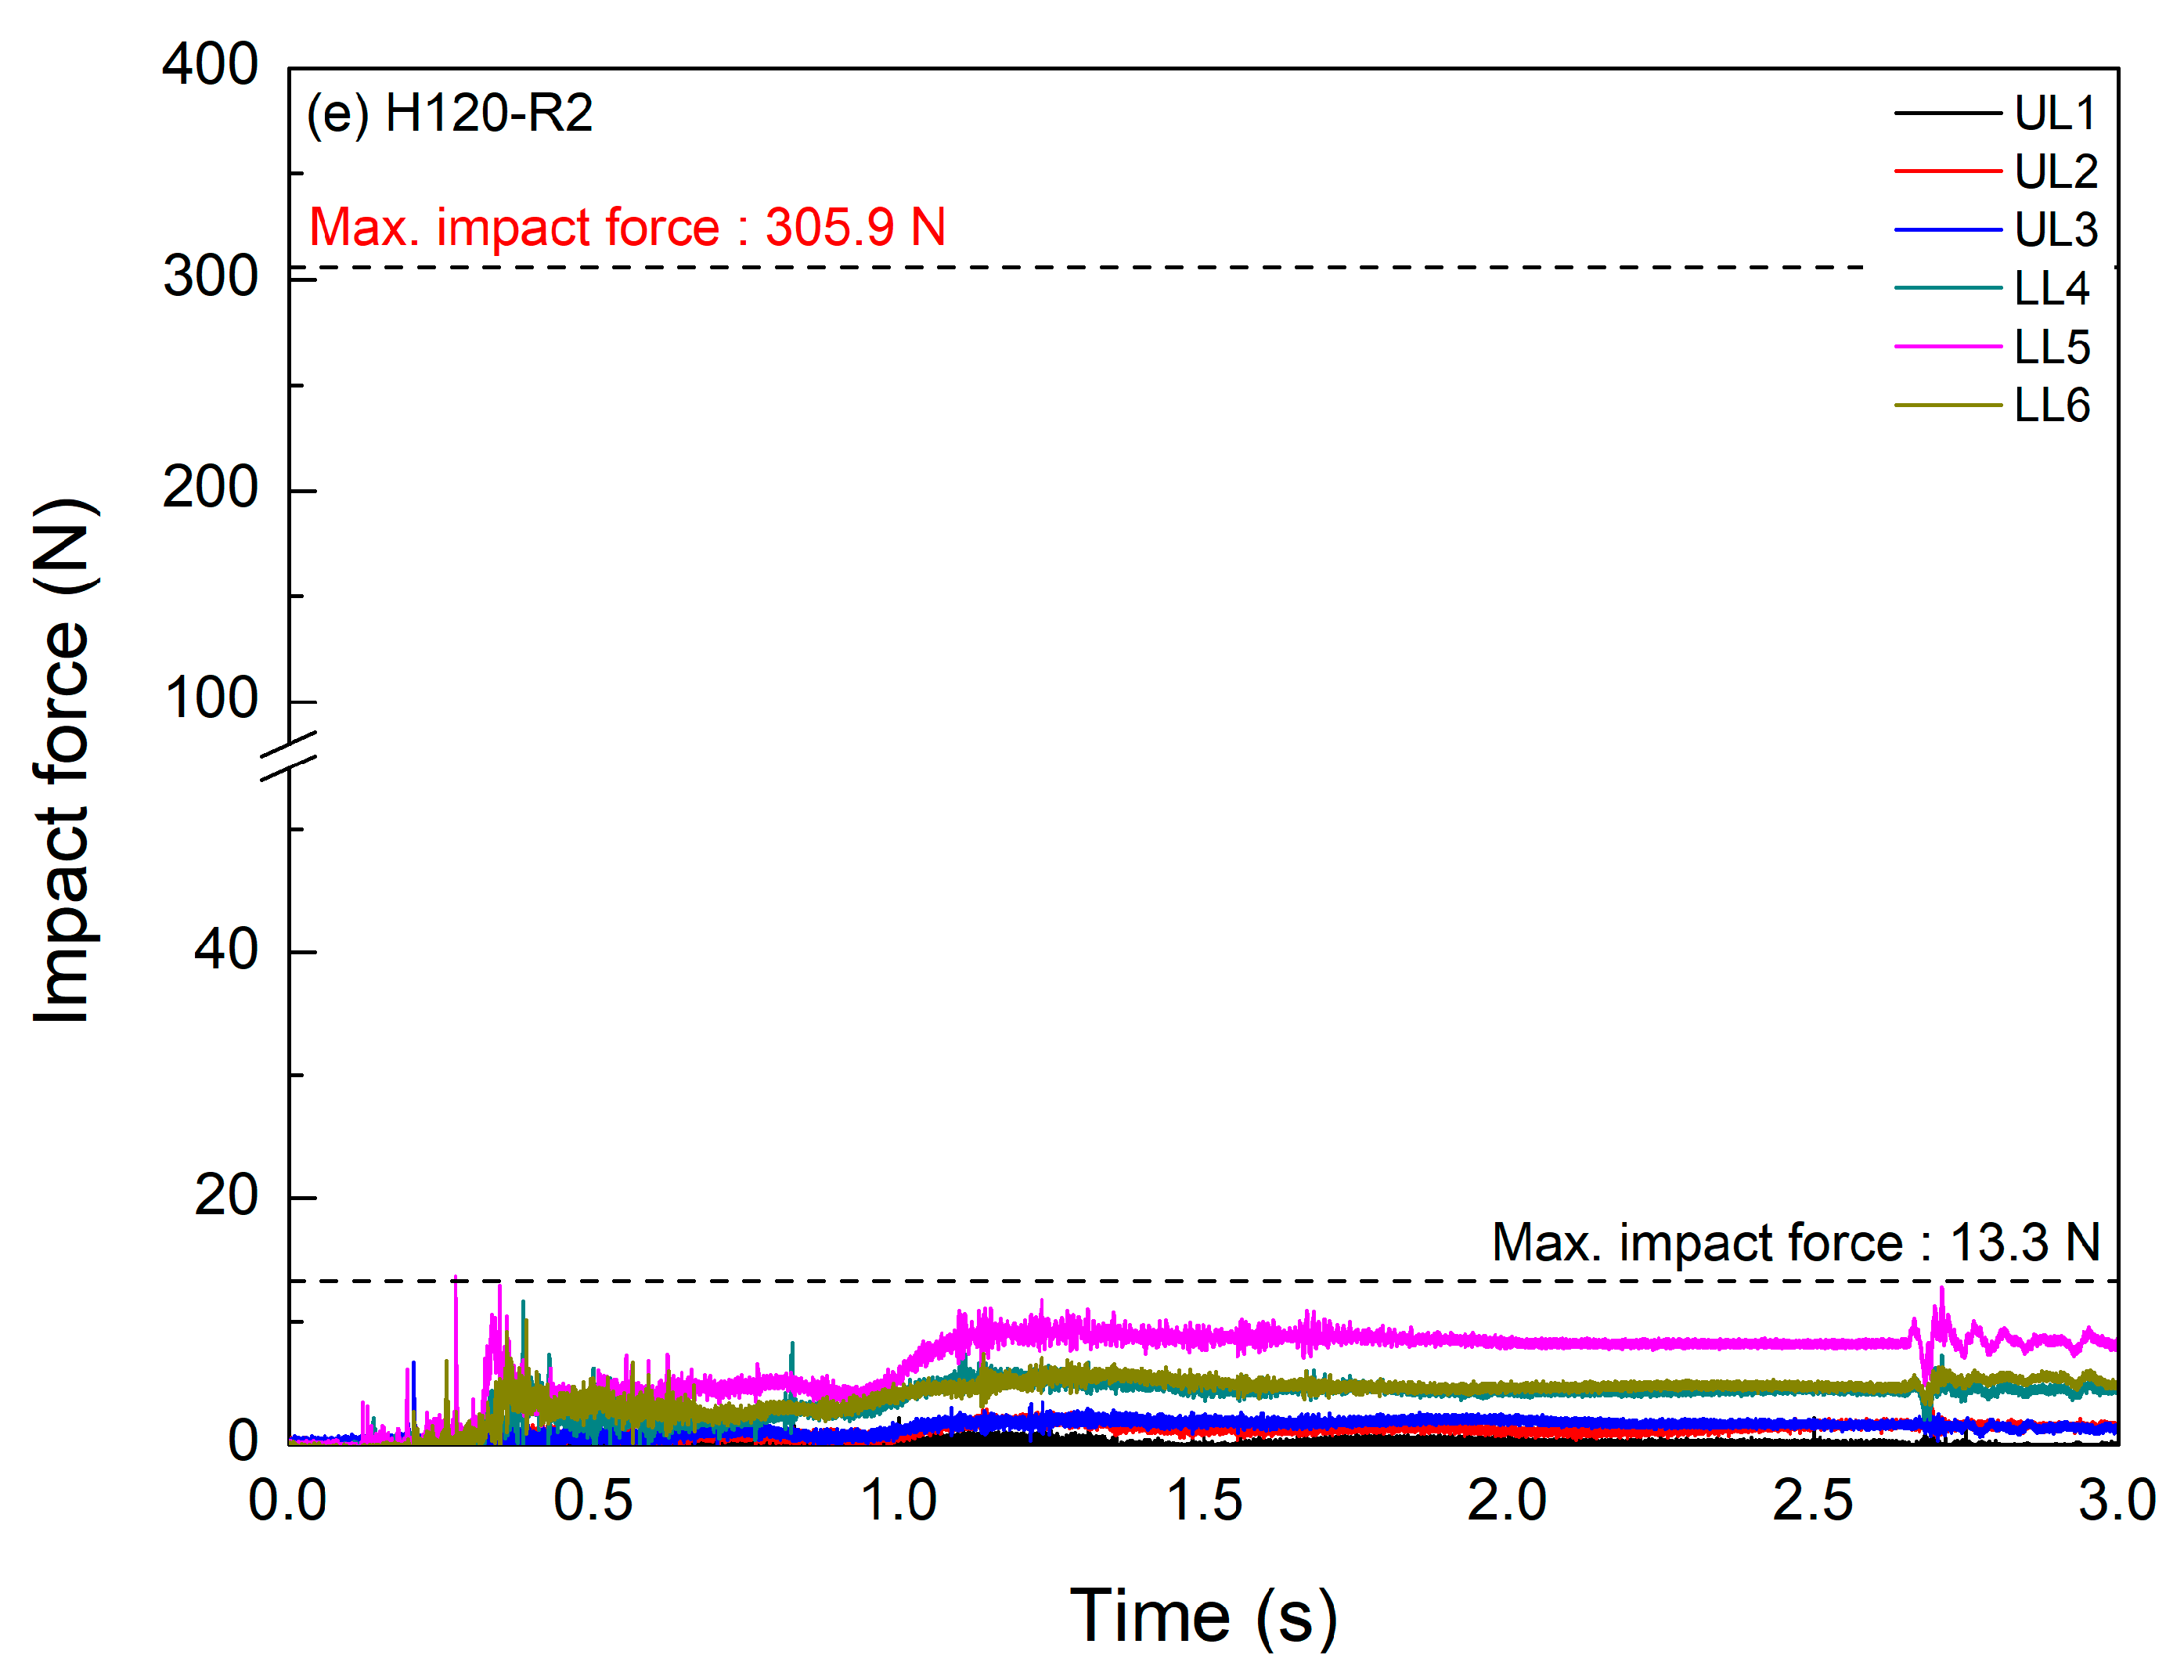
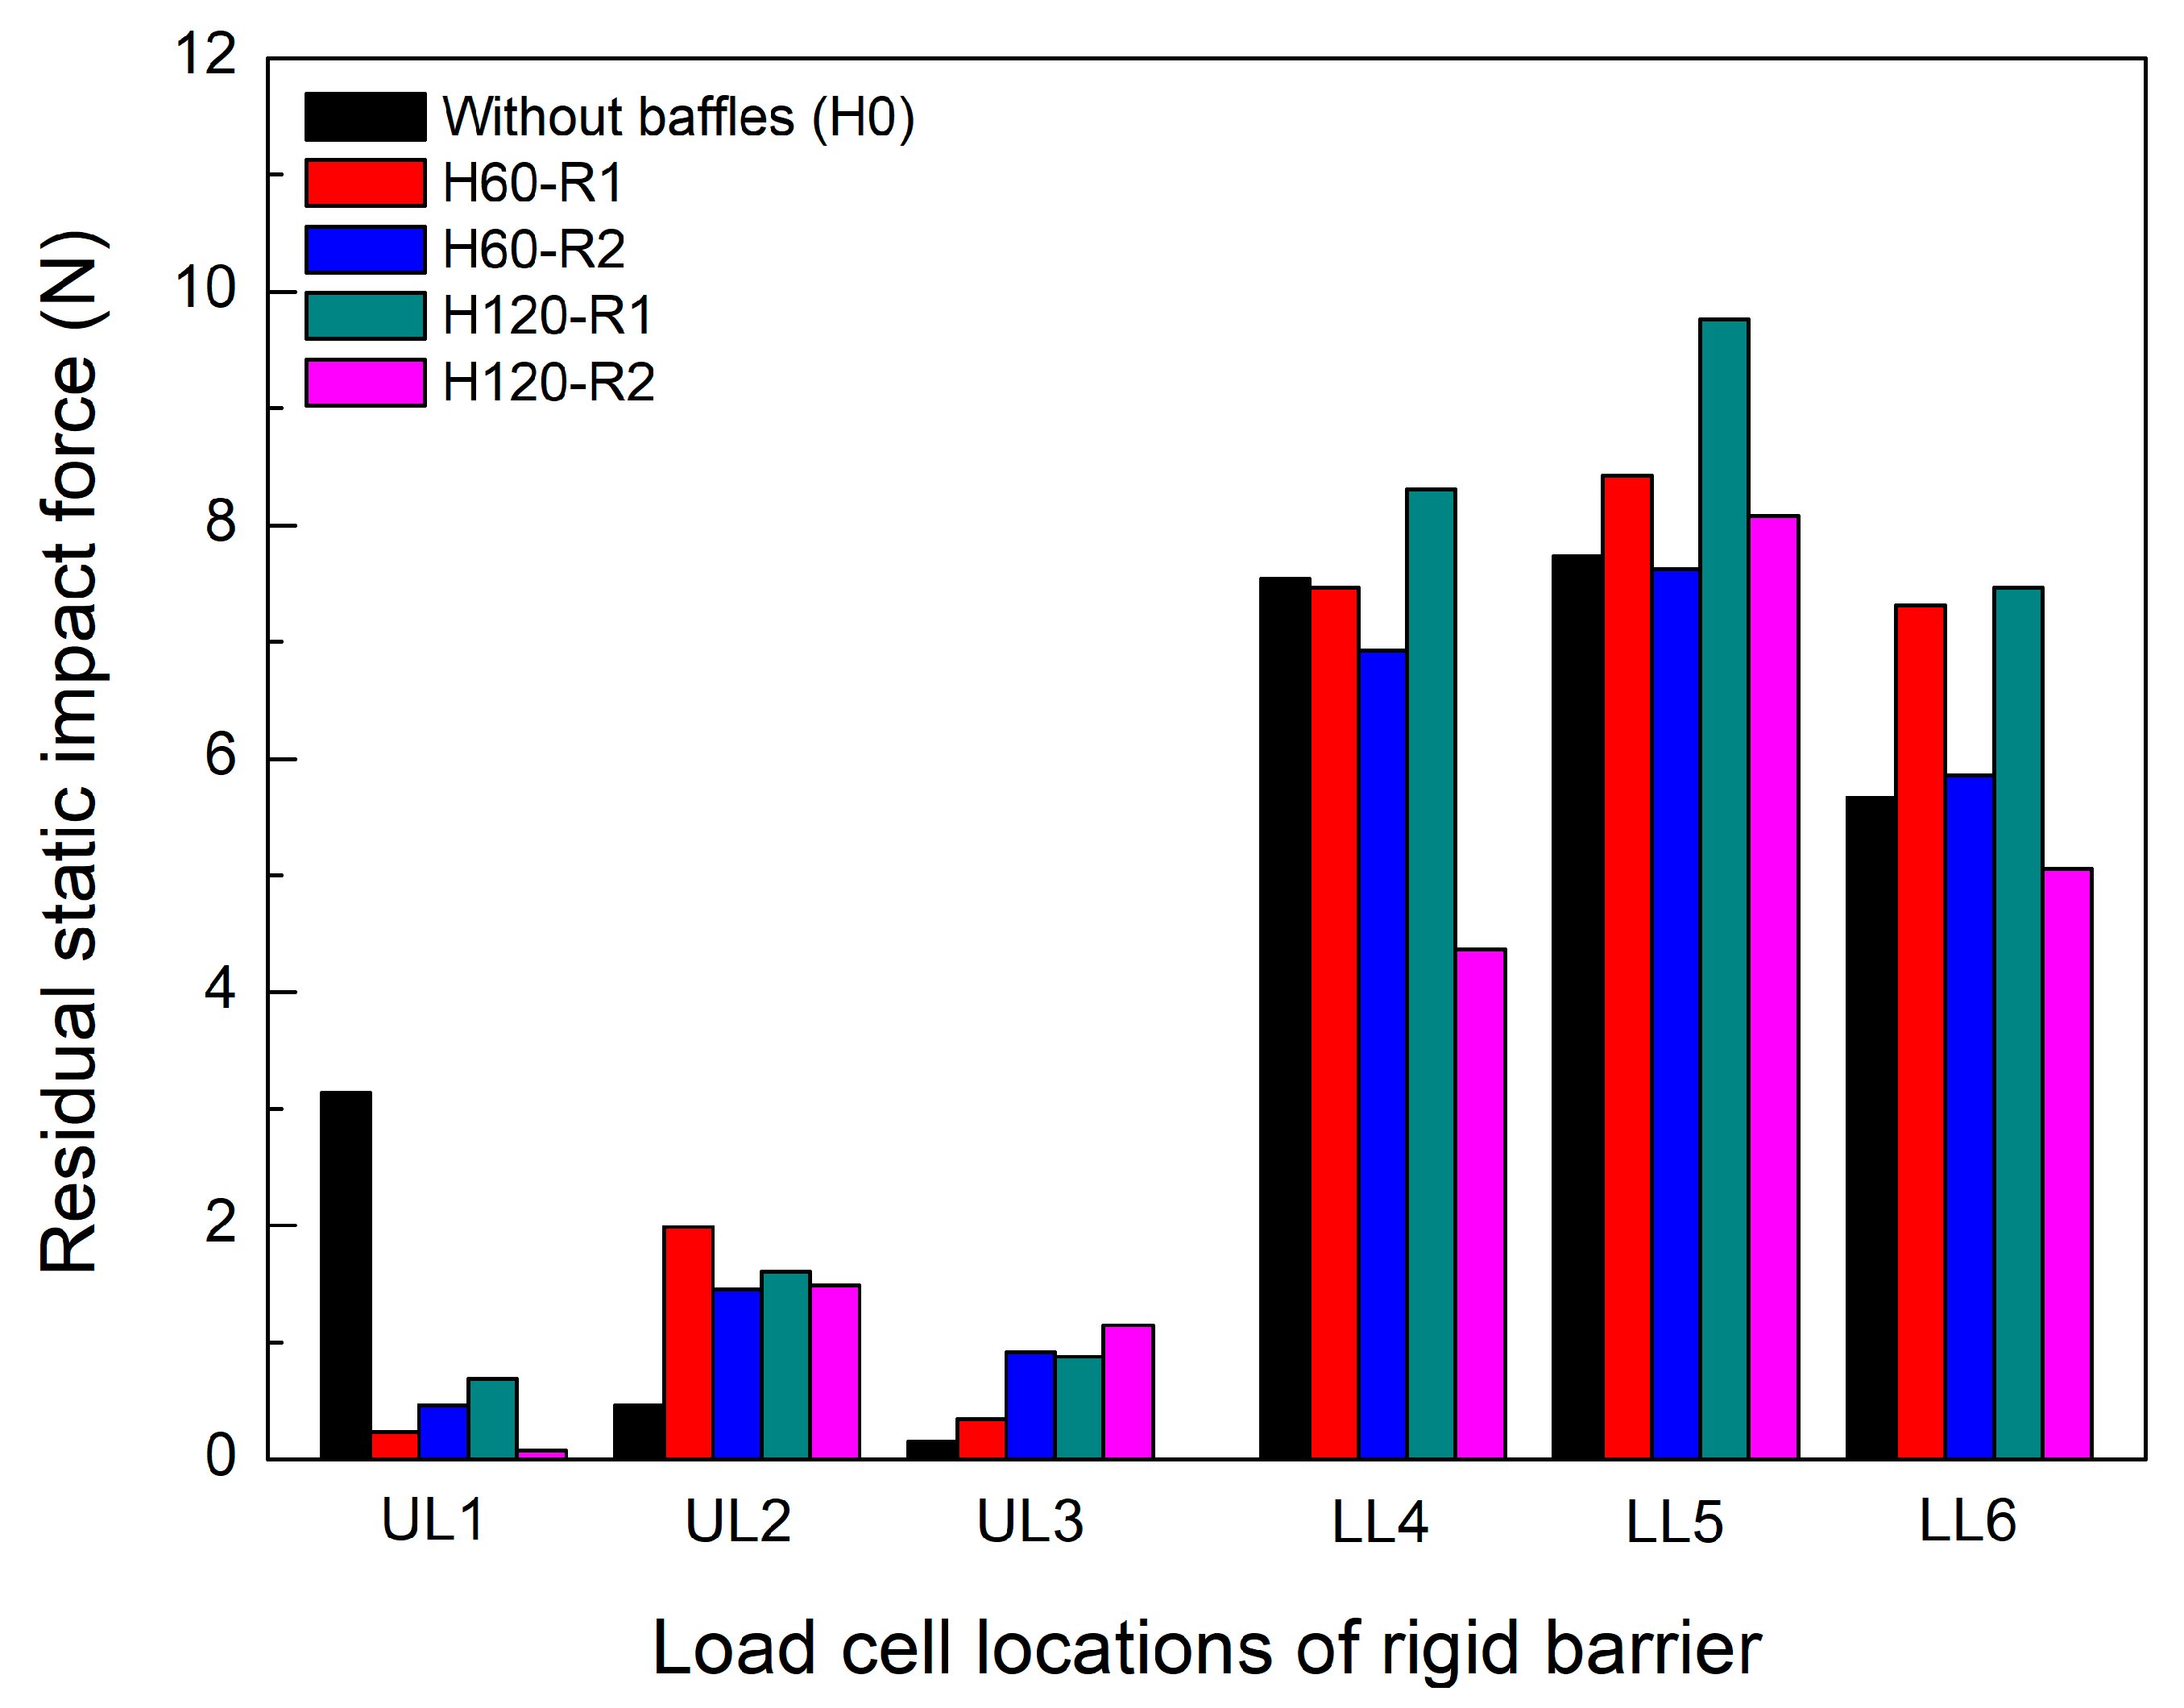
3.2. Impact Force
4. Discussion
5. Conclusions
- (1)
- The experimental results showed that the use of baffle arrays reduced the run-up height and impact force on the terminal rigid barrier because of the suppression of boulders and flow;
- (2)
- Increasing the number of baffle rows created a greater run-up and impact force reduction because it impeded the mobility of boulders and flow. In comparison with the existing analytical approaches, the test with no baffles agreed well with the trend line by the energy principle model, whereas the results with baffles approached the trend line by the momentum-based approach model, which was dominated by the frictional force;
- (3)
- Increasing the number of baffle rows provided more energy dissipation and impact force reduction. Furthermore, the use of baffles promoted a reduction in the run-up height and overflow; however, it did not produce a higher flow deposition on the back of the rigid barrier;
- (4)
- Cylindrical baffles behind the rigid barrier can be utilized as efficient countermeasures to reduce the high impact forces by boulders entrained by debris flows. For the field application of baffles, however, the transverse blockage ratio of the baffles needs to be varied with the size of boulders. Thus, an additional study on impact force characteristics considering the interaction between baffles and flows including various size of boulders will be needed.
Author Contributions
Funding
Institutional Review Board Statement
Informed Consent Statement
Data Availability Statement
Conflicts of Interest
References
- Lo, D.O.K.; Ho, K.K.S.; Pun, W.K.; Pang, P.L.R. Design of Barriers for Natural Terrain Landslides. In Proceedings of the International Symposium, Melbourne, Australia, 19 November 2000. [Google Scholar]
- Berger, C.; McArdell, B.W.; Schlunegger, F. Direct measurement of channel erosion by debris flows, Illgraben, Switzerland. J. Geophys. Res. Earth Surf. 2011, 116, 1002. [Google Scholar] [CrossRef]
- Choi, C.E.; Ng, C.W.W.; Song, D.; Kwan, J.S.H.; Koo, R.C.H.; Shiu, H.Y.K.; Ho, K.K.S. Flume investigation of landslide debris-resisting baffles. Can. Geotech. J. 2014, 51, 540–553. [Google Scholar] [CrossRef]
- Kim, M.I.; Kim, N. Analysis of debris flow reduction effect of check dam types considering the mountain stream shape: A case study of 2016 debris flow hazard in Ulleung-do Island, South Korea. Adv. Civil. Eng. 2021, 2021, 1–12. [Google Scholar] [CrossRef]
- Kwan, J.S.H. Supplementary Technical Guidance on Design of Rigid Debris-Resisting Barriers; GEO Report No. 270; Geotechnical Engineering Office HKSAR Government: Hong Kong, China, 2012.
- Li, X.; Zhao, J. A unified CFD-DEM approach for modeling of debris flow impacts on flexible barriers. J. Numer. Anal. Methods Geomech. 2018, 42, 1643–1670. [Google Scholar] [CrossRef]
- Choi, C.E.; Au-Yeung, S.C.; Ng, C.W.W.; Song, D. Flume investigation of landslide granular debris and water run up mechanisms. Géotechnique Lett. 2015, 5, 28–32. [Google Scholar] [CrossRef]
- Ng, C.W.W.; Choi, C.E.; Liu, L.H.D.; Wang, Y.; Song, D.; Yang, N. Influence of particle size on the mechanism of dry granular run-up on a rigid barrier. Géotechnique Lett. 2017, 7, 79–89. [Google Scholar] [CrossRef]
- Huang, Y.; Zhang, B. Review on key issues in centrifuge modeling of flow-structure interaction. Eur. J. Environ. Civ. Eng. 2020, 26, 2354–2370. [Google Scholar] [CrossRef]
- Shen, W.; Zhao, T.; Zhao, J.; Dai, F.; Zhou, G.G.D. Quantifying the impact of dry debris flow against a rigid barrier by DEM analyses. Eng. Geol. 2018, 241, 86–96. [Google Scholar] [CrossRef]
- Kim, B.J.; Han, K.D.; Choi, C.E.; Yune, C.Y. An experimental study on cylindrical countermeasures for dissipation of debris flow energy. J. Kor. Geo-Environ. Soci. 2019, 20, 57–65. (In Korean) [Google Scholar] [CrossRef]
- Arattano, M.; Deganutti, A.M.; Marchi, L. Debris flow monitoring activities in an instrumented watershed on the Italian Alps. In Proceedings of the 1st ASCE International Conference on Debris-Flow Hazards Mitigation: Mechanics, Prediction & Assessment, San Francisco, CA, USA, 7–9 August 1997. [Google Scholar]
- Choi, C.E.; Ng, C.W.W.; Au-Yeung, S.C.H.; Goodwin, G.R. Froude characteristics of both dense granular and water flows in flume modelling. Landslides 2015, 12, 1197–1206. [Google Scholar] [CrossRef]
- Cui, P.; Zeng, C.; Lei, Y. Experimental analysis on the impact force of viscous debris flow. Earth Surf. Pro. Landf. 2015, 40, 1644–1655. [Google Scholar] [CrossRef]
- Hübl, J.; Suda, J.; Proske, D.; Kaitna, R.; Scheidl, C. Debris flow impact estimation steep slopes. In Proceedings of the 11th International Symposium on Water Management and Hydraulic Engineering, Ohrid, Macedonia, 1–5 September 2009. [Google Scholar]
- Scheidl, C.; Chiari, M.; Kaitna, R.; Müllegger, M.; Krawtschuk, A.; Zimmermann, T.; Proske, D. Analysing debris-flow impact models, based on a small scale modelling approach. Surv. Geophys. 2013, 34, 121–140. [Google Scholar] [CrossRef]
- Wang, Y.; Liu, X.; Yao, C.; Li, Y.; Liu, S.; Zhang, X. Finite release of debris flows around round and square piers. J. Hydraul. Eng. 2018, 144, 06018015. [Google Scholar] [CrossRef]
- Jun, K.J.; Lee, S.D.; Kim, G.H.; Lee, S.W.; Yune, C.Y. Verification of countermeasures by velocity estimation of real scale debris flow test. In Proceedings of the 6th International Conference on Debris Flow Hazard Mitigation: Mechanics, Prediction and Assessment (DFHM6), Tsukuba, Japan, 22–25 June 2015. [Google Scholar]
- Watanabe, M.; Mizuyama, T.; Uehara, S. Review of debris flow countermeasure facilities. J. Jpn. Eros. Con. Eng. Soc. 1980, 115, 40–45. (In Japanese) [Google Scholar] [CrossRef]
- Ikeya, H.; Uehara, S. Experimental study about the sediment control of slit sabo dams. J. Jpn. Eros. Con. Eng. Soc. 1980, 114, 37–44. (In Japanese) [Google Scholar] [CrossRef]
- Kaitna, R.; Palucis, M.C.; Yohannes, B.; Hill, K.M.; Dietrich, W.E. Effects of coarse grain size distribution and fine particle content on pore fluid pressure and shear behavior in experimental debris flows. J. Geophys. Res. Earth Surf. 2016, 121, 415–441. [Google Scholar] [CrossRef]
- Scott, K.M.; Vallance, J.; Pringle, P.T. Sedimentology, Behavior, and Hazards of Debris Flows at Mount Rainier; USGS Professional Paper; US Geological Survey: Reston, VA, USA, 1995; p. 1547.
- Jeong, S.; Kim, Y.; Lee, J.K.; Kim, J. The 27 July 2011 debris flows at Umyeonsan, Seoul, Korea. Landslides 2015, 12, 799–813. [Google Scholar] [CrossRef]
- White, D.J.; Take, W.A.; Bolton, M.D. Soil deformation measurement using particle image velocimetry (PIV) and photogrammetry. Géotechnique 2003, 53, 619–631. [Google Scholar] [CrossRef]
- Jóhannesson, T.; Gauer, P.; Issler, D.; Lied, K. The design of avalanche protection dams. In Recent Practical and Theoretical Developments; European Commission: Brussels, Belgium, 2009. [Google Scholar]
- Song, D.; Choi, C.E.; Ng, C.W.W.; Zhou, G.G.D.; Kwan, J.S.H.; Sze, H.Y.; Zheng, Y. Load-attenuation mechanisms of flexible barrier subjected to bouldery debris flow impact. Landslides 2019, 16, 2321–2334. [Google Scholar] [CrossRef]
- Law, R.H.; Choi, C.E.; Ng, C.W.W. Discrete-element investigation of influence of granular debris flow baffles on rigid barrier impact. Can. Geotech. J. 2016, 53, 179–185. [Google Scholar] [CrossRef]
- Lei, M.; Yang, P.O.; Wang, Y.K.; Wang, X.K. Numerical analyses of the influence of baffles on the dynamics of debris flow in a gully. Arab. J. Geosci. 2020, 13, 1052. [Google Scholar] [CrossRef]


| Baffle Condition | Baffle Height (H) | Number of Rows (R) | Spacing between Successive Rows (L) | Transverse Blockage Ratio (B) | Amount of Soil (kg) | Designation |
|---|---|---|---|---|---|---|
| Without baffles | - | — | — | — | 20 | H0 |
| With baffles | 60 mm | 1 | 200 mm * | 40% | H60-R1 | |
| 2 | H60-R2 | |||||
| 120 mm | 1 | H120-R1 | ||||
| 2 | H120-R2 |
Publisher’s Note: MDPI stays neutral with regard to jurisdictional claims in published maps and institutional affiliations. |
© 2022 by the authors. Licensee MDPI, Basel, Switzerland. This article is an open access article distributed under the terms and conditions of the Creative Commons Attribution (CC BY) license (https://creativecommons.org/licenses/by/4.0/).
Share and Cite
Kim, B.-J.; Kim, D.; Yune, C.-Y. Experimental Study on the Impact Dynamics of Cylindrical Baffles with a Rigid Barrier against Debris Flows. Appl. Sci. 2022, 12, 8632. https://doi.org/10.3390/app12178632
Kim B-J, Kim D, Yune C-Y. Experimental Study on the Impact Dynamics of Cylindrical Baffles with a Rigid Barrier against Debris Flows. Applied Sciences. 2022; 12(17):8632. https://doi.org/10.3390/app12178632
Chicago/Turabian StyleKim, Beom-Jun, Dolla Kim, and Chan-Young Yune. 2022. "Experimental Study on the Impact Dynamics of Cylindrical Baffles with a Rigid Barrier against Debris Flows" Applied Sciences 12, no. 17: 8632. https://doi.org/10.3390/app12178632