Article

Optimization and Hydration Mechanism of Ecological Ternary Cements Containing Phosphogypsum

1
Faculty of Engineering, China University of Geosciences, Wuhan 430074, China
2
School of Environment, Tsinghua University, Beijing 100084, China
3
School of Civil Engineering, Sun Yat-Sen University, Guangzhou 510275, China
*
Authors to whom correspondence should be addressed.
Appl. Sci. 2022, 12(17), 8726; https://doi.org/10.3390/app12178726
Submission received: 19 May 2022 / Revised: 5 August 2022 / Accepted: 15 August 2022 / Published: 31 August 2022
(This article belongs to the Section Civil Engineering)

Abstract

:
Ecological ternary cements (ECP) were prepared with powders of phosphogypsum (PG), fly ash (FA) and Portland cement (PC). The evolution mechanism of the hydration product structure was characterized through macro and micro experiments. The thermodynamic characteristics of the solid phase, solid solution phase and aqueous solution in the process of hydration about the phosphogypsum–fly ash–cement ternary cementitious system were studied based on the Gibbs-free-energy C-S-H thermodynamic model and GEM-Selektor software and compared with the experimental results. The results show that, in the hydration reaction, the thermodynamic interaction between the mineral single-phase and hydration products plays an important role in the spatio-temporal distribution of ions in the cementitious system. The values of CaO, SiO2H and H2Ohyd gradually increased with the increase in the Ca/Si ratio, while the values of CaOext and H2OOH showed a positive proportional relationship and the values of SiO2H and SiO2 showed an inverse proportional relationship. GEM-Selektor accurately simulated the total amount of AFt and AFm mineral phases, and quantitatively analyzed the correlation of complex ion groups about C-S-H gels and C3S.

1. Introduction

The large-scale utilization of phosphogypsum (PG), a by-product generated from the phosphorus fertilizer industry (phosphoric acid production), could solve waste disposal and pollution problems that currently cause severe pollution of the soil, water and atmosphere. At present, phosphogypsum production is significant in China, with the top five provinces being Hubei, Yunnan, Guizhou, Sichuan and Anhui [1]. The random discharge and accumulation of phosphogypsum has seriously damaged the ecological environment, and has not only polluted the groundwater resources, but also caused a waste of land resources. Therefore, it is urgent to make some contributions in the field of phosphogypsum recycling. Efforts have been made to use virgin and calcined PG as the retarders [2] in Portland cement (PC), but the hydration kinetics of PC are negatively affected compared to natural gypsum due to the impurities of the raw phosphogypsum [3]. Therefore, the treatment of raw PG with a processing method such as calcining, lime water washing or neutralization through research studies is strongly recommended [4]. To improve the performance of PG production, alkali-activated cements such as granulated slag, fly ash and zeolitic waste have been added to make PG-based cementitious binders [5], which have become a viable ecological alternative to traditional cementitious materials.
The composition of phosphogypsum is complicated, providing a source of calcium, phosphorus, rare earth minerals, trace elements, and other elements, among others, as well as a mineral resource in the technological processes of environmental protection [6]. Phosphogypsum has lower gelation and cementation performance than natural gypsum, and its viscosity and fluidity are also worse than natural gypsum. Phosphogypsum slurry has a long setting time and a certain corrosiveness. The solubility of phosphogypsum in water is very low, and it decreases with the increase in temperature. The particle size of phosphogypsum is relatively concentrated, and the content of impurities and the morphology of crystals have a significant relationship with the phosphate ore. A more regular phosphogypsum crystal shape means a larger particle size and a lower impurity content.
Numerous studies have shown that chemical thermodynamic modeling, coupled with accurate and complete thermodynamic databases, can reliably predict hydrated cement phase assemblages and chemical compositions [7]. To the best of our knowledge, while the correlations between the hydration process, mechanical strength and calorimetry in relation to the cement compositions have been identified in a previous study [8], this investigation traced them back to a single phase. Current understandings of this process are limited by the absence of phase composition and published data about the composition–processing–performance relationships involved. In addition, as calorimetric studies on PG efficiency as a source of alkali-activated cements have shown [9], its interpretation cannot automatically be applied to these cements due to differences in the hydration processes. Experiments have shown that the compositions of hydrate cement phase assemblages can alter rapidly, often within weeks or months, reflecting changing system compositions and temperatures [10]. Thus, thermodynamic calculations and experiments support each other: on the one hand, calculations enable more complete interpretations of limited experimental datasets and help to identify key experiments to perform; and on the other hand, experiments provide the data that are needed to validate calculation results and model parameters.
For this reason, and based on prior comments, the aim of this research was to analyze the chemical interaction among the solid phases, solid solution phases and aqueous solution in the process of the ternary cementitious system through experimental tests and using the GEMS software.
The morphology of the hydration products, the mechanical parameters and the microscopic features, such as the crystal structure, were characterized. A thermodynamic model was constructed to reveal the optimization and hydration mechanism of phosphogypsum ecological cement at a mesoscale.

2. Materials and Methodology

2.1. Materials, Mix Composition and Specimen Preparation

2.1.1. Properties of Materials

Phosphogypsum (PG), fly ash (FA) and Portland cement (PC) were utilized to prepare the phosphogypsum-based composite cementitious materials (PBM) in this study. The PG was excavated from the surface layer of a storage site, which belongs to a phosphogypsum tailings pond in Hubei province (China) and the FA was acquired from Ezhou Power Plant Group (Ezhou, China). The mean humidity of raw PG obtained from six samples was 56.7%. The PC (M 42.5 OPC, Chinese National Standard, GB 175-2007) was brought from Huaxin Cement Co., Ltd. (Wuhan, China), and the mineralogical compositions were obtained using an X-ray diffraction (XRD) analysis (see Figure 1, data provided by Huaxin) and were as follows: alite (C3S, 40.65%), belite (C2S, 34.52%), calcium aluminate (C3A, 10.87%) and ferrite (C4AF, 9.78%). The chemical compositions of PG, FA and PC were investigated by the means of X-ray fluorescence spectroscopy (XRF) and the results are presented in Table 1. The chemical characterization of raw materials is shown in Figure 2. Moreover, the physical properties of PG, FA and PC raw materials are shown in Table S1. Ordinary tap water (TW) was used to mix the raw materials.
Hemihydrate gypsum (HG) (β-CaSO4•1/2H2O, purity ≥ 97.0%) was obtained from Acros Organics, Germany and dihydrate gypsum (DG) (CaSO4•2H2O, purity ≥ 99.0%) was purchased from Sinopharm Chemical Reagent Co. Ltd., China. A polycarboxylate ether-based superplasticizer (PES) that met the ASTM C 494/C 499 M requirements. Type A and Type F water-reducing admixtures were employed in the composite cementitious materials.

2.1.2. Mix Composition

In order to investigate how the strength of the PBM materials was influenced by the impurities in the PG, the curing time and conditions, the dosage of PES, and PC, FA and solids contents, three rounds of orthogonal experiments were designed by preparing different PC (1st test), PC+FA (2nd test) and PC+PES (3rd test) specimens with the use of different calcium sources (HG and DG), cementitious material contents (80%, 61% and 19% by weight) and percentages of PES (0%, 0.91%, 0.95%, 0.98% and 1.03% by weight) under two curing conditions (dry chamber and moist curing). The water to solid ratio (W/S) and water to cement ratio (W/C) used were equal to 1:3 and 1:1, respectively. A summary of orthogonal experiments and mix composition of specimens is presented in Table 2.

2.1.3. Specimen Preparation

Firstly, five raw materials (PC, FA, HG, DG, PG, PES) were weighed by an electronic scale with an accuracy of 0.01 g and then mixed with TW according to the proportioning scheme until the slurry was fully dispersed. Secondly, the slurry was poured into a standard triple molds with a dimension of 70.7 mm × 70.7 mm × 70.7 mm, then placed in a curing box, in which the temperature and humidity were set for either dry chamber (T = 60 ± 2 °C, Water ≤ 5%) and moist curing (T = 20 ± 1 °C, Water ≥ 95%) for a predetermined time of 3, 7, 28, 90 or 180 days. All the samples were divided into two groups. One group of these PBM materials was tested for the compressive strengths. Another group of these samples was dried using a vacuum drying oven to a constant mass, and then crushed and collected to enable the characterization of their morphology and pore size distribution. The entire process of the PBM material specimen preparation is shown in Figure 3.

2.2. Methodology

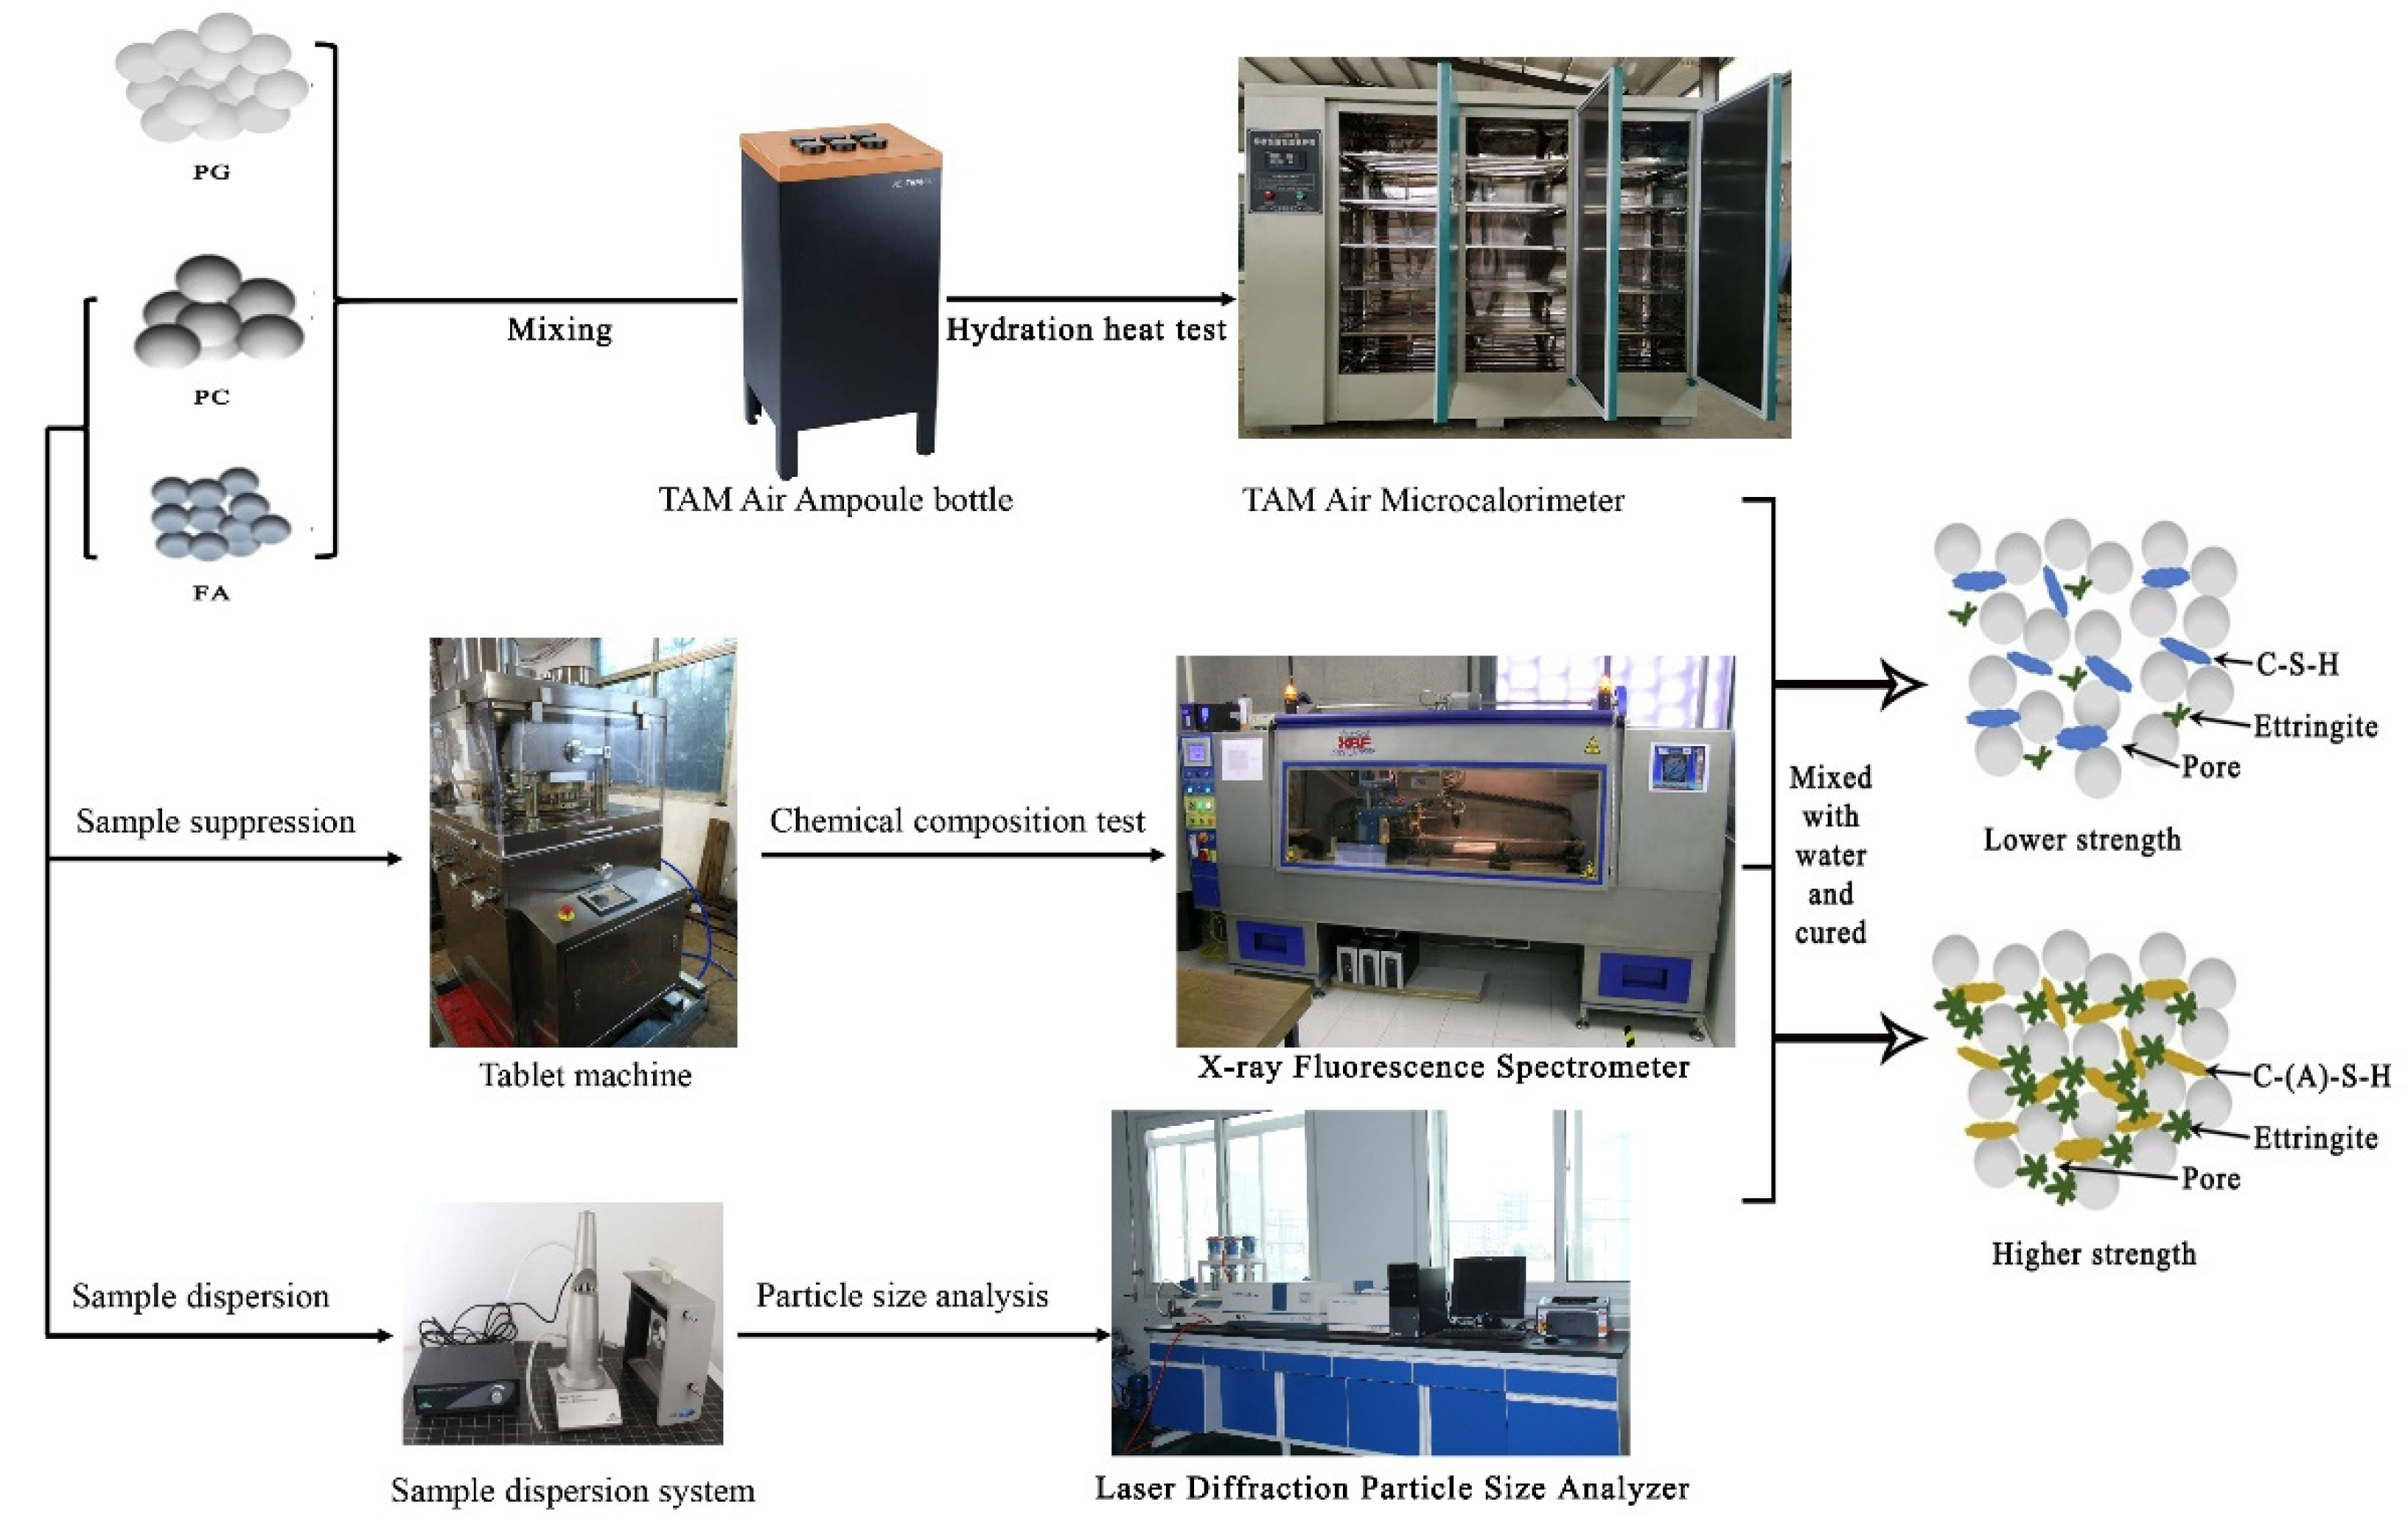
2.2.1. Experimental Test Methods

Because cement is a multiphase material, the chemical reactions of the PBM materials are more complicated. It was necessary to start with a single-phase reaction, and then gradually improve to a multi-phase reaction based on different degrees of simplification and assumptions. The main experimental research carried out in this study included macroscopic and microscopic experimental test methods, which provide data support for calculating the contents of the hydration products and hydration mechanism. The main experimental methods and software used are shown in Table 3; for more details, see Supporting Materials S2.

2.2.2. Thermodynamic Modelling

The quality of thermodynamic modeling results depends directly on the accuracy and completeness of the input thermodynamic properties of the substances and the phase conversion switch, which are usually supplied from a thermodynamic database [11]. Moreover, chemical thermodynamic modeling consists of calculating the chemical speciation (i.e., amounts or concentrations of chemical components in all phases present in the equilibrium state) from the total bulk composition of the system and the thermodynamic data for the component [12].
Therefore, thermodynamic calculations were carried out using a geochemical software GEM-Selektor v.3 (GEMS) based on the Gibbs free energy minimization theory [13], and the thermodynamic properties of the aqueous complexes came from the cement database Cemdata 18 and Thermochimie database [14], which qualitatively compute equilibrium phase assemblages and speciation in complex hydration processes. The databases of thermodynamic data for common cement minerals such as hydrogarnet, AFt phases, AFm phases, hydrotalcite-like phases, C-S-H phases and solubility products of solids relevant for cementitious systems were selected to model the PBM hydrate reaction. A literature review showed that the synthesis of the relevant cement hydrates required several solid precursors. These were made from analytical grade (AR) reagents. The C-S-H gel-like phase is the major hydrate in PC and blended PC paste, and the C-S-H solubility can be reliably modelled using either a solid solution model [15] or (to a limited extent) using a complexation approach. Due to the lack of appropriate thermodynamic data regarding the further phases, some hydration products, such as the fluoride and phosphorus residues, were computed and simulated as hydrogen fluoride (HF), fluorite and phosphoric acid. Therefore, the parameters were set at 0.1 MPa and 298.15K.
The process of the model represented in Figure 4 is composed of three parts: the equilib module, reaction module and phase diagram module. The equilib module calculates the concentration of the chemical species when specific elements or compounds try to reach a state of chemical equilibrium. Additionally, the equilib module offers a post- processor, where the results can be manipulated in various tabular outputs of amounts, the activity constant, fraction, elemental distributions and post-calculated activity. The reaction module can be described as the electronegativity model, which can be used to compute the changes in extensive thermodynamic properties (ΔfG0) for a single species, a mixture of species or a chemical reaction [16]. Furthermore, they are not only restricted to isothermal reactions, but also equilibrium constants. The phase diagram module can be described as the polyhedral model for S0, Cp and V, which can calculate unary, binary, ternary and multicomponent phase diagrams.
For the electronegativity-based part, seven unknowns ΔGO=Ca, ΔGO=Caext, ΔGO=SiO, ΔGO=SiH, ΔGO=Al, ΔGO=H2OOH and ΔGO=H2Ohyd are determined by minimization of the squared difference between the ΔfG0 calculated for each mineral and the experimental values. For the polyhedral part, six unknowns are refined by minimization of the squared differences between observed and calculated values, for each property [17]. The results of the model refinements are reported in Table 4.

3. Results and Discussion

3.1. Experimental Results

3.1.1. Uniaxial Compressive Strength
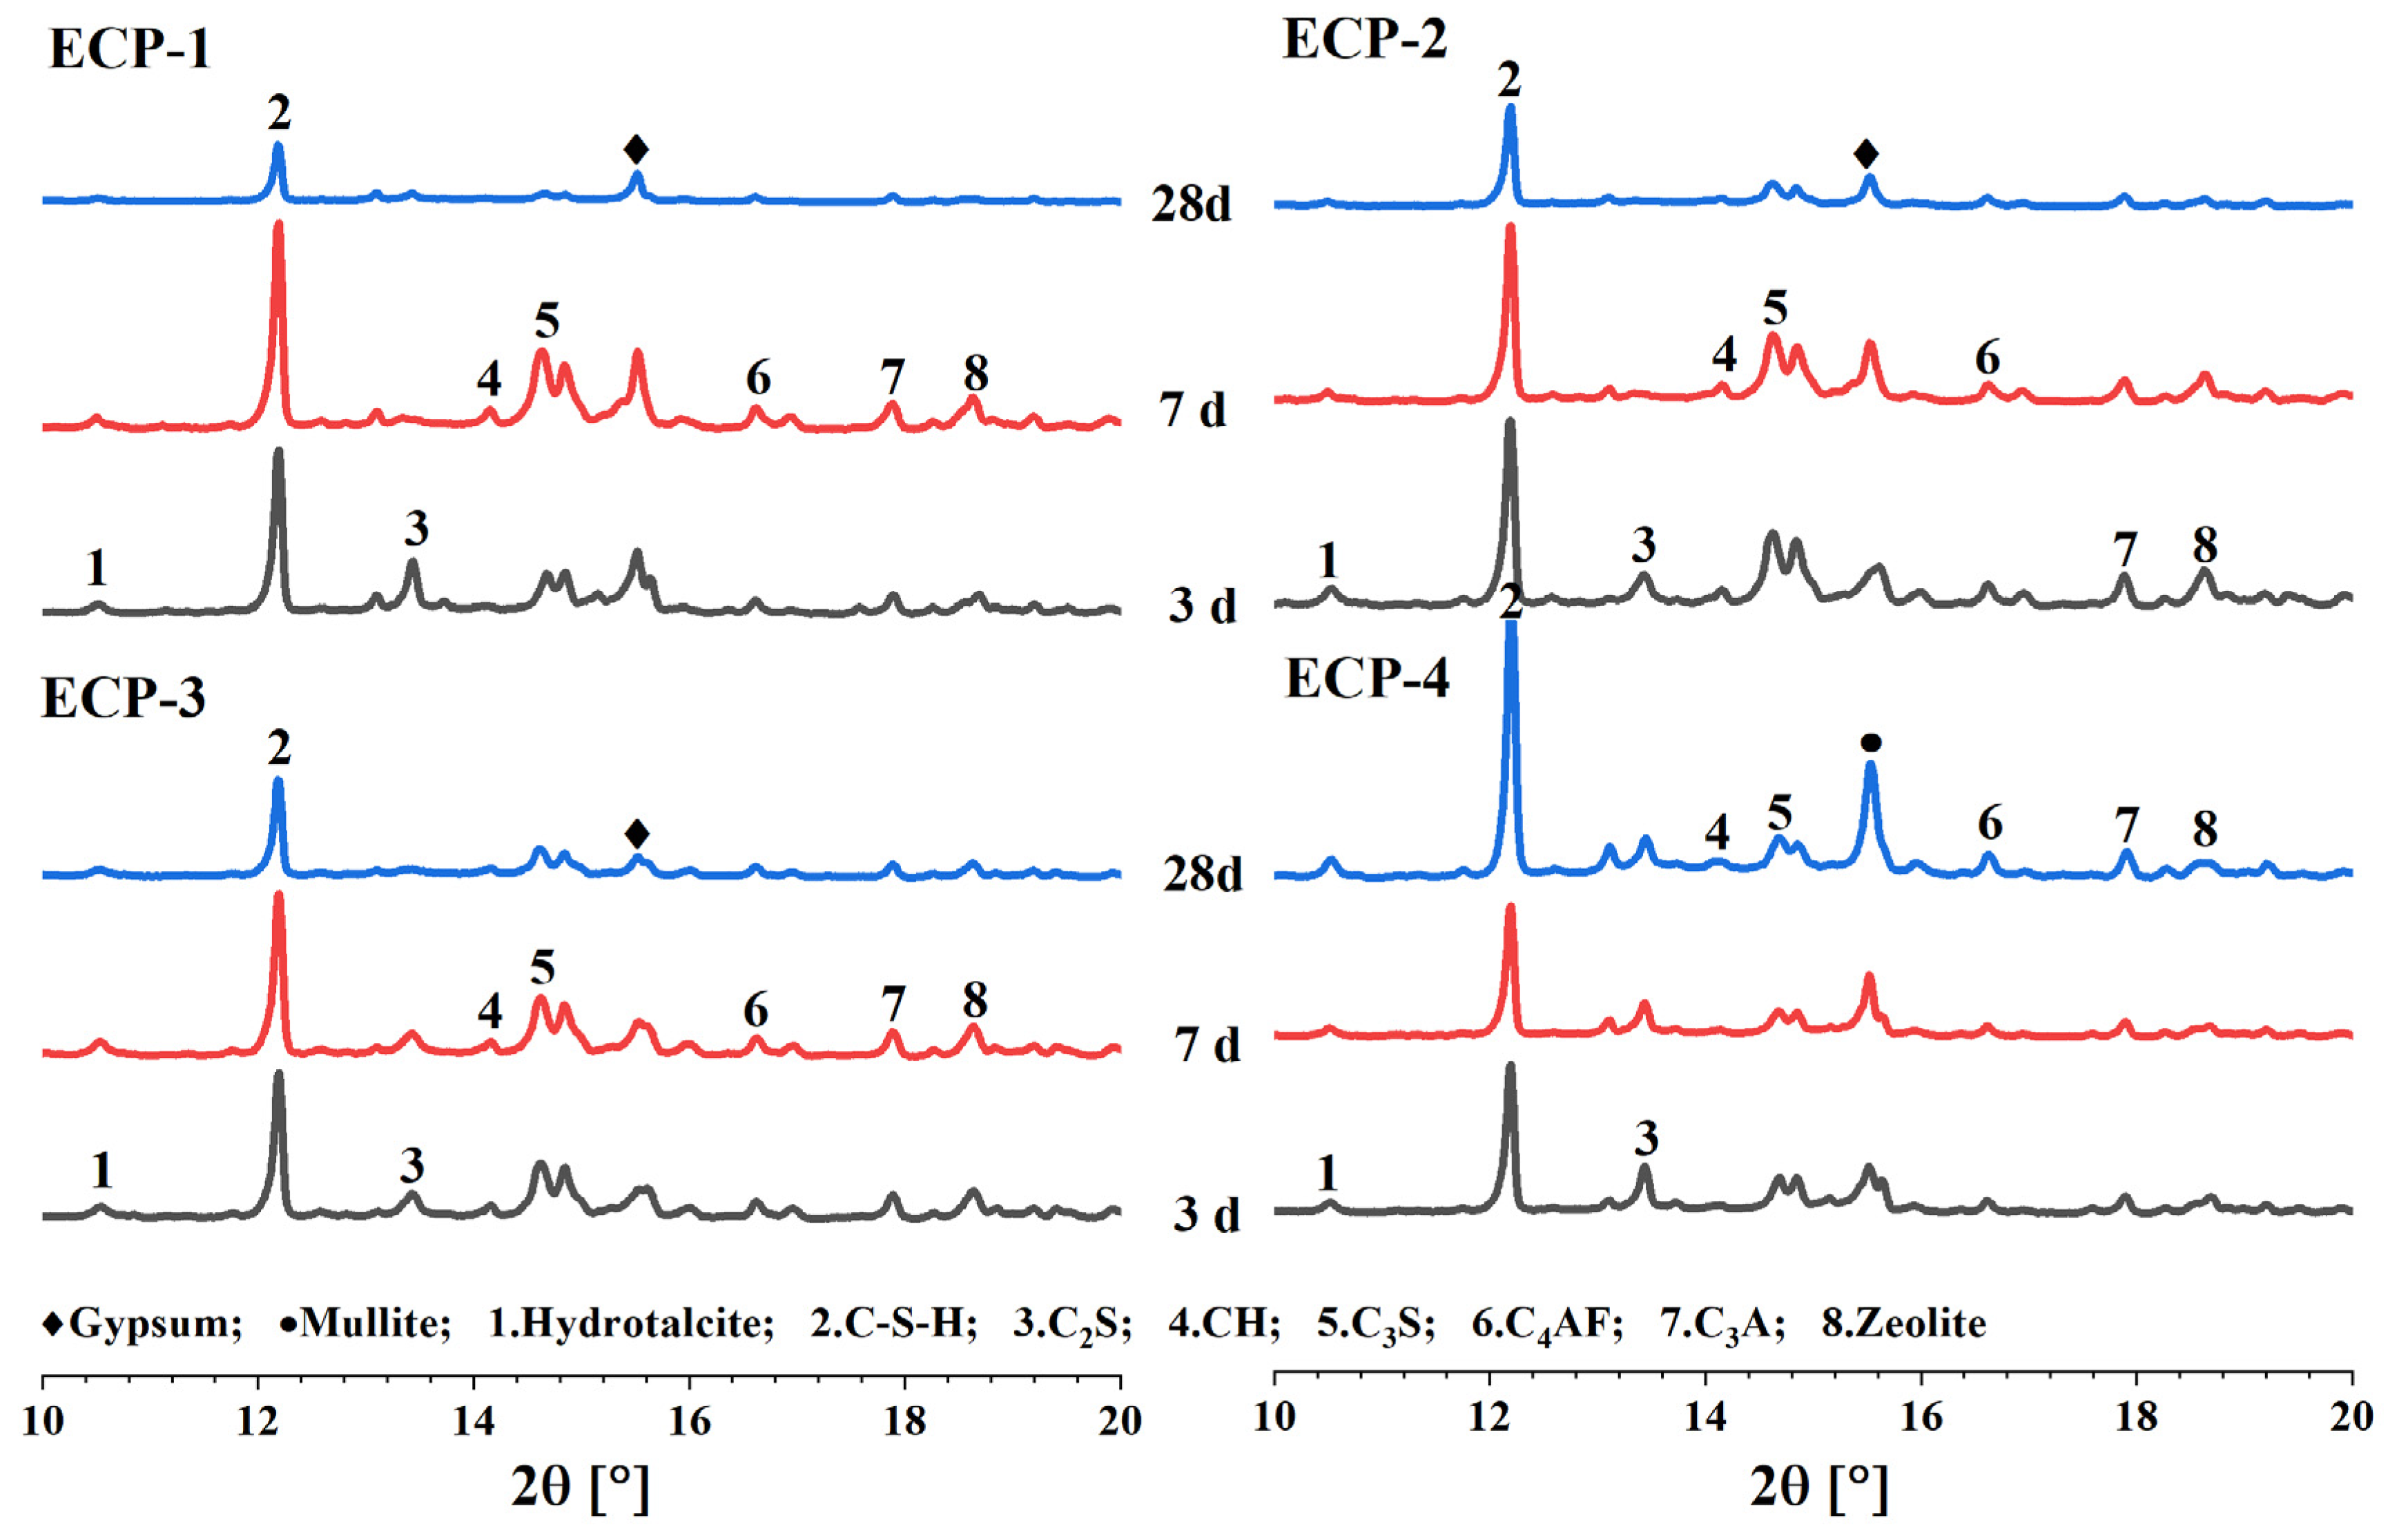
The PBM materials cured under different curing conditions had different technical properties. At shown in Table 5, the PBM materials cured under moist curing conditions were found to achieve higher compressive strength values than those cured under dry chamber conditions. In addition, the PBM materials had already evolved a certain strength at 28 days, which was still comparatively lower, because the hydration was suppressed as the content of soluble phosphogypsum gradually decreases.
In the ECP system, the UCS of ECP-1 (58.6 MPa) and ECP-2 (76.9 MPa) were lower than the UCS of ECP-3 (85.7 MPa) and ECP-4 (92.1 MPa). Samples of ECP-1,2,3,4 were selected for XRD and mineralogical studies. The probable reason is that some of these hydrates are crystalline phases with layered structure such as the AFm phases or ettringite-type, as well as the AFm and AFt phases, which have different hydration states (i.e., varying molar water content) depending on the exposure condition, which can impact the volume stability porosity and density of the hydrate paste in the ECP systems. And another reason may be the effect of the reduced humidity in the dry chamber on the strength development. Combined with the observations from the UCS test, it can be observed that the early robustness of the PBM with higher dissolved PG was poor. Besides, the PG affects the alkalinity of the solution [18], which is also detrimental to the development of ettringite, leading to lower strength values at the early stage. In addition, the experimental investigation showed that the presence of calcium carbonate prevents the destabilization of ettringite to monosulfonate under long hydration times and stabilizes monocarbonate together with ettringite [19]. At the later stage, the C-S-H and C-A-H gels were gradually carbonized and converted into a gel with a high extent of polymerization, which generates new capillary pores. Furthermore, in the C-S-H gel-like phases, water can be present within the intrinsic gel porosity, as well as in its interlayer. Unfortunately, until recently, there was no thermodynamic model capable of assessing this varying water content.

3.1.2. XRD Analysis

In the microstructure characterization of the PBM, the minerals and hydration products are the two main phases that were intensively investigated. The X-ray diffractograms of the hydration products of the ECP-1, 2, 3 and 4 at the curing age of 3, 7 and 28 days are shown in Figure 5, which shows that the spectral lines of the hydration products mainly took the form of dispersed peaks, and the phases mainly included HT (Hydrotalcite), C2S, C3S, C4AF, C3A and unhydrated mineral admixture phases.
A selection of X-rays patterns between 10° and 20° (2θ) for hydrated pastes in the ECP system was plotted and the characteristic peak of calcium silicate hydrates (C-S-H) appeared between 12°~13°. The C-S-H phases had a variable composition that depended on the prevailing Ca/Si ratio in the ECP system, which can change by pozzolanic reaction and leaching caused by the ingress of water and/or chemical attack, such as HF.
There was a dispersion peak in the range of 2θ from 14° to 16°, which was more obvious at 3 days and 7 days. This indicates that the intensity of the diffraction peaks of C2S, C3S and mineral admixture phase components decreased continuously with the prolongation of the reaction time, when the composite cementitious materials were continuously hydrated to form AFt crystals during the curing period. The literature shows that [20] when a large amount of minerals are present, a variety of ions are replaced to form complex compounds. Due to the continuous dissolution and hydration of phosphogypsum calcium ions, a small amount of the HT and CH phases appeared, and the crystallinity of CH generated by hydration was relatively poor. As the reaction progresses, it was absorbed by the cement hydration products, making it difficult for CH to reach saturation, resulting in the diffraction peak of CH being relatively weak and inconspicuous at 28 days. According to investigations by Idawati Ismail et al. [21], the C-S-H phase may sorb sulfate, alumina and alkalis. The partial substitution of FA slowed down the formation of the C-A-S-H binding gel as a consequence of Al and Si release over time along with the formation of hybrid C-N-A-S-H gels.

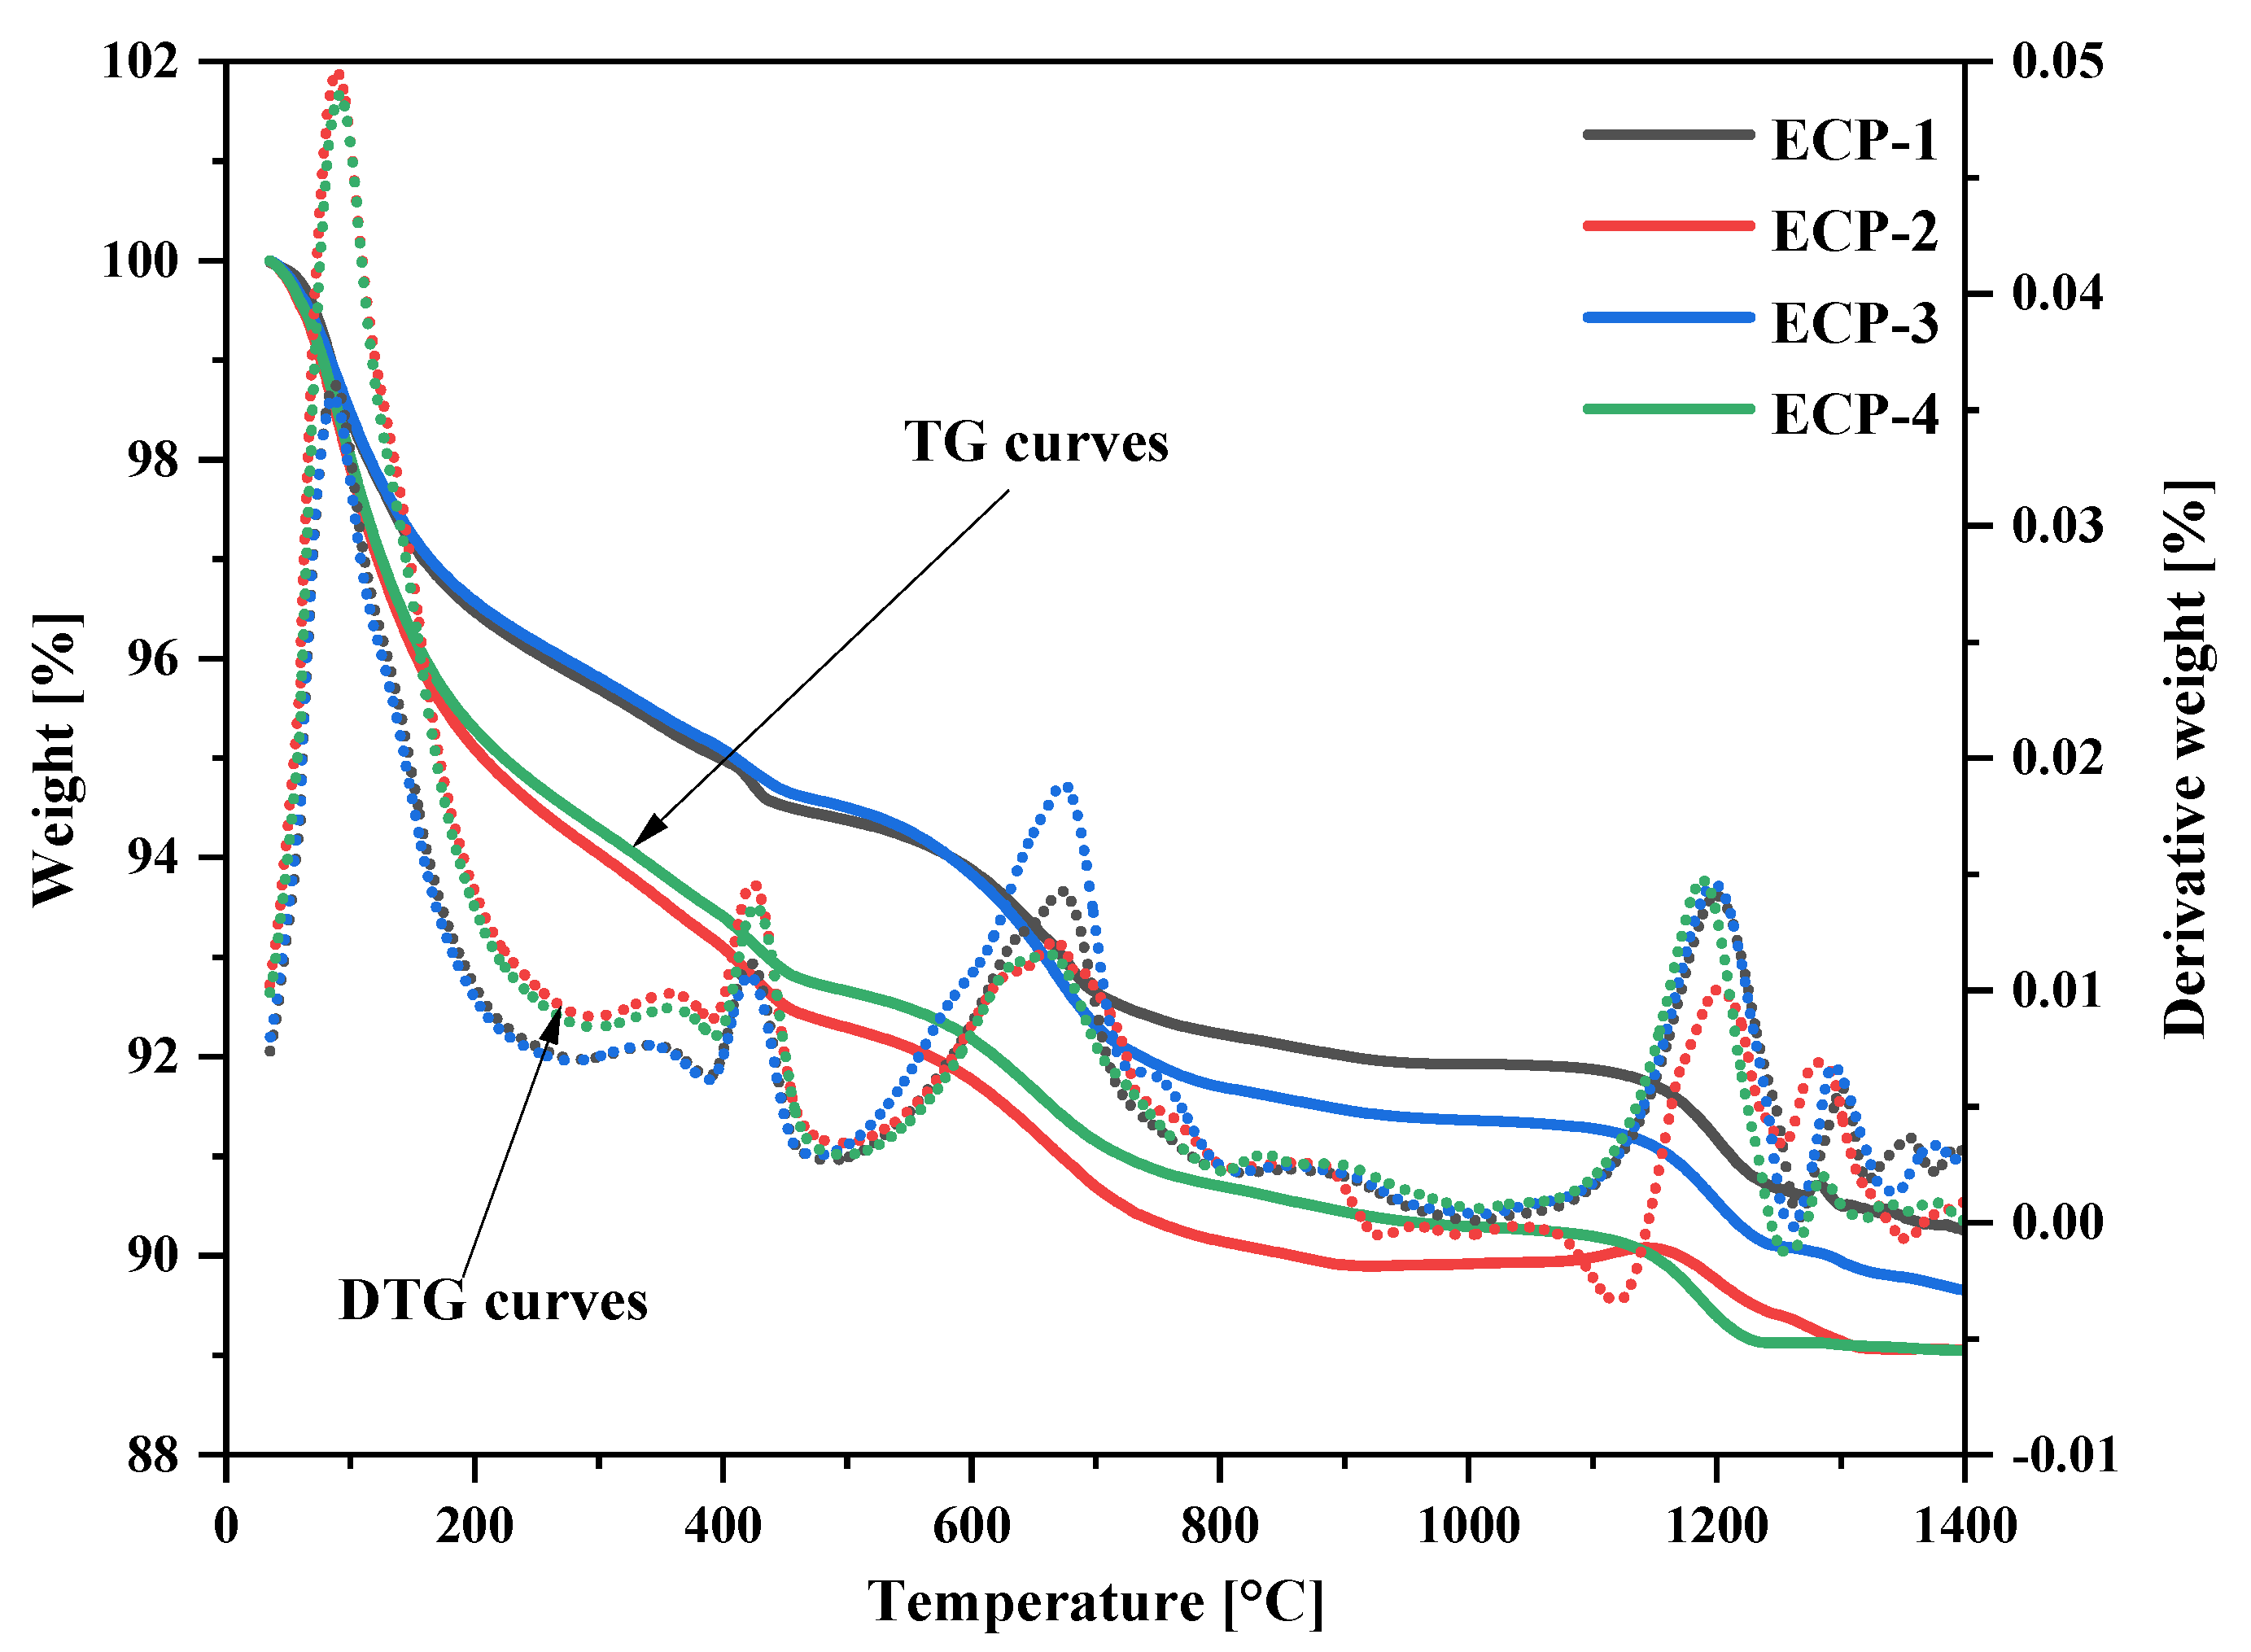
3.1.3. TG-DTG Analysis

Figure 6 shows the TG-DTG curves of hydrated ECP samples. In this figure, the first peak (between 98 °C and 102 °C) represents the immediate drop in weight due to the dehydration of water molecules in the hydration products—the ettringite, gypsum and C-S-H. The second peak (420°C to 440 °C) comes from the dehydroxylation of CH and PG. The third peak of the weight loss (660°C to 680 °C) represents the calcite decomposition. Because the FA has not been activated, and the C2S occurs a characteristic transformation. The last peak (750°C to 770 °C) reveals the C-S-H gels transforming from colloidal to flocculent crystals, which is mainly caused by the transformation from Aft crystals to Afm crystals [22].
Compared with the XRD analysis results, it can be seen that the endothermic peaks corresponding to AFt, C-S-H and CH increased with the increase in the PG content. The addition of PG promoted the formation of ettringite (AFt) and the dissolution of C3S, thereby accelerating the early hydrate reaction of the ECP. During the hydration process, almost all of the FA participated in the reaction, but there still remained a small amount of unreacted PG. The main reason for this was that a small amount of soluble phosphorus containing impurities in PG will react with the CH to form the insoluble salt calcium phosphate, which impedes the normal hydration of PG and C3A. The formation of solid solutions between Al- and Fe-containing endmembers has been observed for ettringite, siliceous hydrogarnet, monosulfate and Friedel’s salt, while no solid solution formed between the rhombohedral Fe-monocarbonate with the triclinic Al-monocarbonate due to the structural differences. At the same time, the mass loss of the specimen between 98 °C and 102 °C indicates that the hydration of the hardened slurry was still ongoing at 28 days, and its hydration products increased continuously, ensuring the continuous increase in ECP strength. Something interesting to note is that the decomposition and reformation of ettringite took place reversibly but with a marked hysteresis, which makes the estimation of thermodynamic properties difficult.

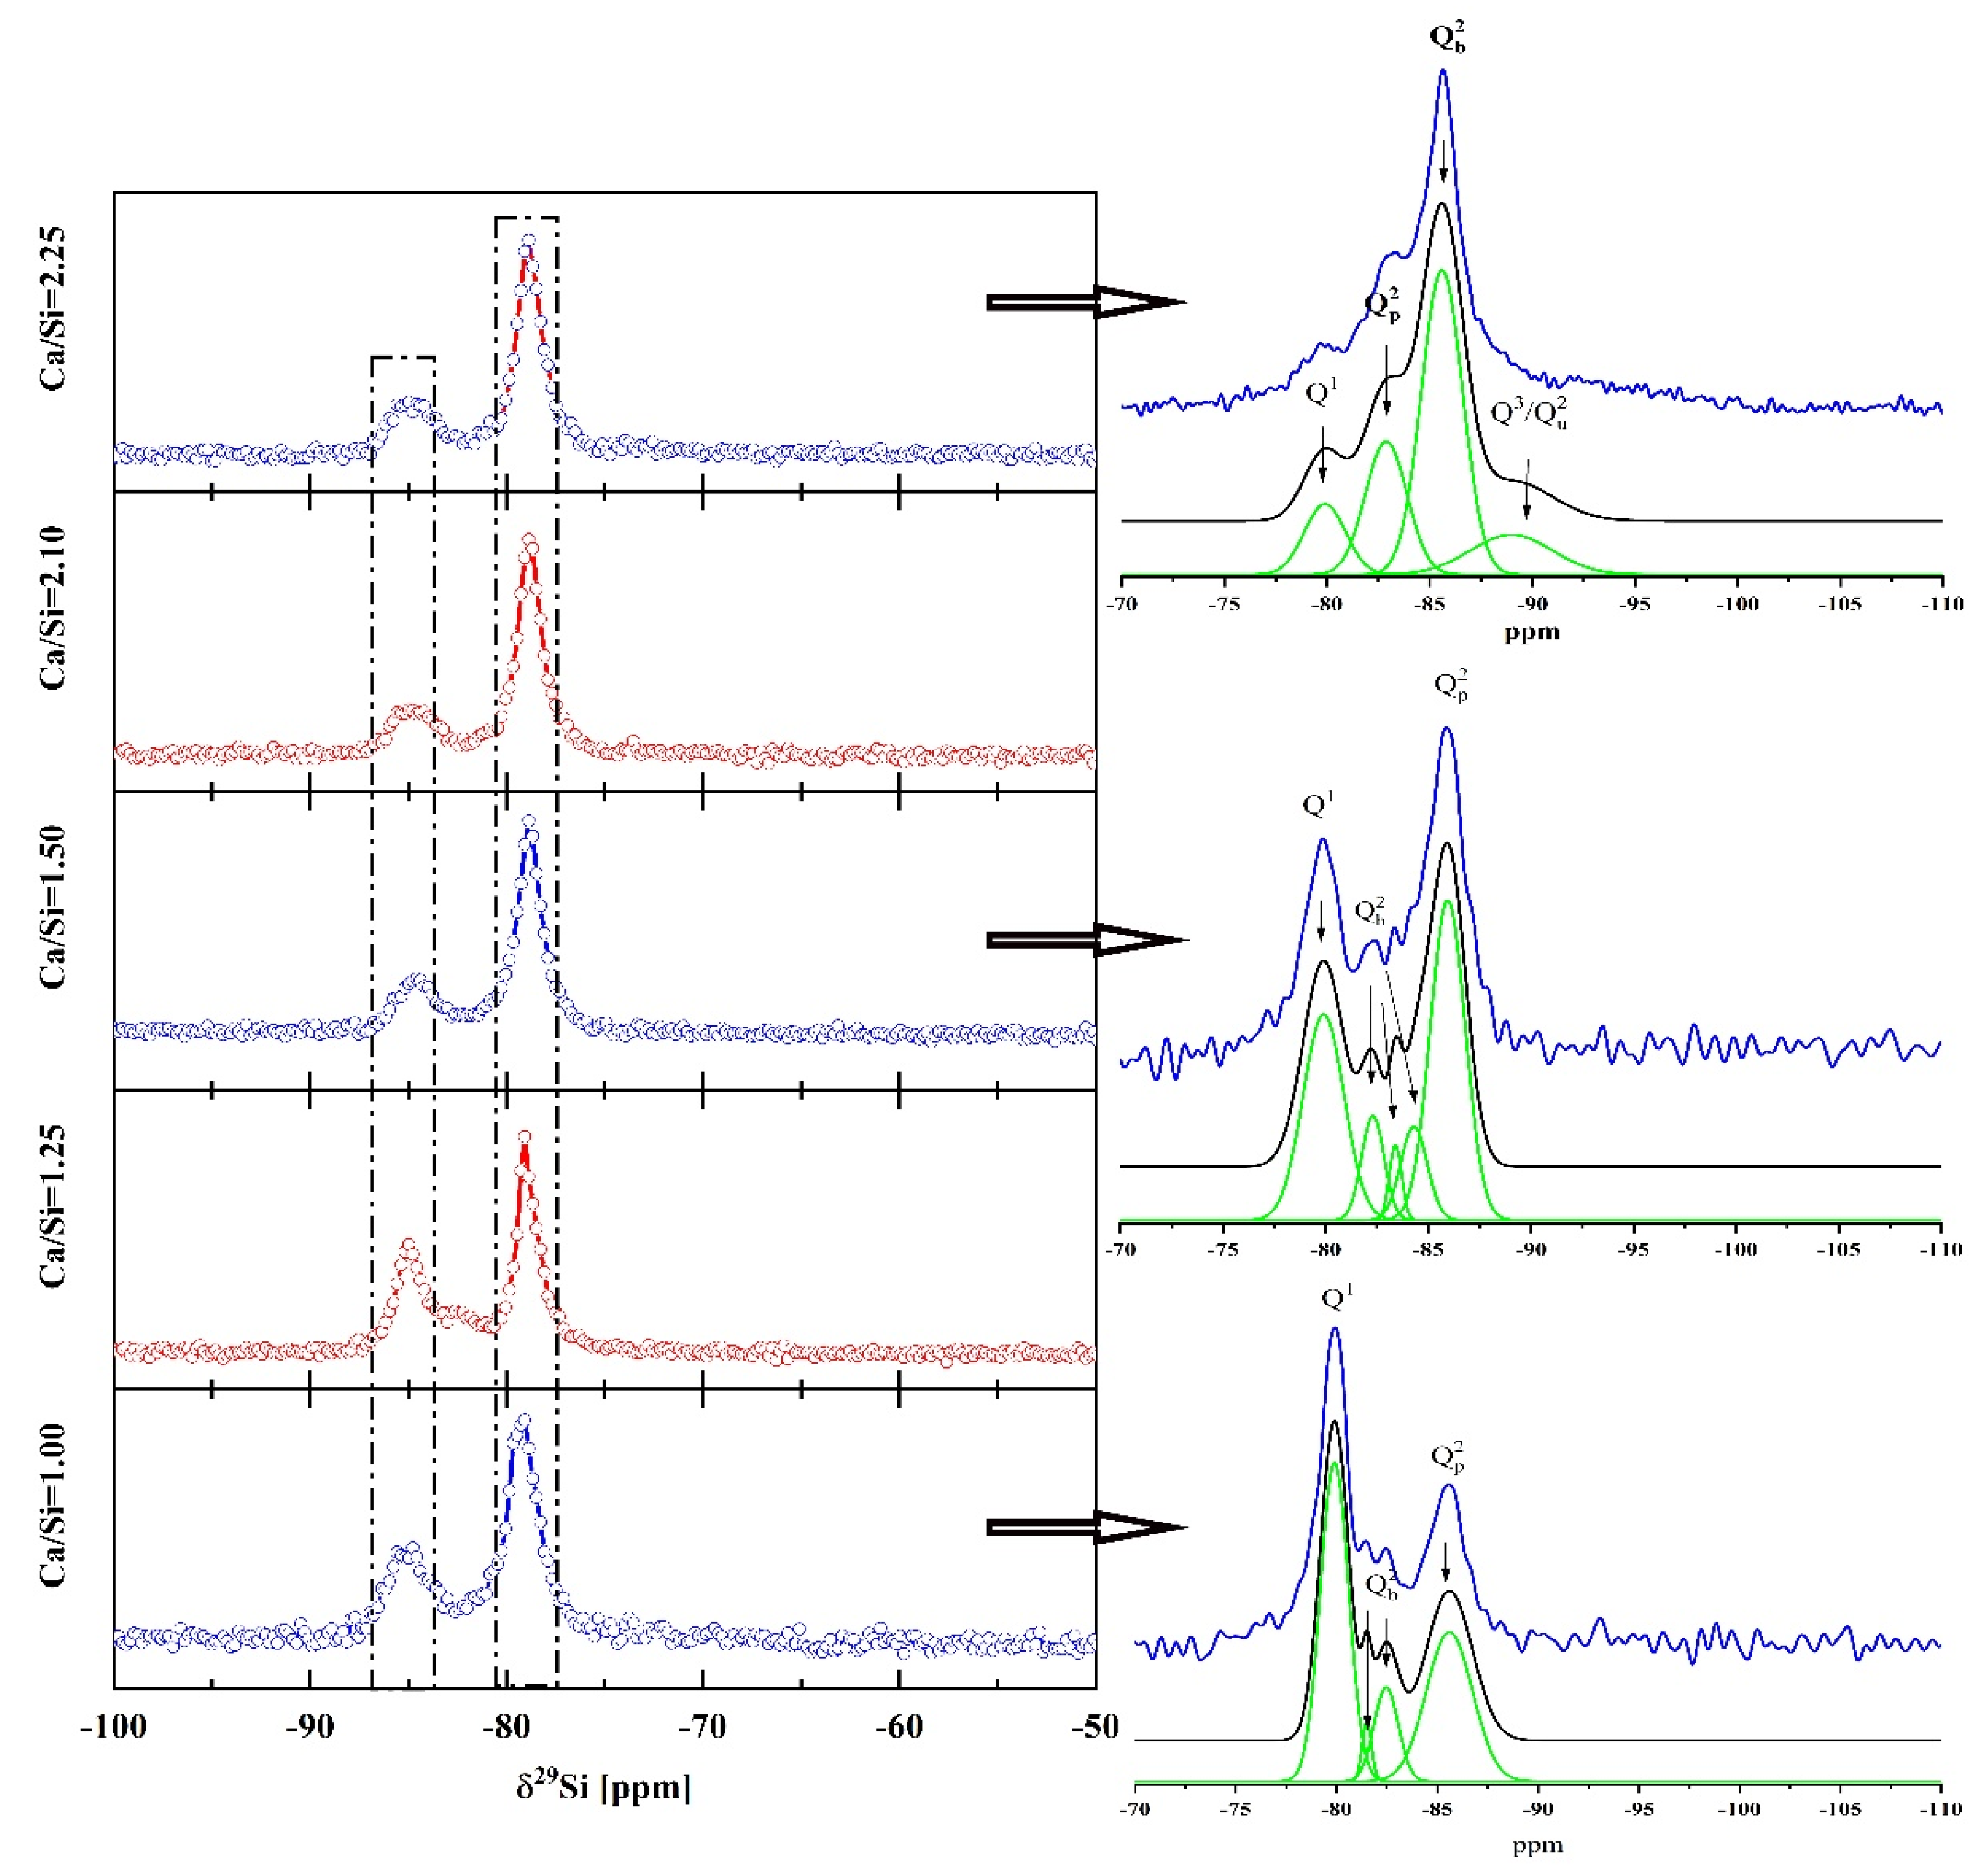
3.1.4. 29Si MAS-NMR Analysis

Figure 7 shows the 29Si MAS-NMR spectrum of the deconvolution of signals for ECP at the curing age of 28 days. Firstly, there was a Q1 spectral signal at −79 ppm and −85 ppm, which is related to the end unit of the silicon chain. Next, there was a Q2(1Al) spectral signal at −82 ppm, which represents the Al ionic bond contained in the adjacent tetrahedron. In addition, the Q2 spectrum signal at −85 ppm indicates that C-S-H gels were generated in hydration products. The main assumption was that the incorporation of Ca2+ ions in the interlayer occurs simultaneously with the removal of a bridging tetrahedron in the silica “dreierketten” chain, and this process is reversible. Excess calcium can also be incorporated as Ca(OH)2 moiety, either interstitially in the Tobermorite interlayer, or forming domains of a Jennite-like structure. The larger spectral intensity indicates that a larger average silicon chain was required to synthesize C-S-H. To sum up, the increase in the PG content can accelerate the dissolution of C3S and the polymerization and transformation of the C-S-H gel, which can partially convert C-S-H gels to more densified C-A-S-H gels. The calcium aluminosilicate hydrate (C-A-S-H) gel-like phase that precipitates alkali-activated cements contains significantly less Ca, and more Al and alkali, and has a more densely packed structure than the C-S-H that forms in hydrated ECP materials [23].
The C-S-H experimental solubility data showed that C-S-H has a “defect-Tobermorite” structure with a mean silicate chain length depending on the Ca/Si ratio, pH and the presence of aluminum [24]. It has variable “non-gel” water content (i.e., structural water and water present in the interlayer), also depending on the Ca/Si ratio and the synthesis router, variable particle morphology, stacking and “gel” water content, i.e., water present between C-S-H particles. Figure 8 shows the 29Si NMR spectra of the composites with different Ca/Si ratios. The 29Si NMR spectrum has three main peaks at −78 ppm, −81 ppm and −85 ppm, corresponding to the sites of Q1, QP2(1AlIV) and Q2 in the silicon chain (dreierketten structure), grafted on both sides of CaO2 layer, respectively. The difference of these sites was mainly related to Ca/Si ratios and pH values in the environment. In addition, the resonance of Q2 was mainly affected by paired QP2 and bridging site Qb2, with resonance frequencies of −85 ppm and −83 ppm, respectively. At the same time, the chemical shift of the 29Si NMR spectrum was affected by the degree of polymerization of silicon–oxygen tetrahedron. With the increase in the Ca/Si ratios, the chemical shift of 29Si gradually moved to the right, indicating that the binary hydrate was decreasing and the monomeric Si tetrahedra was increasing in the hydrate reaction.

3.2. Thermodynamic Analysis

3.2.1. Thermodynamic Parameters Determination

The thermodynamic parameters of the cement mineral phase are given in Table 6. The hydration products are mainly divided into calcium silicate hydrate (C-S-H), Ca(OH)2(CH), ettringite (AFt) and single sulfur calcium aluminate hydrate (AFm), among which the hydration of C3S, C2S and C4AF will generate CH. The corresponding hydration dynamics equation and heat balance coefficient are shown in Table 7. Studies have shown that the amount of CH generated by the complete hydration of 1 mol C3S was more than 1.3 mol. Meanwhile, since two pozzolanic reactions occur during the hydration process of FA, CH as a product of the early hydration process usually reacts with the SiO2 generated in the slurry. Thus, two types of calcium silicate hydrate phase, type C-S-H1 and type C-S-H2, are generated.
The hydration rate and hydration heat cumulative curves for ECP-1, 2, 3 and 4 are shown in Figure 9. The total hydration reaction heat of ECP ranged from 400 J/g to 550 J/g, and the peak times of the hydration rates of the four types of ECP were different. The peak value of hydration rate of ECP-1 and ECP-2 appeared early and changed rapidly, and lasted for about 3 h. The peak value of the hydration rate of ECP-3 and ECP-4 appeared in the first hour, and, in the later period, the hydration rate first decreased, then rose, before finally reaching stability. These results indicate that the early hydrate of PG could significantly change the rate of hydration, while the continuous hydrate of FA inhibited the increase in the hydration rate to a certain extent but did not affect the time at which the hydration rate change reached the extreme value. Besides the brief initial exothermic peak at the beginning of hydration, the hydration exothermic curves also include the exothermic peak, which was generated by the dissolution of C3S and the exothermic peak generated by the secondary dissolution of C3A.

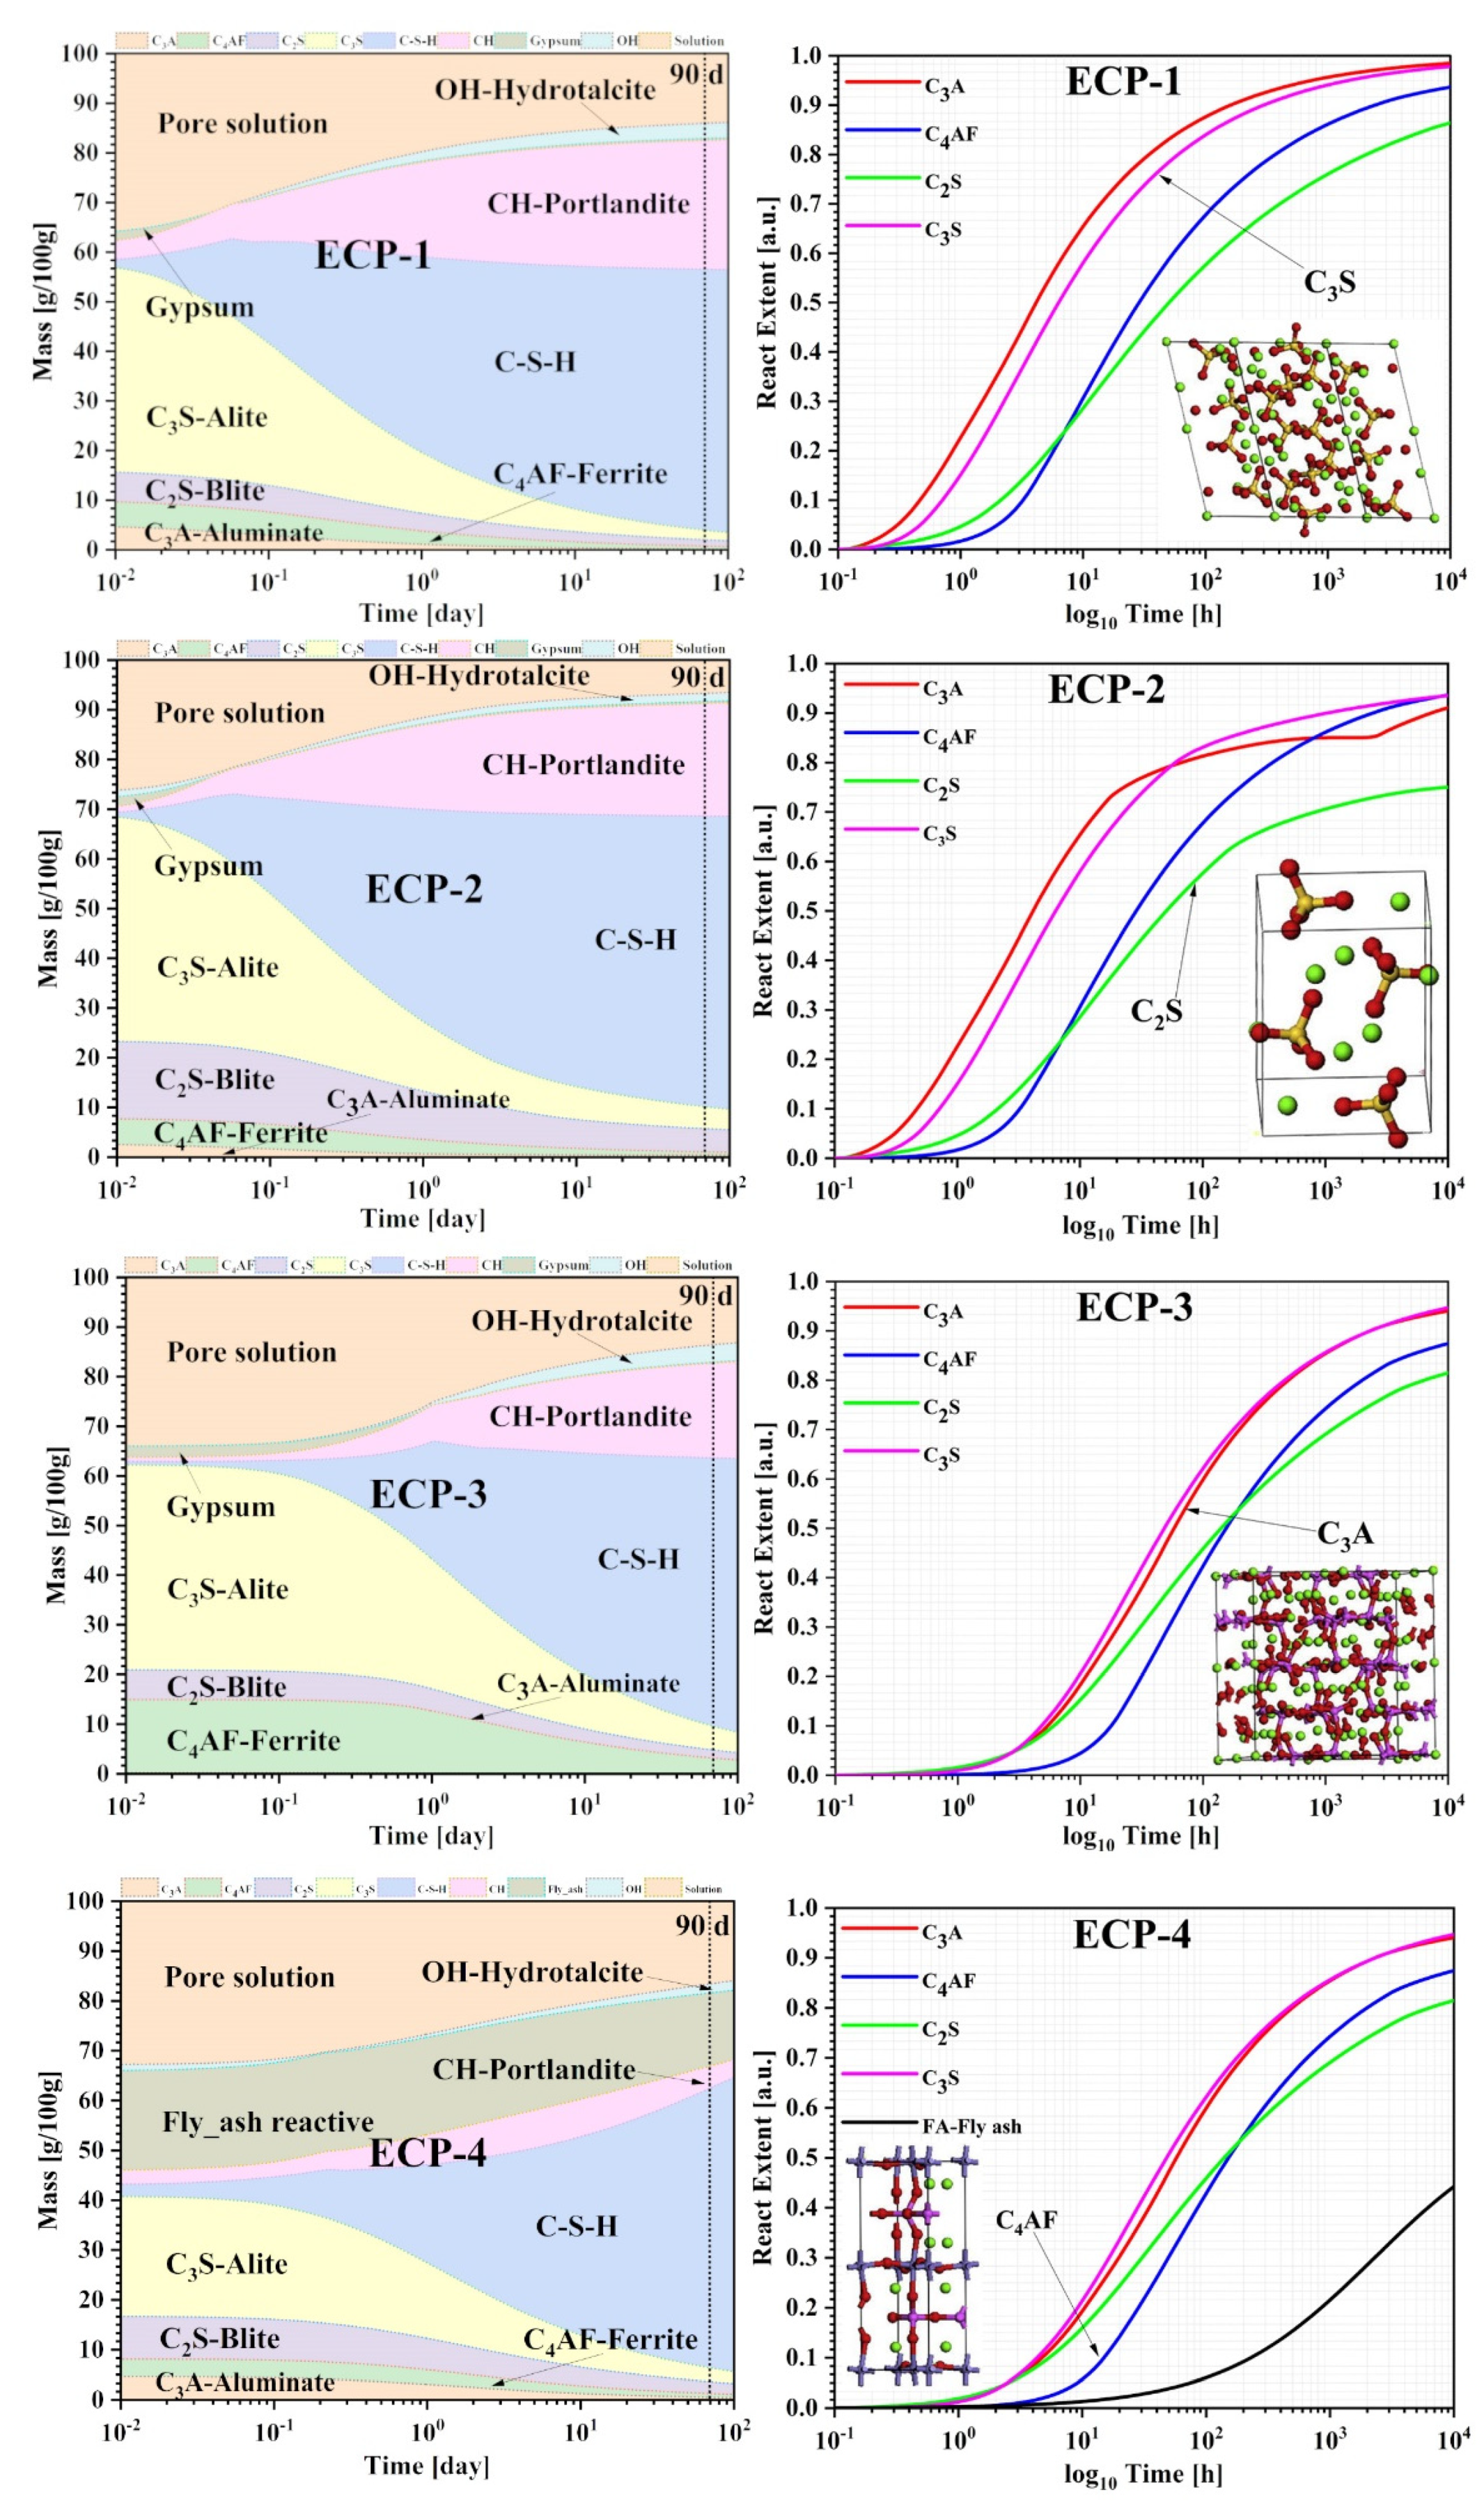
3.2.2. Simulation and Calculation Base on GEMS

The phase evolutions of the hydrate pastes under different curing conditions calculated by the GEMS software thermodynamic simulations are shown in Figure 10. It can be seen that the CH and C-S-H gels in the ECP hydration products increased with the continuous hydration, while the C3S and H2O decreased. Up to the age of 28 days, C3S and OH were still present, indicating that the hydration reaction had not been completed. In the test of ECP-1 and ECP-2, a little PG participated in the hydration at the early stage, but by the later stage of hydration, it was completely hydrated. In the test of ECP-3 and ECP-4, there were some FA mineral phases that still existed in the later hydration stage. This could be due to only part of the PG having been dissolved and hydrated with the C3A and C3S in the cement. The [SiO4]2 and [AlO4]5 networks in the FA vitreous had not depolymerized yet, and mainly participated in the reaction by the means of physical filling [25]. At the late hydration stage, the pozzolanic activity of FA [26] was gradually activated and participated in the reaction, resulting in the existence of some FA at the age of 28 days.
Meanwhile, due to the interaction between the sulfate ions and C3S and the addition of PG having delayed the initial hydration of C3S, the addition of gypsum had a promoting effect on the hydration of C3S, which mainly resulted in the changing of the C-S-H morphology and the increase in ionic strength. Ettringite (AFt) crystals inhibited the formation of Al3+ ions in the pore solution and enhanced the hydration mechanism of C3S. Accordingly, the hydrate equilibrium system was more complicated at the middle stage and later stage.

3.2.3. Thermodynamic Property Analysis

The standard formation enthalpy ΔGO and entropy So0 of each reaction phase in the ECP were used to calculate the ΔfGo generated by the dissolution reaction of each major mineral phase in the hydration products, according to the model derived from Section 2.2.2. Because the solubility product of the C-S-H gels was very small, the surface state of the silicate ions in the hydration solution and hydroxylation degree of C3S could be be determined. By comparing the findings with the calculation results present in the literature, it appears that the dissolution of the various mineral phases in the hydration reaction had not reached equilibrium. Common chemical equations and calculation models were used to calculate the gel saturation index of C3S and the C-S-H. The thermodynamic models of the C-S-H with Ca/Si ranging from 1.0 to 2.3 were constructed by NMR and other methods to demonstrate the possibility of polymorphic optimization in the hydration products under different Ca/Si ratios, thereby explaining the correlation between C-S-H formation and C3S and redecomposed ion groups during the hydration reaction. Combining the thermodynamic model and above-mentioned data, the decomposition of the considered minerals into their constituent oxides and the solid solution models of the C-S-H at the age of 28 days could be calculated, and these are summarized in Table 8.
Figure 11 shows the variation in the characteristic values of the hydration kinetics parameter for the C-S-H oxide-solution model data with the Ca/Si ratio in ECP. As can be seen from Figure 11, the values of mineral single-phase CaO, SiO2H and H2Ohyd in the hydration products gradually increased with the increase in the Ca/Si ratio; when the Ca/Si ratios were high or low, the maximum dissolution rate and the amount of dissolution in the early cement and phosphogypsum both increased, with a different duration and a different hydration mechanism. At this time, with the continuous progress of the reaction, the values of CaOext and H2OOH were in a proportional relationship, mainly manifested in the acidic environment formed by the early hydration of PG with water, which led to the continuous dissolution of the Ca2+ in the hydration solution and accelerated the ionization of H2O. When the Ca/Si ratio was relatively high, the cement hydrated at the early stage, making the hydration environment weakly alkaline [27], which promoted the generation of phosphate hydration products such as PG and accelerated the consumption of the hydration products in the cement, thus promoting the acceleration of the ionization of H2O. From the perspective of the entire hydration process of the ECP, the dissolution process of PG, FA and PC, the formation process of the amorphous phase, and the formation process of C3S and C-S-H gels proceeded sequentially, but these processes partially overlapped [28]. Regarding the emergence time of the former process and its influence on the latter process, when Ca/Si = 2.25 in the ECP, the formation process of the amorphous phase, as with the SiO2 in the FA, was followed by the dissolution of the PG and the time difference between the two processes was very small, which can be confirmed by subgroup analysis. The formation process of the amorphous phase during the formation of the ECP hydration products was a key factor affecting the quantity and type of hydration products [29].

4. Evolution Mechanism of the Hydration Reaction

Figure 12 shows the ternary phase diagram of the main hydration products in the ECP system. The hydration reaction mechanism of the various raw materials in the ECP can be characterized as follows: at the initial stage of the reaction, C3A and C4AF are the first to be hydrated. Calcium sulfate dihydrate reacts with CaO and Al2O3 to generate AFt needle-like crystals, which evolve from cement particles to form bridges. Subsequently, a large amount of Ca(OH)2 and low-density C-S-H gels are generated via the hydration of C3S and β-C2S. Parts of CH are precipitated and filled in the crystal space structure formed by the low-density C-S-H gel and PG particles. Finally, the low-density C-S-H gels are further hydrated to form plate-like high-density C-S-H and C-A-S-H gels.
The results of this study demonstrate that PBM is a three-phase composite material, where hydration is the consequence of the co-hydration of multiple minerals. The nucleation process is a reaction involving solid, liquid and gaseous phases, which passes through four stages.
I: Physical and chemical mixing and modification treatment. The PG, PC and FA are pulverized in a certain proportion to form a slurry and dissolved to provide a good hydration environment.
II: Modification and hydration with low calcium content. The hydration of the three materials produces plasma like [SiO4]2−, Ca2+, [AlO4]5−, [CaSiO4]2− and OH, breaking any chemical bonds, and repolymerizing to form new hydrates on the surface particles, which adhere to the solid, gradually forming an irregular surface layer and pore structure. This phase mainly involves ions of [SiO4]2−, dissolved by C3S and C2S, which react with calcium aluminate to form AFt, and then combinate with Al2O3 and SiO2, dissolving the FA and producing C-S-H gels, which form the ettringite framework. The growth of C-S-H, the product of hydration in this phase, occurs mainly on the surface of the mineral mud particle.
III: Secondary hydration. The hydration products react with free ions to gradually form C-S-H and irregular crystals that bridge each other to form a layer and network structure and then combine to form a new silicate framework. Part of the crystals and unreacted particles are filled into the framework and pore structure, resulting in a certain strength of the materials. This phase occurs mainly because the vitreous structure of C3A in the PC is stimulated to depolymerize by the Ca(OH)2 in the hydration solution. Since the C-S-H growth is intertwined at different nucleation sites on the surface of the slurry mineral particles, the inter-gel pores are formed between the products of hydration.
IV: High calcium condensation and geoplymencation. As the hydration progresses, the insufficiently reacted plasma of Ca2+, [AlO4]5−, [CaSiO4]2− and OH in the slurry and segment of the C-S-H repolymerize to form C-A-S-H. Eventually, the PBM slowly solidifies and forms with new mineral crystals and C-S-H.

5. Conclusions

(1)
Macro and micro experimental analysis showed that the addition of PG at the early stage promoted the formation of AFt, dissolution of C3S, polymerization of C-S-H gels and morphological transformation. The amount of AFt crystals first increased, then decreased, and then increased again with the increase in the PG content, and the [SO4]2− generated by its dissolution could stimulate the activity of the FA. The synergistic promoting effect of PG and FA was confirmed. The hydration products were generated slowly in the early stage and increased rapidly in the later stage, during which AFt crystals were inserted into the C-S-H gels to make the structure of the whole hardened slurry more dense.
(2)
The thermodynamic model of ECP was established, and the thermodynamic properties were simply simulated by GEMS, which can quantitatively explain the dissolution of the C3S and the formation and evolution of the C-S-H gels between the PG-FA mineral admixture and hydration products of PC. The values of mineral single-phase CaO, SiO2H and H2Ohyd in hydration products gradually increased with the increase in the Ca/Si ratios. The values of CaOext and H2OOH were proportional, while the values of SiO2H and SiO2 were inversely proportional.
(3)
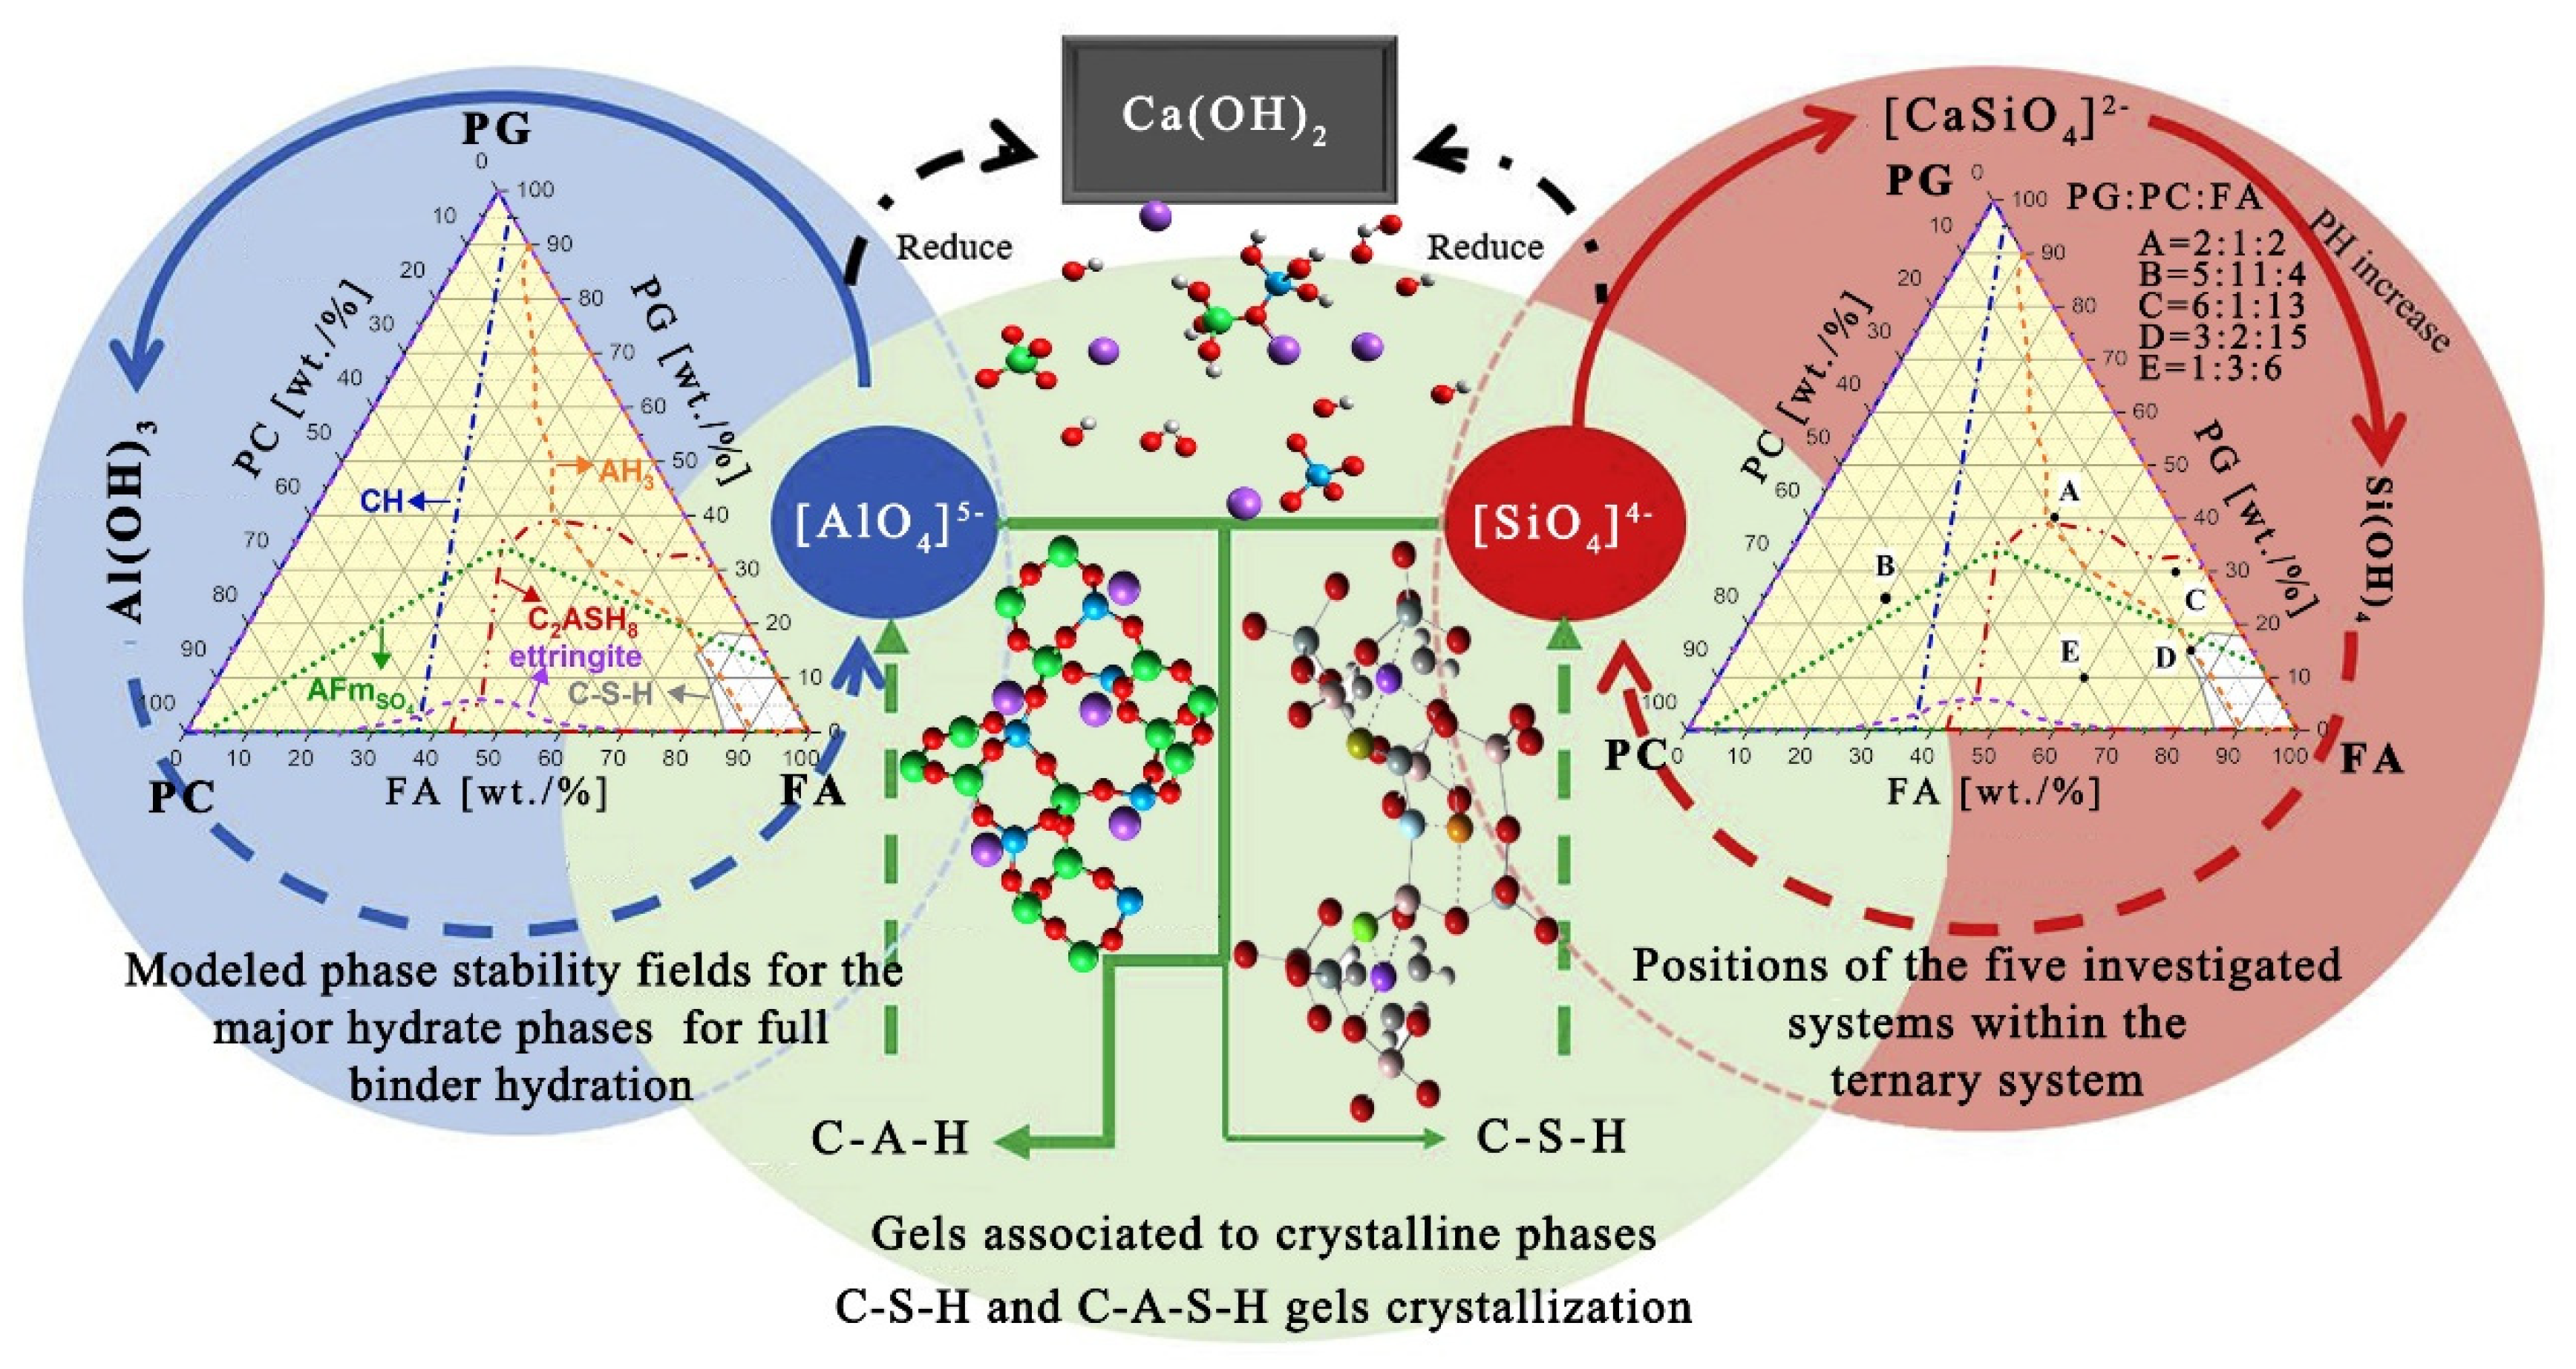
The evolution law of the hydration product structure entails that PG generates [SiO4]2− ions by ionization and Ca-O-Ca and Si-O-Si covalent bonds break when they encounter alkali conditions combined with Si-O-Si, Al-O-Al, Al-O and Si-O covalent bonds broken by the PC. At the same time, it reunites with [SiO4]2− and [AlO4]5− ions ionized by the FA and is polymerized to form stable C-S-H and C-A-S-H hexahedral network structures.

Supplementary Materials

The following are available online at https://www.mdpi.com/article/10.3390/app12178726/s1. Table S1. Physical parameters of PG, FA and PC raw materials. Table S2. Chemical composition of PG obtained from the XRD quantitative analysis and XRF quantification.

Author Contributions

Conceptualization, J.H.; Investigation, X.N.; Methodology, J.H. and X.N.; Project administration, B.M.; Resources, X.N.; Writing—original draft, J.H.; Writing—review & editing, B.M. All authors have read and agreed to the published version of the manuscript.

Funding

This research received no external funding.

Institutional Review Board Statement

Not applicable.

Informed Consent Statement

Not applicable.

Data Availability Statement

No new data were created or analyzed in this study. Data sharing is not applicable to this article.

Conflicts of Interest

The authors declare no conflict of interest.

Abbreviations

ΔƒGoThe free energy of formation from the constituent oxides, kJ/mol
ΔGOThe electronegativity of the cation i in the crystalline environment of the mineral, kJ/mol;
ΔƒHoEnthalpy of reaction, kJ/mol;
SoHeat capacity, J/mol·K;
MMolar mass, kg·mol−1;
CpStandard molar heat capacity of species at T, P, (J·K−1·mol−1);
VoStandard molar volume (cm3·mol−1);
VmMolar volume, m3/mol.

References

  1. National Development and Reform Commission. China Resources Comprehensive Utilization Annual Report (2014); Recyclable Resources and Circular Economy; National Development and Reform Commission: Beijing, China, 2014. [Google Scholar]
  2. Shi, C.; Jiménez, A.F.; Palomo, A. New Cements for the 21st Century: The Pursuit of an Alternative to Portland Cement. Cem. Concr. Res. 2011, 41, 750–763. [Google Scholar] [CrossRef]
  3. Wang, B.; Yang, L.; Luo, T.; Cao, J. Study on the Kinetics of Hydration Transformation from Hemihydrate Phosphogypsum to Dihydrate Phosphogypsum in Simulated Wet Process Phosphoric Acid. ACS Omega 2021, 6, 7342–7350. [Google Scholar] [CrossRef]
  4. Amrani, M.; Taha, Y.; Kchikach, A.; Benzaazoua, M.; Hakkou, R. Phosphogypsum recycling: New horizons for a more sustainable road material application. J. Build. Eng. 2020, 30, 101267. [Google Scholar] [CrossRef]
  5. Puertas, F.; Martínez-Ramírez, S.; Alonso, S.; Vázquez, T. Alkali-activated fly ash/slag cements: Strength behaviour and hydration products. Cem. Concr. Res. 2000, 30, 1625–1632. [Google Scholar] [CrossRef]
  6. Villalón Fornés, I.; Doroševas, V.; Vaičiukynienė, D.; Nizevičienė, D. The Investigation of Phosphogypsum Specimens Processed by Press-Forming Method. Waste Biomass Valorization 2021, 12, 1539–1551. [Google Scholar] [CrossRef]
  7. Carriço, A.; Bogas, J.A.; Guedes, M. Thermoactivated Cementitious Materials—A Review. Constr. Build. Mater. 2020, 250, 118873. [Google Scholar] [CrossRef]
  8. Kulik, D.A.; Miron, G.D.; Lothenbach, B. A Structurally-Consistent CASH+ Sublattice Solid Solution Model for Fully Hydrated C-S-H Phases: Thermodynamic Basis, Methods, and Ca-Si-H2O Core Sub-Model. Cem. Concr. Res. 2022, 151, 106585. [Google Scholar]
  9. Mohamed, R.; Abd Razak, R.; Abdullah, M.M.; Abd Abd Rahim, S.Z.; Yuan-Li, L.; Sandu, A.V.; Wysłocki, J.J. Heat evolution of alkali-activated materials: A review on influence factors. Constr. Build. Mater. 2022, 314, 125651. [Google Scholar] [CrossRef]
  10. Machner, A.; Zajac, M.; Haha, M.B.; Kjellsen, K.O.; Geiker, M.R.; de Weerdt, K. Stability of the hydrate phase assemblage in Portland composite cements containing dolomite and metakaolin after leaching, carbonation, and chloride exposure. Cem. Concr. Compos. 2018, 89, 89–106. [Google Scholar] [CrossRef]
  11. Lothenbach, B. Thermodynamic equilibrium calculations in cementitious systems. Mater. Struct. 2010, 43, 1413–1433. [Google Scholar] [CrossRef]
  12. Gad, E.A.M.; Habib, A.O.; Mousa, M.M. Understanding the mechanism of decomposition reactions of neat and superplasticized ordinary Portland cement pastes using thermal analysis. J. Silic. Based Compos. Mater. 2018, 70, 98–103. [Google Scholar] [CrossRef]
  13. Kulik, D.A.; Wagner, T.; Dmytrieva, S.V.; Kosakowski, G.; Hingerl, F.F.; Chudnenko, K.V.; Berner, U.R. GEM-Selektor geochemical modeling package: Revised algorithm and GEMS3K numerical kernel for coupled simulation codes. Comput. Geosci. 2013, 17, 1–24. [Google Scholar] [CrossRef]
  14. Lothenbach, B.; Kulik, D.A.; Matschei, T.; Balonis, M.; Baquerizo, L.; Dilnesa, B.; Miron, G.D.; Myers, R.J. Cemdata18: A Chemical Thermodynamic Database for Hydrated Portland Cements and Alkali-Activated Materials. Cem. Concr. Res. 2019, 115, 472–506. [Google Scholar] [CrossRef]
  15. Gartner, E.; Maruyama, I.; Chen, J. A new model for the C-S-H phase formed during the hydration of Portland cements. Cem. Concr. Res. 2017, 97, 95–106. [Google Scholar] [CrossRef]
  16. Accorinti, H.; Labarca, M. Commentary on the Models of Electronegativity. J. Chem. Educ. 2020, 97, 3474–3477. [Google Scholar] [CrossRef]
  17. Feil, D.; Jeffrey, G.A. The Polyhedral Clathrate Hydrates, Part 2. Structure of the Hydrate of Tetra Iso-Amyl Ammonium Fluoride. J. Chem. Phys. 1961, 35, 1863–1873. [Google Scholar] [CrossRef]
  18. Lee, H.X.; Wong, H.S.; Buenfeld, N.R. Effect of alkalinity and calcium concentration of pore solution on the swelling and ionic exchange of superabsorbent polymers in cement paste. Cem. Concr. Compos. 2018, 88, 150–164. [Google Scholar] [CrossRef]
  19. Pajares, I.; Martínez-Ramírez, S.; Blanco-Varela, M.T. Evolution of ettringite in presence of carbonate, and silicate ions. Cem. Concr. Compos. 2003, 25, 861–865. [Google Scholar] [CrossRef]
  20. Pang, X.; Meyer, C. Modeling Cement Hydration by Connecting a Nucleation and Growth Mechanism with a Diffusion Mechanism. Part II: Portland Cement Paste Hydration. Sci. Eng. Compos. Mater. 2016, 23, 605–615. [Google Scholar] [CrossRef]
  21. Ismail, I.; Bernal, S.A.; Provis, J.L.; San Nicolas, R.; Hamdan, S.; van Deventer, J.S. Modification of phase evolution in alkali-activated blast furnace slag by the incorporation of fly ash. Cem. Concr. Compos. 2014, 45, 125–135. [Google Scholar] [CrossRef]
  22. Lu, X.; Wang, S.; Ye, Z.; Li, C.; Cheng, X. Study on the hydration product of ettringite in cement paste with ethanol-diisopropanolamine. J. Therm. Anal. Calorim. 2020, 139, 1007–1016. [Google Scholar] [CrossRef]
  23. Li, J.; Zhang, W.; Monteiro, P.J.M. Preferred orientation of calcium aluminosilicate hydrate compacts: Implications for creep and indentation. Cem. Concr. Res. 2021, 143, 106371. [Google Scholar] [CrossRef]
  24. Walker, C.S.; Sutou, S.; Oda, C.; Mihara, M.; Honda, A. Calcium silicate hydrate (C-S-H) gel solubility data and a discrete solid phase model at 25 °C based on two binary non-ideal solid solutions. Cem. Concr. Res. 2016, 79, 1–30. [Google Scholar] [CrossRef]
  25. Cuesta, A.; Zea-Garcia, J.D.; Londono-Zuluaga, D.; de la Torre, A.G.; Santacruz, I.; Vallcorba, O.; Dapiaggi, M.; Sanfélix, S.G.; Aranda, M.A. Multiscale understanding of tricalcium silicate hydration reactions. Sci. Rep. 2018, 8, 8544. [Google Scholar] [CrossRef]
  26. Masoudi, R.; Hooton, R.D. Examining the hydration mechanism of supersulfated cements made with high and low-alumina slags. Cem. Concr. Compos. 2019, 103, 193–203. [Google Scholar] [CrossRef]
  27. John, E.; Stephan, D. Calcium Silicate Hydrate—in-Situ Development of the Silicate Structure Followed by Infrared Spectroscopy. J. Am. Ceram. Soc. 2021, 104, 6611–6624. [Google Scholar] [CrossRef]
  28. Roosz, C.; Vieillard, P.; Blanc, P.; Gaboreau, S.; Gailhanou, H.; Braithwaite, D.; Montouillout, V.; Denoyel, R.; Henocq, P.; Madé, B. Thermodynamic properties of C-S-H, C-A-S-H and M-S-H phases: Results from direct measurements and predictive modelling. Appl. Geochem. 2018, 92, 140–156. [Google Scholar] [CrossRef]
  29. Andersen, M.D.; Jakobsen, H.J.; Skibsted, J. Characterization of White Portland Cement Hydration and the C-S-H Structure in the Presence of Sodium Aluminate by 27Al and 29Si MAS NMR Spectroscopy. Cem. Concr. Res. 2004, 34, 857–868. [Google Scholar] [CrossRef]
  30. Wolf, J.J.; Jansen, D.; Goetz-Neunhoeffer, F.; Neubauer, J. Application of thermodynamic modeling to predict the stable hydrate phase assemblages in ternary CSA-OPC-anhydrite systems and quantitative verification by QXRD. Cem. Concr. Res. 2020, 128, 105956. [Google Scholar] [CrossRef]
Figure 1. X-ray diffraction analysis of PC samples.
Applsci 12 08726 g001
Figure 2. Chemical characterization of raw materials. (a,b): XRD patterns of FA and PG; (c): SEM micrographs of changing in PG microstructure were taken of samples irradiated for the specified duration: Original PG, 15 min and 1 h conventional heating at 100 °C; (d): The crystal structure of the three observed phases are presented; structures were visualized using the VESTA software 45.
Applsci 12 08726 g002
Figure 3. Schematic reaction diagram of PBM materials specimens.
Applsci 12 08726 g003
Figure 4. Schematic representation of the derivation processes and calculations of thermodynamic modeling.
Applsci 12 08726 g004
Figure 5. Laboratory X-ray powder diffraction patterns of hydration products for pastes: black lines represent the curing age of the 3rd day, red lines represent the curing age of the 7th day, blue lines represent the curing age of the 28th day.
Applsci 12 08726 g005
Figure 6. TG-DTG curves of ECP samples hydrated.
Applsci 12 08726 g006
Figure 7. 29Si MAS−NMR spectra showing the deconvolution of signals for ECP at 28 days.
Applsci 12 08726 g007
Figure 8. 29Si NMR spectra at different Ca/Si ratios.
Applsci 12 08726 g008
Figure 9. Hydration rate and hydration heat cumulative curves for ECP-1, 2, 3 and 4.
Applsci 12 08726 g009
Figure 10. Phase evolution of hardened paste under different curing conditions by the thermodynamic simulation.
Applsci 12 08726 g010
Figure 11. The changes of the characteristic values about constituent oxides at different Ca/Si ratio of C-S-H.
Applsci 12 08726 g011
Figure 12. (Left) Modelled phase stability fields for the major hydrate phases within the ternary system for full binder hydration. (Right) Positions of the five investigated systems within the ternary system [30].
Applsci 12 08726 g012
Table 1. XRF results of PG, FA and OPC in oxide weight percentage.
SampleSO3CaOSiO2P2O5Al2O3MgOFe2O3TiO2LOISSA 1
PG 247.3932.447.611.020.660.380.310.092.160.349
FA0.12.4554.150.3332.252.794.261.020.060.737
PC1.9261.4121.740.166.192.233.20.390.951.280
Note: SSA 1: BET Specific surface area/(m2·g−1); PG 2: Table S2 reports the chemical composition of PG obtained from the XRD quantitative analysis and XRF quantification.
Table 2. Summary of mix composition of specimens used.
CombinationNotationPCFAHGDGPGPESW/S 1W/C 2Curing Conditions
[%][%][%][%][%][%]1:31:1Dry 3Moist 4
PC1st test100---------------------
PC+HGPH80---20------------
PC+DGPD80------20---------
PC+PGPP80---------20------
PC+FA2nd test6119------------
PC+FA+HGPFH611920---------
PC+FA+DGPFD6119---20------
PC+FA+PGPFP6119------20---
PC+PES3rd test73.49------------0.90------
PC+FA+PGECP-173.498.25------18.261.03---
PC+FA+PGECP-273.4911.66------14.850.98---
PC+FA+PGECP-373.4914.85------11.660.95---
PC+FA+PGECP-473.4918.26------8.250.91---
Note: PC: Portland cement; FA: Fly ash; HG: Hemihydrate gypsum; DG: Dihydrate gypsum; PG: Phosphogypsum; PES: Polycarboxylate ether-based superplasticizer; W/S 1: water-to-solid ratio; W/C 2: water-to-cement ratio; Dry 3: Dry chamber [T = 60 ± 2 °C, Water ≤ 5%]; Moist 4: Moist curing [T = 20 ± 1 °C, Water ≥ 95%].
Table 3. Summary of experimental methods and software.
Experimental MethodLogogramTypesSoftwares
Particle Size DistributionPSDBT-9300HT, ChinaOrigin 2022b
OriginLab Corporation, in Northampton, Massachusetts, USA.
Uniaxial compressive strengthUCSHY400X125 according to GB/T 17671-1999Materials Studio 2019
Accelrys Corporation, in San Diego, California, USA.
Mercury intrusion porosimetryMIPMicromeritics-9310 MIP device, maximum and minimum applied pressure of 100 MPa and 0.2 MPaLAMMPS 19.0
US Deparment of Energy, in Washington, District of Columbia, USA.
Isothermal calorimetryTAAn eight channel Thermal Activity Monitor (TAM) Air calorimeterVisio 2021
Microsoft Corporation, in Redmond, Washington, District of Columbia, USA.
Scanning Electron MicroscopySEMZeiss EVO18, Carl Zeiss AG, Oberkochen, GermanyMDI Jade 6
ICDD, in Delaware County, PA
X-ray fluorescenceXRFPANalytical AXIOS spectrometerVESTA 3
National Museum of Nature and Science, Kokuritsu Kagaku Hakubutsukan, Japan.
X-ray diffractionXRDX-Pert PRO DY2198 XRD, QXRD of Topas 4.2, Bruker AXSPhotoshop CS6
Adobe Systems Inc., in San Jose, California, USA.
Thermogravimetric-differential thermal analysisTG-DTGMettler TGA/DSC 250 analyzerGEM-Selektor v.3
Laboratory for Waste Management (LES) of the Paul Scherrer Institute,
Forschungsstrasse, Villigen, Aargau, Switzerland.
Fourier Transform Infrared SpectroscopyFTIRPerkinElmer FTIR Spectrometer
Nuclear magnetic resonance spectroscopyNMR29Si and 27Al solid-state MAS NMR
Table 4. Properties of polyhedral model component oxides (ΔfG0, S0, Cp and V) refined in this work.
Component OxidesΔfG0ΔGOS0Cp V0
[kJ/mol][kJ/mol][J/mol·K][J/mol·K][cm3/mol]
CaO−603.30303.6043.8047.9916.52
CaOext−603.30464.23---------
SiO2−856.28221.3156.4162.1630.28
SiO2H−856.28323.81---------
H2OOH−187.50187.507.05−13.33−1.93
H2Ohyd−221.47221.4747.9543.5613.96
Table 5. Strengths (UCS/MPa) of specimen up to 180 days at different curing condition.
Specimen3 Days7 Days28 Days90 Days180 Days
PH39.450.067.1------
PD36.645.961.0------
PP18.119.932.3------
PFA37.839.751.1------
PFD33.239.545.6------
PFP25.128.938.8------
ECP-111.520.829.342.758.6
ECP-228.334.146.358.476.9
ECP-337.247.860.473.685.7
ECP-451.664.872.487.192.1
Table 6. The thermodynamic database of PC’s hydration phases.
Species ParametersC3SC-S-H-jenPortlanditeH2O(I)
ΔƒHokJ/mol−2931−2723−985−286
ΔƒGokJ/mol−2784.33−2480.81−897.01−237.18
Vm10−6 m3/mol72.4106 *33.118.1
Mkg/mol0.228330.191320.074090.01802
* Note: The molar volume of CSH is calculated according to chemical formula C1.67SH4 instead of C1.67SH2.1 since the early age’s CSH is under 100% relative humidity.
Table 7. Chemical reaction formula of ECP hydration products.
PhasesFormulalog KS0
(Al-) ettringiteCa6Al2(SO4)3(OH)12•26H2O → 2Al(OH)4 + 6Ca2+ +26H2O + 4OH + 3SO42−−44.9
C4AsH14Ca4Al2(SO4)(OH)12•6H2O → 2Al(OH)4 + 4Ca2+ + 6H2O + 4OH + SO42−−29.26
Friedel’s saltCa4Al2Cl2(OH)12•4H2O → 2Al(OH)4 + 4Ca2+ + 4H2O + 4OH + 2ClSO42−−27.27
Nitrate-AFmCa4Al2 (OH)12(NO3)2•4H2O → 2Al(OH)4 + 4Ca2+ + 4H2O + 4OH + 2NO3−28.67
CHCa(OH)2 → Ca2+ + 2OH−5.2
C-S-H1Ca2+ + SiO32 → CaSiO3O2.9
C-S-H2Ca2+ + HSiO32 → CaHSiO3+0.5
CsH2CaSO4•2H2O → Ca2+ +SO42− + 2H2O−4.581
CsH0.5CaSO4•0.5H2O → Ca2+ +SO42− + 0.5H2O−3.59
CsCaSO4 → Ca2+ + SO42−−4.357
SiO2SiO2(quartz) → SiO20−3.476
CH [11]C3S + 5.3H → C1.7SH4 + 1.3CH
C2S + 4.3H → C1.7SH4 + 0.3CH
C4AF + xC SH2 + yH → zCmA SHn + CH+FH3
C-S-H [14]Calcium-silicates + H2O → C-S-H1 + Ca(OH)2
Ca(OH)2 + reactive SiO2 + H2O → C-S-H2
Table 8. Decomposition into constituent oxides for the minerals considered and solid solution models of C-S-H.
PhasesCa/SiCaOCaOextSiO2SiO2HH2OOHH2OhydΔfGoΔGOSoCpVo
Unit---%%%%%%kJ/molkJ/molJ/mol·KJ/mol·Kcm3/mol
C1.25S1.25H2.51.00.690.000.610.390.280.68−2650.4−2782.0197.0234.179
C0.8S0.7H1.81.250.700.000.610.390.280.69−1656.7−1742.4144.4166.948
C1.5SH2.51.50.830.230.330.670.340.89−2594.8−2722.4202.0237.081
C1.67SH2.12.10.920.310.170.830.371.06−2601.9−2723.0175.1210.178
C1.5S0.7H2.52.250.960.460.080.920.451.12−2285.2−2400.7203.1232.881
Publisher’s Note: MDPI stays neutral with regard to jurisdictional claims in published maps and institutional affiliations.

