Article

Kinematic Determinants of the Swimming Push Start in Competitive Swimmers

1
Aqualab Research Group, Universidad Europea de Madrid, 28670 Madrid, Spain
2
Faculty of Sport Sciences, Universidad Europea de Madrid, 28670 Madrid, Spain
3
Health and Human Performance Department, Universidad Politécnica de Madrid, 28040 Madrid, Spain
4
Sports Department, Universidad Politécnica de Madrid, 28040 Madrid, Spain
*
Author to whom correspondence should be addressed.
Appl. Sci. 2022, 12(18), 9278; https://doi.org/10.3390/app12189278
Submission received: 11 August 2022 / Revised: 2 September 2022 / Accepted: 13 September 2022 / Published: 16 September 2022
(This article belongs to the Special Issue Applied Biomechanics: Sport Performance and Injury Prevention II)

Abstract

:
(1) Background: The aim of the present research is to describe the kinematic characteristics of push start in competitive swimmers and to examine the role of the push start sub-phases on the overall start performance. (2) Methods: Seventy-four swimmers (33 males and 41 females) of national and international level performed one 25 m trial at maximum velocity with a push start at butterfly, backstroke and/or front-crawl techniques and were filmed with two sequential underwater cameras during the glide, leg kicking, transition and surface swimming phases. (3) Results: Backstroke starts showed greater emersion distances but slower times to 10 m than the remaining strokes. Distances and average velocities in each of the start sub-phases predicted the overall push start performance (times to 10 m) on the butterfly (R2: 0.50) and backstroke (R2: 0.58) strokes, with the velocity of the leg kicking phase having a statistical effect on both regression analysis and the glide and transition phases in backstroke. (4) Conclusions: Push starts performed in a dorsal body position seemed to present kinematic differences with ventral techniques and a greater technical complexity with all glide, leg kicking and transition sub-phases meaningfully impacting the overall push start performance. This should be considered when executing the daily training repetitions with swimmers in water.

1. Introduction

The introduction of new equipment for competitions, such as the kick start platform devices [1], as well as the increase in the contribution of the underwater swimming segments to the total race distance [2] has attracted interest on the start and turn race segments increase over the last years. The greater velocities obtained by swimmers in these segments compared to surface swimming [3,4,5] and the fact that elite swimmers do not extended underwater swimming to the 15 m FINA limit [6] ensure a certain performance room of improvement for swimmers in start and turns.
Previous research about competitive swimmers has described the average velocity of the underwater section [7,8] as well as the horizontal velocity at the starting block take-off [7,8,9] as the most important factors for the overall start performance. For the turns, the 3D length of the path covered during the front crawl turn was identified as relevant for a better turn time [10]. In both segments, the role of the underwater sections for better performance has been emphasized and, consequently, distances and average velocities achieved in these segments by swimmers of different competitive level have been described [11]. Additionally, some specific parts of the underwater sections, such as the gliding [12] and the breakout phases [13,14,15], right before and after the underwater leg kicking phase, seem to provide important gains in terms of overall start and turn performance.
However, when in training, most swimmers do not dive from the starting wall at each swimming repeat. Training programs are actually composed of different swimming exercises at different intensities [16] where a high volume of work and repetitions is a common characteristic of elite training programs [17]. Therefore, when beginning each of the training repeats, swimmers do not get out of water and perform a dive start, but they execute the so-called push start [3,18]. This procedure has been extensively employed in the literature during experiments analyzing underwater undulatory swimming [19,20,21], and it consists of swimmers beginning in the water and pushing off the wall in the streamline position to achieve a depth between 0.5 m and 1 m. Despite its daily and repeated use in training, there is no evidence in the literature of differences between the push and dive start in terms of the overall performance at 5 m, 10 m or 15 m, neither is there information about the underwater and/or surface swimming segments travelled in each type of start in the different strokes. Kinematic data about the push start could be relevant, for example, for comparison purposes between dive or push start training repeats or for specific instructions in relation to the gliding, underwater and surface swimming subsections.
Therefore, the aim of the present research is to describe the kinematic characteristics of push start in competitive swimmers and to examine the role of the push start sub-phases on the overall start performance. It was hypothesized that the leg kicking phase is the most important sub-phase, although the glide, transition and surface swimming sub-phases can have a meaningful impact on the push start performance.

2. Materials and Methods
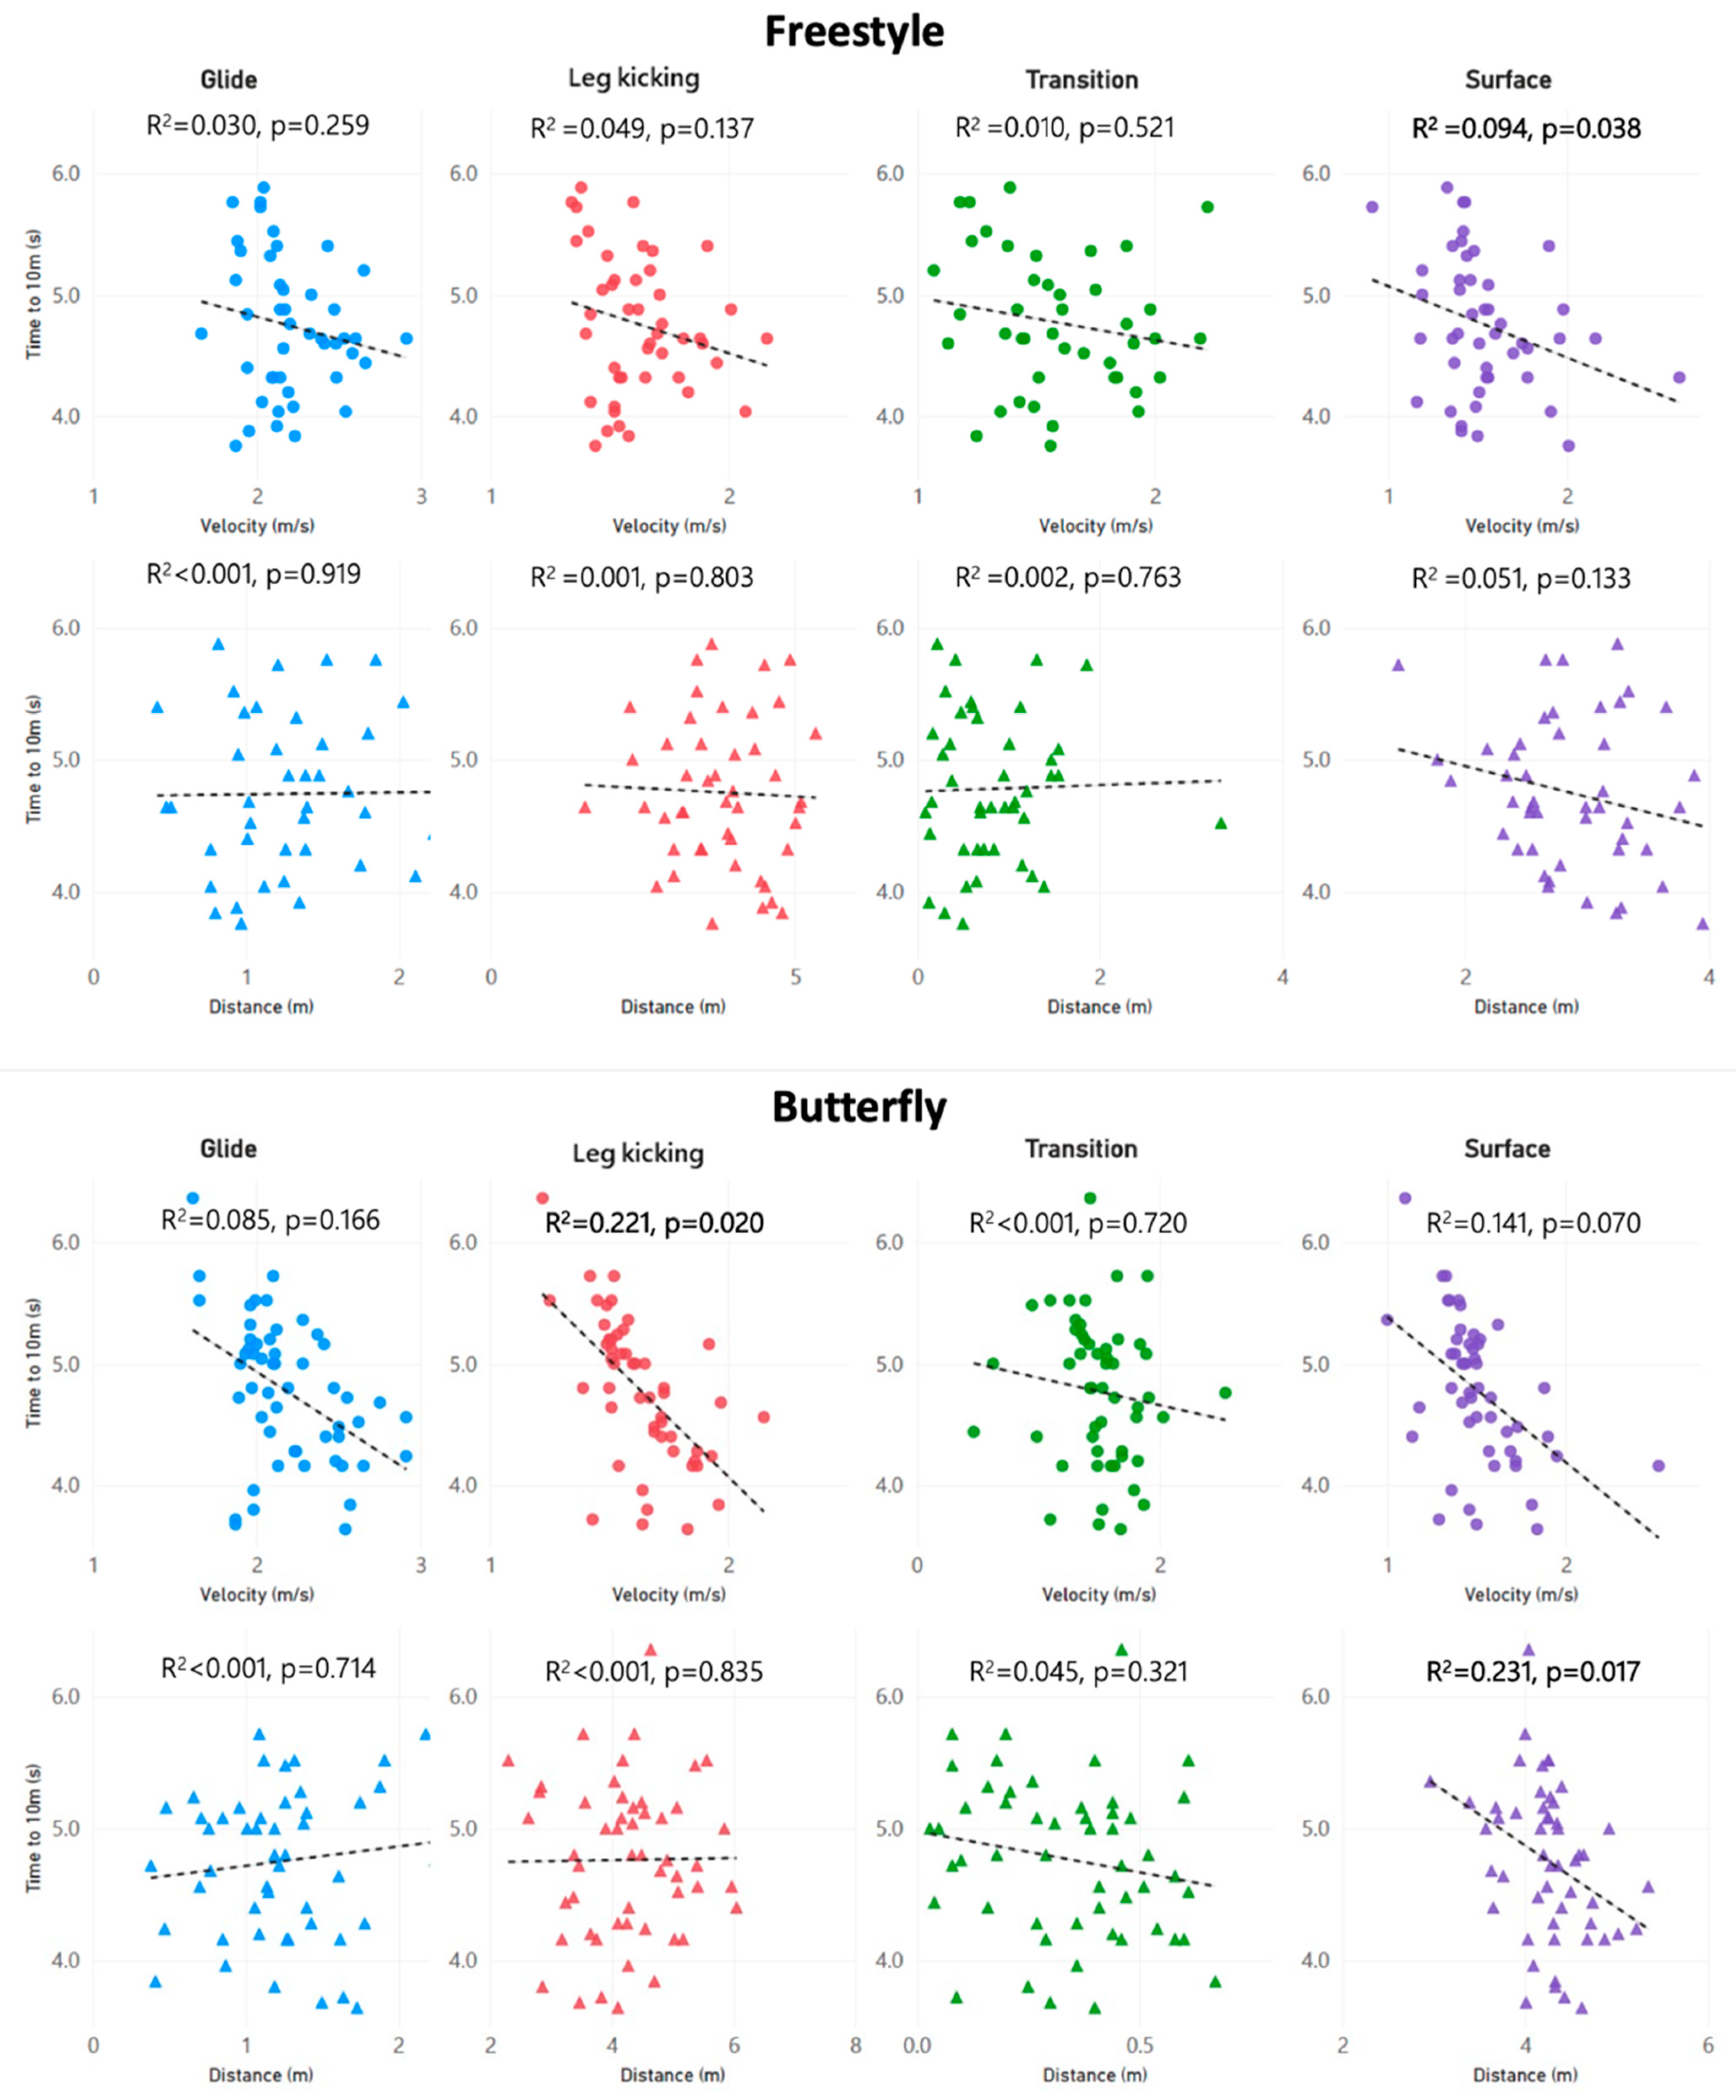
Seventy-four swimmers (33 males with 16.5 ± 1.29 years of age, 62.34 ± 7.22 kg, 1.73 ± 0.05 m and 41 females with 15.5 ± 1.29 years old, 50.50 ± 6.53 kg, 1.60 ± 0.05 m) voluntarily participated in the present study. All swimmers competed at the national level and accredited a personal best in the 100 m event of butterfly, backstroke or front-crawl within the 85% of world record in long course. According to the recent standardization of swimming results proposed by Ruiz-Navarro et al. [22], participants in the present study would be identified as level two and three swimmers. Their training programs consisted of between 12 and 20 h of water training and between 3 and 6 h of dry-land training per week. Swimming experience was 7.12 ± 2.35 years for males and 5.90 ± 1.68 years for females. A written informed consent was signed by all participants or their tutors, and all experimental procedures were conducted according to Declaration of Helsinki for human research [23]. The study was approved by the Local University Ethics Committee.
Tests were conducted in an indoor 50 m pool, with water temperature at 27 °C and at the usual training time. Prior to the experiment, the swimmers’ hip joint center was marked with a waterproof adhesive tape of a round shape (diameter 25 mm) to assist in the video analysis. After a standardized warm up consisting of 5–10 min of dynamic dry-land exercises and 20–25 min of swimming (including some easy swim, technical drills, descend 50 m repeats and some speed exercises), the swimmers performed one repetition of 25 m at maximal intensity from an in-water push start. Swimmers were instructed to begin with feet situated approximately one meter below the water surface to avoid the wave drag resistance during the wall push-off [24]. The 25 m effort was performed at the preferred stroke (butterfly, backstroke or front-crawl) and, in the case of swimmers that accredited a personal best in 100 m events faster than 85% of the world record, two or three 25 m repetitions (at the different strokes in random order) were performed with at least three minutes of passive rest between each of them. In total, 46 trials were performed at front-crawl, 53 at butterfly and 24 at backstroke. No breaststroke trials were included for the aims of the present study as FINA rules do not allow to perform a free UUS subsection and do not limit the underwater segment to 15 m.
Two sequential video cameras (JVC GY-DV500E), situated behind the underwater windows of the pool at a distance of 3.5 and 8 m from the starting wall, recorded all trials at a frame rate of 50 Hz and with image resolution of 758 × 576 pixels. Cameras were located at 10 m away from the swimmers’ lane, with their optical axis perpendicular to the sagittal plane of swimmers and with both fields of view filming the swimmers’ trials in sequence. Before the commencement of the trials, a rectangular calibration frame (5 m length and 2 m wide) containing eight calibration points was located in the middle of the swimming lane and perpendicular to the cameras field of view.
An experienced observer manually digitized all trials footage by mean of Photo 23D software [25]. The hip center was identified at the beginning and/or end of the of the sections of the push start to represent the swimmers’ position [26] and screen coordinates were transformed to real spatial coordinates in two dimensions by means of Direct Linear Transformation algorithms [27]. Eight control points in the calibration frame (different from those employed for calibration purposes) were used to estimate accuracy in the coordinates’ reconstruction. RMSE (root-mean-squared error) in the horizontal and vertical axes was lower than 0.035 m, which represented less than 0.6% of the field of view of each camera.
The subsections of the push start were divided as follows: the glide phase was defined from the swimmers’ feet leaving the starting wall to the beginning of the downward movement of the first undulatory kick (upward movement in backstroke); the leg kicking phase was defined from the end of gliding to the beginning of the first upper-limb underwater pull; the transition phase was defined from the end of the leg kicking phase to the instant of the swimmers’ head emerging from underwater; and finally, the surface swimming phase was defined from the end of transition phase to the swimmers completing three strokes on the surface. In each of the push start subsections, the horizontal distance travelled by swimmers (m) and the average velocity (m/s) as an indicator of each phase performance [28] were calculated. Additionally, the start distance was considered until the swimmers’ head emersion from underwater and 10 m start times were calculated from the swimmers’ feet leaving the starting wall to the swimmers head arriving to the 10 m reference mark.
For statistical analysis, a repeated measures analysis of variance was performed for the distance and average velocity according to the start sub-phase, the swimmers’ gender and the stroke. In the case of detecting statistical effects, post hoc Bonferroni tests were performed for pairwise comparisons. Effect sizes (as partial η2 values) were employed to calculate the magnitude of differences, with 0.01, 0.06 and 0.14 as the thresholds for small, medium and large differences, respectively. Subsequently, a correlation analysis was performed between the distance and average velocity of the start sub-phase and the time to 10 m for each stroke. The threshold values of the correlation coefficient that represented small, moderate, large, very large and nearly perfect correlations were 0.1, 0.3, 0.5, 0.7 and 0.9, respectively, according to recommendations in the literature [29]. Finally, a linear multiple regression analysis was run to predict the time to 10 m for each stroke using the distance and average velocity of the start sub-phases as predictor variables. A different equation was estimated for distance and velocity. The model sought to establish the following relations:
t 10 m =   β 1 · v glide + β 2 · v leg   kicking + β 3 · v transition +   β 4 · v surface + β 5 · d glide + β 6 · d leg   kicking + β 7 · d transition +   β 8 · d surface + β 0
where d and v represent the distance and velocities, respectively, in the different phases, namely, glide, leg kicking, transition and surface swimming phases. βn represents the regression coefficients, with β0 being the intercept. All statistical analyses were carried out in Jamovi (v 2.3.12) and significance was set at α = 0.05.

3. Results

The times to 10 m of national level swimmers during the push start ranged from 4.5 s to 5.3 s, regardless of gender and stroke. Overall, male swimmers obtained faster times than females (gender effect: F1 = 7.40, p < 0.01, η2 = 0.06) and differences were also observed due to strokes (stroke effect: F2 = 4.77, p < 0.01, η2 = 0.08), with backstroke start times being longer than the butterfly (p = 0.004) and front-crawl (p = 0.008) starts.
Distances travelled by national level swimmers to the point of head emersion ranged from 5.94 m to 7.55 m, with differences observed due to gender (gender effect: F1 = 14.59, p < 0.001, η2 = 0.11) and stroke (stroke effect: F2 = 13.91, p < 0.001, η2 = 0.19). The start distance of the backstroke starts was longer than in butterfly and front-crawl (p = 0.001), whereas male swimmers presented an average of 0.70 m longer start than females. On the other hand, average velocities ranged from 1.5 to 2 m/s with differences between gender (gender effect: F1 = 49.47, p < 0.001, η2 = 0.30) and stroke (stroke effect: F2 = 3.12, p = 0.05, η2 = 0.05).
The contribution of each start sub-phase to the emersion distance depended on the stroke (stroke × phase effect: F5.66 = 37.24, p = 0.001, η2 = 0.39), but not on the gender (gender*phase effect: F2.83 = 2,25, p =0.09, η2 = 0.02), with backstroke glide and butterfly transition being shorter than the remaining strokes (p < 0.05) and with the leg kicking phase representing a different distance in each stroke (p < 0.05). For the average velocities in each start phase, backstroke leg kicking phase was slower (p < 0.05) than the remaining strokes, but no stroke differences were observed in the glide and transition phases. Statistical differences in each of the pairwise comparison for gender and stroke are shown in Table 1.
The results of the correlation analysis of the push start sub-phases with times to 10 m are shown in Figure 1. No correlations were observed between the glide and transition parameters with time to 10 m, except the glide velocity on backstroke. On the other hand, the leg kicking velocities on butterfly and backstroke as well as the surface swimming velocities on front-crawl and backstroke were related to shorter 10 m times. For the distance measurements, no statistical correlations were observed with times to 10 m in any stroke or push start sub-phase, except the surface swimming distance in backstroke and butterfly.
The linear multiple regression model for the freestyle stroke (Table 2) could not predict the time to 10 m beyond 20% with no significant relation between the distance or velocity variables in the different phases. For the backstroke, the linear multiple regression model (Table 2) significantly predicted the time to 10 m by 58.6%. The most significant variable here was the velocity of the leg kicking phase, where an increased velocity in the leg kicking resulted in a reduced time to 10 m. Here, it is also important to consider the transition phase, where an increase in the distance or velocity resulted in a greater time to 10 m. Finally, in the case of the butterfly stroke, the velocity equation showed a significant relationship in predicting the time to 10 m by 50%. In this case, the significant negative regression coefficient was obtained in the leg kicking phase, indicating that faster velocities in these phases resulted in lower times to 10 m.

4. Discussion

The present research aimed to examine the kinematic parameters of the push start in competitive swimmers and the role of the push start sub-phases on the overall start performance. Despite push start being the most common type of start in the training sessions of competitive swimmers, there is no evidence in the literature on the key kinematic characteristics related to push start performance. The results from the present research characterize the push start in a large sample of national and international level swimmers and stress some differences between the ventral and dorsal techniques that can affect push start performance.
The overall performance of the push start was evaluated by times to 10 m. This was conducted because the national and international swimmers in the present research attained start distances between 6 and 7.5 m (Table 1) and because the first surface swimming stroke cycle seems to be highly affected by the starting movements [5]. The times to 10 m obtained were 0.92 s longer and 24.6% slower than those reported during dive starts of competitive swimmers corrected for block times [30] and 0.30 s longer and 7.5% slower than turn times to 10 m corrected for wall-contact times [31]. This undoubtedly should be taken into account for comparison purposes between training repeats from in-water and race simulation with dive start. Backstroke start times were slower than in butterfly and front-crawl, which is interesting considering that no differences on the push off the wall (other than the dorsal versus ventral body position) occurs between strokes and that, theoretically, drag forces on the ventral versus dorsal body position are similar [32]. The reason would be the slower average velocities of the leg kicking phase in backstroke (between 5–6% slower than in butterfly and front-crawl), as no differences in velocity were observed in the glide or transition phases. This is an important finding of the present study as little evidence exists in the literature about the dorsal kicking velocity relative to the ventral position. When in backstroke, the national level swimmers in the present study kicked faster than other high-level swimmers [33], with this being the only reported evidence for dorsal kicking. Ventral leg kicking velocity values were in line with recent data of national level swimmers [20,34]. In relation to gender differences, times to 10 m in the present study presented gender differences ranging from 3.6% to 10.2%. These gender differences are lower than those reported (≈15%) for the dive starts [8], where male swimmers could benefit from their greater strength levels on the block [35].
Overall start distances to head emersion were lower in the present study than previous data reported for dive starts (which is expected as there is no flight phase on the push start) but also for turns performed in competition. For example, the national level swimmers emerged between 8 m to 12 m from the starting wall and between 6 m to 11 m from the turning wall in 100 m events [11]. Differences could be explained because swimmers in the present research performed 25 m repeats at maximal intensity and, in this situation, surface swimming velocity was probably faster than 100 m or 200 m pace. Indeed, the average velocity of the push start ranged between 1.5 and 1.6 m/s for females and 1.8 to 2.0 m/s for males, which is similar to surface swimming values at maximum intensity after emersion [5]. Therefore, underwater versus surface velocity ratio in the 25 m trials probably constrained swimmers to emerge closer to the starting wall as compared to a race pace trial. Gender differences in the overall start distance were shorter than previously reported in competitive dive starts or turns of national level swimmers [11], probably related to the relative shorter distances travelled by swimmers in the push start.
In relation to start sub-phases contribution, average glide distances (between 0.86 and 1.67 m) were shorter than those reported during dive starts [36], but also shorter than recommended glide distances ≈2 m [24] on the turn. In relative terms, glide distances represented from 12% to 26% of the overall start, with backstroke glides being shorter than in the ventral positions. Considering that no differences in drag forces have been reported between ventral and dorsal body positions [32], the shorter glide distances in backstroke could be related to lower forces applied on the wall push-off or inefficient angles of attack of the swimmers’ body segments after leaving the starting wall [37]. However, no evidence in the literature has reported differences in both aspects between the dorsal and ventral body position. During the leg kicking phase, distances represented around two thirds of the overall start distances with each stroke presenting specific distances. Compared to previous research, the duration of the leg kicking phase in front-crawl (an average of 2.08 s) was longer than the previously reported of 1.23 ± 0.47 in the tumble turns [10] or 1.27 ± 0.37 in the dive start [38], which highlights the specificity of the push start compared to the dive start or the turn segments. This confirms the need of individualizing the leg kicking distances according to the underwater to surface swimming velocity ratio in each stroke and/or type of start, as previously described in competition [39]. Finally, the transition phases of the butterfly stroke were shorter than those of the alternative techniques (front-crawl and backstroke) with maximal distance contributions of 15%. The distance travelled in the front-crawl transition was shorter than that reported during the first arm stroke of national level swimmers [4].
The linear regression analysis of the push start performance indicated that times to 10 m could be explained at 50% and 58%, respectively, for the butterfly and backstroke techniques, by the distances and average velocities of each start sub-phase. The average velocity attained in the kicking leg phase seemed to be a key parameter for both the ventral and dorsal position. Indeed, large correlations were detected between faster leg kicking velocities and shorter times to 10 m in both the backstroke and butterfly strokes (Figure 1). According to the beta coefficients of regression equations (Table 2), small changes on leg kicking velocity would have a huge impact on times to 10 m (for example, 0.5 s improvement in backstroke by increasing leg kicking velocity 0.1 m/s). This was previously reported for the whole underwater sections of competitive starts [38] and turns [40], but no specific evidence has been provided for the leg kicking phase isolated from the glide and transition part. It should be noted that average velocity, and not distance attained in this sub-phase, had an influence on start performance. This is in line with underwater velocity rather than distance having an impact on the overall performance of 100 m events on World Swimming Championships [6,39] and suggests the importance of achieving fast (rather than long) underwater segments in the sprint events.
Apart from the underwater swimming, the glide and transition sub-phases seem to play an important role on some of the push starts. Indeed, faster glides and shorter transitions were related to faster times to 10 m in backstroke (Figure 1 and Table 2). For the glide phase, previous research has emphasized the role of the hip depth during gliding to reduce drag forces [12,41]. However, this aspect was controlled in the present study as swimmers were constrained to push-off the wall with their feet one meter below the water surface. The average duration of this phase for the backstroke swimmers in the present research was 0.40 to 0.55 s from feet leaving the wall to swimmers adopting the downkick position for the first undulatory kicking action. This glide duration was longer than the 0.28 ± 0.13 reported during front-crawl dive starts [38] and the 0.32 ± 0.14 reported in front-crawl tumble turns [10]. Considering velocities when pushing off the wall could reach 3 m/s [3,10,42], and that deceleration during glide phase has been characterized to be close to −1.15 m/s2 [42], swimmers could be expected to maintain even longer glide durations than in the present study. A requisite for an efficient glide would be having swimmers begin leg kicking below 2 m/s, because kicking too early would represent an increase in drag as swimmers deviate from a streamlined position [43]. Considering that the average velocity in this phase ranged between 2.11 and 2.21 m/s, the backstroke national level swimmers in the present study seemed to accomplish the recommendations of another research [44], with this being an important aspect for push start performance. Trying to maximize these times with better hydrodynamic positions and greater impulse applied on the starting wall could assist swimmers in improving their push start, and this could also be translated in the turns’ performance.
For the transition phase, previous research has revealed that shorter time gaps between the propulsive actions of both arms are related to faster transition velocities in backstroke [13]. This seems to be in line with the shorter distance travelled during the first arm stroke cycle after underwater swimming that, according to present study, is related to a better push start performance. The competitive swimmers in the present research spent an average of 0.66–0.70 s on the first stroke cycle. The longer times in this phase could be related to the increase complexity of transition where swimmers must be situated on the water surface while continuing the propulsive actions [14,15]. Therefore, the ability of swimmers to adequately execute the stroking pace in the first arm pull cycle after underwater swimming (and consequently controlling the transition time and length) could be considered as relevant for the backstroke push start performance.
Finally, on the surface swimming phase, the velocity and distance of swimmers in almost all strokes was medium-to-large correlated to the push start performance (Table 2), although it did not predict start performance. The distance travelled in this phase depended on the stroke length of swimmers, which has been extensively related to the swimmers’ expertise in different strokes [45]. Therefore, the longer stroke length displayed by competitive swimmers, the greater technical proficiency they are expected to perform and, consequently, the shorter start times expected to be achieved [46]. For the surface swimming velocity, previous research has outlined the importance of evaluating start and turns with individual distances at head emersion that do not include both underwater and surface swimming segments together [47]. The fact that swimmers in the present research emerged from underwater between 6 and 7.5 m and completed a great proportion of the 10 m distance with surface swimming strokes explains the relationships observed between velocities in this segment and start performance. Nevertheless, despite a similar quantitative contribution, the impact of surface swimming on the push start performance was lower than that in the leg kicking phase, which represents another important application of the present results.
The presented information about the kinematic determinants of the push start in swimming seems to be relevant because evidence about underwater swimming of start and turns has been primarily focused on the entire underwater sections [47] or some selected leg kicks on the middle part of underwater sections [22]. The presented results show the importance of the average velocity of the entire leg kicking phase and, specifically for backstroke, demonstrated the specific characteristics of the dorsal versus ventral body position in the push start. Future research should focus on a within-subjects comparison of the push versus dive start.

5. Conclusions

The kinematic parameters of the push start in competitive swimmers presented specific features in terms of performance times and travelled distances compared to previous evidence on competitive start and turns. Backstroke starts presented lower velocities but longer start distances than ventral strokes, with the velocity on the leg kicking phase being the main responsible for stroke differences. When employed in 25 m swimming efforts at maximal velocities, the average velocity of the push start sub-phases rather than the distances achieved by swimmers was related to the start performance. In particular, the velocity on the leg kicking phases predicted the overall push start performance on butterfly and backstroke, with glide and transition parameters also affecting the start times on the dorsal position. This information should be considered when executing the push start on the daily training sessions of competitive swimmers.

Author Contributions

Conceptualization, S.V. and A.T.; methodology, A.N. and A.T.; software, A.N. and E.N.; validation, S.V. and E.N.; formal analysis, A.N.; investigation, A.T.; data curation, A.T. and A.N.; writing—original draft preparation, S.V.; writing—review and editing, S.V. and A.T.; visualization, A.N.; project administration, S.V. All authors have read and agreed to the published version of the manuscript.

Funding

This research received no external funding.

Institutional Review Board Statement

The study was conducted in accordance with the Declaration of Helsinki and approved by the Institutional Review Board (or Ethics Committee) of the Universidad Politécnica de Madrid Research Ethics Committee approved the study (Reference: 2020–080).

Informed Consent Statement

Informed consent was obtained from all subjects involved in the study.

Data Availability Statement

Not applicable.

Conflicts of Interest

The authors declare no conflict of interest.

References

  1. FINA. FINA Swimming Rules 2009–2013; Fédération Internationale de Natation: Lausanne, Switzerland, 2009. [Google Scholar]
  2. Born, D.P.; Schönfelder, M.; Logan, O.; Olstad, B.H.; Romann, M. Performance Development of European Swimmers Across the Olympic Cycle. Front. Sports Act. Living 2022, 4, 894066. [Google Scholar] [CrossRef] [PubMed]
  3. Takeda, T.; Ichikawa, H.; Takagi, H.; Tsubakimoto, S. Do differences in initial speed persist to the stroke phase in front-crawl swimming? J. Sports Sci. 2009, 27, 1449–1454. [Google Scholar] [CrossRef] [PubMed]
  4. Takeda, T.; Sakai, S.; Takagi, H. Underwater Flutter Kicking Causes Deceleration in Start and Turn Segments of Front Crawl. Sports Biomech. 2020, 27, 1–10. [Google Scholar] [CrossRef] [PubMed]
  5. Veiga, S.; Roig, A. Effect of the starting and turning performances on the subsequent swimming parameters of elite swimmers. Sports Biomech. 2017, 16, 34–44. [Google Scholar] [CrossRef]
  6. Pla, R.; Poszalczyk, G.; Souaissia, C.; Joulia, F.; Guimard, A. Underwater and Surface Swimming Parameters Reflect Performance Level in Elite Swimmers. Front. Physiol. 2021, 12, 712652. [Google Scholar] [CrossRef]
  7. Fischer, S.; Kibele, A. The biomechanical structure of swim start performance. Sports Biomech. 2016, 15, 397–408. [Google Scholar] [CrossRef]
  8. Tor, E.; Pease, D.; Ball, K. Characteristics of an elite swimming start. Presented at the Biomechanics and Medicine in Swimming Conference, Canberra, Australia, 28 April–2 May 2014. [Google Scholar]
  9. Silveira, P.R.; Stergiou, P.; Figueiredo, P.; Castro, F.S.; Katz, L.; Stefanyshyn, D.J. Key determinants of time to 5 m in different ventral swimming start techniques. Eur. J. Sport Sci. 2018, 18, 1317–1326. [Google Scholar] [CrossRef]
  10. Puel, F.; Morlier, J.; Avalos, M.; Mesnard, M.; Cid, M.; Hellard, P. 3D kinematic and dynamic analysis of the front crawl tumble turn in elite male swimmers. J. Biomech. 2012, 45, 510–515. [Google Scholar] [CrossRef]
  11. Veiga, S.; Cala, A.; Frutos, P.G.; Navarro, E. Comparison of starts and turns of national and regional level swimmers by individualized distance measurements. Sports Biomech. 2014, 13, 285–295. [Google Scholar] [CrossRef]
  12. Hermosilla, F.; Yustres, I.; Psycharakis, S.; Santos Del Cerro, J.; González-Mohíno, F.; González-Rave, J.M. Which variables may affect underwater glide performance after a swimming start? Eur. J. Sport Sci. 2021, 22, 1141–1148. [Google Scholar] [CrossRef]
  13. Stosic, J.; Veiga, S.; Trinidad, A.; Navarro, E. How Should the Transition from Underwater to Surface Swimming Be Performed by Competitive Swimmers? Appl. Sci. 2021, 11, 122. [Google Scholar] [CrossRef]
  14. Stosic, J.; Veiga, S.; Trinidad, A.; Dopsaj, M.; Navarro, E. Effect of breakout phase on the stroke kinematics and coordinative swimming variables. Sports Biomech. 2022, 31, 1–14. [Google Scholar] [CrossRef] [PubMed]
  15. Trinidad, A.; Veiga, S.; Navarro, E.; Lorenzo, A. The Transition from Underwater to Surface Swimming During the Push-off Start in Competitive Swimmers. J. Hum. Kinet. 2020, 72, 61–67. [Google Scholar] [CrossRef] [PubMed]
  16. Hellard, P. Elite Swimmers’ Training Patterns in the 25 Weeks Prior to Their Season’s Best Performances: Insights Into Periodization From a 20-Years Cohort. Front. Physiol. 2019, 10, 16. [Google Scholar] [CrossRef]
  17. Mujika, I.; Halson, S.; Burke, L.M.; Balagué, G.; Farrow, D. An Integrated, Multifactorial Approach to Periodization for Optimal Performance in Individual and Team Sports. Int. J. Sports Physiol. Perform. 2018, 13, 538–561. [Google Scholar] [CrossRef]
  18. Connaboy, C.; Coleman, S.; Moir, G.; Sanders, R. Measures of reliability in the kinematics of maximal undulatory underwater swimming. Med. Sci. Sports Exerc. 2010, 42, 762–770. [Google Scholar] [CrossRef]
  19. Atkison, R.R.; Dickey, J.P.; Dragunas, A.; Nolte, V. Importance of sagittal kick symmetry for underwater dolphin kick performance. Hum. Mov. Sci. 2014, 33, 298–311. [Google Scholar] [CrossRef]
  20. Ikeda, Y.; Ichikawa, H.; Shimojo, H.; Nara, R.; Baba, Y.; Shimoyama, Y. Relationship between dolphin kick movement in humans and velocity during undulatory underwater swimming. J. Sports Sci. 2021, 39, 1497–1503. [Google Scholar] [CrossRef]
  21. Shimojo, H.; Nara, R.; Baba, Y.; Ichikawa, H.; Ikeda, Y.; Shimoyama, Y. Does ankle joint flexibility affect underwater kicking efficiency and three-dimensional kinematics? J. Sports Sci. 2019, 37, 2339–2346. [Google Scholar] [CrossRef]
  22. Ruiz-Navarro, J.J.; López-Belmonte, Ó.; Gay, A.; Cuenca-Fernández, F.; Arellano, R. A new model of performance classification to standardize the research results in swimming [published online ahead of print, 2022 Mar 20]. Eur. J. Sport Sci. 2022, 1–11. [Google Scholar] [CrossRef]
  23. World Medical Association. World Medical Association Declaration of Helsinki. Ethical principles for medical research involving human subjects. Bull. World Health Organ. 2001, 79, 373–374. [Google Scholar]
  24. Lyttle, A.; Blanksby, B. A look at gliding and underwater kicking in the swim turn. Presented at the 18th International Symposium on Biomechanics in Sports, Hong Kong, China, 25–30 June 2000. [Google Scholar]
  25. Cala, A.; Veiga, S.; García, A.; Navarro, E. Previous cycling does not affect running efficiency during a triathlon world cup competition. J. Sports Med. Phys. Fitness 2009, 49, 152–158. [Google Scholar]
  26. Fernandes, R.J.; Ribeiro, J.; Figueiredo, P.; Seifert, L.; Vilas-Boas, J.P. Kinematics of the hip and body center of mass in front crawl. J. Hum. Kinet. 2012, 33, 15–23. [Google Scholar] [CrossRef] [PubMed]
  27. Abdel-Aziz, Y.I.; Karara, H.M. Direct linear transformation from comparator coordinates into object space coordinates in close-range photogrammetry. In ASP Symposium on Close-Range Photogrammetry; American Society of Photogrammetry: Washington, DC, USA, 1971; pp. 1–18. [Google Scholar]
  28. Naemi, R.; Easson, W.J.; Sanders, R.H. Hydrodynamic glide efficiency in swimming. J. Sci. Med. Sport 2010, 13, 444–451. [Google Scholar] [CrossRef]
  29. Hopkins, W.G.; Marshall, S.W.; Batterham, A.M.; Hanin, J. Progressive statistics for studies in sports medicine and exercise science. Med. Sci. Sports Exerc. 2009, 41, 3–13. [Google Scholar] [CrossRef]
  30. Qiu, X.; Veiga, S.; Calvo, A.L.; Kibele, A.; Navarro, E. A Kinematics Comparison of Different Swimming Relay Start Techniques. J. Sports Sci. 2021, 39, 1105–1113. [Google Scholar] [CrossRef] [PubMed]
  31. Gonjo, T.; Olstad, B.H. Start and Turn Performances of Competitive Swimmers in Sprint Butterfly Swimming. J. Sports Sci. Med. 2020, 19, 727–734. [Google Scholar]
  32. Marinho, D.A.; Barbosa, T.M.; Rouboa, A.I.; Silva, A.J. The Hydrodynamic Study of the Swimming Gliding: A Two-Dimensional Computational Fluid Dynamics (CFD) Analysis. J. Hum. Kinet. 2011, 29, 49–57. [Google Scholar] [CrossRef]
  33. De Jesus, K.; de Jesus, K.; Machado, L.; Fernandes, R.J.; Vilas-Boas, J.P. Linear Kinematics of the Underwater Undulatory Swimming Phase Performed after Two Backstroke Starting Techniques. In Proceedings of the 30th International Conference on Biomechanics in Sports, Melbourne, Australia, 2–6 July 2012; pp. 371–374. [Google Scholar]
  34. Tanaka, T.; Hashizume, S.; Sato, T.; Isaka, T. Competitive-Level differences in trunk and foot kinematics of underwater undulatory swimming. Int. J. Environ. Res. Public Health 2022, 19, 3998. [Google Scholar] [CrossRef]
  35. Round, J.M.; Jones, D.A.; Honour, J.W.; Nevill, A.M. Hormonal factors in the development of differences in strength between boys and girls during adolescence: A longitudinal study. Ann. Hum. Biol. 1999, 26, 49–62. [Google Scholar] [CrossRef]
  36. Elipot, M.; Hellard, P.; Taïar, R.; Boissière, E.; Rey, J.L.; Lecat, S.; Houel, N. Analysis of swimmers’ velocity during the underwater gliding motion following grab start. J. Biomech. 2009, 42, 1367–1370. [Google Scholar] [CrossRef] [PubMed]
  37. Houel, N.; Elipot, M.; André, F.; Hellard, P. Influence of angles of attack, frequency and kick amplitude on swimmer’s horizontal velocity during underwater phase of a grab start. J. Appl. Biomech. 2013, 29, 49–54. [Google Scholar] [CrossRef] [PubMed]
  38. Vantorre, J.; Seifert, L.; Fernandes, R.J.; Boas, J.P.; Chollet, D. Comparison of grab start between elite and trained swimmers. Int. J. Sports Med. 2010, 31, 887–893. [Google Scholar] [CrossRef] [PubMed]
  39. Veiga, S.; Roig, A.; Gómez-Ruano, M.A. Do faster swimmers spend longer underwater than slower swimmers at World Championships? Eur. J. Sport Sci. 2016, 16, 919–926. [Google Scholar] [CrossRef]
  40. Mason, B.; Cossor, J. Swim start performances at the Sydney 2000 Olympic games. In Proceedings of the Swim Sessions: XIX International Symposium on Biomechanics in Sports, San Francisco, CA, USA, 26 June 2001; Blackwell, J., Sanders, R.H., Eds.; International Society of Biomechanics in Sports: Milwaukee, WI, USA, 2000; pp. 70–74. [Google Scholar]
  41. Lyttle, A.D.; Blanksby, B.A.; Elliot, B.C.; Lloyd, D.G. The effect of depth and velocity on drag during the streamlined guide. J. Swim. Res. 1998, 13, 15–22. [Google Scholar] [CrossRef]
  42. Zamparo, P.; Vicentini, M.; Scattolini, A.; Rigamonti, M.; Bonifazi, M. The contribution of underwater kicking efficiency in determining "turning performance" in front crawl swimming. J. Sports Med. Phys. Fit. 2012, 52, 457–464. [Google Scholar]
  43. Lyttle, A.; Blanksby, B.; Elliott, B.; Lloyd, D. A comparison of underwater gliding and kicking techniques. In Scientific, Proceedings of the XVII International Symposium on Biomechanics in Sports, 30 June–6 July 1999; Sanders, R.H., Gibson, B.J., Eds.; Edith Cowan University: Perth, Australia, 1999; pp. 81–84. [Google Scholar]
  44. Lyttle, A.D.; Blanksby, B.A.; Elliott, B.C.; Lloyd, D.G. Net forces during tethered simulation of underwater streamlined gliding and kicking techniques of the freestyle turn. J. Sports Sci. 2000, 18, 801–807. [Google Scholar] [CrossRef]
  45. Barbosa, T.M.; Bragada, J.A.; Reis, V.M.; Marinho, D.A.; Carvalho, C.; Silva, A.J. Energetics and biomechanics as determining factors of swimming performance: Updating the state of the art. J. Sci. Med. Sport. 2010, 13, 262–269. [Google Scholar] [CrossRef]
  46. Arellano, R.; Brown, P.; Cappaert, J.; Nelson, R.C. Analysis of 50-, 100-, and 200-m freestyle swimmers at the 1992 Olympic Games. J. Appl. Biomech. 1994, 10, 189–199. [Google Scholar] [CrossRef]
  47. Veiga, S.; Cala, A.; Mallo, J.; Navarro, E. A new procedure for race analysis in swimming based on individual distance measurements. J. Sports Sci. 2013, 31, 159–165. [Google Scholar] [CrossRef]
Figure 1. Relationships between distance and velocities of competitive swimmers on the freestyle, butterfly and backstroke push start sub-phases and the times to 10 m.
Applsci 12 09278 g001aApplsci 12 09278 g001b
Table 1. Kinematic parameters of the competitive swimmers on the different phases of the push start.
Males Females
ButterflyBackstrokeFront CrawlButterflyBackstrokeFront Crawl
Distance (m)
Glide1.48 ± 0.711.17 ± 0.641.67 ± 0.56 a1.25 ± 0.490.86 ± 0.321.15 ± 0.51
Leg kicking4.52 ± 0.825.14 ± 0.913.59 ± 0.98 b4.09 ± 0.875.03 ± 0.64 b4.02 ± 0.67
Transition0.38 ± 0.18 b1.23 ± 0.641.04 ± 0.66 a0.3 ± 0.170.91 ± 0.7 b0.59 ± 0.45
Surface 4.41 ± 0.49 b2.23 ± 0.942.77 ± 0.544.15 ± 0.37 b2.50 ± 0.862.94 ± 0.54
Overall 6.38 ± 0.71 a7.55 ± 0.58 b6.31 ± 1.12 a5.65 ± 1.026.80 ± 0.73 b5.68 ± 0.96
Velocity (m/s)
Glide2.42 ± 0.24 a2.21 ± 0.322.32 ± 0.25 a2.04 ± 0.242.11 ± 0.412.08 ± 0.23
Leg kicking1.77 ± 0.16 a1.67 ± 0.09 a1.73 ± 0.2 a1.55 ± 0.151.42 ± 0.15 b1.54 ± 0.14
Transition1.63 ± 0.501.75 ± 0.13 a1.71 ± 0.28 a1.48 ± 0.351.38 ± 0.141.41 ± 0.34
Surface1.59 ± 0.201.17 ± 0.34 b1.62 ± 0.221.46 ± 0.261.15 ± 0.41 b1.47 ± 0.34
Overall1.81 ± 0.13 a1.93 ± 0.09 a2.03 ± 0.23 a1.59 ± 0.131.54 ± 0.141.62 ± 0.11
Time to 10 m (s)
4.49 ± 0.42 a5.01 ± 0.544.66 ± 0.374.95 ± 0.625.35 ± 0.87 b4.83 ± 0.72
a Gender differences (p < 0.05) within the same stroke. b Stroke differences (p < 0.05) with all the remaining groups in the same gender.
Table 2. The results from the linear multiple regression model with the coefficients and their 95% confidence intervals for each phase of the push start.
R2pInterceptβGlideΒLeg KickingβTransitionβSurface
Front-crawl0.200.3908.03
(5.35; 10.72)
Distance−0.19
(−0.55; 0.16)
−0.19
(−0.43; 0.06)
0.13
(−0.19; 0.45)
−0.09
(−0.52; 0.33)
Velocity−0.19
(−1.20; 0.90)
−0.26
(−1.87; 1.36)
−0.15
(−0.79; 0.49)
−0.67
(−1.43; 0.08)
Backstroke0.5860.0497.48
(3.61; 11.35)
Distance−0.41
(−1.19; 0.36)
0.17
(−0.43; 0.78)
0.53 *
(−0.13; 1.18)
−0.28
(−0.79; 0.22)
Velocity0.74
(−0.61; 2.09)
−5.05 *
(−8.97; −1.12)
1.98 *
(−0.39; 4.35)
0.38
(−0.77; 1.52)
Butterfly0.500<0.0018.63
(6.88; 10.39)
Distance−0.03
(−0.27; 0.20)
0.12
(−0.04; 0.28)
−0.10
(−0.91; 0.70)
−0.12
(−0.47; 0.23)
Velocity−0.03
(−0.67; 0.62)
−1.86 **
(−2.92; −0.80)
0.13
(−0.23; 0.49)
−0.57
(−1.22; 0.08)
Note: Statistical effect at <0.05 (*) or <0.01 (**), respectively.
Publisher’s Note: MDPI stays neutral with regard to jurisdictional claims in published maps and institutional affiliations.

