Featured Application
This paper describes methods that can be used to accurately analyze the polyphenolic composition in hard apple cider. It also explains why astringency in cider cannot be analyzed with the laboratory-based methods that are currently available for wine.
Abstract
The production of hard apple cider frequently involves considerations based on the balance between fermentable sugars and titratable acidity and/or pH. However, these are not the only attributes that influence the sensory properties of cider. Various groups of polyphenols and tannins influence bitterness, astringency, and mouthfeel, as well as color of the product. In this study, 19 single variety hard apple ciders were evaluated using analytical methods originally developed for wines. The aim was to determine how the cider matrix affects the functionality of each method. The results indicate that most assays work with sufficient accuracy with the exception of protein precipitation methods. Due to interferences of polysaccharides with the protein reaction, those assays are poorly reproducible and do not reflect the actual polyphenol or tannin concentration. The analytical determination of astringency is also influenced by this interference, since it traditionally uses the concept of protein precipitation as well. Liquid chromatography as a selective method can be readily applied to cider. Other colorimetric methods or non-protein precipitation methods, such as the Folin-Ciocalteu assay, the Methylcellulose Precipitation assay, and the Iron-Reactive Phenolics assay, can be used to classify apple ciders and make decisions based on the desired bitterness and astringency profile.
1. Introduction
Tannins are an essential group of components in many foods and beverages and are reported to influence visual appearance [1] and texture [2], as well as the flavor profile [3,4,5]. These relationships have been thoroughly described in beverages such as wine [3] and beer [6] but other fermented products such as hard cider are lacking that level of understanding. While tannins can have unwanted effects in a mostly colorless product, such as cider, ranging from haziness [7] to undesired browning [8], the positive contributions to texture, mouthfeel, and perceived volume of the beverage [3] are worth mentioning. In the United States, hard ciders are fermented wine-like apple beverages with ethanol concentrations commonly exceeding 7% by volume. Since most commercial hard apple ciders are blends of different cultivars, tannins can be considered important blending quality indicators in addition to sugar, acidity, and pH.
The overall concentration of tannin material in cider depends on apple cultivar [9], culturing techniques [10], and processing conditions [11], as well as fermentation and aging treatments [12]. Interestingly, all apple tissue, skin, pulp, and seeds, contain condensed tannins with the highest concentration in the skin. Tannin material in apple cider differs from tannins found in grape wine, mainly due to differences in the average degree of polymerization (aDP) and constituent composition [13]. Le Quéré et al. (2006) found that tannins in cider are generally less polymerized with an aDP between 1.61 and 3.69, compared to wine with an aDP up to 13. Cider tannins are also fairly uniform, containing mostly epicatechin and some catechin in terminal positions [9]. These specific characteristics may impact perceived bitterness and astringency, since it was demonstrated that a lower aDP favors bitterness over astringency [5].
Some phenolic components in apples, for example hydroxycinnamic acids, can have a similar sensory effect [14] but are easier to describe analytically than tannins. Small polyphenols have been analyzed in apples and can be used to characterize and predict bitterness [15]. Tannins or procyanidins on the other hand include a wide range of molecule sizes, which makes them difficult to characterize and quantify accurately. Analyzing the amount of final tannins in cider presents the additional challenge that most of the photometric assays were developed for wine and validated for that specific matrix [3,16,17,18,19]. Apple cider usually demonstrates higher concentrations of polysaccharides [20] that have been shown to react with tannin material, making reactions less predictable [21] and potentially the assay less accurate [22].
A variety of tannin assays were specifically developed for red wines and include the observation of polymeric pigments in the visible light range, and others focus on absorbance in the ultraviolet (UV) spectrum. All of those assays, however, use a fairly broad approach to analyze this diverse group of molecules by either precipitation (Methylcellulose Precipitation Assay [23], Astringency Index [24], or Harbertson Adams Assay [16]) or non-specific color reactions (Folin Ciocalteu method [25,26] or Iron Reactive Phenolics [18]). Reaction conditions, standards, and assay time can vary significantly and yield different information that might be more or less adaptable to other beverages such as apple cider.
The goal of this study was to demonstrate the use of spectrophotometric assays for polyphenols and tannins in a wide variety of hard apple ciders and suggest interpretation and modification approaches for that matrix compared to wine made from grapes.
2. Materials and Methods
2.1. Cider Production
A broad selection of apple varieties was sourced from the NC State Cooperative Extension Center in Avery County, North Carolina and directly processed into juice in the orchard. Table 1 shows the apple cultivars including the most important analytical juice data. It is worth noting that despite their classification, the vast majority of apples in this study are heirloom varieties that are not commonly grown as eating apples.

Table 1.
Apple cultivars included in this study, in alphabetic order with all relevant juice and cider data (JCA: Juice/cider apple; DA: Dessert apple; CrA: Crab apple).
The raw juice was then clarified over night at 4 °C, racked off the sediment, and inoculated with yeast (Saccharomyces cerevisiae W15, Scott Laboratories, Petaluma, CA, USA) following the manufacturer’s instructions. All cider fermentations received two separate doses of 50 ppm diammonium phosphate (Scott Laboratories, Petaluma, CA, USA) as a nutrient supplement on days two and four of fermentation. After a fermentation time of five to eight days, the ciders were stored at 4 °C until they reached visual clarity and were then racked twice. Stabilization was achieved by the addition of 100 ppm of sulfur dioxide (Scott Laboratories, Petaluma, CA, USA). All ciders were canned and stored in the aluminum cans at 4 °C until further analysis. Storage conditions in cans exclude oxygen, humidity, light, and other external influences that could accelerate the aging of the product.
2.2. Polyphenol, Astringency, and Tannin Analyses
Color characteristics of the ciders were evaluated by UV-Vis spectrophotometry (Lambda 25 UV-Vis spectrophotometer, PerkinElmer Inc., Waltham, MA, USA) at 420 nm representing yellow and 520 nm representing red. The sum of these two absorbances is used as total color and is interpreted as the slight yellow to orange color range observed in apple ciders.
Total polyphenols were photometrically analyzed using the Folin-Ciocalteu method as described by Singleton and Rossi [25], with modifications from Möbius and Görtges [26]. Total tannins were characterized using the methylcellulose (MC) precipitation assay according to Sarneckis, Dambergs, Jones, Mercurio, Herderich and Smith [23] with minor modifications. The calibration curve was made with (+)-Catechin hydrate (Sigma-Aldrich, St. Louis, MO, USA) in a range between 10 and 500 mg/L. In order to test a different precipitation agent in the cider matrix, MC was substituted by bovine serum albumin (VWR, Radnor, PA, USA) at a concentration of 1 g/L in ethanolic tartrate buffer (2.5 g/L potassium bitartrate in 12% ethanol, pH 3.6). Total iron-reactive phenolics were analyzed as described by Harbertson, Mireles and Yu [18].
Cider astringency was analyzed according to Monteleone, Condelli, Dinnella and Bertuccioli [24] with modifications suggested by Durner [27] and further modifications as follows. Cider samples were not diluted prior to analysis due to the low tannin concentration compared to wine. Bovine Serum Albumin (VWR, Radnor, PA, USA) was used as a protein source and turbidity was analyzed by spectrophotometry at 860 nm. An astringency index was calculated by setting the ratio between treatment with protein and control. In order to be able to compare the astringency results to samples with no known interferences, a total of ten red wines made from Barbera, Syrah, Cabernet Sauvignon, and Touriga Nacional were randomly selected from Fresno State Winery. The wines were analyzed using the MCP total tannin assay and the astringency assay described above.
Monomeric phenolics were analyzed using an Infinity II 1260 LC-DAD instrument (Agilent Technologies Inc., Folsom, CA, USA) with a method modified from a protocol previously described by Sommer and Cohen [28] for anthocyanins. The analytical column was changed to a Poroshell 120 EC-C18 with the dimensions 4.6 × 100 mm and a particle size of 2.7 µm (Agilent Technologies Inc., Folsom, CA, USA). The gradient was adjusted to the new column length and was set as follows. Conditions started at a 100% mobile phase A (10 mM KH2PO4/H3PO4 buffer at pH 1.5 in 5% acetonitrile in water; mobile phase B: 10 mM KH2PO4/H3PO4 buffer at pH 1.5 in 50% acetonitrile in water), decreased to 85% by 7 min, from 85% to 70% after 15 min, from 70% to 60% by 20 min, from 60% to 40% by 24 min, and to 10% after 27 min. After 30 min, it was then set back to initial conditions (100% mobile phase A) for three minutes to reach equilibrium (total analysis time 33 min). For the detection of various phenolic compounds in cider, the detection wavelengths were set to 280 nm and 320 nm. Selected compounds were quantified with an external calibration using pure standards (all purchased from VWR, Radnor, PA, USA). The limits of quantification were determined by setting the threshold to a signal to noise ratio of 10:1. Unknown peaks were identified based on the retention time of known standards and spectral information from the literature. Following the recommendation of Alonso-Salces, Herrero, Barranco, Berrueta, Gallo and Vicente [15], unknown compounds were appointed to known molecules if they demonstrated spectral similarities; for example, a compound was labelled as p-coumaric acid derivative if the spectrum matched that of p-coumaric acid but the retention time did not. However, a number of peaks could not be identified with reasonable certainty, so all quantifiable peaks with an absorbance at 280 nm were summarized as total flavanols and expressed as catechin equivalents. All quantifiable peaks at 320 nm were summarized as total hydroxycinnamates and calculated as caffeic acid equivalents.
All analytical methods described above were performed in duplicates.
2.3. Statistical Analyses
Data handling and statistical analysis (Spearman correlation analysis) were conducted using SigmaPlot 14.0 (Systat Software Inc., San Jose, CA, USA).
3. Results and Discussion
Total polyphenols of all hard apple cider samples were analyzed via the Folin-Ciocalteu method right before canning and after 18 months of storage. During aging, smaller polyphenols are expected to polymerize in order to form what is commonly summarized as tannins. The perceived bitterness is changing to a more astringent impression, improving the structure and mouthfeel and ultimately making the cider more desirable [29]. There is in fact an analytical reduction of polyphenols of around 8% on average in the first 18 months (Figure 1). The total reduction depends on the starting level of gallic acid equivalents (Spearman Correlation Coefficient −0.51, p-value 0.027) and can range from no significant change to a total of almost 17%. Only one of the 19 samples demonstrated a slight analytical increase in total polyphenols with the Folin-Ciocalteu method. The reasons for this reduction are unclear but can be hypothesized to be due to polymerization and oxidation reactions that increase the molecule size as well as reduce the number of hydroxyl groups. This would lead to a lower number of reactive sites for the assay after 18 months of aging, leading to a lower color reaction in the assay. Similar observations were previously reported for beer [30] and red wine [31].
Figure 1.
Comparison between total phenolics (Folin-Ciocalteu assay) in fresh apple cider and after 18 months of storage (GAE: Gallic acid equivalents). Error bars represent analytical standard deviation.
The Folin-Ciocalteu assay is generally considered an accurate representation of small and more bitter polyphenols and should always be correlated with a total tannin analysis to reflect the balance between bitterness and astringency. Most of these relationships were studied in grape wine at a molecular level and are fairly well understood. For cider, however, the phenolic composition is less complex and the suitability of current analytical methods to accurately predict bitterness and astringency is mostly unknown. Older studies suggest that flavan-3-ol oligomers up to four units in length contribute to bitterness, while larger molecules cause astringency [24,32,33]. Up to this point, there is very limited information on the validity of analytical methods in a cider matrix and how polysaccharides, such as pectin, that are naturally elevated in apples, can influence the results.
Figure 2 shows the characterization of phenolic material in all apple ciders performed with different methods. There is a strong positive correlation between total polyphenols and total tannins (Spearman Correlation Coefficient 0.89, p-value < 0.001) when the tannins are analyzed using the MCP assay (Figure 2a). Both assays analyze phenolic material as a sum parameter and can be used as an estimate. While the Folin-Ciocalteu assay reacts with all molecules that have reducing hydroxyl groups [25] and can therefore be inaccurate in juice, sweet products, and in the presence of ascorbic acid, the MCP assay includes all molecules that react with methylcellulose and absorb at 280 nm. Consequently, the weakness of this assay is also the rather unspecific nature of the reaction. The strength of both assays, however, lies in the robustness of the method. Except for the unspecific reaction mechanism, there are no known interferences with matrix components in wine or cider [23,32].
Figure 2.
Analyses of phenolic material in apple ciders. (a) Total phenolics and total tannins, (b) iron reactive tannins and total color (GAE: Gallic acid equivalents; CE: Catechin equivalents). Total color is shown as the sum of absorbance values at 420 nm (yellow) and 520 nm (red). Error bars represent analytical standard deviation.
Both total polyphenols and total tannins correlate significantly with the iron-reactive polyphenols shown in Figure 2b (Correlation coefficient 0.89, p-value < 0.001 for both correlations), indicating that the phenolic substances in apple cider are similar enough to those in grape wine, for which the original assays were developed to produce consistent results. This could be expected, since monomeric flavan-3-ols and hydroxycinnamic acids as well as polymeric polyphenols consisting of catechin and epicatechin can be found in both cider and grape wine [11,34,35].
Iron-reactive phenolics also show a strong positive correlation with cider color (Spearman Correlation Coefficient 0.76, p-value < 0.001), indicating that the brown and red color in apple cider is based on phenolic compounds. This is in agreement with previous studies conducted by Le Deun, et al. [33] and Mazza and Velioglu [36]. The red color portion, as part of the total color, however, varies between cultivars. For the most part, only red flesh apples show significant concentrations of anthocyanins, which are also structurally different from anthocyanins in red grape wine [36]. Orange hues found in some apple ciders are caused by oxidized and polymerized polyphenols that are colorless in their reduced state [33]. The orange color, however, can only be quantified by adding the absorbance at 420 nm and 520 nm, even though the red portion might not originate from anthocyanins.
One of the main objectives for analyzing tannins in beverages is the estimation of perceived astringency for the consumer. While astringency in the mouth is caused by the precipitation of lubricating salivary proteins by phenolic compounds [2], different tannin assays use different methods of precipitation. In order to mimic that tannin precipitable protein fraction, bovine serum albumin (BSA) is used as a model protein in some assays [16,27]. The methylcellulose precipitation (MCP) assay, on the other hand, is performed under conditions that essentially salt-out all tannin material independent of the chemical composition. For red wines, this was demonstrated to correlate with perceived astringency [34,35]. Figure 3 shows a comparison of the relationship between MCP and astringency data for red wines and ciders. While not perfect, the correlation between total tannins and the astringency index in red wines is good (n = 10, R2 = 0.572). In ciders, the correlation does not exist (n = 19, R2 = 0.003), even though some of the ciders are analytically clearly dominated by tannins.
Figure 3.
Correlation between tannin material and astringency in apple cider compared to red wine.
The reasons for that inconsistency can be speculated to relate to higher polysaccharide concentrations in the hard cider compared to wine. Polysaccharides can interfere with the reaction between proteins and polyphenols [21,22] and while reacting with methylcellulose, the interaction with BSA is limited. Consequently, it remains unclear if astringency can be accurately evaluated in apple cider analytically without the involvement of a trained sensory panel. The role of pectin in the sensory perception of astringency has been known for some time and is used commonly during sensory panels. Pectin-enriched water can be served in between red wine samples to cleanse the palate and prepare for the next sample [37,38]. This strategy alludes to a known interaction between tannins and pectin, as well as between pectin and proteins in the saliva. It is also possible that the use of a different protein could solve the analytical problem, for example the application of saliva protein instead of BSA [35,39]. Any cross-reaction between the protein and polysaccharides needs to be evaluated for the astringency index to be meaningful in high-polysaccharide environments.
Figure 4 supports that hypothesis, with the direct comparison of tannin data produced by using methylcellulose and BSA as precipitation agents. Even though Crab apples still show the highest concentration of tannins with both methods, the numbers produced using the MCP assay are significantly higher in most samples. This again illustrates the challenge of using a selective protein such as BSA in a matrix that is rich in polysaccharides. Similar to the astringency index, tannin concentrations analyzed with BSA are consistent on a fairly low level not exceeding 200 mg/L, calculated as catechin equivalents. Using methylcellulose, the calculated catechin equivalent exceeds 1400 mg/L in the same sample. A correlation analysis revealed that there is no correction factor that would allow to account for the matrix effect and calculate the analytical response with a different precipitation agent. It can be hypothesized that the MCP assay produces more reliable results in apple cider due to the known interaction of BSA with other macromolecules.
Figure 4.
Comparison between methylcellulose (MCP Assay) and bovine serum albumin (BSA) in the same spectrophotometric tannin precipitation assay. Error bars represent analytical standard deviation.
In order to characterize differences regarding monomeric polyphenols and phenolic acids, liquid chromatography responses were recorded at 280 nm representing total polyphenols and 320 nm, which shows hydroxycinnamic acids and structurally similar molecules. Figure 5 shows sample chromatograms for both wavelengths and Table 2 includes the quantification data for all peaks that could be reliably identified with standards.
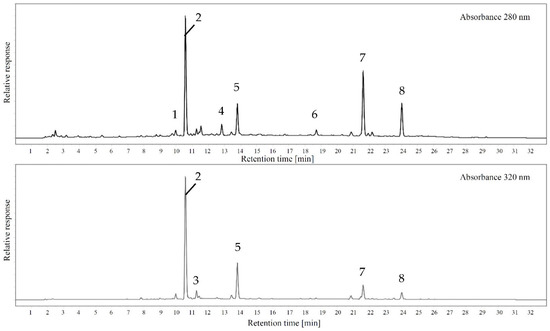
Figure 5.
Example chromatogram of Geneva Crab cider analyzed at 280 nm and 320 nm (1: catechin; 2: chlorogenic acid; 3: caffeic acid; 4: epicatechin; 5: unknown p-coumaric acid derivative; 6: unknown procyanidin; 7: unknown caffeic acid derivative; 8: unknown procyanidin).
Table 2.
Quantitative data of monomeric phenolic compounds analyzed with LC-DAD at 280 nm and 320 nm.
Surprisingly, given the large differences in total polyphenols and total tannins, the chromatograms of all apple ciders are fairly uniform. A similar number of peaks with comparable peak area ratios were recorded independent of the classification as juice, dessert, or crab apple. However, the quantities of flavanols and hydroxycinnamic acids vary significantly among all samples. Table 2 shows the quantitative data for all ciders organized by compounds that were quantified with a pure standard and the total peak areas at 280 nm and 320 nm. In comparison among the classifications as juice, dessert, or crab apple, the main assumptions regarding phenolic composition could be confirmed. While dessert apples contain the lowest levels and crab apples the highest concentrations, juice or cider apples show a wider range. For example, Black Limbertwig as a cider apple is analytically similar to the dessert apple group, while Horse, also a cider apple, is indistinguishable from the crab apples with more than 2 g/L total flavanols.
Some of the variability within the dataset could also be related to processing steps during cider production. Previous studies reported mostly data that were analyzed in fresh apples prior to any processing [9,34,38]. Compounds such as catechin, epicatechin, or caffeic acid are very sensitive to oxidation and fairly reactive with other juice components [8]. This could lead to a loss of these compounds during juicing, fermentation, and bottling. The concentrations shown in Table 2 should therefore not be used to categorize the apple but rather to classify the cider. However, the correlations between the photometric data described above and the concentrations determined by HPLC-DAD are highly significantly positive. The Spearman Correlation Coefficient for the comparison between FolinC and total flavanols is 0.83 with a p-value of <0.001. Similarly, when comparing FolinC to total hydroxycinnamic acids, the Spearman Correlation Coefficient is 0.91 with a p-value of <0.001. This supports the working hypothesis that apple ciders can be classified and categorized with sufficient accuracy using grape wine-related methods. We therefore suggest including total polyphenols (FolinC) and total tannins (using the MCP assay) in the classification attributes for cider apples. Figure 6 summarizes the most relevant analytical data for cider production and groups the samples by category.
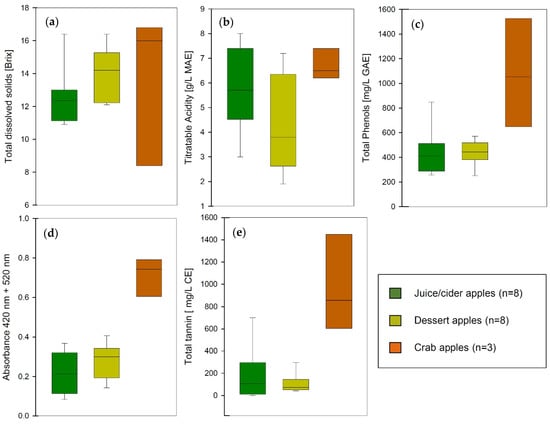
Figure 6.
Analytical data of apple varieties sorted by classification as dessert apple, juice or cider apple, and crab apple (MAE: malic acid equivalents; GAE: gallic acid equivalents; CE: catechin equivalents). (a) total dissolved solids, (b) titratable acidity, (c) total polyphenols, (d) total color, (e) total tannins.
Juice and cider apples are expected to have very little color and a more balanced sugar to acidity ratio, while dessert apples for direct consumption are usually characteristically sweeter, mildly acidic, with very low astringency, and hold up well during storage. These simple classifications based on sugar and total acidity have been used in the industry for a long time; however, in dry hard apple cider where residual sugar does not mask any bitterness or astringency, polyphenols and tannins play an important role in the overall perception of the product.
The apple varieties included in this study demonstrate the characteristics that could be expected from cider apples and dessert apples. While the sugar levels are slightly higher on average in dessert apples, the average acidity is higher in cider apples. This can be explained by the technical necessity to keep the pH of the cider low during and after fermentation for microbial and chemical stability. As already mentioned earlier, the level of polyphenols correlates well with the color of the cider but the concentration of tannins is considerably lower in dessert apples compared to juice varieties. The exception to all these patterns is crab apples. Even though the sample size in this study is relatively small, crab apples display a wide range in most attributes and generally higher concentrations of all solutes. This illustrates their great potential as a blending partner for cider production to build structure and mouthfeel in the beverage. Using different apple cultivars instead of oenological tannins or additives might provide the same effect with the potential for improvements in production and cost efficiency.
The analytical tools to evaluate the composition of hard ciders and to make these production decisions are reasonably accurate except for the analysis of astringency. Some changes to the assay are required to better capture astringency without the disrupting effect of polysaccharides. The main assays that can be recommended for apple cider are the Folin Ciocalteu method and Iron Reactive Phenolics to analyze polyphenols and the Methylcellulose Precipitation assay to analyze tannins.
4. Conclusions
The analysis of phenolic compounds in hard apple cider using methods that were established for grape wine is feasible. Robust methods such as the Folin-Ciocalteu assay, Iron-Reactive phenolics, or the MCP assay demonstrate good correlations and reproducible results. Protein precipitation methods, on the other hand, should not be used for apple cider due to possible matrix interactions. Further research is required to clarify the effect of pectolytic enzymes and other pre-treatment options on the accuracy of protein precipitation methods and their potential use in cider.
Author Contributions
Conceptualization, S.S. and S.D.C.; methodology, S.S.; formal analysis, S.S. and A.F.A.; investigation, S.S. and A.F.A.; data curation, S.S. and A.F.A.; writing—original draft preparation, S.S.; writing—review and editing, S.S. and S.D.C.; visualization, S.S. All authors have read and agreed to the published version of the manuscript.
Funding
This research received no external funding.
Institutional Review Board Statement
Not applicable.
Informed Consent Statement
Not applicable.
Data Availability Statement
Not applicable.
Acknowledgments
The authors would like to thank Douglas Hundley from the NC State Cooperative Extension Center in Avery County, North Carolina for selecting a broad variety of apples for this study and delivering the juice to our lab. His level of experience and knowledge in terms of heritage apples is unmatched in this part of the world.
Conflicts of Interest
The authors declare no conflict of interest.
References
- Cheynier, V.; Dueñas-Paton, M.; Salas, E.; Maury, C.; Souquet, J.-M.; Sarni-Manchado, P.; Fulcrand, H. Structure and Properties of Wine Pigments and Tannins. Am. J. Enol. Vitic. 2006, 57, 298–305. [Google Scholar]
- McRae, J.M.; Kennedy, J.A. Wine and grape tannin interactions with salivary proteins and their impact on astringency: A review of current research. Molecules 2011, 16, 2348–2364. [Google Scholar] [CrossRef] [PubMed]
- Harbertson, J.F.; Spayd, S. Measuring Phenolics in the Winery. Am. J. Enol. Vitic. 2006, 57, 280–288. [Google Scholar]
- Symoneaux, R.; Baron, A.; Marnet, N.; Bauduin, R.; Chollet, S. Impact of apple procyanidins on sensory perception in model cider (part 1): Polymerisation degree and concentration. LWT Food Sci. Technol. 2014, 57, 22–27. [Google Scholar] [CrossRef]
- Symoneaux, R.; Chollet, S.; Bauduin, R.; Le Quéré, J.M.; Baron, A. Impact of apple procyanidins on sensory perception in model cider (part 2): Degree of polymerization and interactions with the matrix components. LWT Food Sci. Technol. 2014, 57, 28–34. [Google Scholar] [CrossRef]
- Owades, J.; Rubin, G.; Brenner, M. Food tannins measurement, determination of food tannins by ultraviolet spectrophotometry. J. Agric. Food Chem. 1958, 6, 44–46. [Google Scholar] [CrossRef]
- Siebert, K.J.; Carrasco, A.; Lynn, P.Y. Formation of Protein−Polyphenol Haze in Beverages. J. Agric. Food Chem. 1996, 44, 1997–2005. [Google Scholar] [CrossRef]
- Li, H.; Guo, A.; Wang, H. Mechanisms of oxidative browning of wine. Food Chem. 2008, 108, 1–13. [Google Scholar] [CrossRef]
- Sanoner, P.; Guyot, S.; Marnet, N.; Molle, D.; Drilleau, J.F. Polyphenol Profiles of French Cider Apple Varieties (Malus domestica sp.). J. Agric. Food Chem. 1999, 47, 4847–4853. [Google Scholar] [CrossRef]
- Lea, A.G.H.; Beech, F.W. The phenolics of ciders: Effect of cultural conditions. J. Sci. Food Agric. 1978, 29, 493–496. [Google Scholar] [CrossRef]
- Lea, A.G.H.; Timberlake, C.F. The phenolics of ciders: Effect of processing conditions. J. Sci. Food Agric. 1978, 29, 484–492. [Google Scholar] [CrossRef]
- Watrelot, A.A.; Day, M.P.; Schulkin, A.; Falconer, R.J.; Smith, P.; Waterhouse, A.L.; Bindon, K.A. Oxygen exposure during red wine fermentation modifies tannin reactivity with poly-l-proline. Food Chem. 2019, 297, 124923. [Google Scholar] [CrossRef] [PubMed]
- Le Quéré, J.-M.; Husson, F.; Renard, C.M.; Primault, J. French cider characterization by sensory, technological and chemical evaluations. LWT Food Sci. Technol. 2006, 39, 1033–1044. [Google Scholar] [CrossRef]
- Hufnagel, J.C.; Hofmann, T. Orosensory-Directed Identification of Astringent Mouthfeel and Bitter-Tasting Compounds in Red Wine. J. Agric. Food Chem. 2008, 56, 1376–1386. [Google Scholar] [CrossRef]
- Alonso-Salces, R.M.; Herrero, C.; Barranco, A.; Berrueta, L.A.; Gallo, B.; Vicente, F. Technological classification of basque cider apple cultivars according to their polyphenolic profiles by pattern recognition analysis. J. Agric. Food Chem. 2004, 52, 8006–8016. [Google Scholar] [CrossRef]
- Harbertson, J.F.; Picciotto, E.A.; Adams, D.O. Measurement of Polymeric Pigments in Grape Berry Extract sand Wines Using a Protein Precipitation Assay Combined with Bisulfite Bleaching. Am. J. Enol. Vitic. 2003, 54, 301–306. [Google Scholar]
- Kennedy, J.A.; Ferrier, J.; Harbertson, J.F.; des Gachons, C.P. Analysis of Tannins in Red Wine Using Multiple Methods: Correlation with Perceived Astringency. Am. J. Enol. Vitic. 2006, 57, 481–485. [Google Scholar]
- Harbertson, J.F.; Mireles, M.; Yu, Y. Improvement of BSA tannin precipitation assay by reformulation of resuspension buffer. Am. J. Enol. Vitic. 2015, 66, 95–99. [Google Scholar] [CrossRef]
- Australian Wine Research Institute. Determination of Tannins in Grapes and Red Wine Using the MCP (Methyl Cellulose Precipitable) Tannin Assay; AWRI: Adelaide, Australia, 2007. [Google Scholar]
- Mangas, J.J.; Moreno, J.; Rodríguez, R.; Picinelli, A.; Suárez, B. Analysis of Polysaccharides in Cider: Their Effect on Sensory Foaming Properties. J. Agric. Food Chem. 1999, 47, 152–156. [Google Scholar] [CrossRef][Green Version]
- Sommer, S.; Weber, F.; Harbertson, J.F. Polyphenol–Protein–Polysaccharide Interactions in the Presence of Carboxymethyl Cellulose (CMC) in Wine-Like Model Systems. J. Agric. Food Chem. 2019, 67, 7428–7434. [Google Scholar] [CrossRef]
- Graves, J.; Sommer, S. Polysaccharides Influence the Results of Polymeric Pigment Analysis in Red Wines. ACS Food Sci. Technol. 2021, 1, 1770–1775. [Google Scholar] [CrossRef]
- Sarneckis, C.J.; Dambergs, R.G.; Jones, P.; Mercurio, M.; Herderich, M.J.; Smith, P.A. Quantification of Condensed Tannins by Precipitation with Methyl Cellulose: Development and Validation of an Optimised Tool for Grape and Wine Analysis. Aust. J. Grape Wine Res. 2006, 12, 39–49. [Google Scholar] [CrossRef]
- Monteleone, E.; Condelli, N.; Dinnella, C.; Bertuccioli, M. Prediction of perceived astringency induced by phenolic compounds. Food Qual. Prefer. 2004, 15, 761–769. [Google Scholar] [CrossRef]
- Singleton, V.L.; Rossi, J.A. Colorimetry of Total Phenolics with Phosphomolybdic-Phosphotungstic Acid Reagents. Am. J. Enol. Vitic. 1965, 16, 144–158. [Google Scholar]
- Möbius, C.H.; Görtges, S. Polyphenolbestimmung für die Praxis. Weinwissenschaft 1974, 29, 241–253. [Google Scholar]
- Durner, D. Mikrooxygenierung von Rotweinen; Cuvillier Verlag: Göttingen, Germany, 2011. [Google Scholar]
- Sommer, S.; Cohen, S.D. Comparison of Different Extraction Methods to Predict Anthocyanin Concentration and Color Characteristics of Red Wines. Fermentation 2018, 4, 39. [Google Scholar] [CrossRef]
- Williams, A.A.; Lea, A.G.H.; Timberlake, C.F. Measurement of Flavor Quality in Apples, Apple Juices, and Fermented Ciders. In Flavor Quality: Objective Measurement; ACS Symposium Series; American Chemical Society: Washington, DC, USA, 1977; Volume 51, pp. 71–88. [Google Scholar]
- Mikyška, A.; Krofta, K. Assessment of changes in hop resins and polyphenols during long-term storage. J. Inst. Brew. 2012, 118, 269–279. [Google Scholar] [CrossRef]
- Puértolas, E.; Saldaña, G.; Condón, S.; Álvarez, I.; Raso, J. Evolution of polyphenolic compounds in red wine from Cabernet Sauvignon grapes processed by pulsed electric fields during aging in bottle. Food Chem. 2010, 119, 1063–1070. [Google Scholar] [CrossRef]
- Herderich, M.J.; Smith, P.A. Analysis of grape and wine tannins: Methods, applications and challenges. Aust. J. Grape Wine Res. 2005, 11, 205–214. [Google Scholar] [CrossRef]
- Le Deun, E.; Van der Werf, R.; Le Bail, G.; Le Quéré, J.-M.; Guyot, S. HPLC-DAD-MS Profiling of Polyphenols Responsible for the Yellow-Orange Color in Apple Juices of Different French Cider Apple Varieties. J. Agric. Food Chem. 2015, 63, 7675–7684. [Google Scholar] [CrossRef]
- Wilhelmy, C.; Pavez, C.; Bordeu, E.; Brossard, N. A Review of Tannin Determination Methods Using Spectrophotometric Detection in Red Wines and Their Ability to Predict Astringency. S. Afr. J. Enol. Vitic. 2021, 42, 1. [Google Scholar] [CrossRef]
- Pires, M.A.; Pastrana, L.M.; Fuciños, P.; Abreu, C.S.; Oliveira, S.M. Sensorial Perception of Astringency: Oral Mechanisms and Current Analysis Methods. Foods 2020, 9, 1124. [Google Scholar] [CrossRef] [PubMed]
- Mazza, G.; Velioglu, Y.S. Anthocyanins and other phenolic compounds in fruits of red-flesh apples. Food Chem. 1992, 43, 113–117. [Google Scholar] [CrossRef]
- Vidal, L.; Antúnez, L.; Giménez, A.; Ares, G. Evaluation of Palate Cleansers for Astringency Evaluation of Red Wines. J. Sens. Stud. 2016, 31, 93–100. [Google Scholar] [CrossRef]
- Ross, C.F.; Hinken, C.; Weller, K. Efficacy of Palate Cleansers for Reduction of Astringency Carryover During Repeated Ingestions of Red Wine. J. Sens. Stud. 2007, 22, 293–312. [Google Scholar] [CrossRef]
- Kallithraka, S.; Bakker, J.; Clifford, M.N. Evidence that Salivary Proteins are Involved in Astringency. J. Sens. Stud. 1998, 13, 29–43. [Google Scholar] [CrossRef]


Publisher’s Note: MDPI stays neutral with regard to jurisdictional claims in published maps and institutional affiliations. |
© 2022 by the authors. Licensee MDPI, Basel, Switzerland. This article is an open access article distributed under the terms and conditions of the Creative Commons Attribution (CC BY) license (https://creativecommons.org/licenses/by/4.0/).