Article

A New Method for Evaluating the Homogeneity and Structure of Remolded Loess Samples with the Air Permeability Coefficient

1
College of Geological Engineering and Geomatics, Chang’an University, Xi’an 710054, China
2
Open Research Laboratory of Geotechnical Engineering, Ministry of Land and Resources, Xi’an 710054, China
3
Institute of Rock and Soil Mechanics, Chinese Academy of Sciences, Wuhan 430071, China
*
Author to whom correspondence should be addressed.
Appl. Sci. 2022, 12(19), 9412; https://doi.org/10.3390/app12199412
Submission received: 29 August 2022 / Revised: 15 September 2022 / Accepted: 16 September 2022 / Published: 20 September 2022

Abstract

:
The uniformity of remolded loess samples prepared in the laboratory directly determines the reliability of various test results. While many tests have been designed to reflect the properties of undisturbed loess, there are obvious structural differences between remolded and undisturbed loess. Therefore, it is of great theoretical and practical significance to explore a non-destructive evaluation index of the uniformity and structure of loess samples for indoor geotechnical tests. In this study, the loess from the Malan loess section of the Chanhe River in Xi’an, China, was used as the experimental material to analyze the uniformity of remolded loess samples in terms of the stress distribution, stratification range, and sample variance. Based on the test results, the feasibility of using the air permeability coefficient as an index by which to evaluate the uniformity and structure of loess samples is investigated for the first time. The results demonstrate that when the overall height of the sample is fixed, the higher the designed dry density of the sample and the lower the air permeability of the sample. Moreover, when the designed dry density of the sample is constant, with the increase in the overall height of the sample, the range of the stratified dry density of the sample gradually decreases, as does the sample variance. The more uniform the sample, the greater the air permeability, and under the same conditions, the air permeability of remolded soil is lower than that of undisturbed loess. SEM images reveal that there is a considerable difference between the structures of undisturbed and remolded loess samples. Remolded loess is characterized by the greatly reduced effectiveness of cementation between skeleton particles, which causes its structure to be weaker than that of undisturbed loess. In this paper, a quantitative index of loess structure based on air permeability is proposed, and the test results show that the index can adequately reflect the loess structure. Due to its obvious advantages of non-destructiveness, high efficiency, economy, convenience, and high speed, it has a unique advantage for the evaluation of the uniformity and structure of remolded soil samples.

1. Introduction

Loess, the most important aeolian sand deposit in the Quaternary, is a porous medium system in which soil particles, air, and water coexist [1,2], and its complex material properties have been an enduring research hotspot in the field of loess engineering geology [3,4]. The indoor tests of loess materials are closely related to all types of engineering construction, and the laboratory test index is an important basis for the evaluation of human engineering activities [5].
Uniformity is a key factor that cannot be ignored in laboratory tests, and it is of far-reaching significance to study the strength, deformation, and stability of loess [6,7,8,9]. Mehlich [10] analyzed the effect of soil bulk density on the uniformity of soil samples. Kuerbis et al. [11] analyzed the homogeneity of soil samples according to the particle size distribution and void ratio. Wen and Li [12] used the maximum potential difference between two carbon steel electrodes at a certain distance from the soil profile as a parameter by which to evaluate soil uniformity. Jiang et al. [13] used planar porosity to evaluate the uniformity of samples. Zheng et al. [14] evaluated the homogeneous damage of soil samples via computer chromatography. Meng and Li [15] used high-precision μCT scanning images to analyze the homogeneity of remolded loess samples. Although many researchers have proposed different methods by which to evaluate the uniformity of samples, most methods are time-consuming, difficult, and expensive, and some methods may inevitably cause irreversible damage to samples.
One of the most important uses of remolded loess samples is to reflect the properties of undisturbed loess [16,17]. Wang and Yue [18] found that the microstructure of undisturbed loess is damaged after disturbance and remolding, and that the change in the dry density has a great influence on the permeability coefficient, which decreases with the increase in the dry density. Based on the theory of soil mechanics, Chen et al. [19] carried out quantitative structural research on remolded and undisturbed saturated loess via triaxial tests. Wu et al. [20] conducted triaxial tests of undisturbed, saturated, and remolded loess with the same dry density, introduced the structural parameters into the dynamic stress–strain relationship of undisturbed loess, and characterized the deformation and dynamic characteristics of loess under dynamic load. Zhang et al. [21] studied the soil–water characteristics of Q3 loess, and found that the pore ratio has an obvious influence on the characteristic soil–water curves of both remolded and undisturbed loess. In the tests of remolded loess samples, researchers can only control the initial dry density and initial moisture content, and cannot improve the structural similarity between samples, because the structure will significantly affect the properties of samples (such as the permeability, collapsibility, strength, deformation characteristics, etc.). Thus, even if the initial dry density, initial moisture content, and uniformity are completely the same, the structural differences between undisturbed and remolded loess will inevitably have a significant impact on the test results. Therefore, if a quantitative index that can accurately characterize the structure of loess can be identified, it could quantitatively explain the structural differences between undisturbed and remolded loess. However, it would also have far-reaching significance for remolded soil tests aimed at reflecting the nature of undisturbed loess, as this index would act as a “bridge” between the properties of undisturbed loess and remolded loess.
In view of these factors, this paper puts forward a new method by which to evaluate the homogeneity and structure of remolded loess samples with an air permeability coefficient. Based on the air permeability tests of in situ, undisturbed, and remolded loess samples, the uniformity of the samples is analyzed via a combination of stress distribution, delamination range, and sample variance. Then, the structural evaluation indexes of loess samples are obtained via air permeability tests of undisturbed, remolded, and undisturbed saturated loess. This method is non-destructive, efficient, economic, convenient, and fast; thus, it has a broad application potential.

2. Test Principle and Scheme
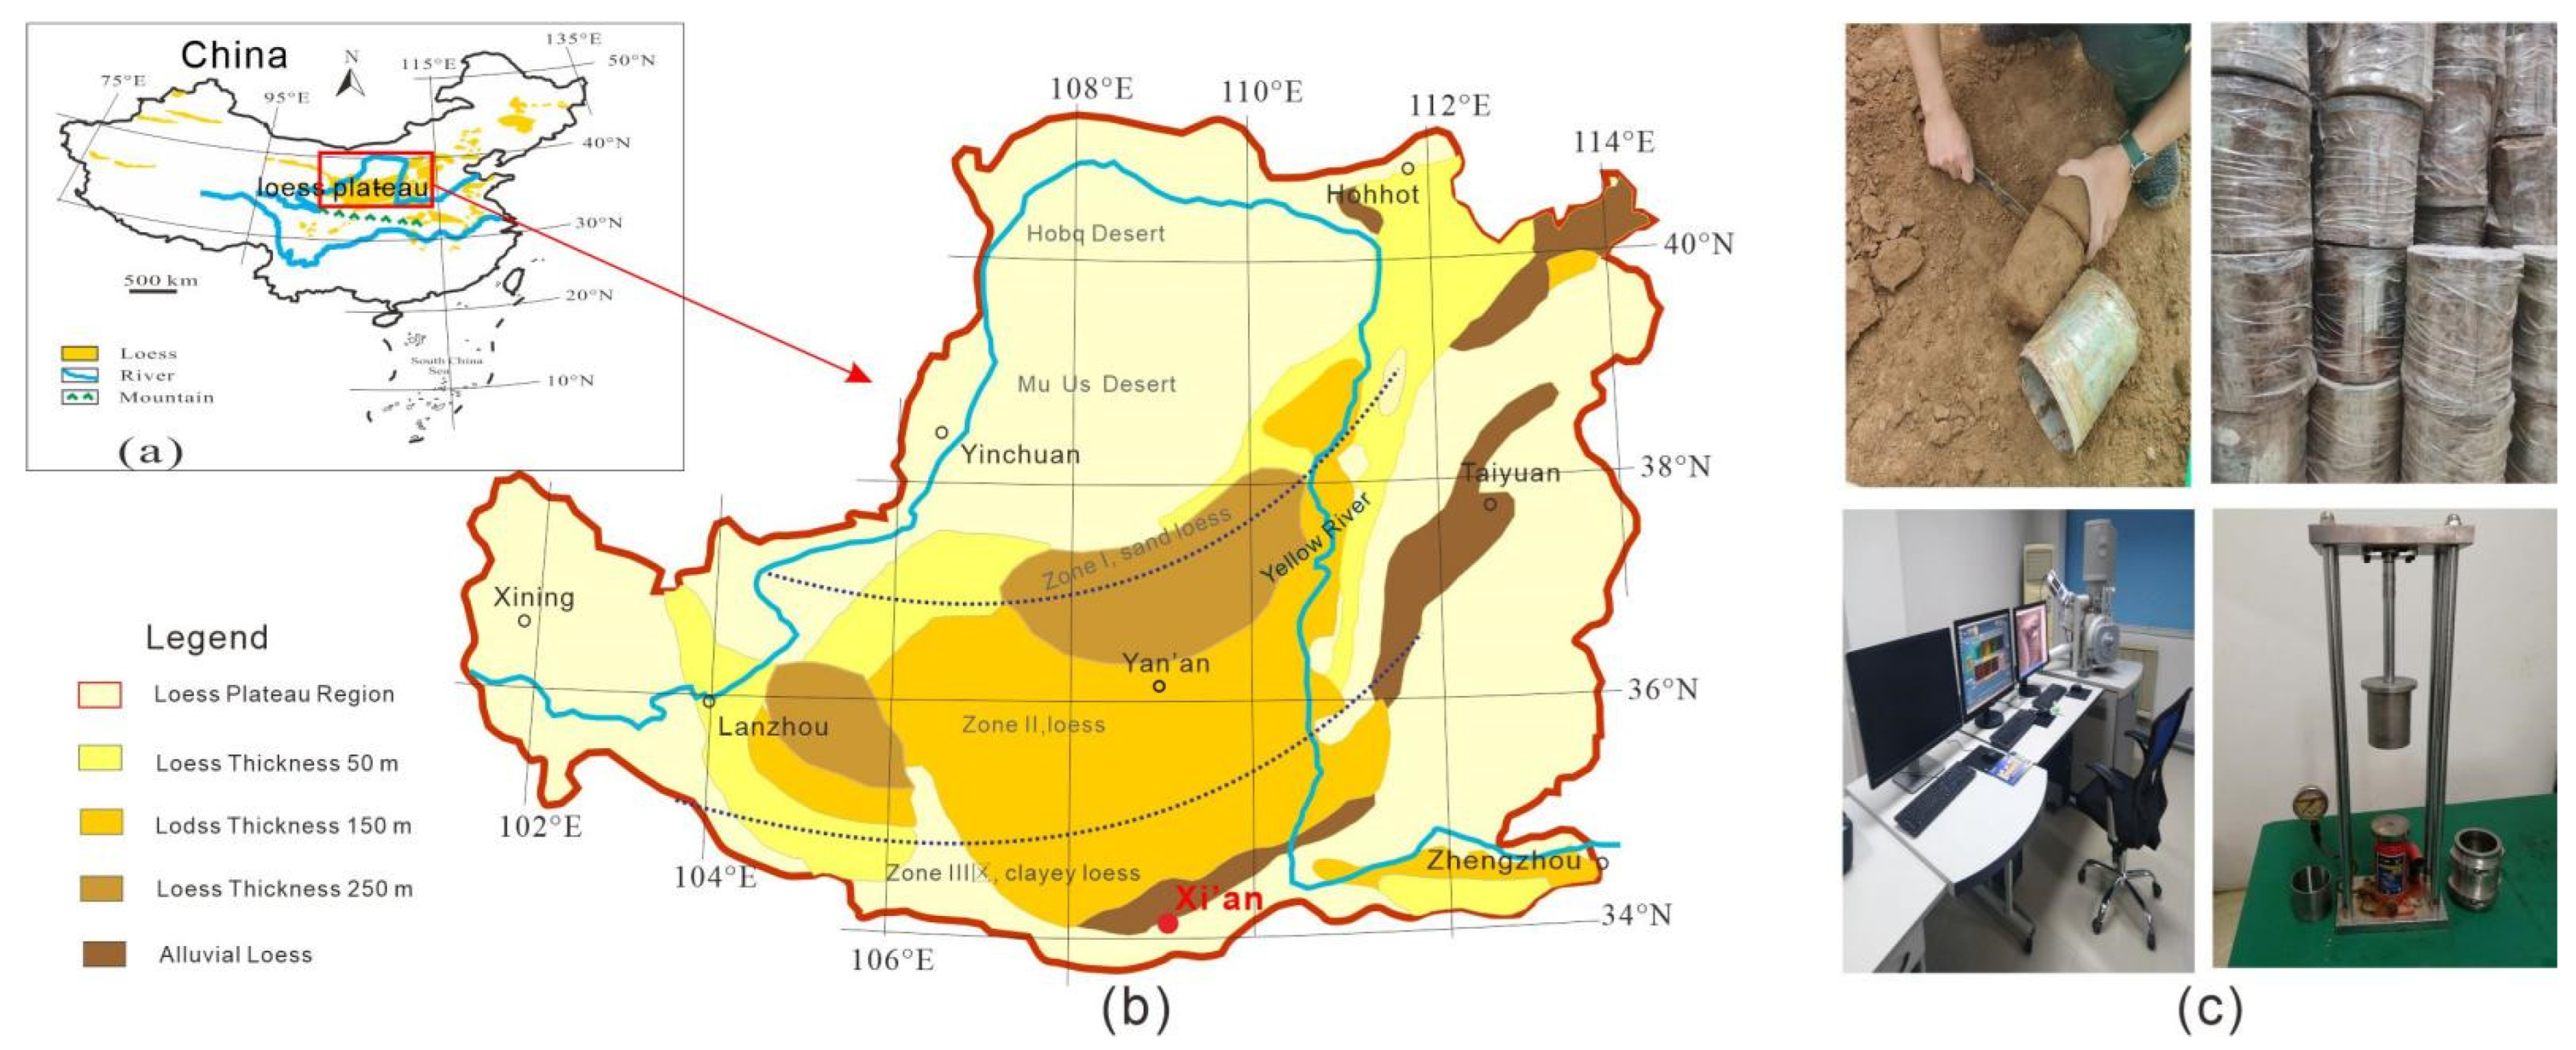
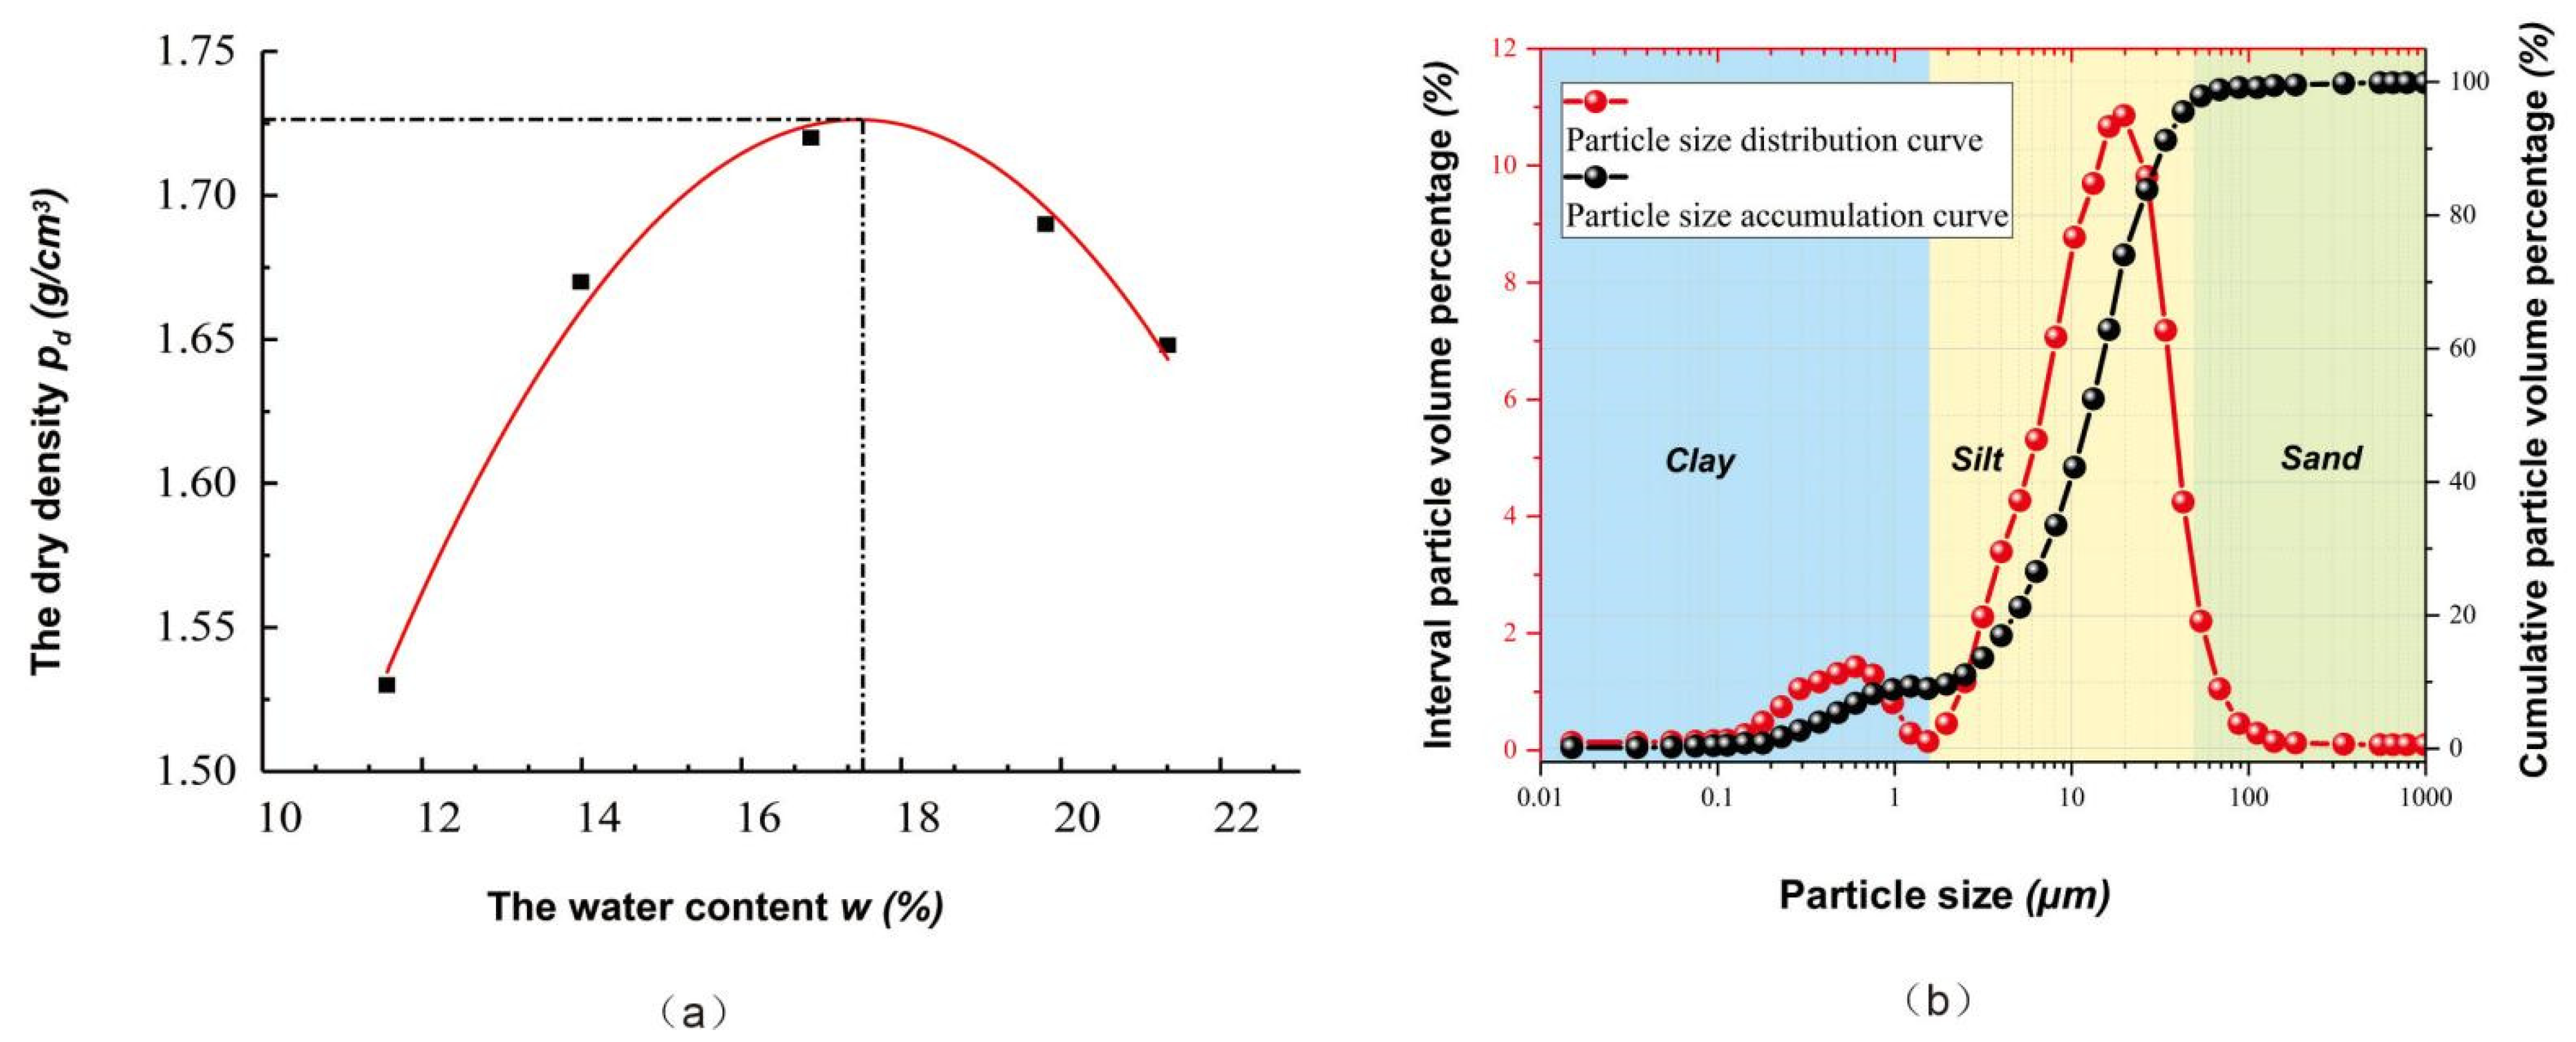
2.1. Test Materials

The undisturbed loess used in the experiment was sampled from the Q3 Malan loess on the loess plateau of the Chanhe third terrace in the eastern region of Xi’an, China, which is a clay loess zone (Figure 1). The basic physical indexes were measured by particle analysis and liquid plastic limit tests, and the data were obtained by indoor compaction tests (Table 1). The compaction curve according to the national geotechnical test standard (GB/SL 237-1999) is presented in Figure 2a [15]. The optimal moisture content of the loess used in this study is 17.49%, and the corresponding maximum dry density is 1.724 g/cm3. The particle size distribution curve and particle size grading accumulation curve of loess samples were measured using a Bettersize2000 laser particle size analyzer (Figure 2b).

2.2. Test Scheme

The air permeability measurement device used in this experiment was an improvement of the ZC-5 air permeability meter (Figure 3) [22,23]. To meet the requirements of the loess permeability measurement range, a vacuum chamber (10,000 mL) was added [24]. Besides, the pressure measurement and control system (the infrared photoelectric measurement module) were improved for a better accuracy and reduced test duration.
The device consists of two kinds of test probes, one of which is a hermetic cover used for in situ tests (the inner radius of the contact probe and the outer radius of the sealing area are 3 and 8 cm, respectively), and the other is a test tube with a sealed base for indoor tests (the base and the test tube are detachable and replaceable) (Figure 3b). For the two kinds of probes, one end of the sample is open to the atmosphere, the valve is closed at the probe, the vacuum pump is used to form negative pressure in the air chamber (the buffer chamber and gas cylinder), and the valve is opened during the test; thus, air can only enter the air chamber after the sample has been tested. The intelligent measurement and control system are connected to a pressure sensor (the pressure gauge of the infrared photoelectric measurement module) to continuously monitor the negative pressure in the vacuum system.
In situ tests were carried out at depths of 2, 4, 6, 8, and 10 m from the surface of the Xi’an loess profile, and soil samples were taken manually. Undisturbed soil samples with different depths were cut into cylindrical samples with a diameter and height of 8 cm, and then fixed in the sample cylinder, the wall of which was sealed with sealant. The operation procedure of the indoor test was the same as that of the in situ measurement. In undisturbed loess laboratory tests, the effect of size is not significant and can be ignored [25]. Undisturbed soil samples for the air permeability test were first vacuumed for 1 h in a vacuum saturator, and were then soaked in deionized water for 10 h. The gas leakage was measured immediately after removal. Considering the sidewall leakage of gas, attention should be paid to the phenomenon of “gas slippage”. Therefore, a layer of Vaseline was applied around the ring knife to act as a sealant [26].
During the preparation of remolded samples, undisturbed Malan loess samples from Xi’an were dried, crushed, and screened (0.5 mm), and loess samples with moisture contents of 11.50%, 13.50%, 15.50%, 17.50%, and 19.50% were prepared with deionized water. After mixing, samples were placed in a moisturizing dish for 48 h to ensure a uniform moisture content. During the test, five groups of undisturbed soil samples with the same dry densities as those of undisturbed soil samples were prepared, and the dry densities were 1.30, 1.41, 1.47, 1.58, and 1.65 g/cm3, respectively. The compaction method was used to improve the sample uniformity [15,27]. The sample cylinder used in the air permeability test was a special rigid ring cutter with a diameter of 8 cm [23,24].
In the uniformity test, the moisture content of the control sample was consistent with the optimal moisture content of soil sample at the depth of 4 m (approximately 17.50%), and the dry densities were 1.3, 1.4, and 1.5 g/cm3, respectively. The overall heights of the samples were 8, 10, 12, 14, and 16 cm, respectively, and the diameter of the rigid ring cutter was 8 cm. To study the change in the dry density of the sample, the entire sample was layered and the change in the dry density of each layer was recorded. After the air permeability test, the prepared sample was stratified every 0.5 cm, i.e., the first 0.5 cm was the first layer, the sum of the first and second 0.5 cm was the second layer, etc. The 8 cm sample was divided into 16 layers from top to bottom, and the dry density of each layer was measured by drying and weighing. The change in the dry density distribution was obtained by using the stratification index to evaluate the uniformity of the soil sample. Moreover, to clearly understand the internal structures of undisturbed and remolded loess and explore the influences of the internal microstructures on the structures, samples of the loess injection grinding plate were also prepared, and images were collected by using a Quanta FEG scanning electron microscope (SEM).

2.3. Calculation Formula of the Air Permeability Coefficient

The air permeability k a was calculated based on the following one-dimensional transient air permeability model of soil [28,29]:
k a = µ a Z V A P a t m · S  
where k a is the air permeability (m2), µ a is the dynamic viscosity of air ( µ a   = 1.81 × 10⁵ Pa·s at 20 °C and 1 atm), A = π · r e 2 is the cross-sectional area of air (m2), r e and Z are the radius and height of the cylindrical sample (m), respectively, V is the total volume, including the pipe volume of the upstream outflow end of the probe penetrator (V = 3549.5 cm3), and P a t m is the standard atmospheric pressure (101.325 kPa). Moreover, S = 1 t t 0 l n [ P a t m + P t P a t m P t P a t m P 0 P a t m + P 0 ] is the slope of the logarithmic pressure function f(t) = l n [ P a t m + P t P a t m P t P a t m P 0 P a t m + P 0 ] and time t, where P 0 is the pressure of the vacuum air chamber when t = t 0 , i.e, the initial pressure (Pa), and P t is the pressure of the vacuum air chamber at time t (Pa) [30,31].

3. Results and Mechanism Analysis

3.1. Uniformity Analysis of Remolded Specimens

3.1.1. Influence of the Sample Height on Uniformity

Figure 4 exhibits the variations in the layered dry densities of samples with overall heights from 8 to 16 cm under different designed dry densities. When the designed dry density and moisture content were fixed, the stratified dry density of the sample was found to decrease with the increase in the stratified thickness. The smaller the delamination thickness, the closer it is to the top of the sample; when the layer thickness is small, the dry density of the sample is larger than the designed dry density. With the increase in the overall height of the sample, the layered dry density curve tended to be flat and close to the designed dry density. At this time, the overall change in the remolded sample was represented by the upper part being denser than the lower part. The reason may be that with a higher sample height under the same dry density, the arrangement of soil particle aggregates yields during compaction, and there are greater the number of particles in the same volume of soil, resulting in a reduction in the number of pores. At the same time, the space where water can exist is reduced, and the channels through which water and air can move become smaller [32]. A small number of through-pores are gradually blocked with the increase in the delamination height of the sample, resulting in the gradual stabilization of the dry density and better uniformity.

3.1.2. Stress Distribution Analysis of Sample Uniformity

The stress distribution during sample preparation is presented in Figure 5. The upper part of the compacted sample was in contact with the pressure column of the mold under the action of pressure. With the transfer of pressure from top to bottom, the higher the sample height and the longer the transfer distance, the lower the dry density of the lower part of the soil. Moreover, the closer the layered dry density to the designed dry density, the smoother the curve trend. This is related to the upper limit of the dry density of samples prepared by the indoor sample preparation instrument. As the dry density of the sample becomes closer to this upper limit, it becomes more difficult for the force exerted by the compaction column to compact the soil sample. At this time, the less force consumed by the top of the soil sample, the more force transferred to the bottom, the denser the bottom, and the closer to the upper limit of dry density. Finally, the dry density of each part of the soil sample reaches the upper limit, the cohesion and internal friction angle of soil sample increase with the increase in the dry density [33], and the sample is more uniform.

3.1.3. Analysis of Sample Uniformity via the Range Method

Based on the stress distribution, the uniformity of soil samples in the middle and bottom was better than that in the upper part of the sample. Samples with different overall heights under the same designed dry density and the same moisture content were prepared. The upper soil of each sample was then removed, and samples of 6 cm in the middle and lower parts were taken for testing (that is, the sample was stratified by 0.5 cm, and divided into 12 layers from top to bottom). The maximum difference of the layered dry density (i.e., the range) of each part was measured, as reported in Table 2, and the range of variation is presented in Figure 6. The results demonstrate that with the increase in the overall height of the sample, the range of the dry density of the stratified sample gradually decreased, and the uniformity of the sample increased with the increase in the number of layers. By changing the overall height of the sample, the lower part of the sample can be taken, which can effectively avoid the sampling of the denser part and leave a more uniform soil sample. Under the effect of compaction, loess particles are cemented and a skeleton is formed, and the cohesion and internal friction angle reach stable values. At this time, the pores between particles are not simply compressed, but it is more likely that the skeleton changes and soil particles slide, which increases the density and uniformity of the soil [15].
It can also be seen from Figure 6 that with the increase in the overall height of the sample, the differences in the range of the dry densities of the stratified samples with different designed dry densities gradually become stable. This can effectively explain the finding that with the increase in the overall height of the sample, the external force required by the soil sample increased, while the consumption of the top soil sample decreased after using a certain amount of force. Moreover, the force transferred to the bottom increased, resulting in more uniform stress on the whole sample and a more uniform stress distribution, which made the soil sample more uniform. This may also be due to the changes in the relative positions of water and air in the soil structure formed by remolded soil and matrix suction. With the increase in height, the more uniform the sample, the more uniform the particle arrangement, the closer the skeleton particles, the more diverse the structural units, and the more stable the porosity and permeability.

3.1.4. Analysis of Sample Uniformity via the Discrete Element Method

To characterize the uniformity of samples, the variance of the dry density of samples was introduced for analysis. Variance is the degree of deviation between a set of measurements and its average, which represents a measure of sample uniformity. The following formula was used in this study:
σ 2 = 1 n   {   [   ρ d ( h x ) ρ d ( h x ¯ )   ]   2 }
where σ 2 represents the sample variance, ρ d ( h x ) is the dry density value of a certain layer (such as the dry density of the first layer), where x = 1, 2, 3 … n, n is the number of layers in the sample (for example, n = 16 in the 8 cm sample), and ρ d ( h x ¯ ) is the average dry density of the sample (i.e., the designed dry density).
As can be seen from the results reported in Table 3, all 15 samples exhibited a certain degree of inconsistency ( σ 2 > 0). The sample variance was the highest when ρ d ( h x ¯ ) = 1.5 g / cm 3 , and it was the lowest when ρ d ( h x ¯ ) = 1.3   g / cm 3 . At the same height, the higher the dry density, the greater the variance, and the lower the uniformity of the sample. Based on the sample variance diagram presented in Figure 7, it can be concluded that under the same dry density, the greater the height, the smaller the variance, and the lower the dispersion of the sample, that is, the more stable the variation in the sample difference, and the better the uniformity of the sample. This demonstrates that the sample variance reflects the dispersion and uniformity of the sample; the variance has a certain positive correlation with the dry density of the sample and a stable inverse correlation with the height of the specimen.

3.2. Analysis of the Air Permeability of In Situ, Undisturbed, and Remolded Loess Samples

Figure 8 compares the results of the contact in situ air permeation test and undisturbed indoor air permeation test. At the depths of 2 and 4 m in the test site in Xi’an, the air permeability values of the in situ contact samples were 1.1832 × 10 12 and 9.0319 × 10 13 m2, respectively, while the values for the indoor undisturbed samples at the same depths were 1.3025 × 10 12 and   9.9136 × 10 13 m2, respectively, thereby presenting respective increases of 1.1008 and 1.0976 times. Good correspondence was found between the in situ and indoor air permeability test results, and the air permeability of indoor samples was slightly higher than that of in situ samples. At the depths of 6, 8, and 10 m, the air permeability of undisturbed soil was slightly less than that determined by the in situ test. Moreover, the air permeability was found to decrease with the increase in depth, i.e., the air permeability of surface soil was better than that of deep soil. This is the result of the years-long geological process of loess; from the loose accumulation of the surface layer to the repeated deposition of the inner layer, pores became relatively denser, the connecting force between skeleton particles was enhanced, and soil tended to be more uniform. Compared with the indoor measurement method, the in situ test has the advantage of undisturbed formation and can better reflect the actual formation situation [34].
Figure 9 presents the variation curves of the air permeability coefficients of remolded loess samples with different overall heights and designed dry densities. It can be seen from the figure that, with the increase in the height of the remolded sample, the air permeability coefficient was found to gradually increase, i.e., with the increase in the overall height of the sample, the sample tended to be more uniform, and the more uniform the soil sample, the greater the air permeability coefficient. The pores of remolded soil are occupied by soil, water, and air, and due to the differences in interfacial tension, air always occupies large pores with priority, while water occupies small pores or pore throats with priority [35]. The more uniform the sample, the shorter the time taken for air to pass through soil, and the greater the air permeability coefficient. Furthermore, when the dry density and water content of the remolded soil sample are low, soil is loose, soil with a low water content has more pores, the pore distribution is more uniform, the actual airflow path is more tortuous, the air permeability is higher [36,37], and the uniformity of the sample is obviously improved.

3.3. Quantitative Index of Loess Structure Based on Air Permeability

The remolding process of soil consists of the reconstruction of its structure. The structure of remolded soil is quite different under different moisture contents. Under compaction, the soil particles in remolded loess are randomly arranged, the pores in soil are relatively uniform, and the structure and degree of cementation are relatively poor as compared with those of undisturbed soil. The moisture content and dry density have a certain impact on remolded loess. As indicated by the w- log k curves presented in Figure 10, when ρ d < 1.58 g/ cm 3 , the air permeability of the soil sample was found to first increase and then decrease with the increase in the water content. When the water content w was less than the optimal water content of 17.5%, the air permeability was found to increase. However, when w > 17.5%, the air permeability was found to decrease rapidly. When the dry density ρ d ≥ 1.58 g/cm3, the air permeability of remolded loess was found to decrease slowly with the increase in the water content.
With the increase in the buried depth of undisturbed air-dried loess, the overlying load of the soil increases, which results in particle compaction, a significant decrease in the numbers of macropores and mesopores, and an increase in the number of small holes and micropores. Macropores and mesopores play a leading role in the process of air infiltration [23]. The variation in the grain composition of Malan loess with changes in the buried depth was found to cause the air permeability parameters to decrease with the increase in the buried depth (Figure 11). From the comparison of the air permeability of the undisturbed and remolded loess samples presented in Figure 11, it can be seen that, under the condition of the same water content and dry density, the air permeability of the remolded loess samples was lower than that of undisturbed loess, and when ρ d > 1.58 g/ cm 3 , the air permeability coefficient of remolded loess decreased more obviously. This is consistent with Zhu’s research, suggesting that the process of soil reconstruction by a given method is that the macropores in soil are filled, that is, the metastable structure could be further gradually weakened by the addition of silt particles [9]. The larger the dry density, the denser the remolded soil, the more soil skeleton particles per unit volume, the less effective the pores in terms of air permeability, the smaller the air permeability coefficient, and the more uniform the remolded structure. Because the macropores of the undisturbed samples were filled with water in the process of vacuum saturation, the effective permeability of the pores that facilitated the passage of air were reduced and the structure was relatively dense, so the measured air permeability coefficient of the undisturbed saturated samples was much smaller than that of the remolded samples.
Because the measurement of the air permeability coefficient is highly economical, convenient, and time-saving, a quantitative index of the loess structure based on air permeability is subsequently proposed. Another clear benefit of this definition is to create a dimensionless physical descriptor for future and further comparisons.
m k = m 1 m 2 = k o / k r k s / k o = ( k o ) 2 k r · k s
In Equation (3), m k is defined as the structural index of loess based on air permeability, m 1 reflects the variability of the loess structure, which is positively correlated with m 1 , m 2 reflects the structural stability of loess, which is negatively correlated with m 2   [38,39], k o is the air permeability coefficient of undisturbed loess, k r is the air permeability coefficient of remolded loess, and k s is the air permeability coefficient of undisturbed saturated loess.
The dry density of loess at different depths varies, as does the corresponding structure and the texture index. The measured data are presented in Figure 12. When the dry density was ρ d < 1.58 g/ cm 3 , the air permeability and structural texture index m k of the remolded loess were found to first decrease and then increase with the increase in the moisture content. When the dry density was ρ d ≥ 1.58 g/ cm 3 , m k was found to increase with the increase in the moisture content of the remolded loess, and the range of the increase in m k varied with the dry density. The texture index of remolded loess was found to be different from that of undisturbed loess, and it also varied with the increase in depth in the same section. This internal reasoning is as follows: the greater the depth, the greater the overburden weight, the longer the sedimentation time, the fuller the consolidation, and the stronger the structure.
In the process of various disturbances, the structure of loess changes, the strength of the soil decreases, and the structural potential of loess is released [40,41]. The stronger the initial connection of undisturbed loess, the denser the internal structure of the soil, and the smaller the air permeability coefficient k o . Moreover, the greater the strength loss of remolded loess, the smaller the air permeability coefficient k r with the increase in the dry density, and the greater the soil structural parameters. The greater the structural damage of saturated undisturbed loess, the greater the strength loss, the more obvious the attenuation of the soil structure, the smaller the air permeability coefficient k s and the larger the soil structural parameters. Throughout the remodeling process, the structure of the original sample is gradually lost, and a secondary structure is gradually generated. With the gradual loss of structural strength, the structure reflected by this parameter also changes [3]. Meanwhile, undisturbed loess and remolded loess have a similar pore size distribution [42]. In undisturbed loess, the particles come into point-to-point contact with adjacent particles through cementation bonds, with abundant pores [43]. However, there are few cementitious materials in remolded loess [44], and the cohesion (c) is slightly lower than that in undisturbed loess [43]. The sample forms a chain arrangement structure, the grains are mainly in point-to-face and face-to-face contact, the pores become smaller, and the ventilation channel becomes narrower. Therefore, for undisturbed loess and remolded loess with complex structure and pores, it is reasonable to explore structure using the air permeability test [30].

3.4. Structural Differences between Undisturbed and Remolded Loess Based on SEM Images

The special microstructure of loess consists of three parts: structural unit (single mineral and aggregate), pore (macropore, overhead pore, and intergranular pore), and effective cement (clay) [45].The air permeability of soil is affected by the soil type, texture [46], buried depth, and compactness, and is especially impacted by the soil structure [47,48].
In the process of the deposition and consolidation of undisturbed loess, the aggregates of soil particles are mostly spatially oriented, which is significantly different from the structure of remolded soil. By comparing the microstructures of undisturbed and remolded loess via SEM images (Figure 13a,b), it was found that when the dry density and moisture content were the same, the undisturbed loess had a macropore skeleton structure, there was clastic cementation at the contact points between particles, the pore distribution was uneven, macropores were clustered, the pores were interconnected, and most of them were through-macropores and through-mesopores. The particles of the remolded samples were compactly arranged, and the skeleton particles and fine particles formed aggregates. The pore distribution was uniform, and most were dispersed and broken micropores and small pores.
Figure 13(a-1) shows an undisturbed loess sample. In its single mineral particle or aggregate structure, particles are mainly in point-to-point contact. Figure 13(a-2) is the conceptual diagram of particle contact. Most particles are arranged randomly, and the surrounding particles are filled with clastic effective cement; Figure 13(b-1) reflects the dense particle distribution of remolded loess, and pores between mineral particles are significantly reduced. Due to the change in structure, the structural unit changes from single mineral particles to aggregate structure, particles change from point-to-point contact to point-to-face and face-to-face contact, and the structure tends to be more stable Figure 13(b-2).
Undisturbed loess has a skeleton composed of soil and aggregate particles, and there are many pores between skeletons. The fundamental reason why loess loses its original stability is that the structural units between loess particles are destroyed. Remolded soil samples are characterized by the destruction of joints, fissures, and aggregates in undisturbed soil, thereby forming a relatively uniform small pore structure [37]. Disturbances can destroy the connections and stable spatial arrangement of soil, and can release the structural potential of cementation between soil particles. When the soil skeleton is compacted, the weak cemented and unstable parts are destroyed first, and the secondary cemented and stable parts gradually take effect. They eventually change not only the arrangement, but also the pore connection characteristics of soil particles [3,40]. The influence of disturbance on soil is represented by the change in the micro- and macrostructures, including the pore geometry, aggregate size distribution, and aggregate stability [49]. Compared with undisturbed soil, remolded soil has better gradation, particles are uniform in size and arranged in a more orderly fashion, the cementation between particles is strengthened, and small particles fill the pores between large particles. When the pores become smaller, the connections between skeleton particles and colloid clay components are closer, thereby forming a more stable structure, and soil has better uniformity. These factors increase the length and decrease the width of the passages in which air moves through soil, which increases the time taken for air to permeate. This verifies that the air permeability rate of remolded soil is lower than that of undisturbed loess.

3.5. The Geological Origin of the Structural Differences between Undisturbed and Remolded Loess

The structural differences between undisturbed and remolded loess are due to their different growth histories. Undisturbed loess has experienced a long geological history, in which countless drying/wetting cycles have occurred. This repeated history of increasing and decreasing moisture is bound to have an important impact on the distribution of clay particles, colloidal particles, and even soluble salts in loess. The microscopic mechanism of this process is presented in Figure 14. The “adhesive bridge” effect of cementation between loess skeleton particles is enhanced, and the surfaces of the mineral crystal particles of the skeleton, which forms the main part of the pore wall, are smoother, thereby weakening the viscous force of seepage through pores. For remolded loess samples, the distribution of clay particles returns to randomness (just like the random distribution of clay particles when loess is newly deposited) due to the screening, grinding, humidification, and other occurrences during the sample preparation process. Therefore, the distribution of clay particles around the skeleton minerals in remolded loess is not uniform, and the strength of the new “adhesive bridge” is relatively weak. On the other hand, due to the random distribution of the clay coat, the surfaces of the mineral crystals of the skeleton, which is the main component of the pore wall, are relatively rough, so they exert a strong viscous force on the seepage through the pores.
There are substantial differences between the structures of undisturbed and remolded loess samples. The reason for this is that undisturbed loess has experienced countless drying/wetting cycles during the process of soil formation after deposition. During these cycles, the redistribution of clay, colloidal particles, and soluble salt ions increases the effectiveness of the cementation between loess skeleton particles, thereby endowing the loess with a strong structure. However, remolded loess is characterized by the reduced effectiveness of cementation between skeleton particles, which causes its structure to be weaker than that of undisturbed loess.
Clay migration also plays a very important role in the process of loess soil formation. To a certain extent, clay migration has two effects (Figure 15 [50]). First, for particles with surface defects, the colloid clay component preferentially fills pores between the skeleton particles and the connected areas of finer particles via selective filling. Second, for flat and smooth particles, the colloidal components of clay tend to adsorb on the flat or concave surfaces of skeleton particles. The filling and adsorption effects can round the edges of loess skeleton particles, increase the particle size, slow the migration rate of clay particles, and improve the connection between skeleton particles and colloid clay components, thereby forming a more stable structure. These reasons explain why the cohesion and permeability coefficient of undisturbed loess are greater than those of remolded loess, which has been confirmed by many studies [51,52]. The structural differences between undisturbed and remolded loess can also affect their permeability coefficients [53,54], as shown in Figure 8, Figure 9, Figure 10, Figure 11 and Figure 12.

4. Conclusions

This paper proposed a new method by which to evaluate the homogeneity and structure of remolded loess samples based on the air permeability coefficient. The conclusions are as follows:
1.
When the moisture content is fixed, the delamination dry density of remolded samples changes with the designed dry density and the overall height of the sample.
2.
With the increase in sample height, the air permeability coefficient of the sample gradually increases, which indicates that the sample tends to be more uniform with the increase in the overall sample height. The more uniform the soil sample, the greater the air permeability coefficient of the remolded sample.
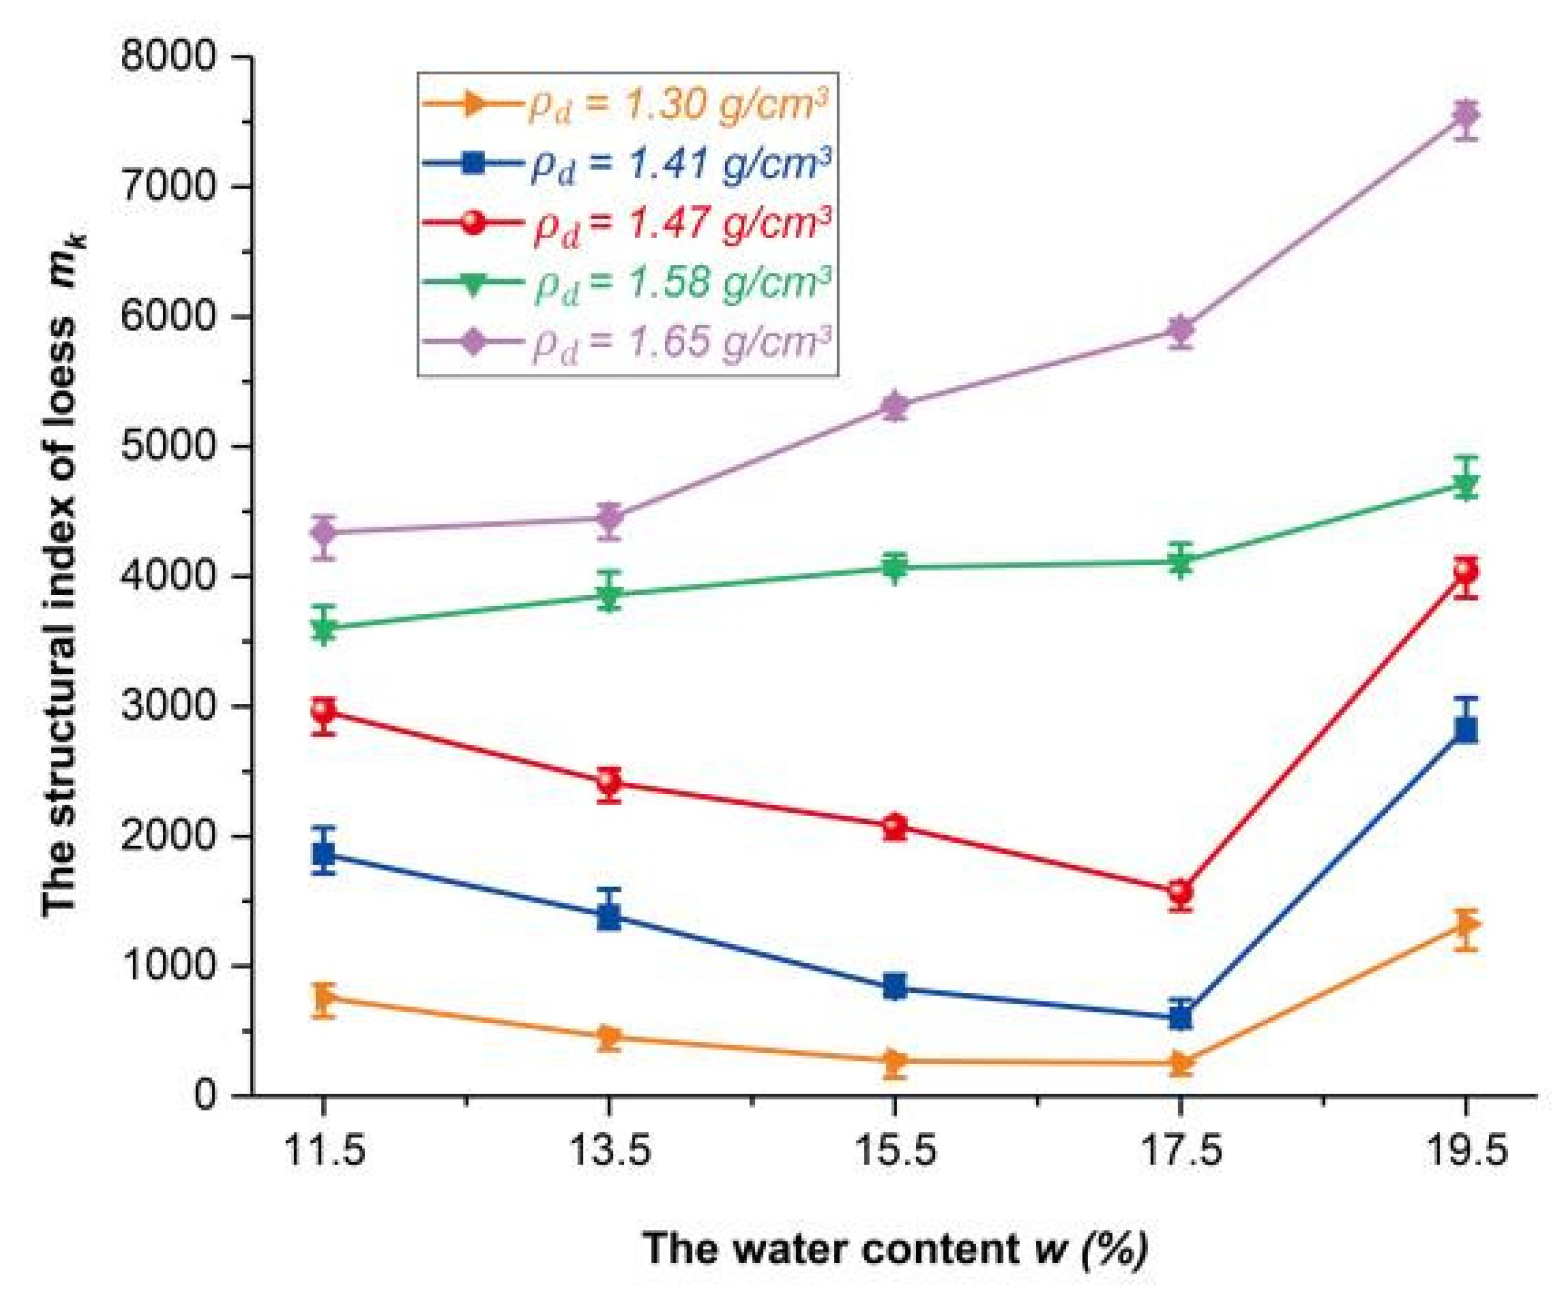
3.
When the dry density was ρ d < 1.58 g/ cm 3 , the air permeability and structural texture index mk of remolded loess were found to first decrease and then increase with the increase in moisture content; when ρ d ≥ 1.58 g/ cm 3 , m k was found to increase with the increase in the moisture content of remolded loess, and the range of the increase in m k was found to vary with dry density.
4.
Combined with the microscopic scanning electron microscope images, it was revealed that the redistribution of clay, colloidal particles, and soluble salt ions in undisturbed loess during countless drying/wetting cycles endows the loess with a strong structure. However, remolded loess is characterized by the greatly reduced effectiveness of cementation between skeleton particles, which causes its structure to be weaker than that of undisturbed loess.
In summary, the air permeability coefficient is demonstrated to be a powerful tool in evaluating the homogeneity and structure of remolded loess samples, with good application prospects. However, compared with the visual damage of the water permeability test, there are still many variables that cannot be controlled independently. For example, since the undisturbed loess has a more open pore structure, the results of the air permeability test are related to the number and connectivity of effective pores in the soil. This test may therefore have certain limitations in determining microstructure information using macrophysical indicators. This will require us to introduce other influencing factors in future research for in-depth analysis and verification.

Author Contributions

Conceptualization, Z.H. and X.L.; methodology, Z.H., X.L., J.Z. and B.Z.; software, M.A., F.W. and B.Z.; validation, X.L. and F.W.; formal analysis, Z.H. and R.G.; investigation, Z.H., R.G., M.A., J.Z., F.W. and Q.X.; resources, X.L. and J.Z.; data curation, Z.H., R.G., M.A. and Q.X.; writing—original draft preparation, Z.H. and Q.X.; writing—review and editing, Z.H.; visualization, F.W. and Q.X.; supervision, X.L. and B.Z.; project administration, X.L. and B.Z.; funding acquisition, X.L. All authors have read and agreed to the published version of the manuscript.

Funding

This research was funded by the National Natural Science Foundation of China, grant number 41572264, and the National Natural Science Foundation of China, grant number 41877225.

Institutional Review Board Statement

Not applicable.

Informed Consent Statement

Not applicable.

Data Availability Statement

Not applicable.

Acknowledgments

The authors would like to sincerely thank the editors as well as the reviewers of this paper, who put forward useful comments that improved the manuscript substantially.

Conflicts of Interest

The authors declare no conflict of interest.

References

  1. Ding, H.; Li, Y.; Yang, Y.; Jia, X. Origin and evolution of modern loess science-1824 to 1964. J. Asian Earth Sci. 2019, 170, 45–55. [Google Scholar] [CrossRef]
  2. Sun, J.; Ding, Z.L. Spatial and temporal changes of dry and wet climate during the last 130, 000 years in the Loess Plateau. Quat. Sci. 1997, 2, 168–175. [Google Scholar]
  3. Shao, S.J.; Zhou, F.F.; Long, J.Y. Structural properties of loess and its quantitative parameter. Chin. J. Geotech. Eng. 2004, 4, 531–536. [Google Scholar]
  4. Zhang, Y.; Qian, H.; Hou, K.; Qu, W. Investigating and predicting the temperature effects of permeability for loess. Eng. Geol. 2021, 285, 106050. [Google Scholar] [CrossRef]
  5. Wang, H.; Sun, P.; Liu, E.; Li, R. Dynamic properties of Tianshui saturated remolded loess: A laboratory study. Eng. Geol. 2020, 272, 105570. [Google Scholar] [CrossRef]
  6. Benahmed, N.; Canou, J.; Dupla, J.C. Structure initiale et propriétés de liquéfaction statique d’un sable. Comptes Rendus Mec. 2004, 332, 887–894. [Google Scholar] [CrossRef]
  7. Bradshaw, A.S.; Baxter, C. Sample Preparation of Silts for Liquefaction Testing. Geotech. Test. J. 2007, 30, 1–9. [Google Scholar] [CrossRef]
  8. Karathanasis, A.D.; Macneal, B.R. Evaluation of parent material uniformity criteria in loess-influenced soils of west-central Kentucky. Geoderma 1994, 64, 73–92. [Google Scholar] [CrossRef]
  9. Hu, Z.; Zhang, F.; Dupla, J.-C.; Canou, J.; Foerster, E.; Peng, Q. Assessment of tamping-based specimen preparation methods on static liquefaction of loose silty sand. Soil Dyn. Earthq. Eng. 2021, 143, 106592. [Google Scholar] [CrossRef]
  10. Mehlich, A. Uniformity of soil test results as influenced by volume weight. Commun. Soil Sci. Plant Anal. 1973, 4, 475–486. [Google Scholar] [CrossRef]
  11. Kuerbis, R.; Vaid, Y.P. Sand sample preparation-the slurry deposition method. Proc. Soil Eng. Soc. 1988, 28, 107–118. [Google Scholar] [CrossRef]
  12. Wen, Y.; Li, X. Method for measurement and evaluation of soil homogeneity. Corros. Sci. Prot. Technol. 1997, 9, 53–57. [Google Scholar]
  13. Jiang, M.; Konrad, J.-M.; Leroueil, S. An efficient technique to generate homogeneous specimens for DEM studies. Comput. Geotech. 2003, 30, 579–597. [Google Scholar] [CrossRef]
  14. Zheng, J.; Zhao, S.; Ma, W. Application of CT testing technology in evaluating the uniformity of soil samples. J. Lanzhou Univ. (Nat. Sci.) 2009, 45, 20–25. [Google Scholar] [CrossRef]
  15. Meng, J.; Li, X.a. Uniformity analysis of remolded loess samples based on high precision μCT scan. J. Chang. Sci. Res. Inst. 2019, 036, 125–130. [Google Scholar] [CrossRef]
  16. Chou, Y.L.; Jia, S.S.; Zhang, Q.H.; Cao, W.; Sehng, Y. The influence of freeze-thaw action on loess collapsibility coefficient considering soil structure. Yantu Lixue/Rock Soil Mech. 2018, 39, 2715–2722 and 2731. [Google Scholar] [CrossRef]
  17. Haeri, S.M.; Zamani, A.; Garakani, A.A. Collapse Potential and Permeability of Undisturbed and Remolded Loessial Soil Samples; Springer: Berlin, Germany, 2012; pp. 301–308. [Google Scholar] [CrossRef]
  18. Wang, H.; Yue, Z.; Ye, C. Experimental study on permeability of undisturbed loess and remolded loess. J. Shijiazhuang Tiedao Univ. (Nat. Sci. Ed.) 2009, 22, 20–22. [Google Scholar] [CrossRef]
  19. Chen, H.; Liu, M.; Song, Z. Study on structural parameters of remolded and undisturbed saturated loess. J. Undergr. Space Eng. 2010, 6, 487–491+497. [Google Scholar] [CrossRef]
  20. Wu, Z.; Xu, S.; Chen, D.; Zhao, D.; Zhang, D. An experimental study of the influence of structural parameters on dynamic characteristics of loess. Soil Dyn. Earthq. Eng. 2020, 132, 106067. [Google Scholar] [CrossRef]
  21. Zhang, Y.; Song, Z.; Wen, X. Soil and water characteristics of Q3 undisturbed loess and remolded loess. J. Water Resour. Water Eng. 2019, 30, 224–229. [Google Scholar] [CrossRef]
  22. Ding, P. Study of ZC-5 type gas permeation meter and gas permeation test method. J. Xi’an Univ. Technol. 1986, 40–55. [Google Scholar]
  23. Li, X.A.; Liu, J. Study on the relationship between pore structure parameters and permeability of Malan loess. Eng. Geol. 2018, 26, 10–18. [Google Scholar]
  24. Liu, J.; Li, X.A. Study on the relationship between gas permeability and saturated permeability coefficient in Malan loess. Hydrogeol. Eng. Geol. 2017, 44, 154–162. [Google Scholar] [CrossRef]
  25. Iversen, B.; Schjønning, P.; Poulsen, T.; Moldrup, P. In Situ, on-Site and Laboratory Measurements of Soil Air Permeability: Boundary Conditions and Measurement Scale. Soil Sci. 2001, 166, 97–106. [Google Scholar] [CrossRef]
  26. Klinkenberg, L.J. The permeability of porous media to liquids and gases. Am. Pet. Inst. Drill. Prod. Pract. 2012, 2, 57–73. [Google Scholar] [CrossRef]
  27. Zhou, W. Study on homogeneity of remolded loess samples. Sci. Technol. Eng. 2015, 15, 266–269. [Google Scholar] [CrossRef]
  28. Waal, W.W.; Mikes, D.; Bruining, H. Inertia factor measurements from pressure-decay curves obtained with probe-permeameters. Situ 1998, 22, 339–371. [Google Scholar]
  29. Li, G. Advanced Soil Mechanics; Tsinghua University Press: Beijing, China, 2004. [Google Scholar]
  30. Liu, J.; Li, X.; Xue, Q.; Guo, Z. Experimental study on air permeability and microscopic mechanism of intact and remolded Malan loess, Loess Plateau, China. Bull. Eng. Geol. Environ. 2020, 79, 3909–3919. [Google Scholar] [CrossRef]
  31. Hong, B.; Li, X.; Pang, T.; Wang, L.; Li, L.; Guo, Z.; Liu, J.; Lei, H. Application of vacuum decay tester in measuring air permeability of loess in the Chinese Loess Plateau, northwest China. Hum. Ecol. Risk Assessment: Int. J. 2020, 26, 2520–2540. [Google Scholar] [CrossRef]
  32. Barden, L.; Pavlakis, G. Air and water permeability of compacted unsaturated cohesive soil. J. Soil Sci. 2006, 22, 302–318. [Google Scholar] [CrossRef]
  33. Wang, L.; Bai, X. Discussion on shearing strength influencing factors of compacted loess-like backfill. Chin. J. Geotech. Eng. 2010, 32, 132–135. [Google Scholar]
  34. Li, X.A.; Xue, Q. Study on gas permeability rate of loess latent erosion formation based on in situ gas permeability test. J. Eng. Geol. 2019, 27, 8. [Google Scholar] [CrossRef]
  35. Dixon, D.A.; Graham, J.; Gray, M.N. Hydraulic conductivity of clays in confined tests under low hydraulic gradients. Can. Geotech. J. 2011, 36, 815–825. [Google Scholar] [CrossRef]
  36. Wang, Y.; Xie, D.; Guo, Q. Motion characteristics of gas in unsaturated soil and determination of gas permeability coefficient. Northwest Hydroelectr. 1993, 1, 46–49. [Google Scholar]
  37. Liu, F.; Zhang, Z.; Zhou, D. Gas and water permeability function of unsaturated loess with double change of humidity and density. Chin. J. Rock Mech. Eng. 2010, 29, 1907–1914. [Google Scholar]
  38. Luo, Y.; Xie, D.; Shao, S. Structural parameter of soil under complex stress conditions. Chin. J. Rock Mech. Eng. 2004, 23, 4248–4251. [Google Scholar] [CrossRef]
  39. Shao, S.; Zheng, W.; Wang, Z.; Wang, S. Structure index of loess and its experimental determination method. Rock Soil Mech. 2010, 31, 15–19. [Google Scholar] [CrossRef]
  40. Xie, D.; Qi, J. A new approach to the study of soil structure and its quantitative parameters. Chin. J. Geotech. Eng. 1999, 21, 651–656. [Google Scholar]
  41. Xie, D. Some new trends in the study of loess mechanics in China. Chin. J. Geotech. Eng. 2001, 1, 3–13. [Google Scholar] [CrossRef]
  42. Jiang, M.; Zhang, F.; Hu, H.; Cui, Y.; Peng, J. Structural characterization of natural loess and remolded loess under triaxial tests. Eng. Geol. 2014, 181, 249–260. [Google Scholar] [CrossRef]
  43. Shao, X.; Zhang, H.; Tan, Y. Collapse behavior and microstructural alteration of remolded loess under graded wetting tests. Eng. Geol. 2017, 233, 11–22. [Google Scholar] [CrossRef]
  44. Wen, B.; Yan, Y. Influence of structure on shear characteristics of the unsaturated loess in Lanzhou, China. Eng. Geol. 2014, 168, 46–58. [Google Scholar] [CrossRef]
  45. Wang, X. Study on the Influence of Dry Wet Cycle on Shear Strength, Structure and Slope Stability of Loess. Master’s Thesis, Xi’an University of Technology, Xi’an, China, 2017. [Google Scholar] [CrossRef]
  46. Iversen, B.; Moldrup, P.; Schjønning, P.; Loll, P. Air and Water Permeability in Differently Textured Soils At Two Measurement Scales. Soil Sci. 2001, 166, 643–659. [Google Scholar] [CrossRef]
  47. Nazaroff, W. Radon transport from soil to air. Rev. Geophys. Rev. Geophys 1992, 30, 137–160. [Google Scholar] [CrossRef]
  48. Zhu, M.; Zhang, Z.; Pan, Y.; Guo, D. Experimental study on the effect of soil texture, bulk density and moisture content on air conductivity. Agric. Res. Arid Areas 2013, 31, 116–121. [Google Scholar]
  49. Gupta, S.; Sharma, P.; DeFranchi, S. Compaction Effects on Soil Structure. Adv. Agronomy 1989, 42, 311–338. [Google Scholar]
  50. Bi, M. Research on Collapsible Mechanism of Loess Based on Grain Scale. Master’s Thesis, Changan University, Xi’an, China, 2020. [Google Scholar] [CrossRef]
  51. Xu, J.; Wang, Z.; Ren, J.; Yuan, J. Experimental study on permeability characteristics of undisturbed and remolded loess during freeze-thaw process. J. Eng. Geol. 2017, 25, 292–299. [Google Scholar] [CrossRef]
  52. Wang, L.; Yang, Y.; Su, Z.; Chai, Z. Study on permeability and influencing factors of remolded loess. J. Lanzhou Railw. Inst. 2003, 04, 95–97. [Google Scholar] [CrossRef]
  53. Blackwell, P.S.; Ringrose-Voase, A.J.; Jayawardane, N.S.; Olsson, K.A.; Mckenzie, D.C.; Mason, W.K. The use of air-filled porosity and intrinsic permeability to air to characterize structure of macropore space and saturated hydraulic conductivity of clay soils. J. Soil Sci. 1990, 41, 215–228. [Google Scholar] [CrossRef]
  54. Yao, Z.; Chen, Z. Experimental study on air permeability characteristics of unsaturated Q3 loess. Chin. J. Rock Mech. Eng. 2012, 34, 1020–1027. [Google Scholar] [CrossRef]
Figure 1. (a) The loess distribution map of China and (b) the geological map of the loess plateau. (c) Sample preparation process and pictures of the test instrument.
Applsci 12 09412 g001
Figure 2. (a) The compaction curve of Malan loess in the Chanhe section. (b) The particle size distribution curve and particle size grading accumulation curve.
Applsci 12 09412 g002
Figure 3. Schematic diagram of the transient device for the measurement of the soil vacuum attenuation permeability rate: (a) the host of the portable vacuum attenuation permeability meter; and (b) the main structure of the vacuum attenuator (including an external air chamber, in situ measurement probe, and indoor measurement sample cylinder). (c) Pictures of the test instrument.
Applsci 12 09412 g003
Figure 4. The variation in the dry density of the loess samples.
Applsci 12 09412 g004aApplsci 12 09412 g004b
Figure 5. Stress distribution diagram: (a) the stress acting on the sample is averagely distributed; (b) schematic diagram of the internal stress of the specimen.
Applsci 12 09412 g005
Figure 6. The range of the dry densities of the stratified samples.
Applsci 12 09412 g006
Figure 7. The variance in the dry densities of the stratified samples.
Applsci 12 09412 g007
Figure 8. The air permeability values of the in situ contact samples and indoor undisturbed samples.
Applsci 12 09412 g008
Figure 9. The variation in the air permeability coefficients of remolded samples with different heights.
Applsci 12 09412 g009
Figure 10. The air permeability of remolded loess samples.
Applsci 12 09412 g010
Figure 11. The air permeability of undisturbed, undisturbed saturated, and remolded loess samples (the dry density and moisture content of the remolded loess samples were consistent with those of the undisturbed loess samples).
Applsci 12 09412 g011
Figure 12. The quantitative index of loess structure based on air permeability.
Applsci 12 09412 g012
Figure 13. SEM images of (a) undisturbed and (b) remolded loess and concept diagrams of particle contact.
Applsci 12 09412 g013
Figure 14. The conceptual model of the effect of drying/wetting cycles on the distribution of effective cementation between loess skeleton particles.
Applsci 12 09412 g014
Figure 15. The conceptual model of the (a) filling and (b) adsorption effects of colloidal clay.
Applsci 12 09412 g015
Table 1. The physical properties of the experimental soils.
Depth (m)GsW (%)Wl (%)Wp (%)ρd (g/cm3)Particle Size Composition (%)
>0.075 mm0.075–0.005 mm<0.005 mm
22.4714.8027.3016.101.304.4777.0918.44
42.7016.9229.1217.501.412.7873.0624.16
62.5817.1026.9017.301.472.9479.3417.72
83.2417.5028.7017.801.582.6576.5220.83
103.7217.7030.4018.201.652.2472.4725.29
Table 2. The range of the dry densities of the stratified samples.
Designed Dry Density of the Sample ρd (g/cm3)Overall Height h of the Prepared Sample (cm)
810121416
1.50.1344500.1103830.0870220.0590500.032733
1.40.1073630.0979910.0534620.0393500.028700
1.30.0803750.0735500.0361970.0293750.018952
Table 3. The variance in the dry densities of the stratified samples.
Designed Dry Density of the Sample ρd (g/cm3)Overall Height h of the Prepared Sample (cm)
810121416
1.52.83 × 10−32.60 × 10−32.21 × 10−31.82 × 10−31.31 × 10−3
1.42.17 × 10−31.91 × 10−31.64 × 10−31.56 × 10−31.25 × 10−3
1.31.94 × 10−31.63 × 10−31.59 × 10−31.50 × 10−31.11 × 10−3
Publisher’s Note: MDPI stays neutral with regard to jurisdictional claims in published maps and institutional affiliations.

