
Ultrasound and Magnetic Resonance Imaging of the Tongue in Obstructive Sleep Apnoea

 , ,
, ,  ,
,
Abstract
:1. Introduction
2. Materials and Methods
2.1. Participants
2.2. Sleep Test
2.3. Ultrasound
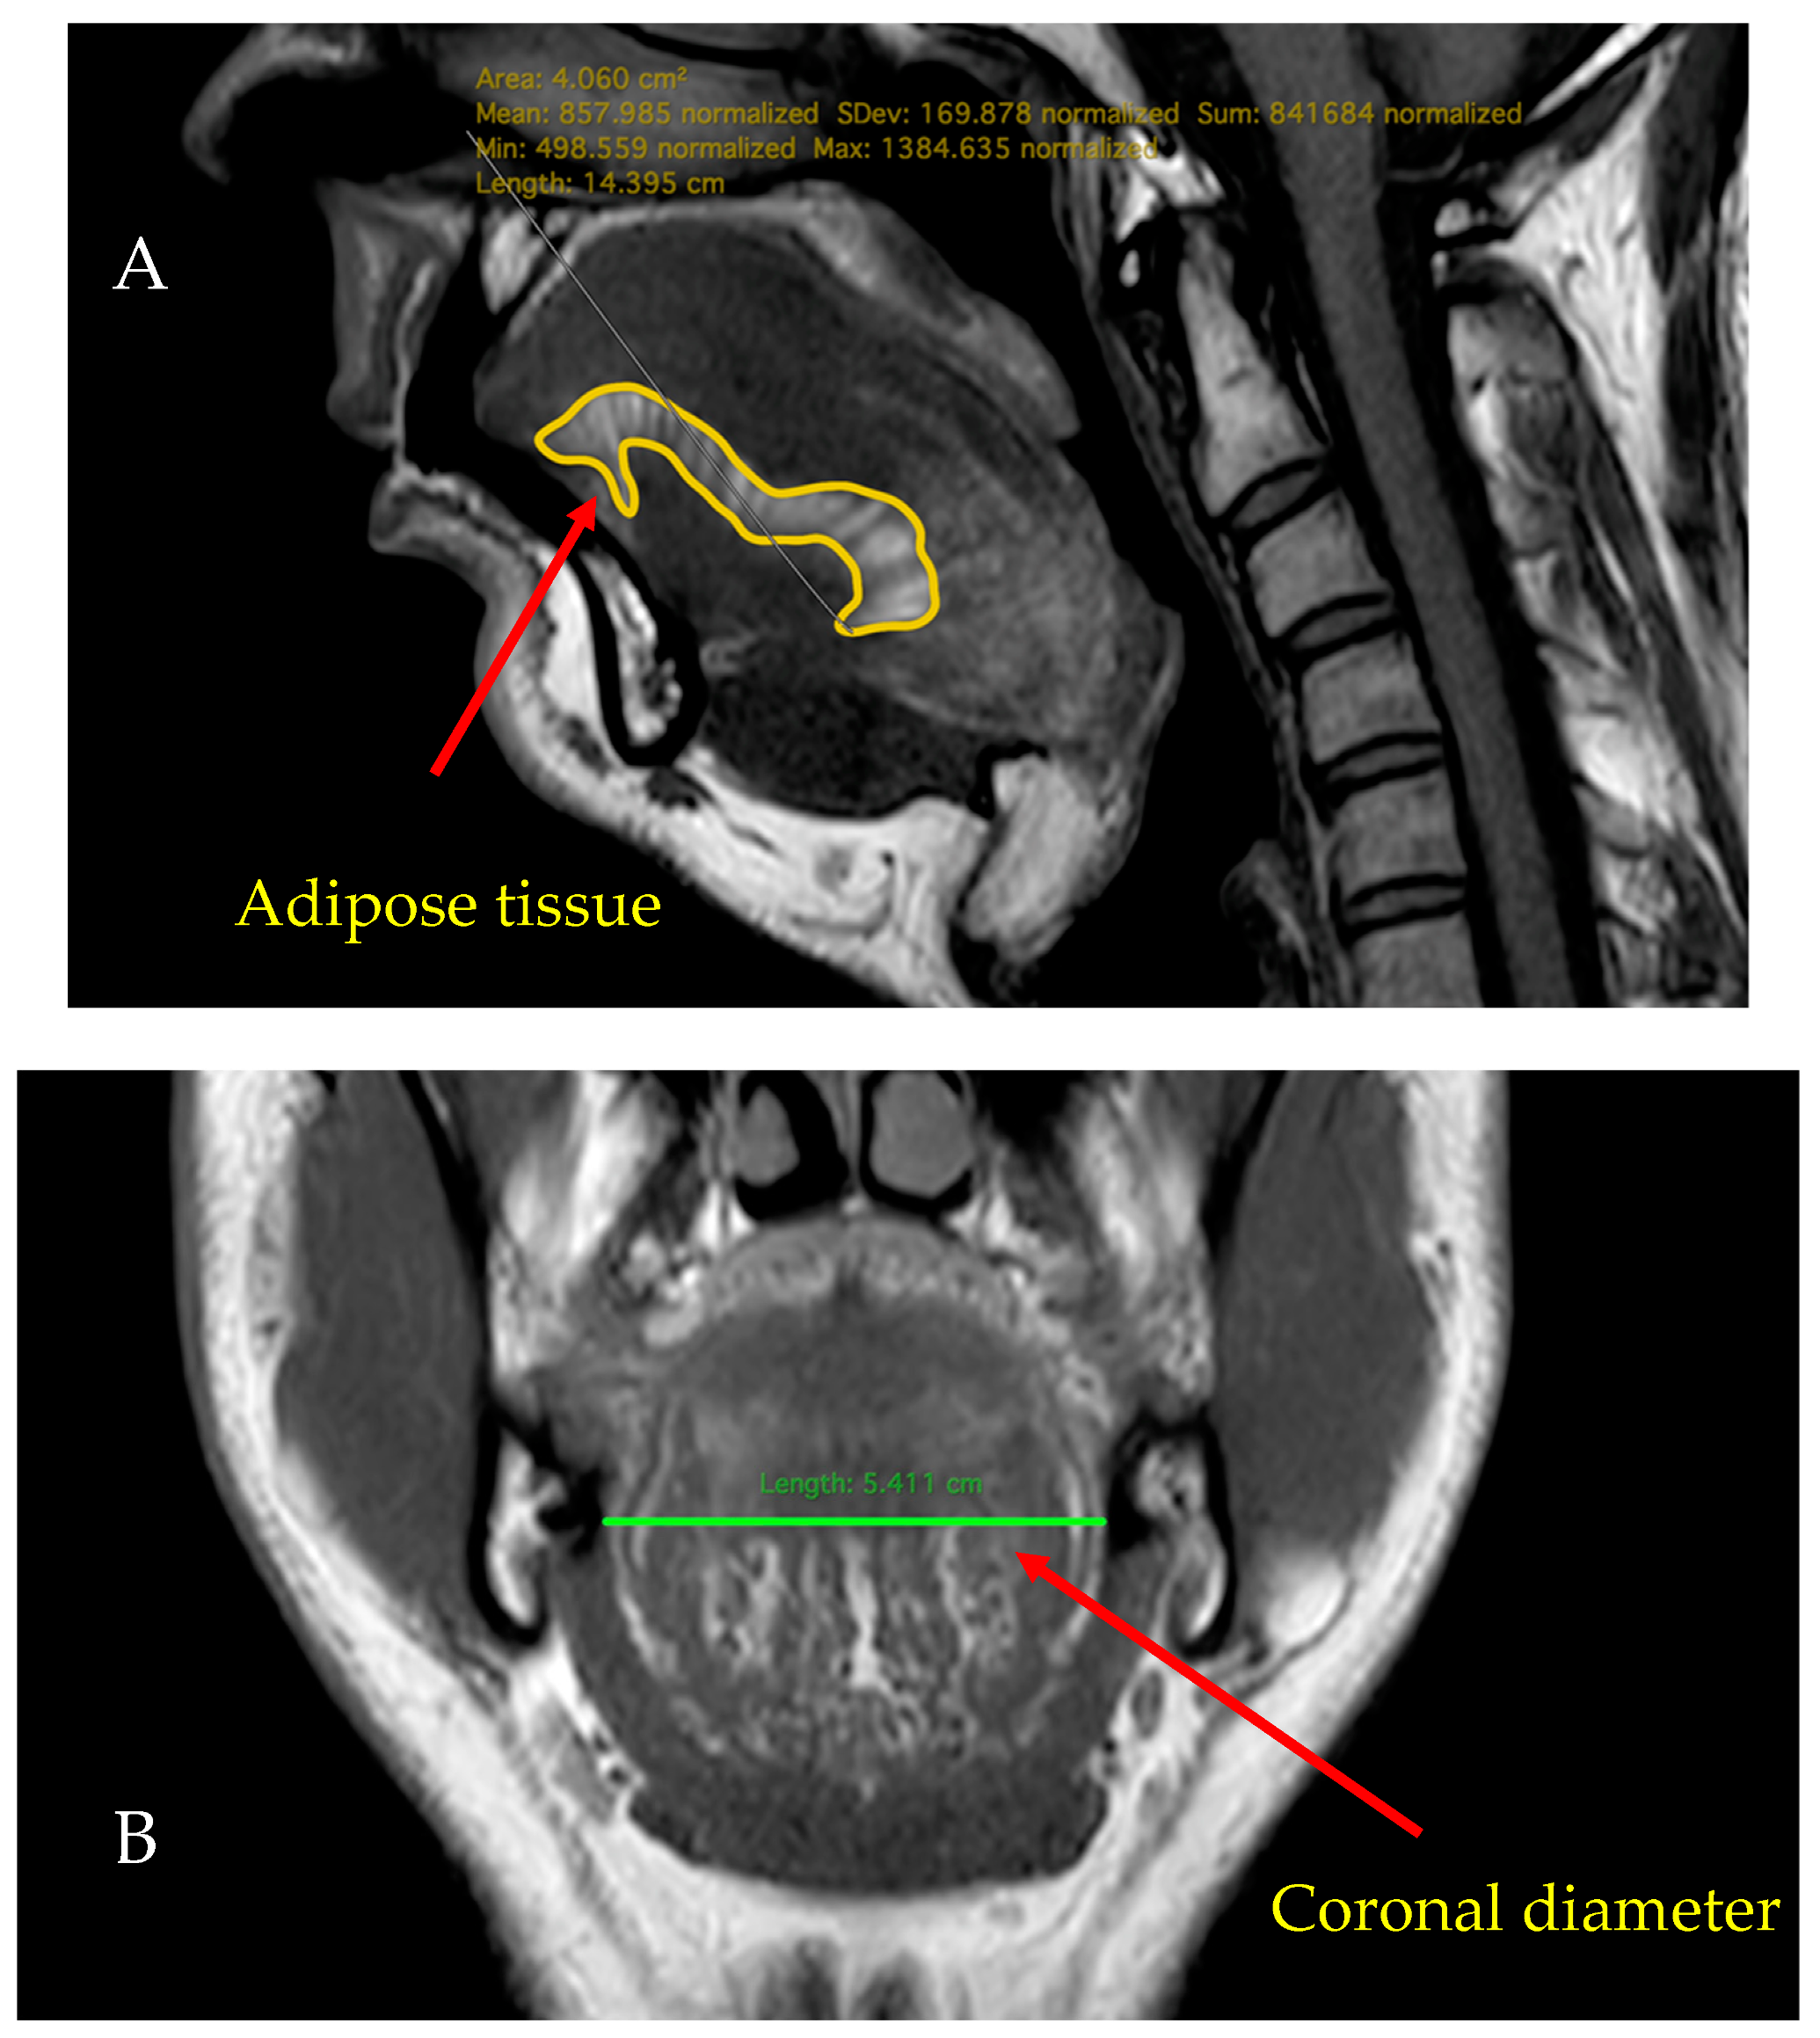
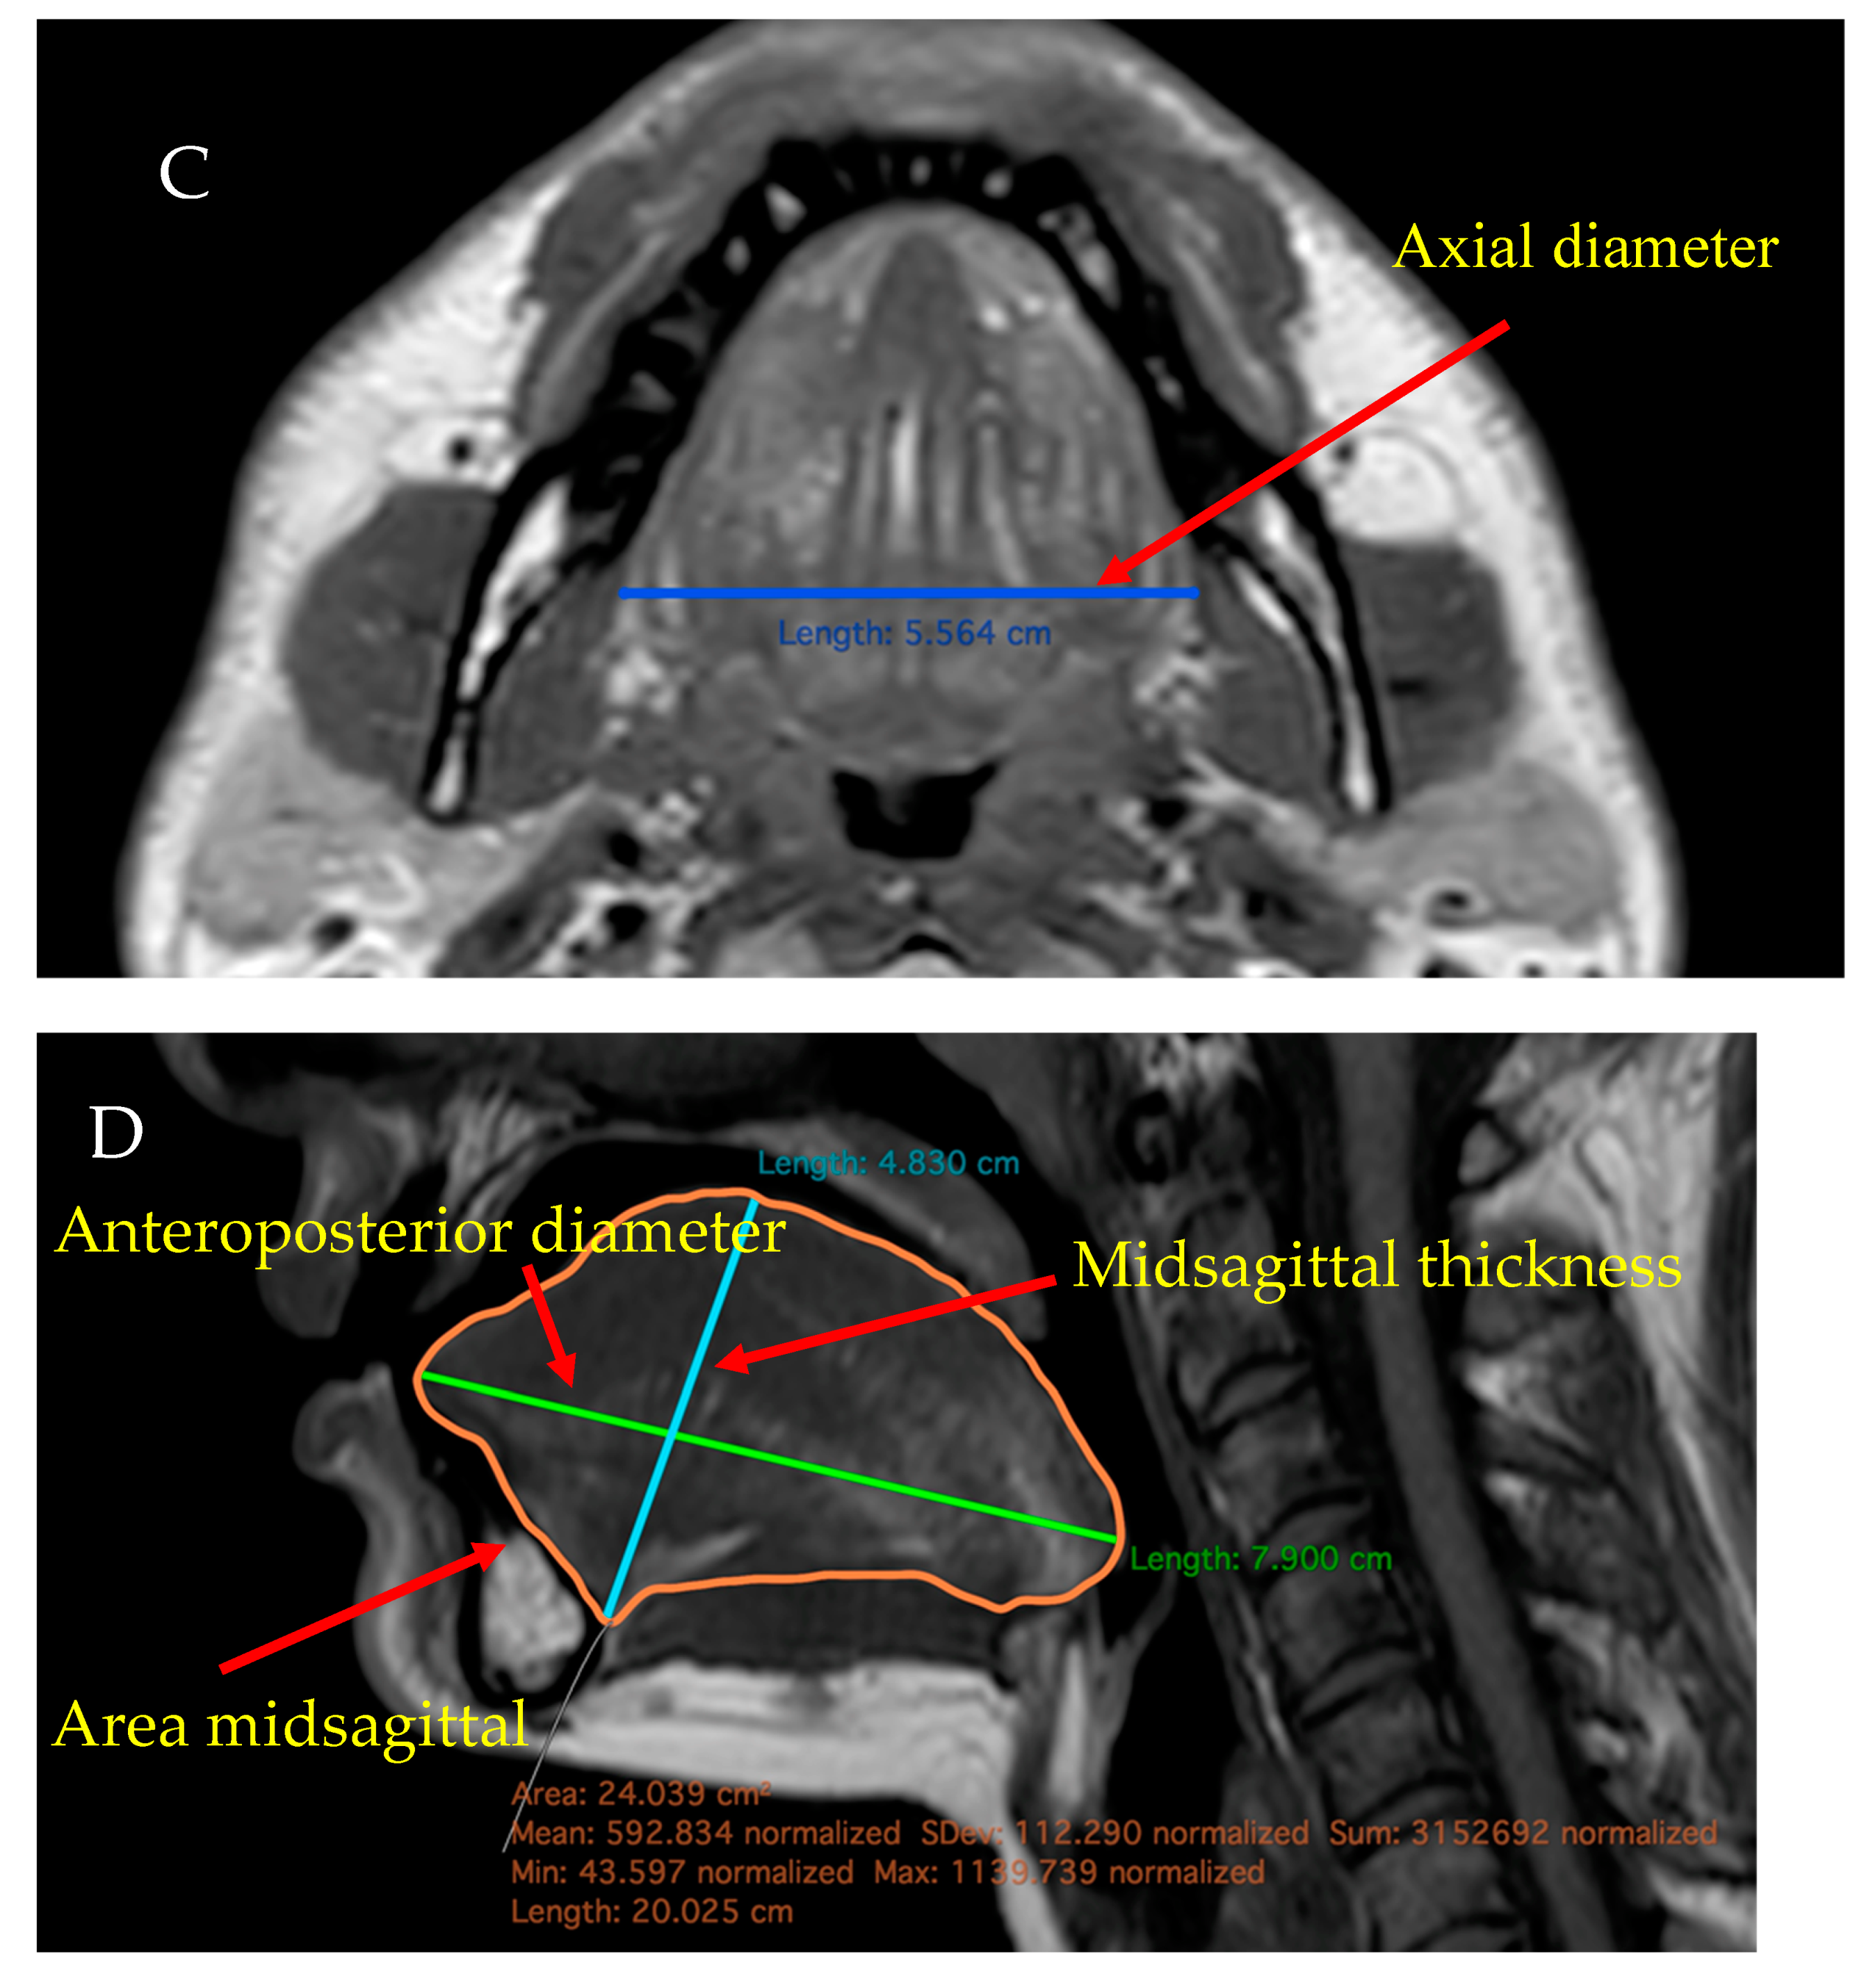
2.4. MRI
2.5. Drug-Induced Sleep Endoscopy
2.6. Statistical Analysis
3. Results
3.1. Examination of the Tongue (US and MRI) Based on the AHI Categorisation of Patinets with OSA
3.2. Examination of the Tongue between the Two Genders in OSA
3.3. Influence of Age on the Tongue Parameters in OSA
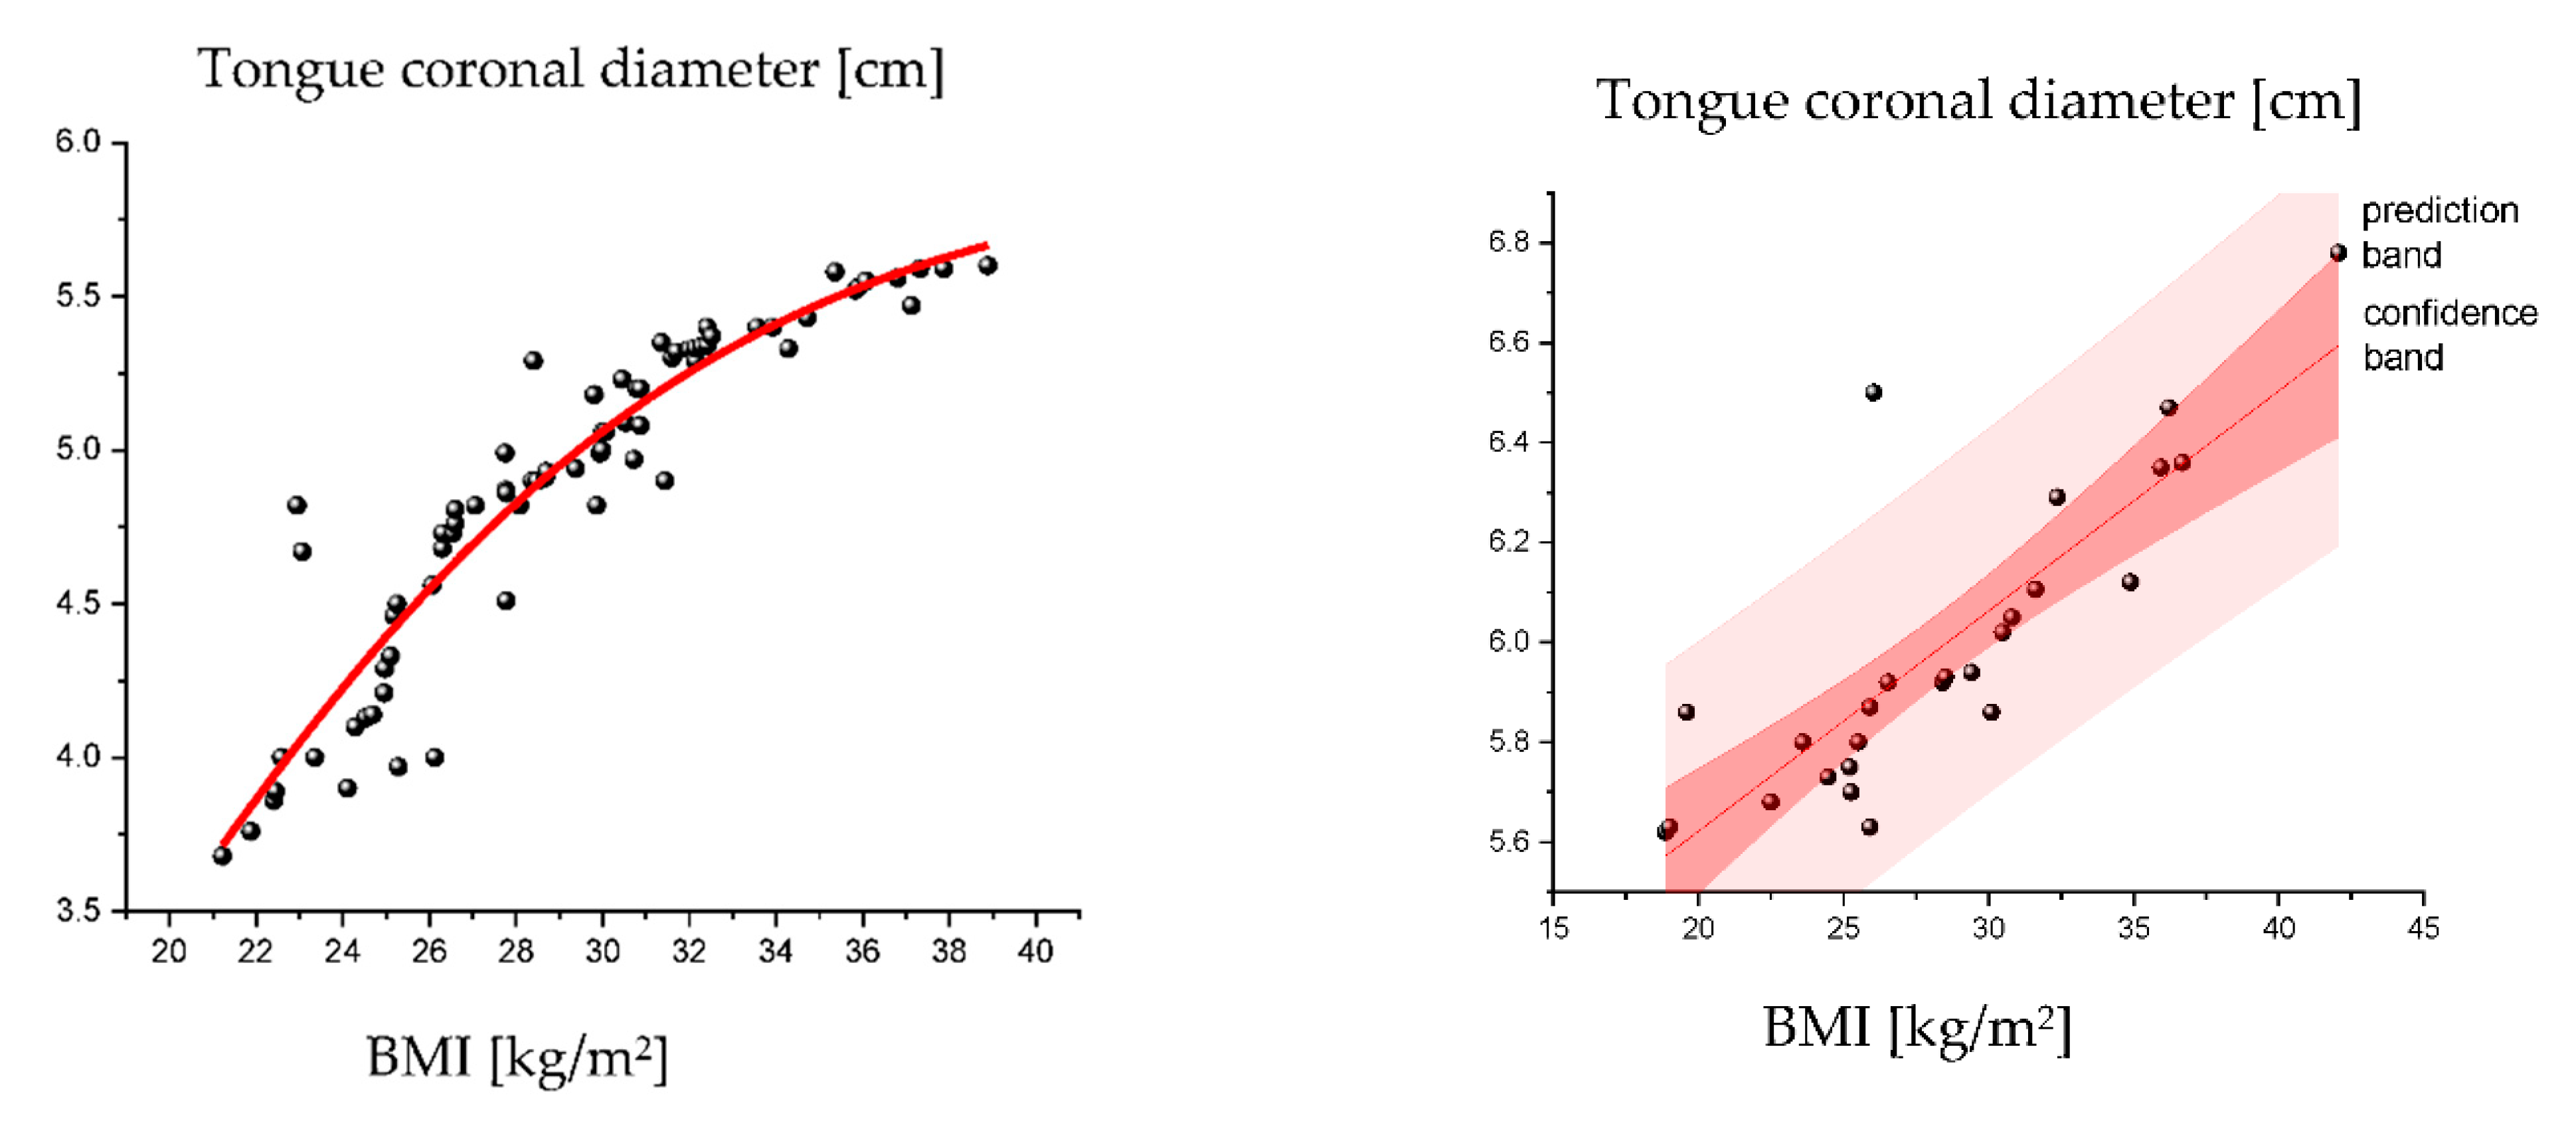
3.4. Influence of BMI on the Tongue Parameters in OSA
3.5. Effects of BMI on the US and MRI Parameters of the Tongue in Male and Female Patients
3.6. Prediction of OSA and Tongue-Based Obstruction
4. Discussion
5. Conclusions
Author Contributions
Funding
Institutional Review Board Statement
Informed Consent Statement
Data Availability Statement
Acknowledgments
Conflicts of Interest
References
- Heinzer, R.; Vat, S.; Marques-Vidal, P.; Marti-Soler, H.; Andries, D.; Tobback, N.; Mooser, V.; Preisig, M.; Malhotra, A.; Waeber, G. Prevalence of sleep-disordered breathing in the general population: The HypnoLaus study. Lancet Respir. Med. 2015, 3, 310–318. [Google Scholar] [CrossRef]
- Eckert, D.J. Phenotypic approaches to obstructive sleep apnoea–new pathways for targeted therapy. Sleep Med. Rev. 2018, 37, 45–59. [Google Scholar] [CrossRef]
- Lee, E.J.; Cho, J.H. Meta-analysis of obstruction site observed with drug-induced sleep endoscopy in patients with obstructive sleep apnea. Laryngoscope 2019, 129, 1235–1243. [Google Scholar] [CrossRef] [PubMed]
- Zhao, C.; Viana, A.; Ma, Y.; Capasso, R. High tongue position is a risk factor for upper airway concentric collapse in obstructive sleep apnea: Observation through sleep endoscopy. Nat. Sci. Sleep 2020, 12, 767. [Google Scholar] [CrossRef] [PubMed]
- Jordan, A.S.; McSharry, D.G.; Malhotra, A. Adult obstructive sleep apnoea. Lancet 2014, 383, 736–747. [Google Scholar] [CrossRef]
- Huang, Y.C.; Hsu, Y.B.; Lan, M.Y.; Yang, M.C.; Kao, M.C.; Huang, T.T.; Lan, M.-C. Dynamic tongue base thickness measured by drug-induced sleep ultrasonography in patients with obstructive sleep apnea. J. Formos. Med. Assoc. 2021, 120, 354–360. [Google Scholar] [CrossRef]
- Berry, R.B.; Budhiraja, R.; Gottlieb, D.J.; Gozal, D.; Iber, C.; Kapur, V.K.; Marcus, C.L.; Mehra, R.; Parthasarathy, S.; Quan, S.F. Rules for scoring respiratory events in sleep: Update of the 2007 AASM manual for the scoring of sleep and associated events: Deliberations of the sleep apnea definitions task force of the American Academy of Sleep Medicine. J. Clin. Sleep Med. 2012, 8, 597–619. [Google Scholar] [CrossRef]
- De Vito, A.; Carrasco Llatas, M.; Ravesloot, M.J.; Kotecha, B.; De Vries, N.; Hamans, E.; Maurer, J.; Bosi, M.; Blumen, M.; Heiser, C. European position paper on drug-induced sleep endoscopy: 2017 update. Clin. Otolaryngol. 2018, 43, 1541–1552. [Google Scholar] [CrossRef] [PubMed]
- Everitt, B.S. Medical Statistics from A to Z: A Guide for Clinicians and Medical Students, 3rd ed.; Cambridge University Press: Cambridge, UK, 2021; pp. 41–56. [Google Scholar]
- Blumer, A.; Ehrenfeucht, A.; Haussler, D.; Warmuth, M.K. Occam’s razor. Inf. Process. Lett. 1987, 24, 377–380. [Google Scholar] [CrossRef]
- Brennick, M.J. Understanding airway tissue mechanics is a step towards improving treatments in OSA. Sleep 2013, 36, 973–974. [Google Scholar] [CrossRef] [Green Version]
- Do, K.L.; Ferreyra, H.; Healy, J.F.; Davidson, T.M. Does tongue size differ between patients with and without sleep-disordered breathing? Laryngoscope 2000, 110, 1552–1555. [Google Scholar] [CrossRef]
- Turnbull, C.; Wang, S.; Manuel, A.; Keenan, B.; McIntyre, A.; Schwab, R.; Stradling, J. Relationships between MRI fat distributions and sleep apnea and obesity hypoventilation syndrome in very obese patients. Sleep Breath 2018, 22, 673–681. [Google Scholar] [CrossRef]
- Iida-Kondo, C.; Yoshino, N.; Kurabayashi, T.; Mataki, S.; Hasegawa, M.; Kurosaki, N. Comparison of tongue volume/oral cavity volume ratio between obstructive sleep apnea syndrome patients and normal adults using magnetic resonance imaging. J. Med. Dent. Sci. 2006, 53, 119–126. [Google Scholar]
- Kim, A.M.; Keenan, B.T.; Jackson, N.; Chan, E.L.; Staley, B.; Poptani, H.; Torigian, D.A.; Pack, A.I.; Schwab, R.J. Tongue fat and its relationship to obstructive sleep apnea. Sleep 2014, 37, 1639–1648. [Google Scholar] [CrossRef] [PubMed]
- Soares, D.; Folbe, A.J.; Yoo, G.; Badr, M.S.; Rowley, J.A.; Lin, H.-S. Drug-induced sleep endoscopy vs awake Müller’s maneuver in the diagnosis of severe upper airway obstruction. Otolaryngol. Head Neck Surg. 2013, 148, 151–156. [Google Scholar] [CrossRef] [PubMed]
- Tunçel, Ü.; Inançli, H.M.; Kürkçüoğlu, Ş.S.; Murat, E. Can the Müller maneuver detect multilevel obstruction of the upper airway in patients with obstructive sleep apnea syndrome? Kulak Burun Bogaz Ihtis. Derg. 2010, 20, 84–88. [Google Scholar] [PubMed]
- Gregório, M.G.; Jacomelli, M.; Figueiredo, A.C.; Cahali, M.B.; Junior, W.L.P.; Lorenzi Filho, G. Evaluation of airway obstruction by nasopharyngoscopy: Comparison of the Müller maneuver versus induced sleep. Braz. J. Otorhinolaryngol. 2007, 73, 618–622. [Google Scholar] [CrossRef]
- Huang, X.; Chen, H.; Tang, J.; Lu, J.; Deng, Y.; Li, X. Comparative study of VOTE classification in obstructive sleep apnea hypopnea syndrome patients between awake and sleep state. Lin Chung Er Bi Yan Hou Tou Jing Wai Ke Za Zhi 2017, 31, 918–924. [Google Scholar] [PubMed]
- Shu, C.C.; Lee, P.; Lin, J.W.; Huang, C.T.; Chang, Y.C.; Yu, C.J.; Wang, H.-C. The use of sub-mental ultrasonography for identifying patients with severe obstructive sleep apnea. PLoS ONE 2013, 8, e62848. [Google Scholar]
- Chen, J.W.; Chang, C.H.; Wang, S.J.; Chang, Y.T.; Huang, C.C. Submental ultrasound measurement of dynamic tongue base thickness in patients with obstructive sleep apnea. Ultrasound Med. Biol. 2014, 40, 2590–2598. [Google Scholar] [CrossRef]
- Manlises, C.O.; Chen, J.W.; Huang, C.C. Dynamic tongue area measurements in ultrasound images for adults with obstructive sleep apnea. J. Sleep Res. 2020, 29, e13032. [Google Scholar] [CrossRef] [PubMed]
- Malhotra, A.; Huang, Y.; Fogel, R.B.; Pillar, G.; Edwards, J.K.; Kikinis, R.; Loring, S.H.; White, D.P. The male predisposition to pharyngeal collapse: Importance of airway length. Am. J. Respir. Crit. Care Med. 2002, 166, 1388–1395. [Google Scholar] [CrossRef] [PubMed] [Green Version]
- Liégeois, F.; Albert, A.; Limme, M. Comparison between tongue volume from magnetic resonance images and tongue area from profile cephalograms. Eur. J. Orthod. 2010, 32, 381–386. [Google Scholar] [CrossRef]
- Ajaj, W.; Goyen, M.; Herrmann, B.; Massing, S.; Goehde, S.; Lauenstein, T.; Ruehm, S. Measuring tongue volumes and visualizing the chewing and swallowing process using real-time TrueFISP imaging—initial clinical experience in healthy volunteers and patients with acromegaly. Eur. Radiol. 2005, 15, 913–918. [Google Scholar] [CrossRef]
- Stollenwerk, B.; Stock, S.; Siebert, U.; Lauterbach, K.W.; Holle, R. Uncertainty assessment of input parameters for economic evaluation: Gauss’s error propagation, an alternative to established methods. Med. Decis. Making 2010, 30, 304–313. [Google Scholar] [CrossRef]
- Nashi, N.; Kang, S.; Barkdull, G.C.; Lucas, J.; Davidson, T.M. Lingual fat at autopsy. Laryngoscope 2007, 117, 1467–1473. [Google Scholar] [CrossRef]
- Lin, C.M.; Davidson, T.M.; Ancoli-Israel, S. Gender differences in obstructive sleep apnea and treatment implications. Sleep Med. Rev. 2008, 12, 481–496. [Google Scholar] [CrossRef] [Green Version]


| Control Group (n = 36) | OSA Patients (n = 64) | p-Value | |
|---|---|---|---|
| Gender (men/women) | 21/15 | 53/11 | 0.000 *** |
| BMI (kg/m2) | 23.14 ± 3.87 | 30.99 ± 2.33 | 0.000 *** |
| Age (years) | 38.13 ± 12.14 | 44.40 ± 10.90 | 0.000 *** |
| Tongue US measurements | |||
| Coronal diameter (cm) | 4.98 ± 0.58 | 5.25 ± 0.86 | 0.0565 * |
| Axial diameter (cm) | 4.65 ± 0.70 | 4.99 ± 0.91 | 0.0058 *** |
| Sagittal diameter (cm) | 7.20 ± 0.75 | 7.33 ± 1.12 | 0.0225 ** |
| Volume (cm3) | 45.27 ± 12.08 | 52.36 ± 15.52 | 0.0001 *** |
| Coronal diameter during MM (cm) | 4.88 ± 0.66 | 5.19 ± 0.55 | 0.0029 *** |
| Axial diameter during MM (cm) | 4.73 ± 0.67 | 5.06 ± 0.67 | 0.0063 *** |
| Sagittal diameter during MM (cm) | 6.65 ± 0.57 | 6.90 ± 0.73 | 0.0579 * |
| Volume during MM (cm3) | 40.24 ± 8.09 | 47.48 ± 9.24 | 0.0000 *** |
| Tongue MRI examinations | |||
| Anteroposterior diameter (cm) | 7.127 ± 0. 66 | 7.665 ± 0.643 | 0.000 *** |
| Coronal diameter (cm) | 4.57 ± 0.48 | 4.84 ± 0.45 | 0.006 *** |
| Volume (cm3) | 58.82 ± 13.18 | 67.00 ± 12.54 | 0.137 |
| Area midsagittal (cm2) | 25.23 ± 3.69 | 28.06 ± 3.3 | 0.001 *** |
| Fat midsagittal (cm2) | 8.45 ± 1.72 | 9.19 ± 1.63 | 0.036 ** |
| Tongue fat % | 33 ± 4.00 | 33 ± 5.00 | 0.618 |
| Gender | |||
|---|---|---|---|
| Men (n = 53) | Women (n = 11) | p-Value | |
| Tongue US examinations | |||
| Axial diameter during MM (cm) | 5.13 ± 0.67 | 4.74 ± 0.62 | 0.0749 * |
| Volume (cm3) | 53.96 ± 15.88 | 44.64 ± 11.28 | 0.0697 * |
| Volume during MM (cm3) | 48.41 ± 9.39 | 42.99 ± 7.24 | 0.0769 * |
| Tongue MRI examinations | |||
| Coronal diameter (cm) | 4.96 ± 0.40 | 4.32 ± 0.28 | 0.0798 * |
| Independent Variables | Gender | |
|---|---|---|
| Men (n = 74) | Women (n = 26) | |
| MRI Tongue Parameters | r2 | r2 |
| Anteroposterior diameter (cm) | 0.133 * (l) | 0.073 (l) |
| Sagittal diameter (cm) (s) | 0.050 * (s) | 0.059 (l) |
| Axial diameter (cm) (l) | 0.039 ** (l) | 0.063 (l) |
| Coronal diameter (cm) (l) | 0.073 ** (l) | 0.015 ** (l) |
| Volume (cm3) (l) | 0.149 *** (l) | 0.196 ** (s) |
| Area midsagittal (cm2) (l) | 0.186 *** (l) | 0.192 ** (s) |
| Fat midsagittal (cm2) (l) | 0.043 (l) | 0.428 *** (s) |
| Fat% (l) | 0.001 (l) | 0.260 *** (s) |
| Age (Years) | |||
|---|---|---|---|
| Tongue Parameters | Age ≤ 40 (n = 21) | Age > 40 (n = 43) | p-Value |
| Anteroposterior diameter (cm) | 7.83 ± 0.67 | 7.58 ± 0.62 | 0.0001 *** |
| Axial diameter (cm) | 4.83 ± 0.49 | 4.71 ± 0.54 | 0.0165 ** |
| Coronal diameter (cm) | 4.99 ± 0.48 | 4.78 ± 0.43 | 0.000 *** |
| Volume (cm3) | 69.79 ± 13.85 | 65.64 ± 11.77 | 0.000 *** |
| Area midsagittal (cm2) | 28.71 ± 3.72 | 27.73 ± 3.06 | 0.000 *** |
| Tongue Parameters | BMI (kg/m2) | |||
|---|---|---|---|---|
| Normal [A] (n = 5) | Overweight [B] (n = 24) | Obese [C] (n = 35) | p-Value | |
| Anteroposterior diameter (cm) | 6.97 ± 0.40 | 7.68 ± 0.58 | 7.75 ± 0.66 | 0.0365 ** [A–C] |
| Sagittal diameter (cm) | 4.92 ± 0.26 | 5.01 ± 0.38 | 5.27 ± 0.48 | 0.0366 ** [A–C] |
| Volume (cm3) | 57.60 ± 9.90 | 64.94 ± 10.58 | 69.76 ± 13.42 | 0.0738 * [A–C] |
| Area midsagittal (cm2) | 25.05 ± 1.76 | 27.72 ± 2.97 | 28.70 ± 3.45 | 0.054 * [A–C] |
| Dependent Variables | Gender | |
|---|---|---|
| Men (n = 74) | Women (n = 26) | |
| US tongue parameters | r2 | r2 |
| Coronal diameter (cm) | 0.28 *** | 0.7 *** |
| Axial diameter (cm) | 0.31 *** | 0.75 *** |
| Sagittal diameter (cm) | 0.30 *** | 0.62 *** |
| Volume (cm3) | 0.32 *** | 0.69 *** |
| Coronal diameter during MM (cm) | 0.29 *** | 0.71 *** |
| Axial diameter during MM (cm) | 0.33 *** | 0.59 *** |
| Sagittal diameter during MM (cm) | 0.35 *** | 0.55 *** |
| Volume during MM (cm3) | 0.34 *** | 0.5 *** |
| MRI tongue parameters | r2 | r2 |
| Anteroposterior diameter (cm) | 0.328 *** | 0.73 *** |
| Sagittal diameter (cm) (s) | 0.32 *** | 0.77 *** |
| Axial diameter (cm) (l) | 0.33 *** | 0.65 *** |
| Coronal diameter (cm) (l) | 0.37 *** | 0.72 *** |
| Volume (cm3) (l) | 0.41 *** | 0.712 *** |
| Area midsagittal (cm2) (l) | 0.42 *** | 0.463 *** |
| Fat midsagittal (cm2) (l) | 0.422 *** | 0.410 *** |
| Fat% (l) | 0.241 *** | 0.253 *** |
| Location of the Obstruction | OSA | |||
|---|---|---|---|---|
| Categorisation Based on Anthropometric Data | Categorisation Based on Anthropometric Data | |||
| US Parameters | MRI Parameters | US Parameters | MRI Parameters | |
| True-positive | 27 | 27 | 34 | 47 |
| True-negative | 62 | 60 | 57 | 35 |
| False-positive | 5 | 7 | 2 | 1 |
| False-negative | 6 | 6 | 7 | 17 |
| Correct categorisation | 89% | 87% | 91% | 82% |
| False categorisation | 11% | 13% | 9% | 18% |
| Sensitivity | 0.84 | 0.79 | 0.94 | 0.56 |
| Specificity | 0.91 | 0.91 | 0.89 | 0.92 |
| Real Obstruction | Estimated Obstruction | |||
|---|---|---|---|---|
| No Obstruction | Partial Obstruction | Total Obstruction | Correct Categorisation | |
| No obstruction | 24 | 5 | 5 | 70.6% |
| Partial obstruction | 5 | 21 | 6 | 65.6% |
| Total obstruction | 3 | 5 | 26 | 76.5% |
Publisher’s Note: MDPI stays neutral with regard to jurisdictional claims in published maps and institutional affiliations. |
© 2022 by the authors. Licensee MDPI, Basel, Switzerland. This article is an open access article distributed under the terms and conditions of the Creative Commons Attribution (CC BY) license (https://creativecommons.org/licenses/by/4.0/).
Share and Cite
Molnár, V.; Lakner, Z.; Molnár, A.; Tárnoki, D.L.; Tárnoki, Á.D.; Kunos, L.; Jokkel, Z.; Tamás, L. Ultrasound and Magnetic Resonance Imaging of the Tongue in Obstructive Sleep Apnoea. Appl. Sci. 2022, 12, 9583. https://doi.org/10.3390/app12199583
Molnár V, Lakner Z, Molnár A, Tárnoki DL, Tárnoki ÁD, Kunos L, Jokkel Z, Tamás L. Ultrasound and Magnetic Resonance Imaging of the Tongue in Obstructive Sleep Apnoea. Applied Sciences. 2022; 12(19):9583. https://doi.org/10.3390/app12199583
Chicago/Turabian StyleMolnár, Viktória, Zoltán Lakner, András Molnár, Dávid László Tárnoki, Ádám Domonkos Tárnoki, László Kunos, Zsófia Jokkel, and László Tamás. 2022. "Ultrasound and Magnetic Resonance Imaging of the Tongue in Obstructive Sleep Apnoea" Applied Sciences 12, no. 19: 9583. https://doi.org/10.3390/app12199583