Article

A Systematic Framework for Evaluating the Effectiveness of Dynamic Compaction (DC) Technology for Soil Improvement Projects Using Cone Penetration Test Data

by
Abdulrahman Alnaim
1,
Ali M. AlQahtany
1,*,
Maher S. Alshammari
1,
Wadee Ahmed Ghanem Al-Gehlani
2,
Saleh H. Alyami
3,
Naief A. Aldossary
4 and
Muhammad Nihal Naseer
5
1
Department of Urban and Regional Planning, College of Architecture and Planning, Imam Abdulrahman Bin Faisal University, Dammam 31441, Saudi Arabia
2
Department of Architecture, College of Architecture and Planning, Imam Abdulrahman Bin Faisal University, Dammam 31441, Saudi Arabia
3
Civil Engineering Department, College of Engineering, Najran University, Najran 55461, Saudi Arabia
4
Department of Architecture, Faculty of Engineering, Al-Baha University, Al-Baha 65528, Saudi Arabia
5
Department of Engineering Sciences, PN Engineering College, National University of Sciences and Technology, Karachi 75300, Pakistan
*
Author to whom correspondence should be addressed.
Appl. Sci. 2022, 12(19), 9686; https://doi.org/10.3390/app12199686
Submission received: 1 August 2022 / Revised: 19 September 2022 / Accepted: 22 September 2022 / Published: 27 September 2022
(This article belongs to the Section Civil Engineering)

Abstract

:
Despite recent innovations in soil improvement techniques, it remains difficult for project managers to select the most appropriate technique for soil improvement projects due to the lack of a reliable and systemic framework that may support the decision-making process. Therefore, the aim of this paper is to introduce a new systematic assessment framework that establishes reliable criteria for the selection of dynamic compaction (DC) technology, evaluates its effectiveness using Cone Penetration Test (CPT) data, and predicts the expected improvement in soil bearing capacity (Qc). The proposed framework uses zone-based soil categorization in conjunction with soil behavior type index (Ic) and CPT data to predict the expected improvement in soil bearing capacity after the implementation of the DC technique. In addition, a case study is used to highlight the applicability and the effectiveness of the proposed framework in evaluating the suitability of the DC technique and in predicting the expected improvement in the bearing capacity of soil. The results show that the DC technique is appropriate when the soil has a behavior type index of Ic ≤ 1.31, 1.31 < Ic ≤ 2.05, 2.05 < Ic ≤ 2.6, 2.6 < Ic ≤ 2.95 and Ic > 2.95, and the expected improvement in soil bearing-capacity (Qc) is within the range of [+20, +∞], [15–20], [5–15], [1–5] and [0–1] MPa, respectively.

1. Introduction

Soil improvement techniques have gained acceptance in recent years as a low-cost and less time-consuming alternative to expensive and time-consuming structural solutions such as deep foundations [1,2]. Despite the availability of various soil improvement techniques, selecting the most appropriate technique for soil improvement projects remains a major challenge for project managers due to the lack of a reliable selection framework [2,3]. Due to the various advantages associated with mechanical soil improvement techniques, such as low cost and minimal requirement of resources, electricity or water, these techniques have received much attention from the research community. Mechanical soil improvement techniques are often divided into dynamic compaction (DC), dynamic replacement (DR), stone column (SC), and rapid dynamic compaction (RDC) [4].
Dynamic compaction (DC) is a process used for increasing the load-bearing capacity of loose sand, silt, low saturation clay, and landfill trash. It entails several cycles of raising and dropping a heavy tamper from a height, allowing it to fall freely into the desired spot [5]. DC is a technique used to improve the bearing capacity of loose sand, silt, low saturation clay, and landfill waste. It involves numerous cycles of lifting and dropping a heavy rammer from a height, allowing it to fall freely under gravity on the desired spot. DC is the most commonly used mechanical technique in soil enhancement projects, especially on a large scale, due to various advantages; lower cost, shorter duration, uniform soil conditions after implementation, minimal water requirements, and no electricity consumption [6]. The application of the DC technique involves repeatedly dropping heavy steel pounders on soil at regular intervals until the required depth is achieved [6,7]. The weight and height of the pounding depend on the degree of compaction required, but the weight is typically between 5 and 30 tons with a height of up to 30 m [7]. The main advantage of the DC technique is its applicability to a variety of soil conditions including; saturated/unsaturated loose sand, even in the presence of silty pockets, dune sand, non-organic fill, and reclaimed soil, even in the presence of large boulders, landfill deposits, and collapsible soils [8]. This technology has been widely used to compact loose soils to increase the bearing capacity and reduce soil settlement after construction [9].
In the literature, the research community has primarily focused on understanding the relationship between the depth of soil improvement (D), mass of the drop weight (W), and the drop height (H) of the weight. Several researchers [10,11,12] predicted the dynamic compaction depth using an equation that links the depth of improvement (D) with weight (W), height (H), and an empirical coefficient (n), as shown in Equation (1). Additionally, Lukas [13] combined the number of drops, number of passes, grid spacing, weight, and height of pounders to calculate the proposed applied energy of the DC technique that would compact the soil profile and provide some improvement in bearing capacity. It can be calculated as shown in Equation (2).
D = n × W × H  
where:
  • D = compaction depth in meters
  • W = mass of drop weight in tons
  • H = drop height in meters
  • n = empirical coefficient (0.3 < n < 0.8; n = 0.5 typical)
A E = N × W × H × P G r i d   S p a c i n g 2
where:
  • N = number of drops
  • P = number of passes
  • W = mass of the tamper
  • H = drop height
Few studies have focused on the percent fineness in the soil profile as one of the most influencing factors that can adversely affect the soil consolidation process using the DC technique. The results show that a soil profile with a fine content less than 20% can be consolidated using the DC technique, however, these results are only useful when the fineness content percentage is below the 20% threshold. On the other hand, some studies [10,11,14] have highlighted the importance of Soil Behavior Type Index (Ic ) as an indicator of soil compaction state with Soil Behavior Type (SBT), as shown in Table 1 and classified the soil into 9 zones based on Ic values. Brik et. al. [10] proposed Equations (3)–(5) relating normalized and dimensionless cone parameters; Qtn and Fr. In addition, Robertson [15] proposed a correlation to calculate the percentage of fineness in the soil profile using Ic values, as shown in Equation (6).
Ic   = 3.47 log Qtn 2 + log Fr + 1.22 2   1 2
Qtn   = qt     σ v pa × pa σ vo n
Fr   = fs qt     σ vo × 100
% F C = 0 ,   I c < 1.26 1.75 × Ic 3.25 3.7 ,   1.26 I c 3.5 100 ,   I c > 3.5
where:
  • qt = CPT corrected total cone resistance
  • fs = CPT sleeve friction
  • σvo = pre-insertion in-situ total vertical stress
  • σ′vo = pre-insertion in-situ effective vertical stress
  • (qt–σvo)/pa = dimensionless net cone resistance, and,
  • (pa/σ′vo)n = stress normalization factor
  • n = stress exponent that varies with SBT
  • pa = atmospheric pressure in same units as qt, σ v and σ v
  • Qtn = Normalized cone resistance
  • Fr = Normalized friction ratio
However, the literature indicates that few researchers have related the cone penetration test (CPT) data with the characteristics of soil profile [10]. Massarsch et. al. [16] introduced a correlation between cone resistance (Qc) and soil friction ratio (fr) based on Cone Penetration Testing (CPT). However, the proposed correlation assumes that the soil profile is homogeneous, which is not realistic. Brik et. al. [10] linked the Ic value and soil bearing-capacity improvement using CPT test data before and after the application of the DC technique in soil improvement projects. The results show that each Ic value has a range of improvement with minimum and maximum load-bearing capacity values or thresholds as follows: (i) If Ic is less than 2.25, then expected improvement ranges from 10 to 20 MPa; (ii) if Ic ranges from 2.25 to 2.6, then the expected improvement ranges from 5 to 10 MPa; (iii) if Ic ranges from 2.6 to 2.95, the expected improvement ranges from 0 to 5 MPa; and (iv) if Ic is larger than 2.95, the expected improvement is 0 MPa. However, the selected ranges of Ic values followed the pattern of collected data rather than soil zone categories. Furthemore, the results depend considerably on the relatively narrow CPT data in which the majority of Ic values fall between 2.25 and 2.95.
Recently, Chen et al. [17] developed a DC technology-based model under the framework of Mohr–Couloumb criterion to study the characteristics of gravelly soils. The improvement of the saturated foundation under dynamic compaction (DC) by incorporating the soil cap yield hardening model was proposed by Zhou et al. [18]. Yao and coworkers [5] studied the impact of dynamic compaction by multi-point tamping on the compaction of sandy soils, whereas Wersa et al. [19] performed an in-situ test with vibratory plates to enhance the compaction of granular soils. Wu et al.[20] studied the dynamic response and strengthening mechanisms through the vibration velocities from DC on the compaction of a coarse-grained soil-aggregate mixture. Khosravi et. al. [21] conducted a simulation of CPT to study the effect of various parameters on three dimensional discrete model to replicate realistic CPT tip resistance (qc) and friction sleeve shear stress (fs) measurements. It was found from the simulation study that the correlation between said two factors was an actual representation of coarse-grained soil. Despite the abundance of literature available in this field, there lacks a systematic framework that can be used to assess the effectiveness of the DC technique for soil improvement projects and to forecast the expected improvement in soil bearing capacity of the Saudi Arabian region. Accordingly, this research aims to develop an in-depth understanding of this issue and develop a reliable framework to assess the effectiveness of DC technology for soil enhancement using Cone Penetration Test data.

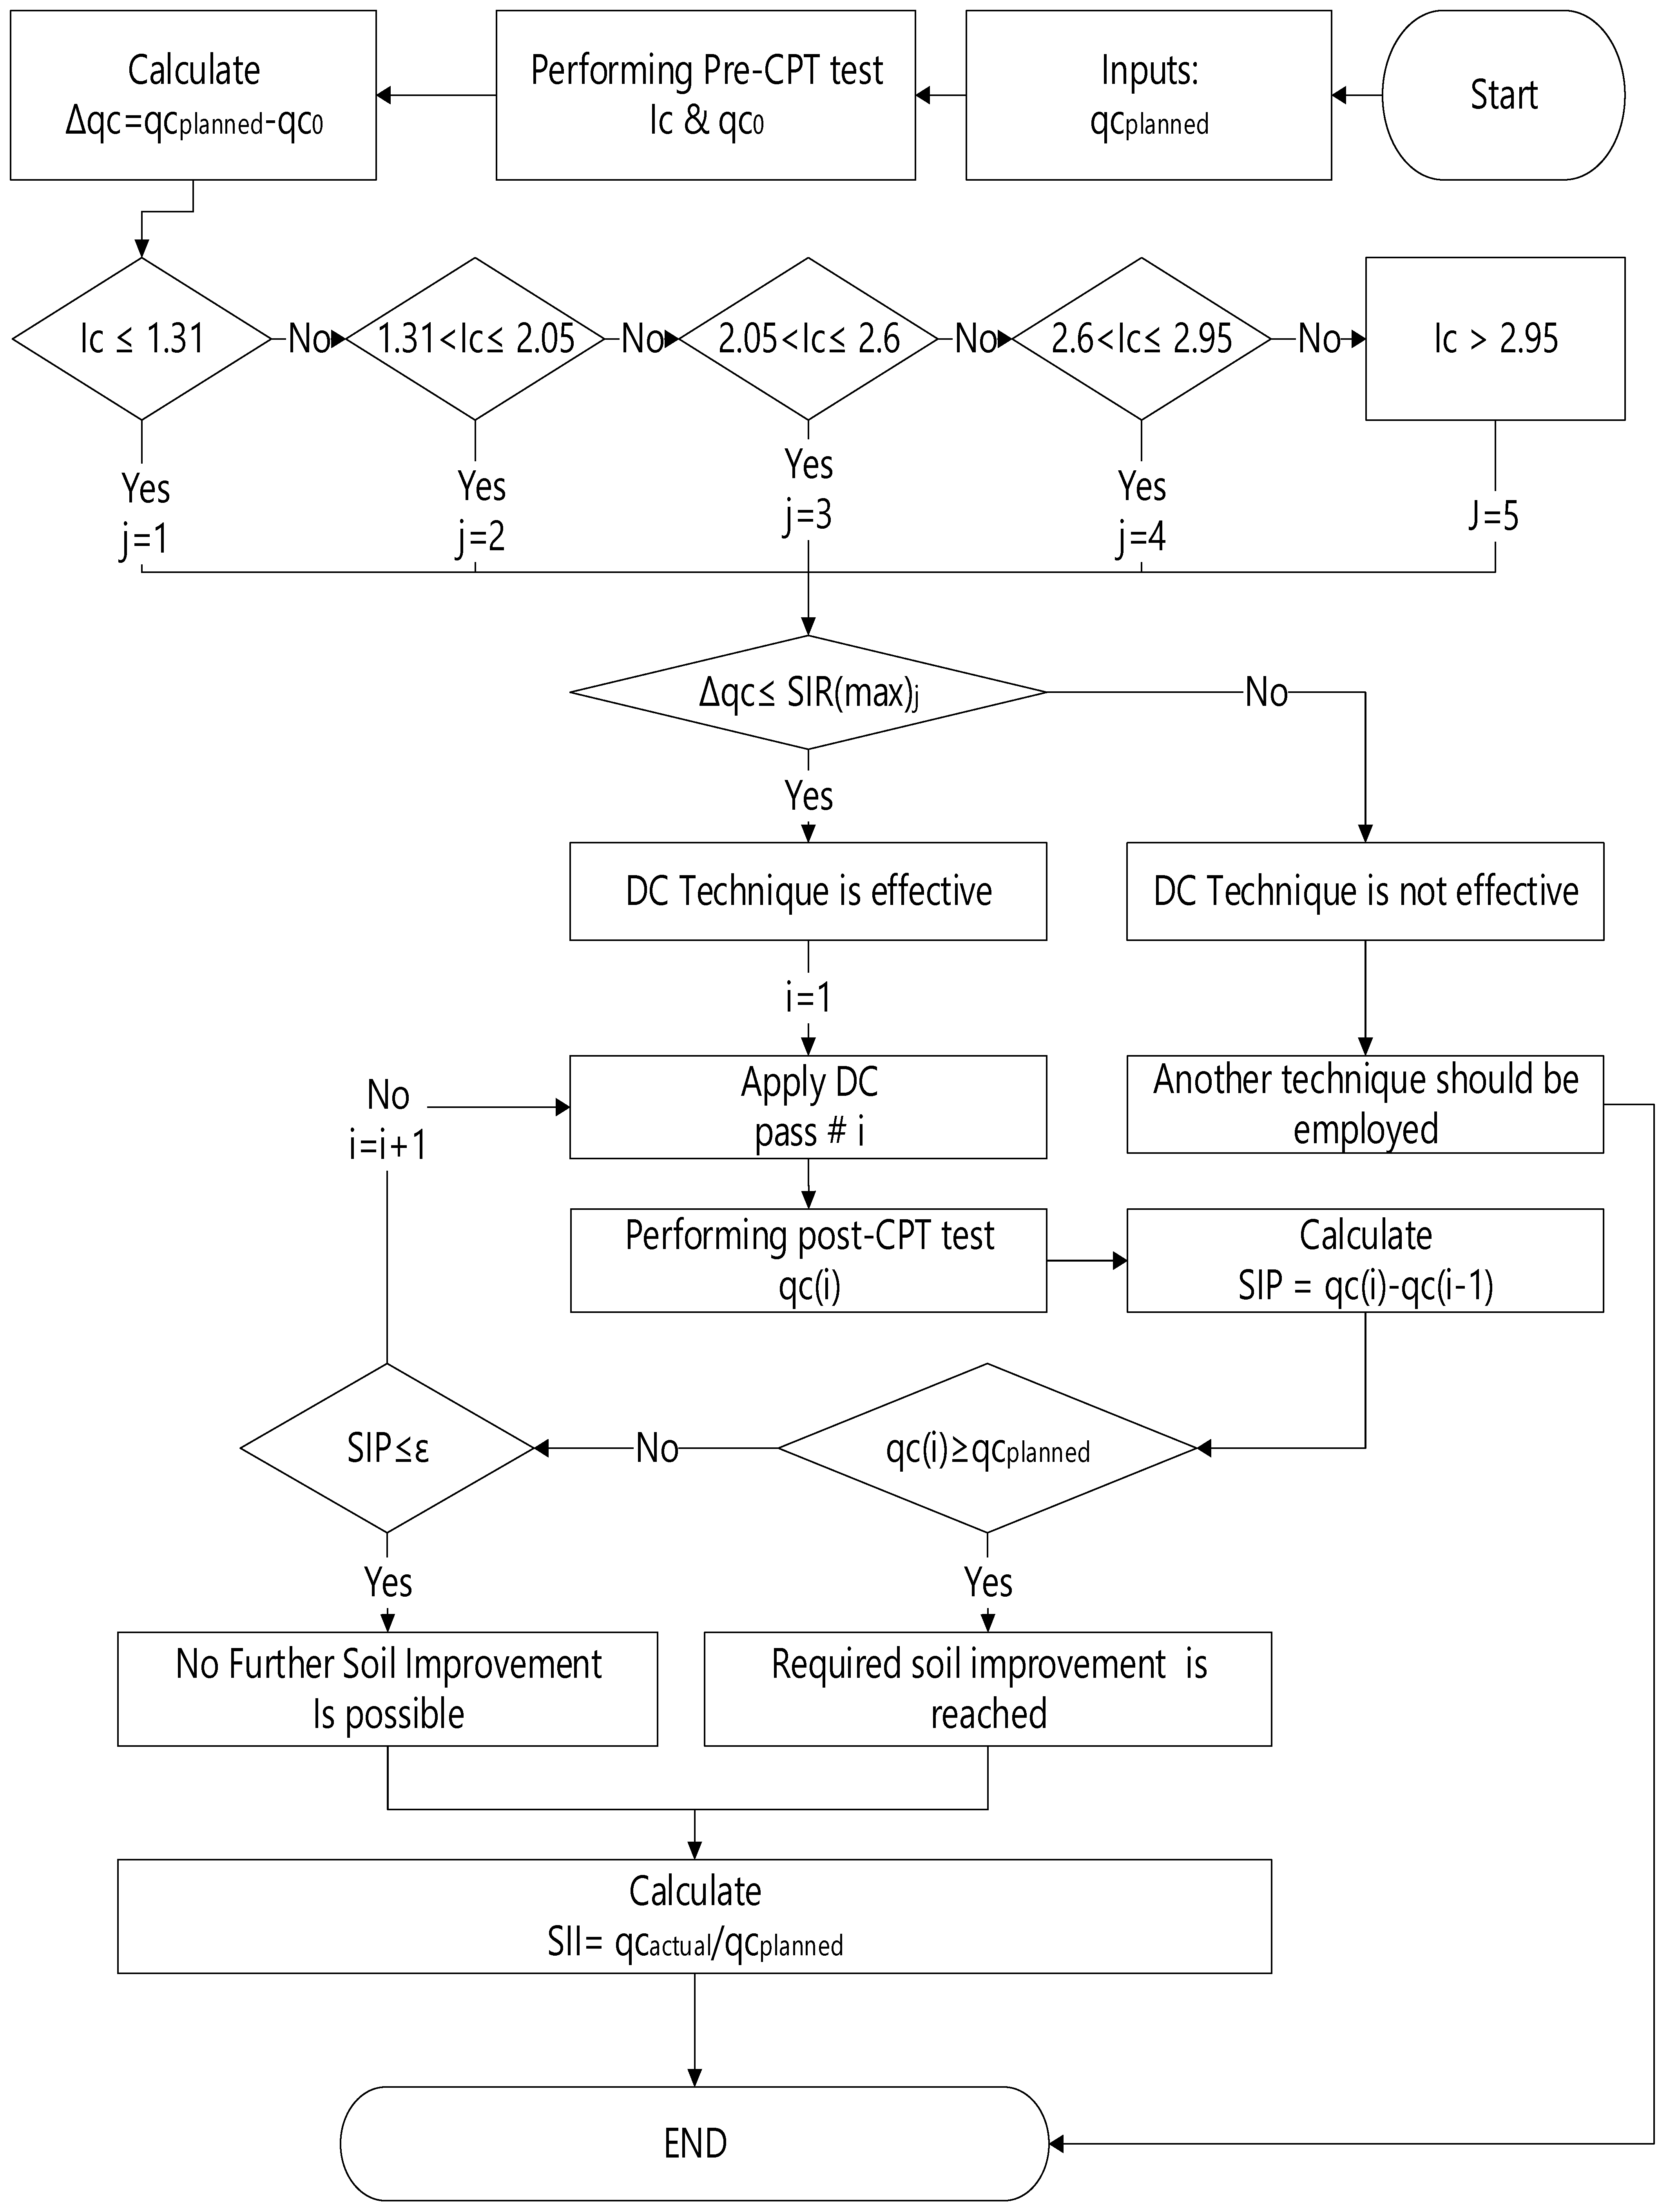
2. Proposed Methodology

The proposed methodology introduces a new systematic decision support framework that helps decision makers to assess the effectiveness of DC technique, evaluate the expected improvement of soil bearing capacity, and to monitor the performance of the DC technique during the implementation process. The soil data was collected through the CPT method. Cone penetration testing (CPT) is an in-situ assessment for determining soil type. In this test, a cone penetrometer is driven into the ground at a constant speed, and data is collected at regular intervals during penetration. It is portable, fast, and economical; it facilitates data automation and computerized management due to the use of digital electrical measurements; and it requires no substantial coring. Soil bearing capacity was evaluated from the CPT data using the Terzaghi equation with some modification factors [22,23]. The framework was developed, as shown in Figure 1, and consists of four main phases and eight steps, as follows.

3. Pre-Implementation Phase

This phase aims to collect the data and input pre-implementation of soil improvement technique. It consists of three steps, as follows:
  • Input data: In this phase, there are three types of input data that can be collected: (i) CPT data before the application of the soil improvement technique, which is called Pre-implementation CPT data, (ii) the planned bearing capacity of soil (i.e., 35 MPa) after the implementation of the DC technique, referred to as qcplanned, and (iii) the DC effectiveness threshold (ETDC) for the project stakeholders. The effectiveness threshold represents the percentage of DC effectiveness (e.g., ≥90%) to be considered as acceptable.
  • Data analysis: In this phase, the pre-implementation CPT data is analyzed to collect the Ic values of each layer in the soil profile to identify the soil category (from 1 to 5) of each layer, which indicates the category soil improvement range values called SIRj = [minj, maxj] where j = 1,..,5 and represents the number of the soil category, as shown in Table 2. Furthermore, the initial bearing capacity of soil before the implementation of the DC technique is calculated, and is called qc0.
3.
DC effectiveness evaluation: The effectiveness of dynamic compaction depends on the combination of weight, rammer geometry, drop height, distance, number of drops, and total compaction energy applied. On-site experiments were conducted, and CPT tests were performed before and after compaction to determine the effectiveness of the DC technique. The effectiveness of DC is evaluated before the implementation of DC using the following equations:
Calculate the planned improvement:
Δ q c = q c p l a n n e d q c 0
Evaluate the effectiveness of DC for each data point (Ic) in each soil category (j):
E f f j Ic = 1   ,   D C   i s   e f f e c t i v e   a n d   Δ q c S I R max j 0 ,   D C   i s   n o t   e f f e c t i v e a n d   Δ q c > S I R max j
where,
  • qcplanned represents the planned bearing capacity after DC implementation.
  • qc0 represents the initial bearing capacity before DC implementation.
  • SIR(max)j represents the left value of soil improvement range of soil category j.
Check If, DC is effective for the soil category (j) using the following equation:
E f f DC j = k = 1 k = N j E f f j k N j
where,
  • N(j) is the total number of data points under soil category (j)
Then, calculate the overall effectiveness of DC for the project using the weighted average for all soil categories (j):
E f f DC = j = 1 j = 5 E f f DC j N j j = 1 j = 5 N j  
Check if EffDCETDC go to step II.1 to proceed with the first pass (I = 1) of DC implementation
Else, DC technique is not effective for this type of soil, and another soil consolidation technique should be selected → go to step III.2

4. Implementation Phase

This phase includes the implementation of DC as an effective technique for soil improvement projects. It consists of two steps, as follows:
  • Monitoring data: In this phase, DC will be implemented using the weight, height, and grid required for improvement as presented in Equation (2). After each pass, post-implementation CPT data is collected and the improved bearing capacity of pass “i” is calculated, which is referred to as qci.
  • Performance evaluation: In this phase, the performance of DC will be evaluated using the following function:
Check If,
q c i     q c p l a n n e d  
Then, soil improvement completed → go to step III.2 Else, evaluate the soil improvement potential (SIP), using Equation (12), to measure the possibility for further improving the bearing capacity of soil using another pass of DC:
S I P j = q c i q c i 1  
Check if,
S I P j   ε  
Then, maximum improvement in soil bearing capacity is reached → go to step III.2
Else, this means Equations (11) and (13) are not satisfied;
Another pass “i + 1”of DC should be performed: i = i + 1 → go to step II.1 (i.e., proceed with the next pass of DC implementation).
where,
  • ε is a small number (e.g., 0.001)
  • qci is the bearing capacity improvement in current pass “i”.
  • qci−1 is the bearing capacity improvement in previous pass “i − 1”.
  • SIPj is the potential in improvement for a soil category.
  • j is the number of soil category j = 1…5 (refer to Table 1).
  • qcreq is the planned post-implementation bearing capacity.

5. Post-Implementation Phase

This phase indicates that the completion of the DC implementation as well as the maximum possible soil improvement in the project has been reached.
Improvement completion: This step indicates that the completion of the soil improvement, as illustrated in Equation (11), or the maximum possible improvement in bearing capacity of soil has been reached, as illustrated in Equation (13). In this step, the soil improvement index (SII) that represents a post-implementation performance index of DC technique can be calculated using Equation (14) as follows:
S I I = q c a c t u a l q c p l a n n e d   i f   S I I 1 ,   D C   p e r f o m e d   a s   e x p e c t e d   a n d   b e y o n d S I I < 1 ,   D C   i s   p e r f o r m e d   l e s s   t h a n   e x p e c t a t i o n s
where,
  • qcactual represents the actual bearing capacity after improvement.
  • qcplanned represents the planned bearing capacity after improvement.

6. Evaluation of Performance Indicators

After the application of the proposed method, its performance in predicting the expected improvement in the bearing capacity of soil can be evaluated using three indices: (1) the prediction accuracy (PA) for a specific soil category (j), (2)the overall prediction accuracy (OPA) of the project as a whole, and (3) the prediction performance index (PPI). The PA and OPA indices assess the accuracy of the proposed method in predicting the post-implementation improvement in the bearing capacity of soil at the soil category level as well as at the project level. On the other hand, PPI measures the deviation of the prediction accuracy of the proposed method between planned and actual predictions at the project level. PA, OPA, and PPI can be calculated using Equations (15)–(17), respectively.
P A = N P   S I R   j   N j
O P A = j = 1 j = n ( N   j N P S I R   j   j = 1 j = n N   j  
where,
  • N(j) is the total number of data points in soil category j.
  • NP[SIR(j)] represents the number of predictions that fall within the soil improvement range (SIRj) of Category (j) after the implementation of DC.
PPI = O P A E F F DC   if   PPI   >   1   that   means   the   DC   over - performed   in   this   project   if   PPI = 1   that   means   the   DC   well - performed   in   this   project   if   PPI <   1   that   means   the   DC   under - performed   in   this   project

7. Method Implementation and Discussion

The section will provide a combination of offshore fabrication, ship newbuilding and maintenance, and repair and overhaul (MRO) services including Very Large Crude Carrier (VLCC) capabilities. The projected area of the site is 4100 m × 1200 m. The proposed method was applied to a soil improvement project in the Eastern Province of Saudi Arabia, where the extremely hot and humid climate prevails [24]. A preliminary investigation of soil conditions revealed the presence of loose-to-medium dense silty sand in the top layer ranging in thickness from 4 to 8 m. A second layer of soft clay/silty clay layer ranging in thickness from 2 to 5 m and with significantly low qc values was also observed, and the soil penetration of the CPTs was approximately 7 to 9 m. The water table was between 0.1 m and 2.4 m below the natural ground level (NGL).

7.1. Pre-Implementation Phase

In this phase, the planned load-bearing capacity of the soil was set by the project stakeholders as 8 MPa. In this step the data collected from pre-implementation CPT data were analyzed to evaluate the Ic values. The Ic values of data points were categorized under one of the proposed soil categories, as proposed in Table 1. Table 2 shows examples of randomly selected Ic values of data points from each soil category (j). The initial bearing capacity for each data point wwere also extracted from the pre-implementation CPT data, as shown in Table 2. The expected improvement Δqc was calculated using Equation (7) for each data point, as shown in Table 2, to evaluate the effectiveness of DC using Equation (8). The overall effectiveness of the DC technique for each soil category and the whole project was also calculated using Equations (9) and (10), respectively. In conclusion, the results justified the implementation of DC as an appropriate soil improvement technique in the project, as shown in Table 3.

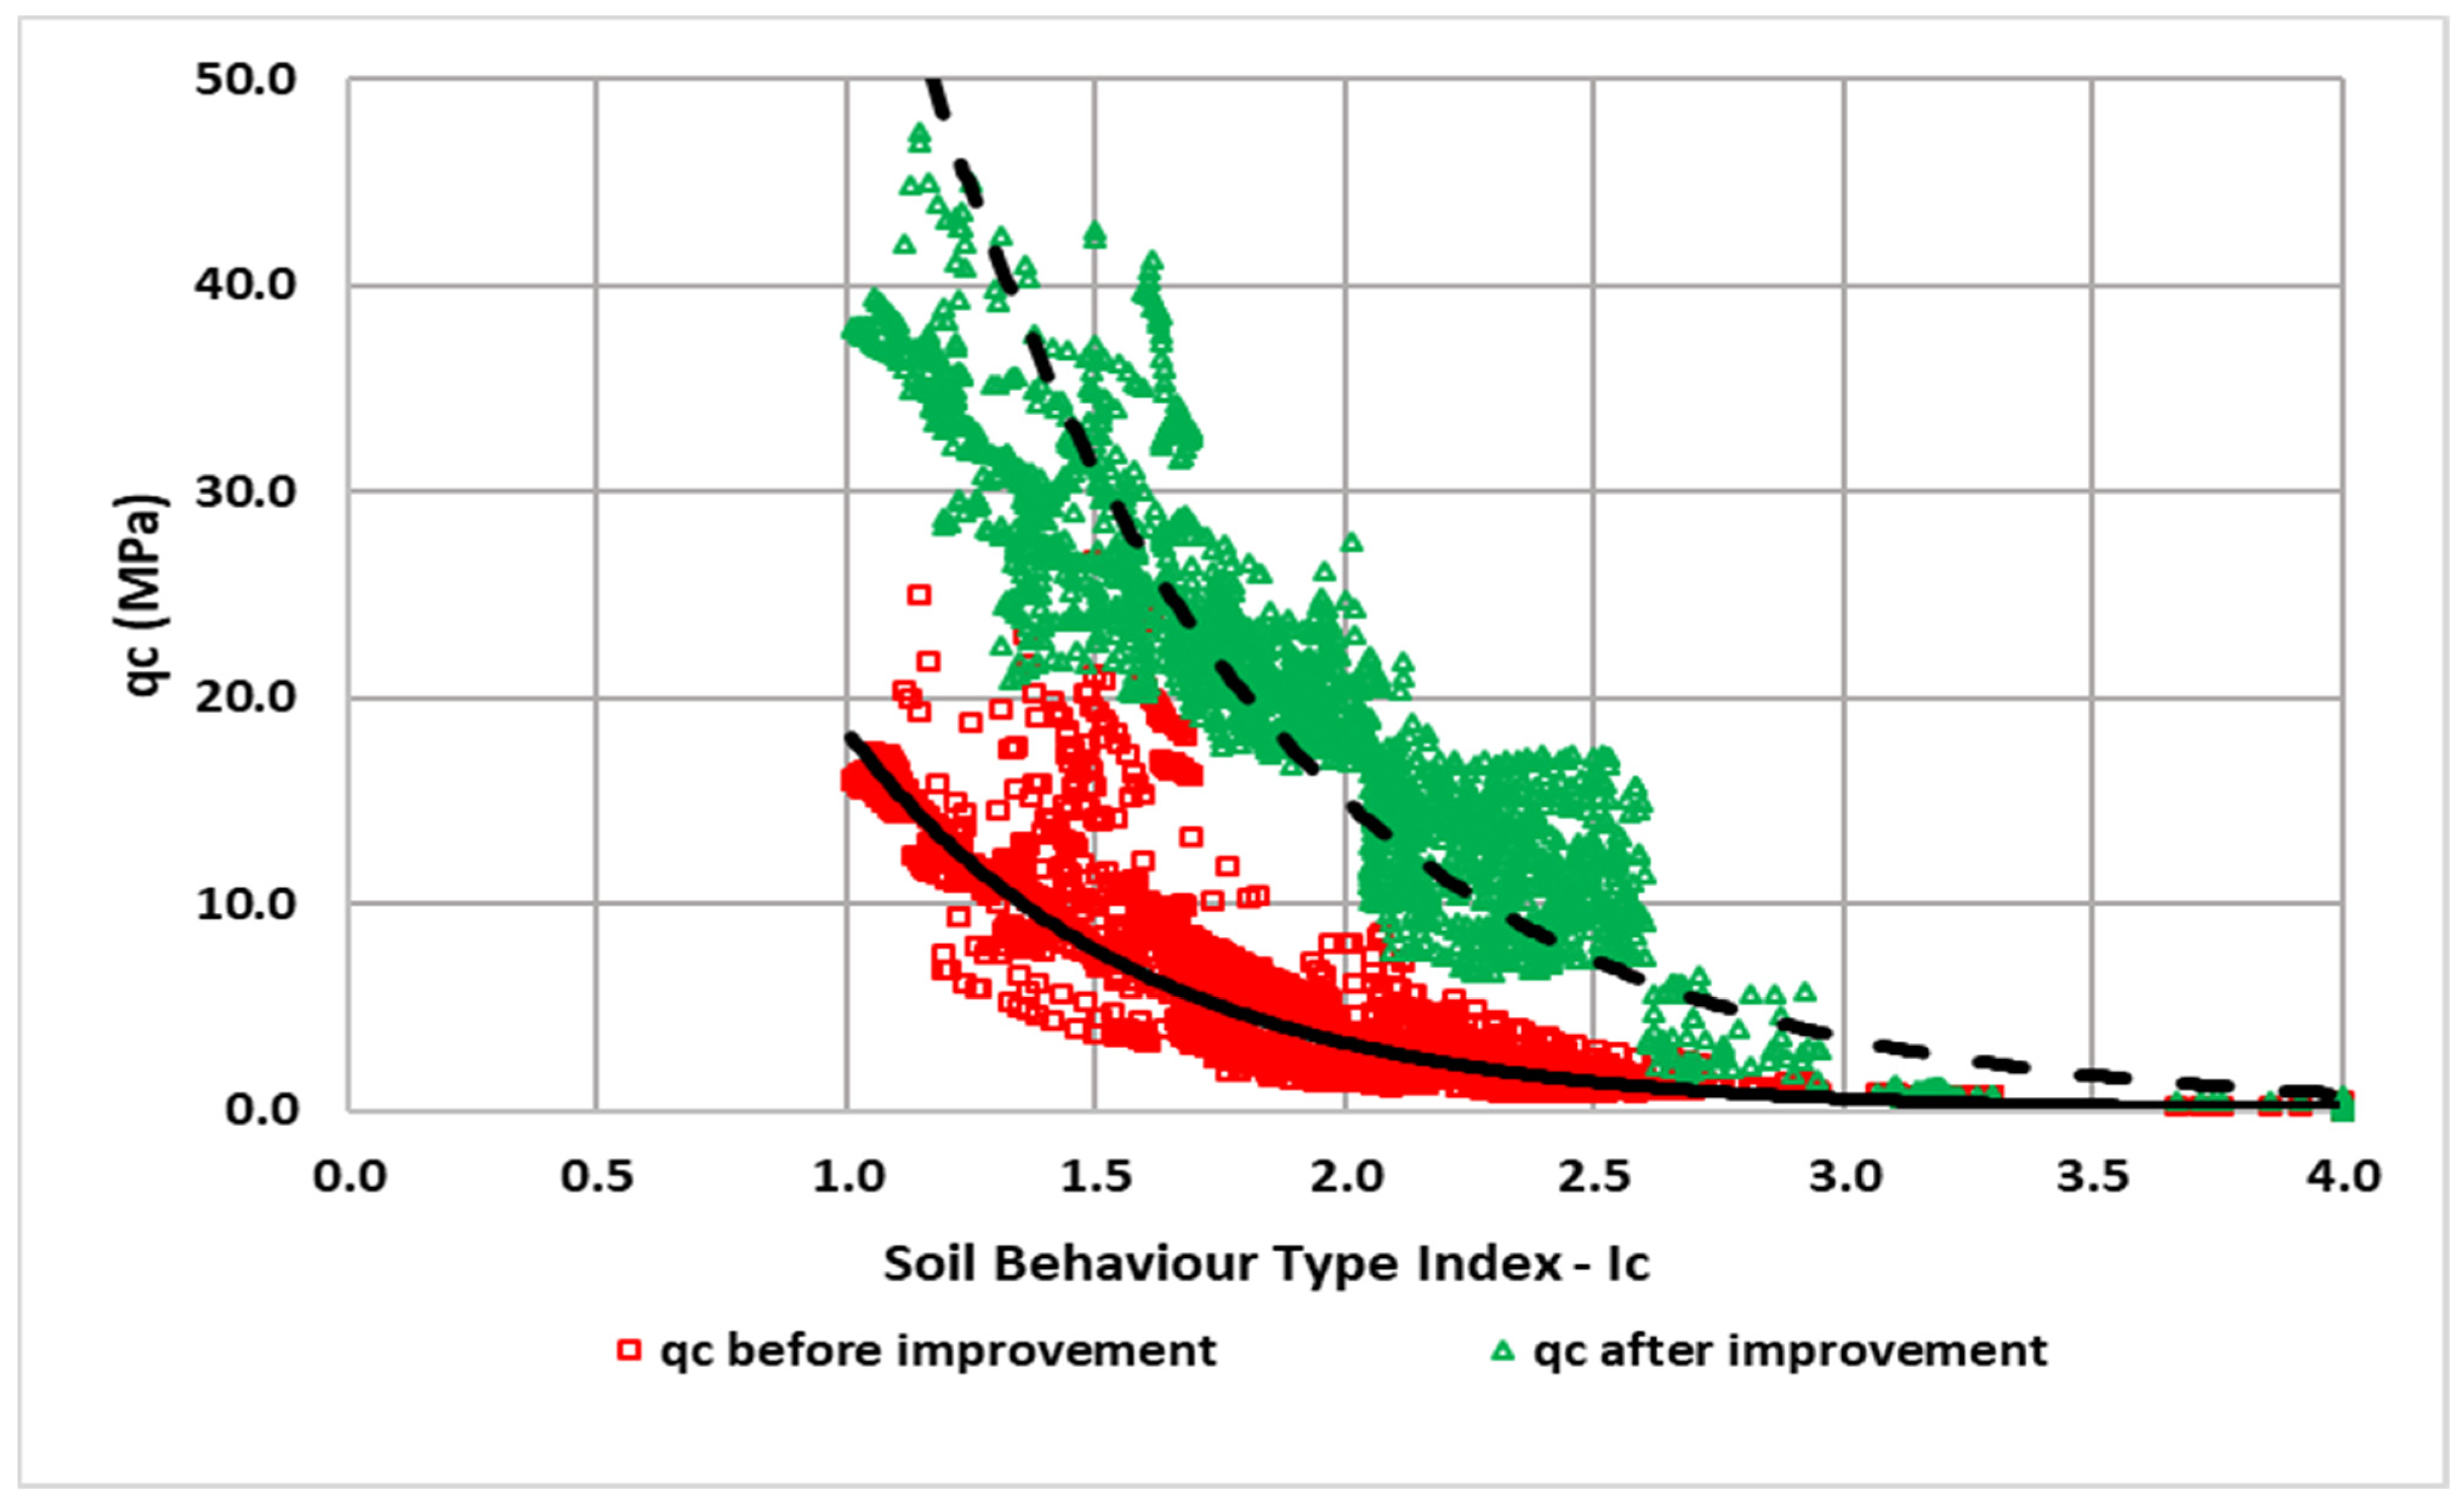
7.2. Implementation Phase

In this phase, DC was implemented using the characteristics shown in Table 3. The post-implementation CPT data were collected and the bearing capacity qci for each pass “i” was calculated, as shown in Table 4. Table 4 shows example of the monitoring data between two sets of data: (1) before implementation of DC (i.e., i = 0) and (2) after implementation of DC (i = 1). However, in the case of several passes of DC implementation, similar evaluations should be done after each pass “i”, as illustrated in Equations (11)–(13). The obtained results of the implementation phase are tabulated in Table 5.

7.3. Post-Implementation Phase

After the completion of the ground improvement process, DC post-implementation CPTs were conducted to evaluate the soil improvement index (SII), which indicates the performance of the DC technique in improving the soil bearing capacity using Equation (14). The comparison between the post and pre-improvement qc values, shown in Figure 2, shows the relationship between Ic values and the possible improvement in qc using the DC technique.
Table 6 confirms the accuracy of the developed framework in predicting the expected improvement in the bearing capacity of each layer. The layers were classified into five soil categories, as shown in Table 1, and the effectiveness of the DC technique and the improvement in the bearing capacity using the developed framework were evaluated as shown in Table 3.

8. Discussion and Analysis

The results showed that the accuracy in predicting soil improvement by the pre-implementation of the DC technique using CPT data ranged from 78% to 100%. The accuracy of the prediction underlines the effectiveness of the developed framework in predicting soil improvement after the implementation of the DC technique. Moreover, the developed framework was able to predict the effectiveness of the DC technique in improving the soil bearing capacity in 99.08% of the layers, which indicates the effectiveness of the developed framework in evaluating the effectiveness of the DC technique in improving soil bearing capacity using initial CPT data, as shown in Table 3.
Figure 2 shows the soil bearing capacity before and after the implementation of the DC technique; the bearing capacity of the soil was significantly enhanced, as illustrated in the Figure 2. The results are in good agreement and consistent with [6,10,18], who suggested that the soil layers with Ic values higher than 2.95% may not receive a significant improvement in soil bearing capacity, which eventually leads to the lower efficiency of DC. However, soil types where the predicted negligible q (0 to 1 MPa) means that they require improved soil bearing capacity do not justify the use of the DC technique due to the impracticability in terms of cost and time required to implement it. In addition, these studies established that soil with an Ic value of less than 1.31 can experience a 20 MPa improvement in load-bearing capacity. On the other hand, both studies confirmed that soil layers with an Ic value between 1.31 and 2.95 experience an improvement in soil bearing capacity ranging from 1 to 20 MPa. Table 3 illustrates the SIR with the percent error for each category ranging from 0 to 21%, reflecting a good accuracy status for the proposed case study. The reliability and accuracy of the proposed framework is around 99.08%, reflecting that the framework is a reliable basis for geo-technicians, designers, and decision makers to rely on as a guide for the DC engineering process. Finally, the study results support the soil improvement results of Brik and Robertson (2018).

9. Conclusions

In conclusion, the developed method introduces a new systematic framework for selecting a DC technique as the most appropriate soil improvement technique, and evaluating its effectiveness for soil improvement projects using initial CPT data. The developed system provides a decision support tool that can help decision makers to decide whether to use the DC or another soil improvement technique for soil improvement projects. It also offers a prediction system that allows the assessment of a possible improvement in load-bearing capacity using the DC technique based on the soil’s Ic value. It also includes a monitoring system that allows decision makers to track the performance of DC and decide whether or not to proceed with the soil improvement process using the newly introduced indicator called Soil Improvement Potential (SIP). This indicator helps evaluate performance in near real time and assess the potential for further improvement in soil bearing capacity. In addition, this paper categorizes soil into five categories based on the potential to improve load-bearing capacity through DC technology. The developed method was applied on a case study to highlight the applicability and the efficiency of the introduced framework in selecting and evaluating the DC as the most appropriate technique for soil improvement projects. The results show considerable accuracy in predicting the expected improvement in soil bearing capacity when the DC technique is implemented, and it show high accuracy in evaluating the effectiveness of the DC technique on a specific soil type (e.g., Ic-Values). The results were compared with results from literature to evaluate the precision of the developed method in assessing the expected improvement in soil bearing capacity. The comparison showed considerable agreement, indicating the effectiveness of the developed method and its accuracy in selecting DC as the most appropriate soil improvement technique as well as in predicting improvement in soil bearing capacity after implementation. In future projects, the developed framework will be applied using CPT data from different soil improvement projects with various type of soils (e.g., Ic values) to study the impact of other soil characteristics on the improvement of bearing capacity of soil.
In summary, the proposed evaluation and assessment framework provides project managers with decision data throughout the life cycle of soil improvement projects. The pre-implementation phase provides decision makers with the necessary data to decide whether or not to deploy DC.
In addition, the implementation phase provides monitoring data that allows decision makers to decide whether the further use of DC is justified based on a quantitative indicator SIP. The post-implementation phase provides decision makers with the overall performance of DC technique in a soil improvement project using a set of quantitative indicators including soil improvement index (SII), prediction accuracy (PA), and overall predication accuracy (OPA).

Author Contributions

Conceptualization, A.A. and A.M.A.; methodology, A.A. and A.M.A.; software, A.A.; validation, M.N.N., S.H.A. and N.A.A.; formal analysis, A.A. and M.N.N.; investigation, A.A. and M.N.N.; resources, A.M.A., M.S.A., W.A.G.A.-G., S.H.A. and N.A.A.; data curation, A.A. and M.N.N.; writing—original draft preparation, A.M.A.; writing—review and editing, A.M.A., M.S.A., W.A.G.A.-G., S.H.A. and N.A.A.; visualization, A.A. and M.N.N.; supervision, A.M.A. and M.S.A.; project administration, A.M.A., W.A.G.A.-G., S.H.A. and N.A.A.; funding acquisition, A.M.A., M.S.A., W.A.G.A.-G., S.H.A. and N.A.A. All authors have read and agreed to the published version of the manuscript.

Funding

This research received no external funding.

Institutional Review Board Statement

Not applicable.

Informed Consent Statement

Not applicable.

Data Availability Statement

No new data were created or analyzed in this study. Data sharing is not applicable to this article.

Conflicts of Interest

The authors declare no conflict of interest.

References

  1. Jiang, N.J.; Wang, Y.J.; Chu, J.; Kawasaki, S.; Tang, C.S.; Cheng, L.; Du, Y.J.; Shashank, B.S.; Singh, D.N.; Han, X.L.; et al. Bio-mediated soil improvement: An introspection into processes, materials, characterization and applications. Soil Use Manag. 2022, 38, 68–93. [Google Scholar] [CrossRef]
  2. Das, B. Principles of Foundation Engineering, 9th ed.; Cengage Learning: Boston, MA, USA, 2016; Volume 1. [Google Scholar]
  3. Abdel-Rahman, M.M. Review of Soil Improvement Techniques. In Advances in Geotechnical Engineering; Springer: Cham, Switzerland, 2021; pp. 175–199. [Google Scholar] [CrossRef]
  4. Bilal, M.; Talib, A. A study on advances in ground improvement techniques. Adv. Geotech. Eng. 2016, 322–330. [Google Scholar] [CrossRef]
  5. Yao, Z.; Zhou, C.; Lin, Q.; Yao, K.; Satchithananthan, U.; Lee, F.H.; Tang, A.M.; Jiang, H.; Pan, Y.; Wang, S. Effect of dynamic compaction by multi-point tamping on the densification of sandy soil. Comput. Geotech. 2022, 151, 104949. [Google Scholar] [CrossRef]
  6. Li, X.; Zhang, K.; Ma, X.; Teng, J.; Zhang, S. New Method to Evaluate Strengthen Efficiency by Dynamic Compaction. Int. J. Geomech. 2020, 20, 4. [Google Scholar] [CrossRef]
  7. Ghassemi, A.; Pak, A.; Shahir, H. Numerical study of the coupled hydro-mechanical effects in dynamic compaction of saturated granular soils. Comput. Geotech. 2010, 37, 10–24. [Google Scholar] [CrossRef]
  8. Bo, M.W.; Na, Y.M.; Arulrajah, A.; Chang, M.F. Densification of granular soil by dynamic compaction. In Institution of Civil Engineers: Ground Improvement; Thomas Telford Ltd.: London, UK, 2009; Volume 162, pp. 121–132. [Google Scholar]
  9. Ghorbani, J.; Nazem, M.; Carter, J.P. Dynamic Compaction of Clays: Numerical Study Based on the Mechanics of Unsaturated Soils. Int. J. Geomech. 2020, 20, 04020195. [Google Scholar] [CrossRef]
  10. Brik, A.; Robertson, P.K. Use of CPTu for Design. In Cone Penetration Testing, Proceedings of the Monitoring and Quality Assurance of DC/DR Ground Improvement Projects—Proceedings of the 4th International Symposium on Cone Penetration Testing (CPT’18), Delft, The Netherlands, 21–22 June 2018; CRC Press: Boca Raton, FL, USA, 2018; pp. 21–22. [Google Scholar]
  11. Maurer, B.W.; Green, R.A.; van Ballegooy, S.; Wotherspoon, L. Development of region-specific soil behavior type index correlations for evaluating liquefaction hazard in Christchurch, New Zealand. Soil Dyn. Earthq. Eng. 2019, 117, 96–105. [Google Scholar] [CrossRef]
  12. Teng, J.; Zhang, X.; Zhang, S.; Zhao, C.; Sheng, D. An analytical model for evaporation from unsaturated soil. Comput. Geotech. 2019, 108, 107–116. [Google Scholar] [CrossRef]
  13. Lukas, R.G. Geotechnical Engineering Circular No. 1, Dynamic Compaction; Fhwa-Sa-95-037; U.S. Federal Highway Administration: Washington, DC, USA, 1995. [Google Scholar] [CrossRef]
  14. Moinfar, A.; Shahgholi, G.; Abbaspour-Gilandeh, Y.; Herrera-Miranda, I.; Hernández-Hernández, J.L.; Herrera-Miranda, M.A. Investigating the effect of the tractor drive system type on soil behavior under tractor tires. Agronomy 2021, 11, 4. [Google Scholar] [CrossRef]
  15. Robertson, P.K. Evaluation of flow liquefaction and liquefied strength using the cone penetration test: An update. Can. Geotech. J. 2022, 59, 620–624. [Google Scholar] [CrossRef]
  16. Rainer Massarsch, K.; Fellenius, B.H. Chapter 19 Deep vibratory compaction of granular soils. Elsevier Geo-Eng. B Ser. 2005, 3, 539–561. [Google Scholar] [CrossRef]
  17. Chen, L.; Qiao, L.; Li, Q. Study on dynamic compaction characteristics of gravelly soils with crushing effect. Soil Dyn. Earthq. Eng. 2019, 120, 158–169. [Google Scholar] [CrossRef]
  18. Zhou, C.; Jiang, H.; Yao, Z.; Li, H.; Yang, C. Computers and Geotechnics Evaluation of dynamic compaction to improve saturated foundation based on the fl uid-solid coupled method with soil cap model. Comput. Geotech. 2020, 125, 103686. [Google Scholar] [CrossRef]
  19. Wersa, C.; Massarsch, K.R.; Spross, J. ScienceDirect Heavy vibratory plate compaction of silty sand: A field study. Soils Found. 2022, 62, 101208. [Google Scholar] [CrossRef]
  20. Wu, S.; Wei, Y.; Zhang, Y.; Cai, H.; Du, J.; Wang, D.; Yan, J. Dynamic compaction of a thick soil-stone fill: Dynamic response and strengthening mechanisms. Soil Dyn. Earthq. Eng. 2020, 129, 105944. [Google Scholar] [CrossRef]
  21. Khosravi, A.; Martinez, A.; DeJong, J.T. Discrete element model (DEM) simulations of cone penetration test (CPT) measurements and soil classification. Can. Geotech. J. 2020, 57, 1369–1387. [Google Scholar] [CrossRef]
  22. Eslami, A.; Gholami, M. Bearing Capacity Analysis of Shallow Foundations from CPT Data. In Proceedings of the 16th International Conference on Soil Mechanics and Geotechnical Engineering, Osaka, Japan, 12–16 September 2005; pp. 1463–1466. [Google Scholar]
  23. Xu, D.S.; Liu, Z.W.; Chen, B.; Xu, X.Y. Bearing capacity analysis of offshore pipe piles with CPTs by considering uncertainly. Comput. Geotech. 2020, 126, 103731. [Google Scholar] [CrossRef]
  24. Alyami, S.H.; Almutlaqa, A.A.; Alqahtany, A.M.; Ashraf, N. Likelihood of Reaching Zero Energy Building Design in Hot Dry Climate: Saudi Arabia. IEEE Access 2021, 9, 167054–167066. [Google Scholar] [CrossRef]
Figure 1. Proposed evaluation and assessment framework for implementation of DC technique.
Applsci 12 09686 g001
Figure 2. pre and post improvement qc vs. Ic.
Applsci 12 09686 g002
Table 1. Soil behavior type as a function of soil behavior type index (Ic) [10,14,15].
ZoneSoil Behavior TypeIc
1Sensitive, fine grainedN/A
2Organic soils—clay>3.6
3Clays—silty clay to clay2.95–3.6
4Slit mixtures—clayey slit to slit clay2.60–2.95
5Sand mixtures—silty sand to sandy slit2.05–2.6
6Sands—clean sand to silty sand1.31–2.05
7Gravelly sand to dense sand<1.31
8Very stiff sand to clayey sandN/A
9Very stiff, fine grainedN/A
Table 2. Proposed Soil category and maximum improvement (Robertson, 2009 and Robertson and Wride, 1998).
Proposed Soil Category (j)Zone IcFine Content %
Robertson and Wride, 1998)
Proposed SIRj [minj, maxj]
(Adopted)
17–9 I c ≤ 1.31Fine content is less than 0.5%[20, +∞] MPa
261.31 < I c ≤ 2.05Fine content is between 0.5% and 14%[15–20] MPa
352.05 < I c ≤ 2.6Fine content is between 14% and 35%[5–15] MPa
442.6 < I c ≤ 2.95Fine content is between 35% and 55%[1–5] MPa
51,2 & 32.95 < I c Fine content is between 55% and 100%[0–1] MPa
Table 3. DC Effectiveness for each soil category in the project.
Soil Category (j)NSIRIcqc0ΔqcEffj (Ic)EffDC (j)EffDC
(MPa)(k)
1172[20, +∞]Ic ≤ 1.3125.050.001.001.000.939
11.440.001.00
11.950.001.00
12.270.001.00
12.680.001.00
12.150.001.00
7.920.091.00
7.530.471.00
7.530.471.00
6.801.201.00
21165[15–20]1.31 < Ic ≤ 2.0518.150.001.001.00
18.450.001.00
7.330.671.00
13.000.001.00
15.560.001.00
15.150.001.00
3.504.501.00
3.534.471.00
6.151.851.00
6.611.391.00
3799[5–15]2.05 < Ic ≤ 2.64.813.191.001.00
6.741.261.00
5.552.451.00
5.212.791.00
4.883.121.00
2.925.081.00
2.925.081.00
2.215.791.00
2.065.941.00
1.736.271.00
466[1–5]2.6 < Ic ≤ 2.951.106.900.000.00
1.066.940.00
1.046.960.00
1.036.970.00
1.326.680.00
1.226.780.00
1.466.540.00
1.026.980.00
1.007.000.00
0.957.050.00
573[0–1]Ic > 2.950.927.080.000.00
0.727.280.00
0.697.310.00
0.697.310.00
0.697.310.00
0.697.310.00
0.757.250.00
0.817.190.00
0.807.200.00
0.807.200.00
Table 4. DC implementation parameters of the case study.
Parameter Value
Height (m)20
Blows15
Weight (Ton)26
Primary Grid Patterns (m)8.5
Depth of Improvement (m)8
Table 5. Implementation Phase monitoring results of pass i = 1.
IDIc Valueqcplanned-MPaqci−1-MPaqci-MPaSIP(Ic)iIs There Any Improvement Potential for This Ic Value?Soil Improvement Index (SII)
12.8581.102.441.34Yes0.30
22.851.062.921.87Yes0.37
32.871.042.921.89Yes0.37
42.871.033.642.61Yes0.45
52.791.324.022.70Yes0.50
62.931.223.021.80Yes0.38
72.921.462.821.37Yes0.35
82.641.023.001.97Yes0.37
93.190.740.930.19No0.12
103.180.750.930.19No0.12
113.160.770.960.20No0.12
123.150.780.870.09No0.11
133.070.870.880.01No0.11
143.100.850.970.12No0.12
153.200.650.910.26No0.11
163.200.651.040.39No0.13
173.200.651.110.46No0.14
183.200.651.140.49No0.14
193.180.651.130.48No0.14
203.190.651.110.46No0.14
213.190.641.090.45No0.14
223.170.651.080.43No0.14
233.190.641.080.43No0.13
243.190.641.130.49No0.14
252.092.8812.839.96Yes1.60
262.112.8212.119.30Yes1.51
272.112.8011.438.63Yes1.43
282.102.8010.497.70Yes1.31
292.072.9410.217.27Yes1.28
302.062.9510.657.70Yes1.33
312.062.9510.757.79Yes1.34
322.062.9710.847.87Yes1.36
332.053.0110.967.94Yes1.37
342.092.8812.839.96Yes1.60
352.112.8212.119.30Yes1.51
362.112.8011.438.63Yes1.43
372.102.8010.497.70Yes1.31
382.072.9410.217.27Yes1.28
391.667.7023.5315.82Yes2.94
401.548.8624.4915.64Yes3.06
411.548.9424.4915.55Yes3.06
421.8210.4426.0415.59Yes3.25
431.658.9824.7315.75Yes3.09
441.698.4224.0715.64Yes3.01
451.708.3323.7315.39Yes2.97
461.718.1923.3715.18Yes2.92
471.708.1923.3515.16Yes2.92
481.708.0423.3415.30Yes2.92
491.1312.3236.4924.17Yes4.56
501.1412.3036.5424.24Yes4.57
511.1612.2536.6824.43Yes4.58
521.1612.1936.4824.30Yes4.56
531.1712.1136.4024.28Yes4.55
541.1912.1136.3924.28Yes4.55
551.1912.1135.3123.20Yes4.41
561.2012.0933.5221.43Yes4.19
571.2112.0032.1820.18Yes4.02
581.2211.0737.2226.14Yes4.65
591.2011.1338.2527.12Yes4.78
601.1811.3938.2326.84Yes4.78
Table 6. Summary of Soil Improvement Range for Soil categories.
Soil Category (j)Ic RangeSIRN(j)NP[SIR(j)]PAOPAPPI
1Ic ≤ 1.31[20, +∞] MPa 22751721.000.991.06
21.31 < Ic ≤ 2.05[10–20] MPa 11651.00
32.05 < Ic ≤ 2.6[5–10] MPa 7990.99
42.6 < Ic ≤ 2.95[1–5] MPa 660.79
5Ic > 2.95[0–1] MPa 730.99
Publisher’s Note: MDPI stays neutral with regard to jurisdictional claims in published maps and institutional affiliations.

