
Regression Analysis of Rectal Cancer and Possible Application of Artificial Intelligence (AI) Utilization in Radiotherapy


Abstract
:1. Introduction
2. Materials and Methods
2.1. Tumour Site Delineation and Contouring
- Aged 18–80 years old;
- Locally advanced adenocarcinoma of the rectum;
- Received neoadjuvant long course chemo-radiotherapy;
- Treated with Elekta LINAC machines using the Monaco treatment planning system;
- Daily CBCT was performed for image verification throughout the whole treatment course.
2.2. Intra-Treatment Rectum Tumor Volume Change
2.3. Relation between TVRR and a Patient’s Clinical Variables
2.4. Data Analysis
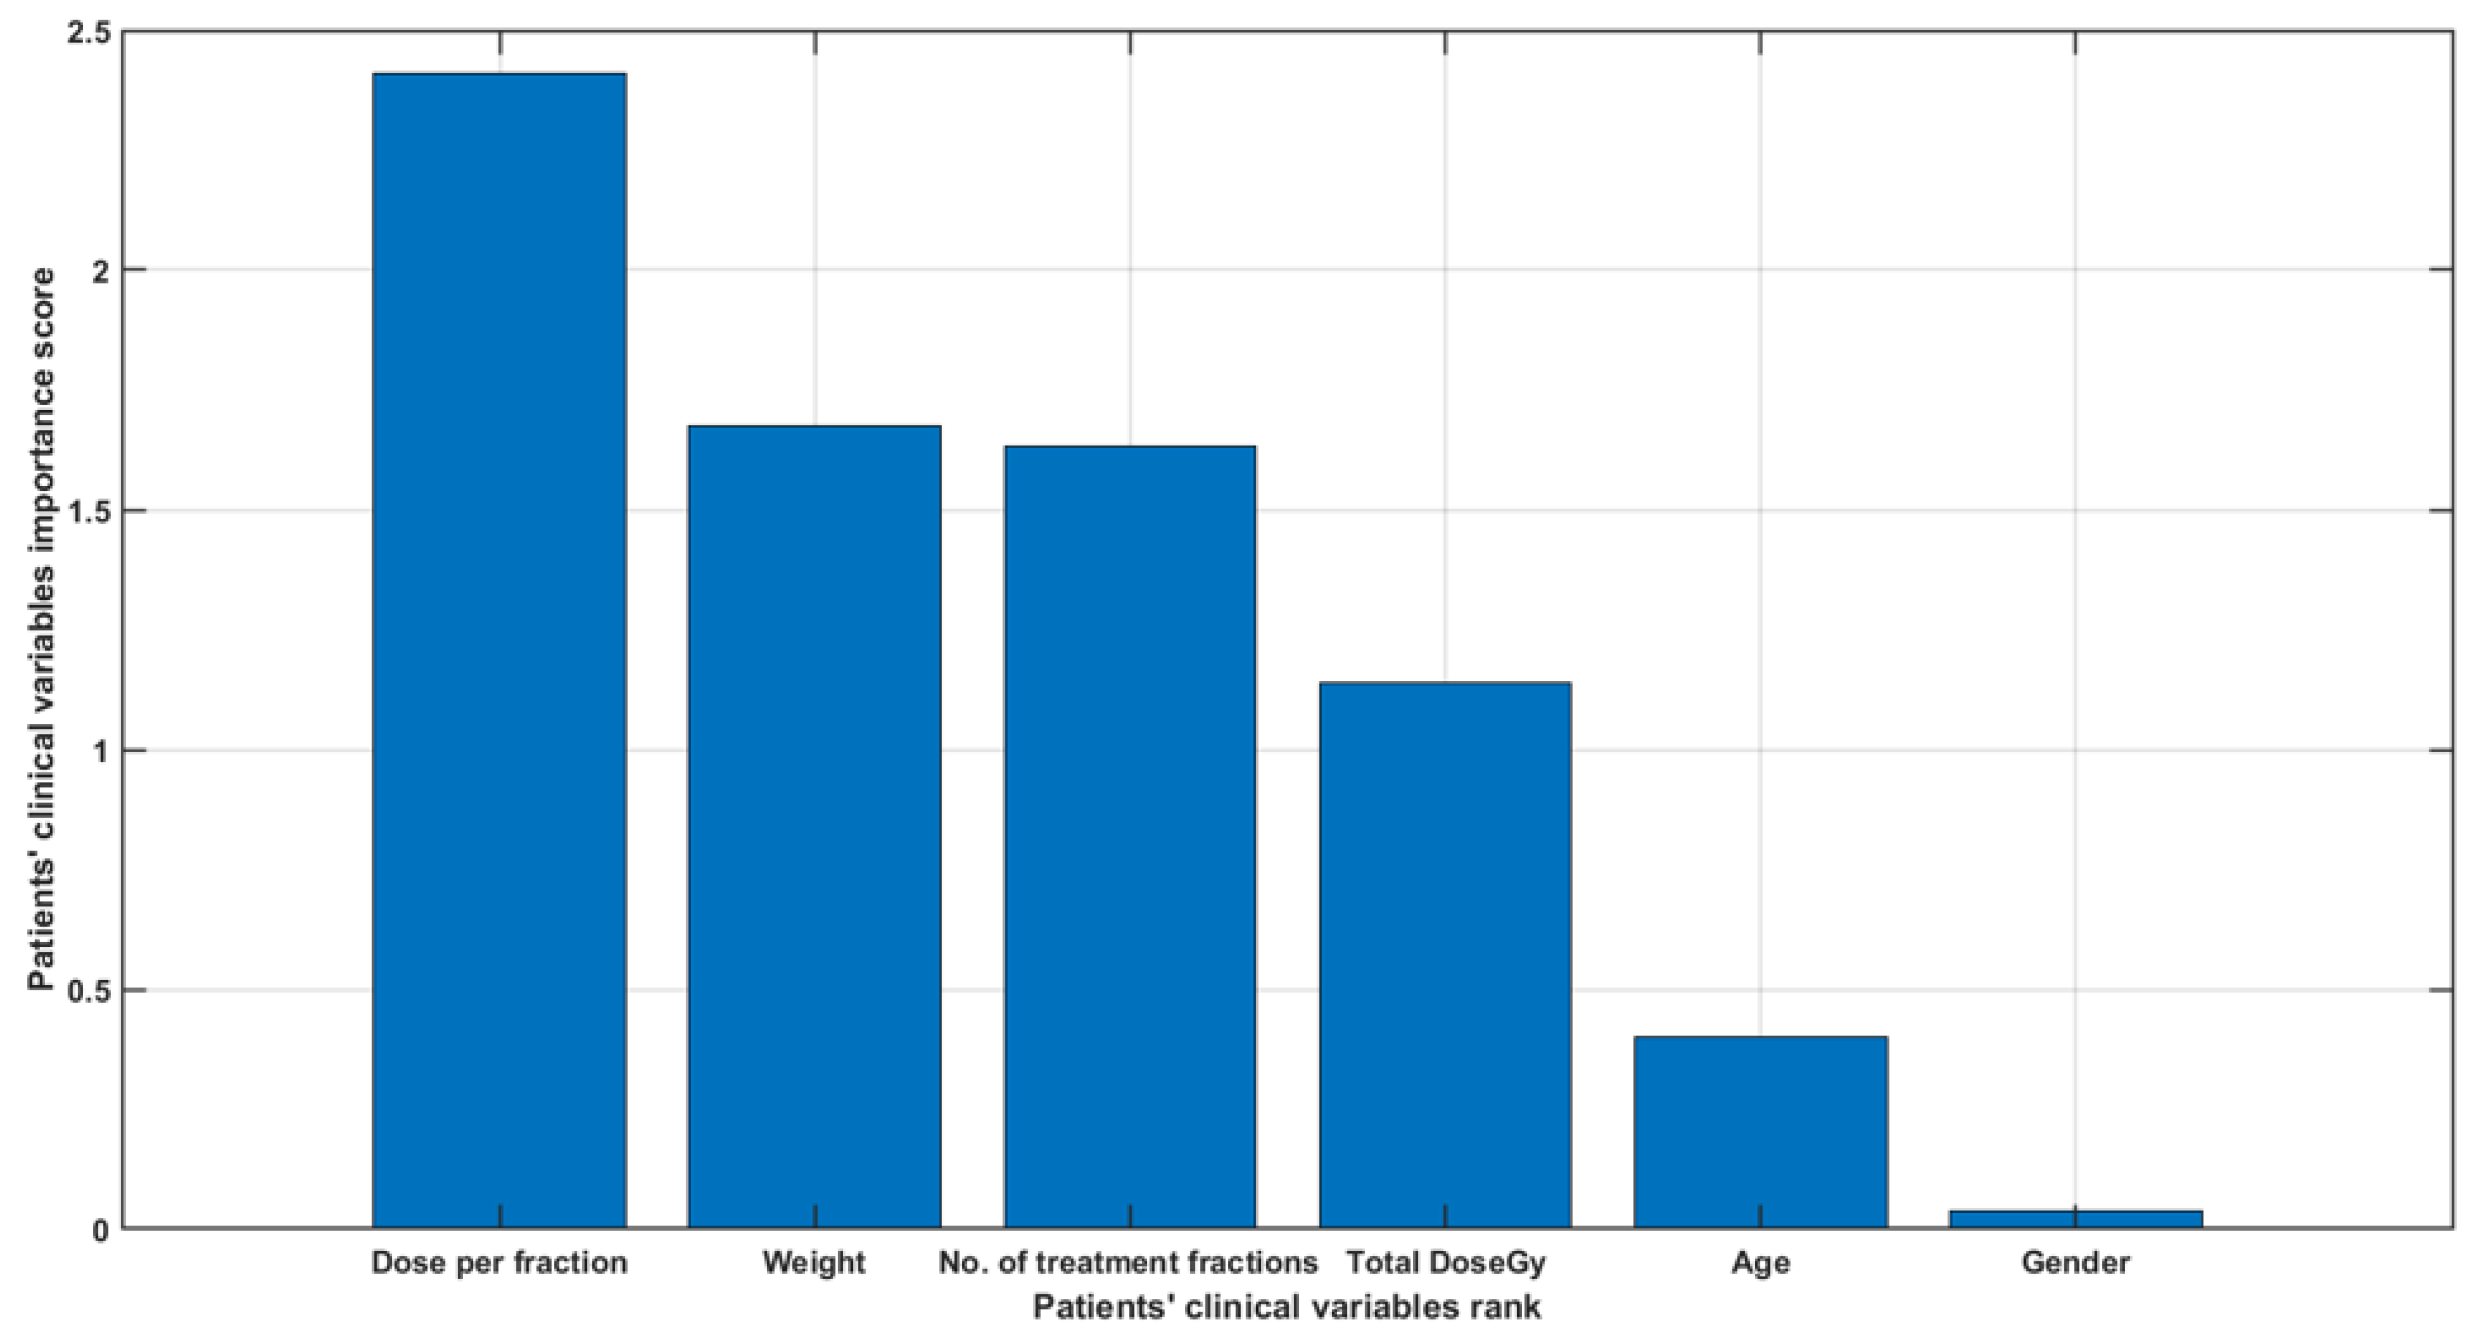
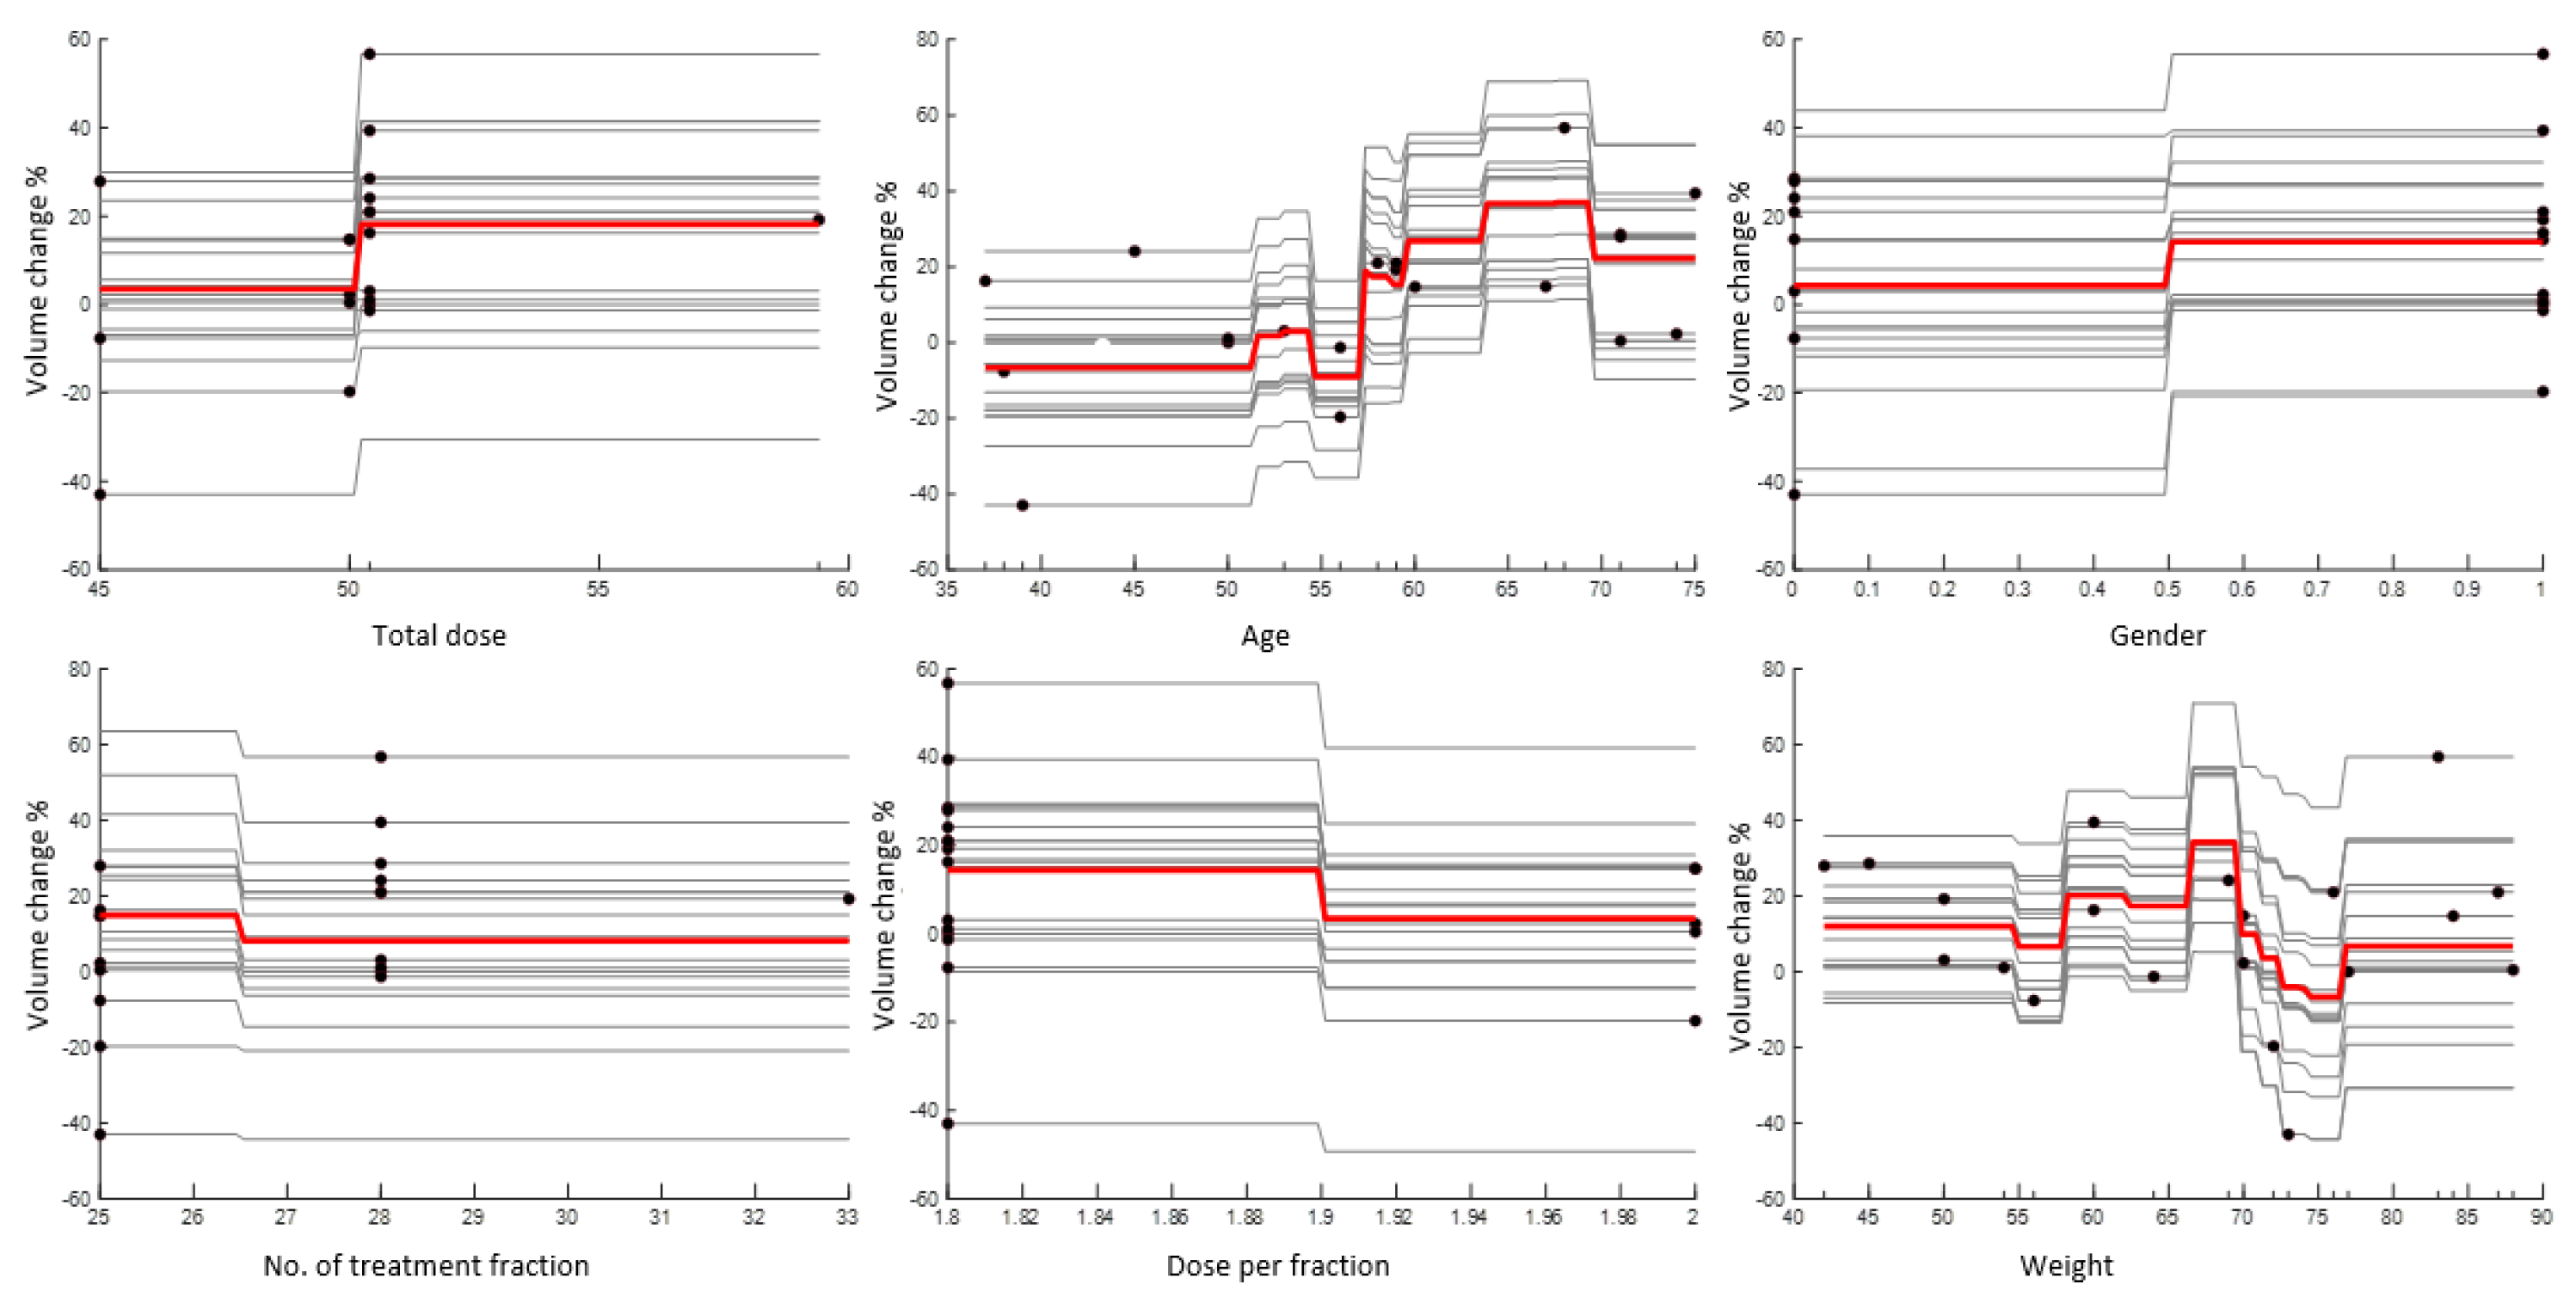
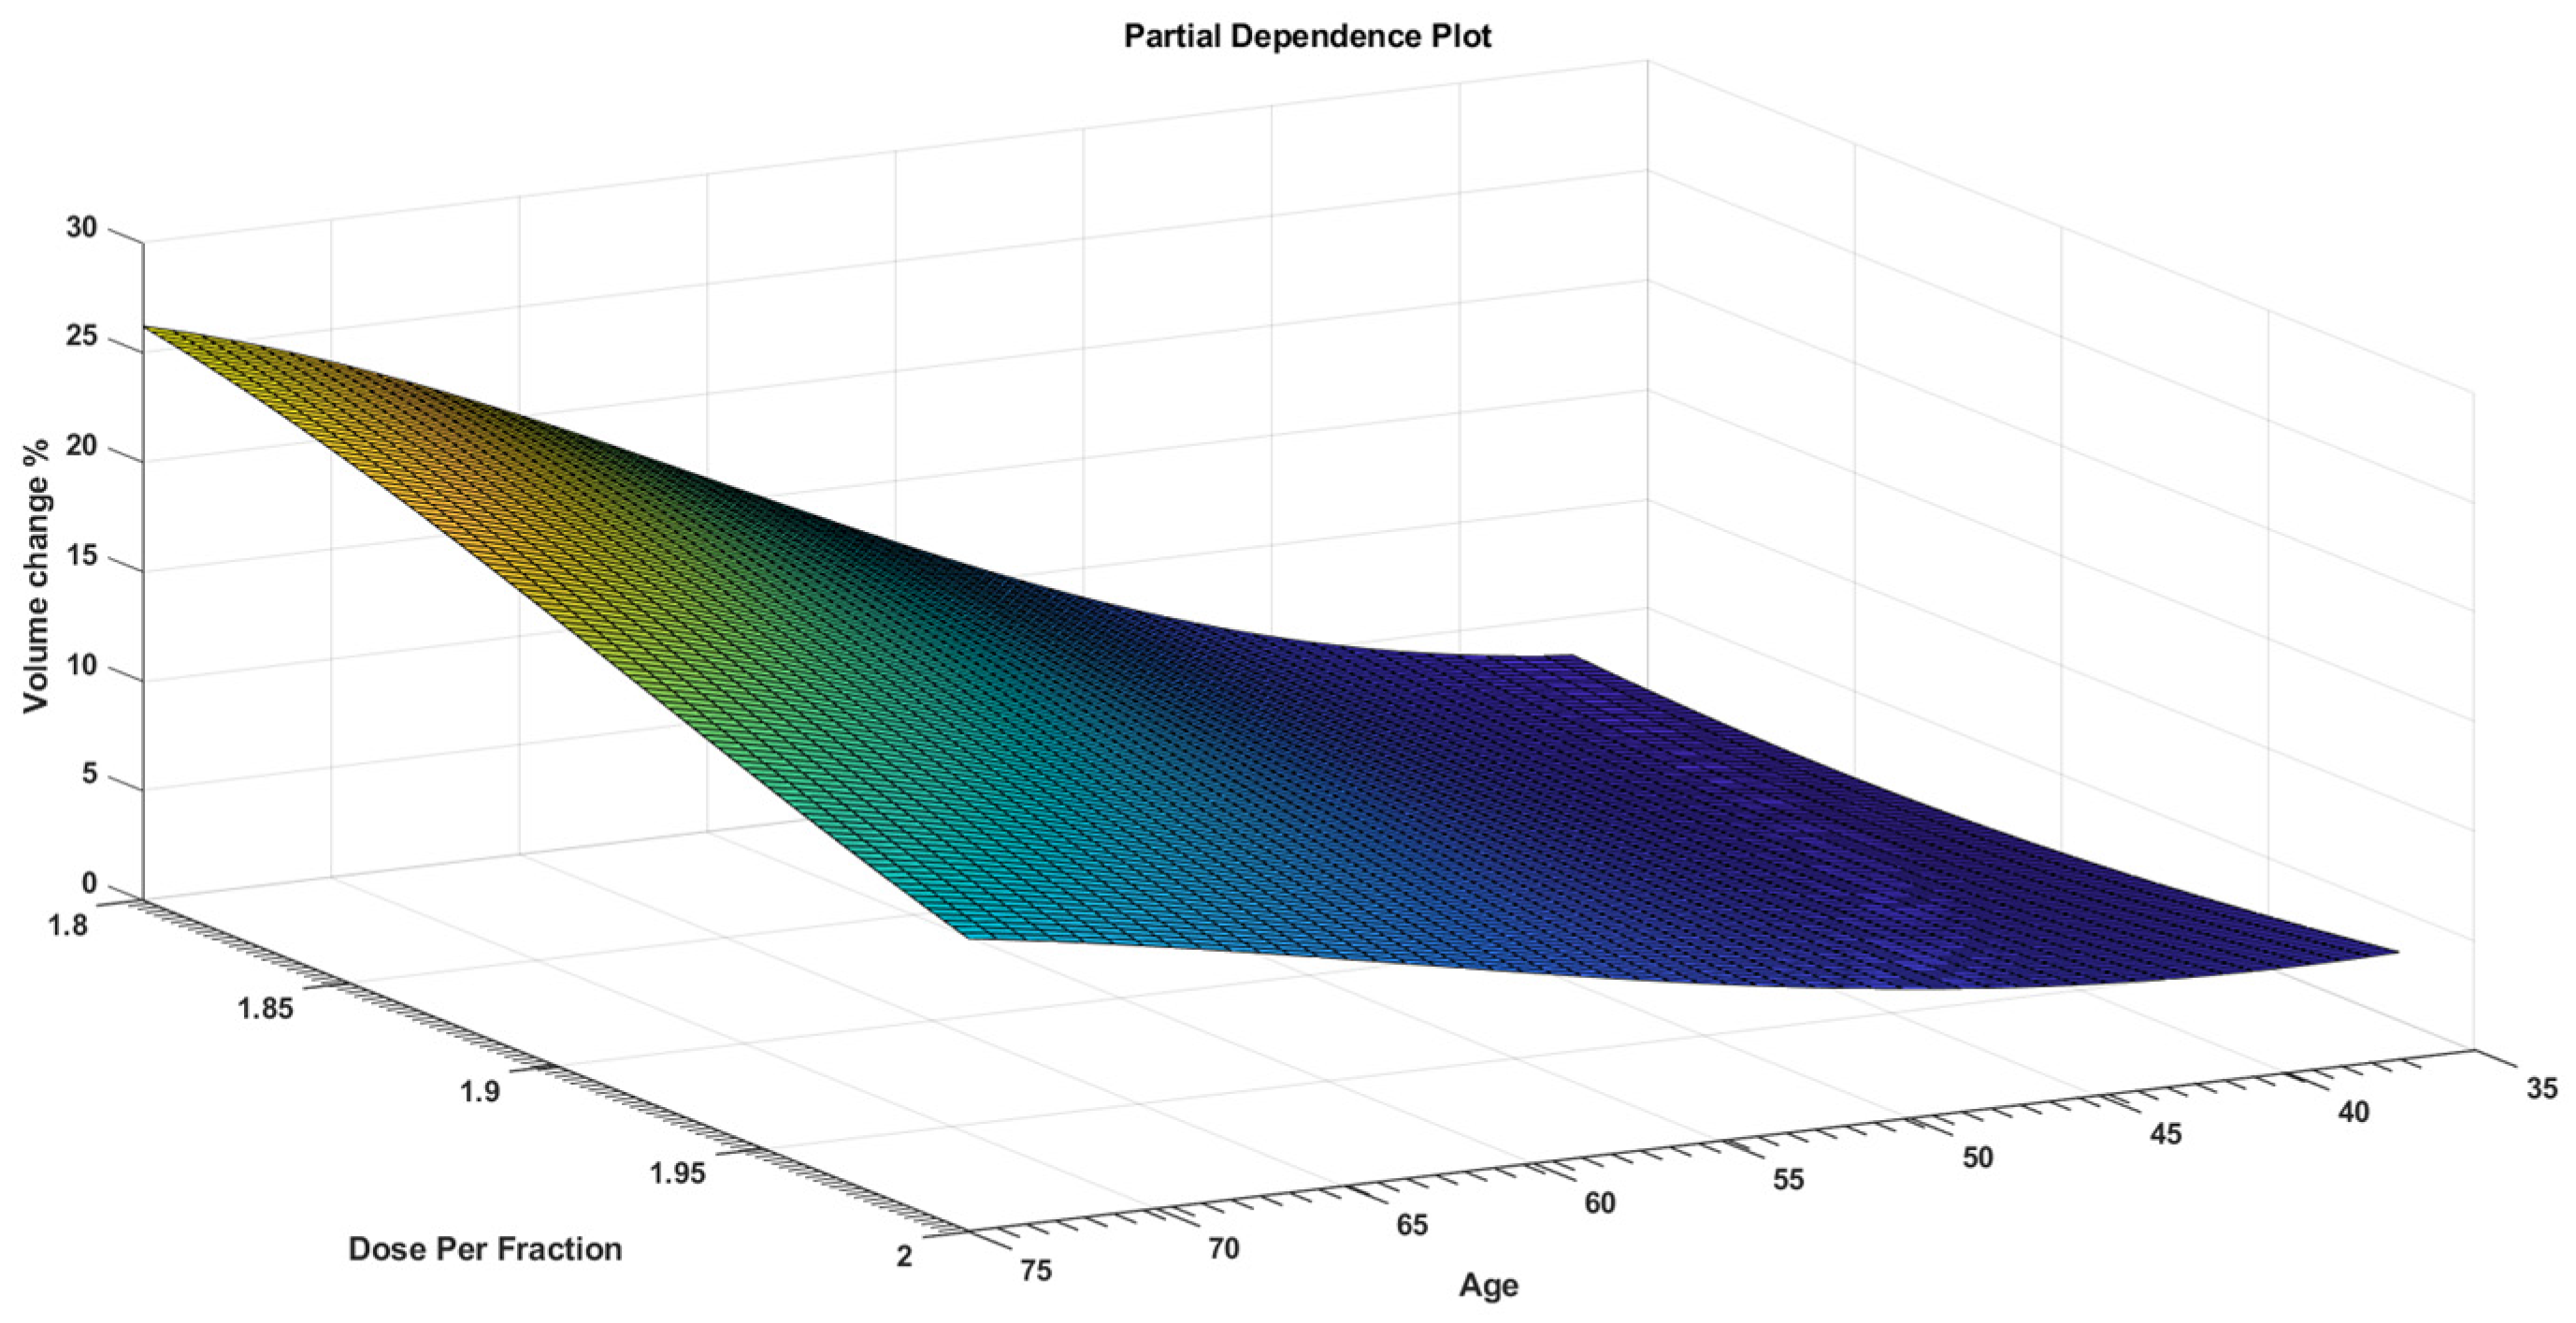
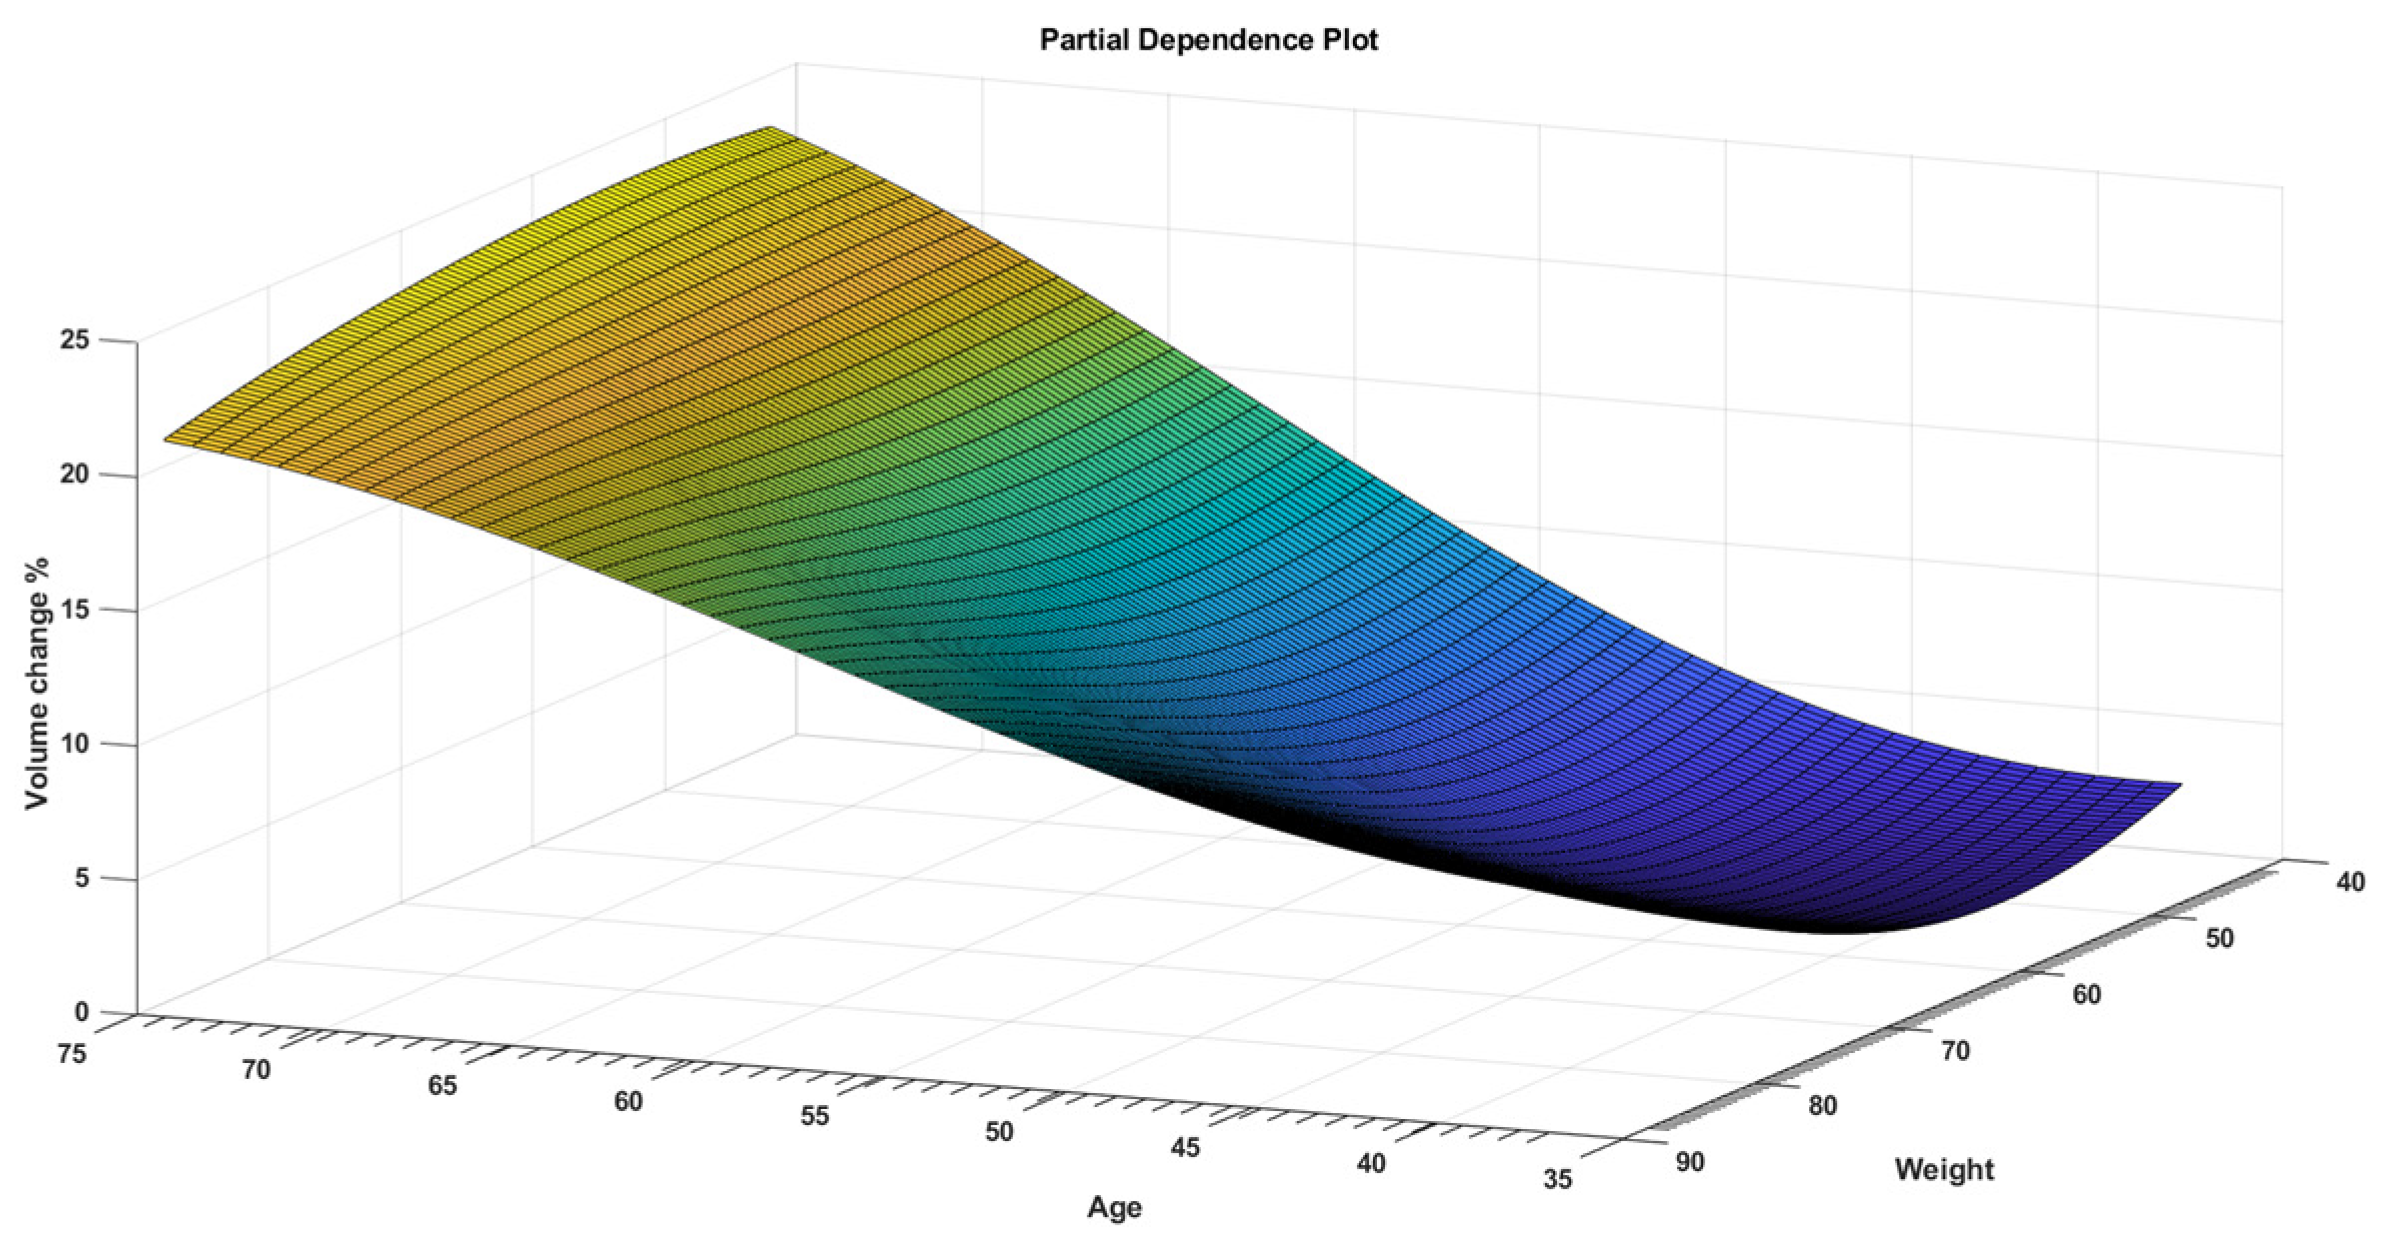
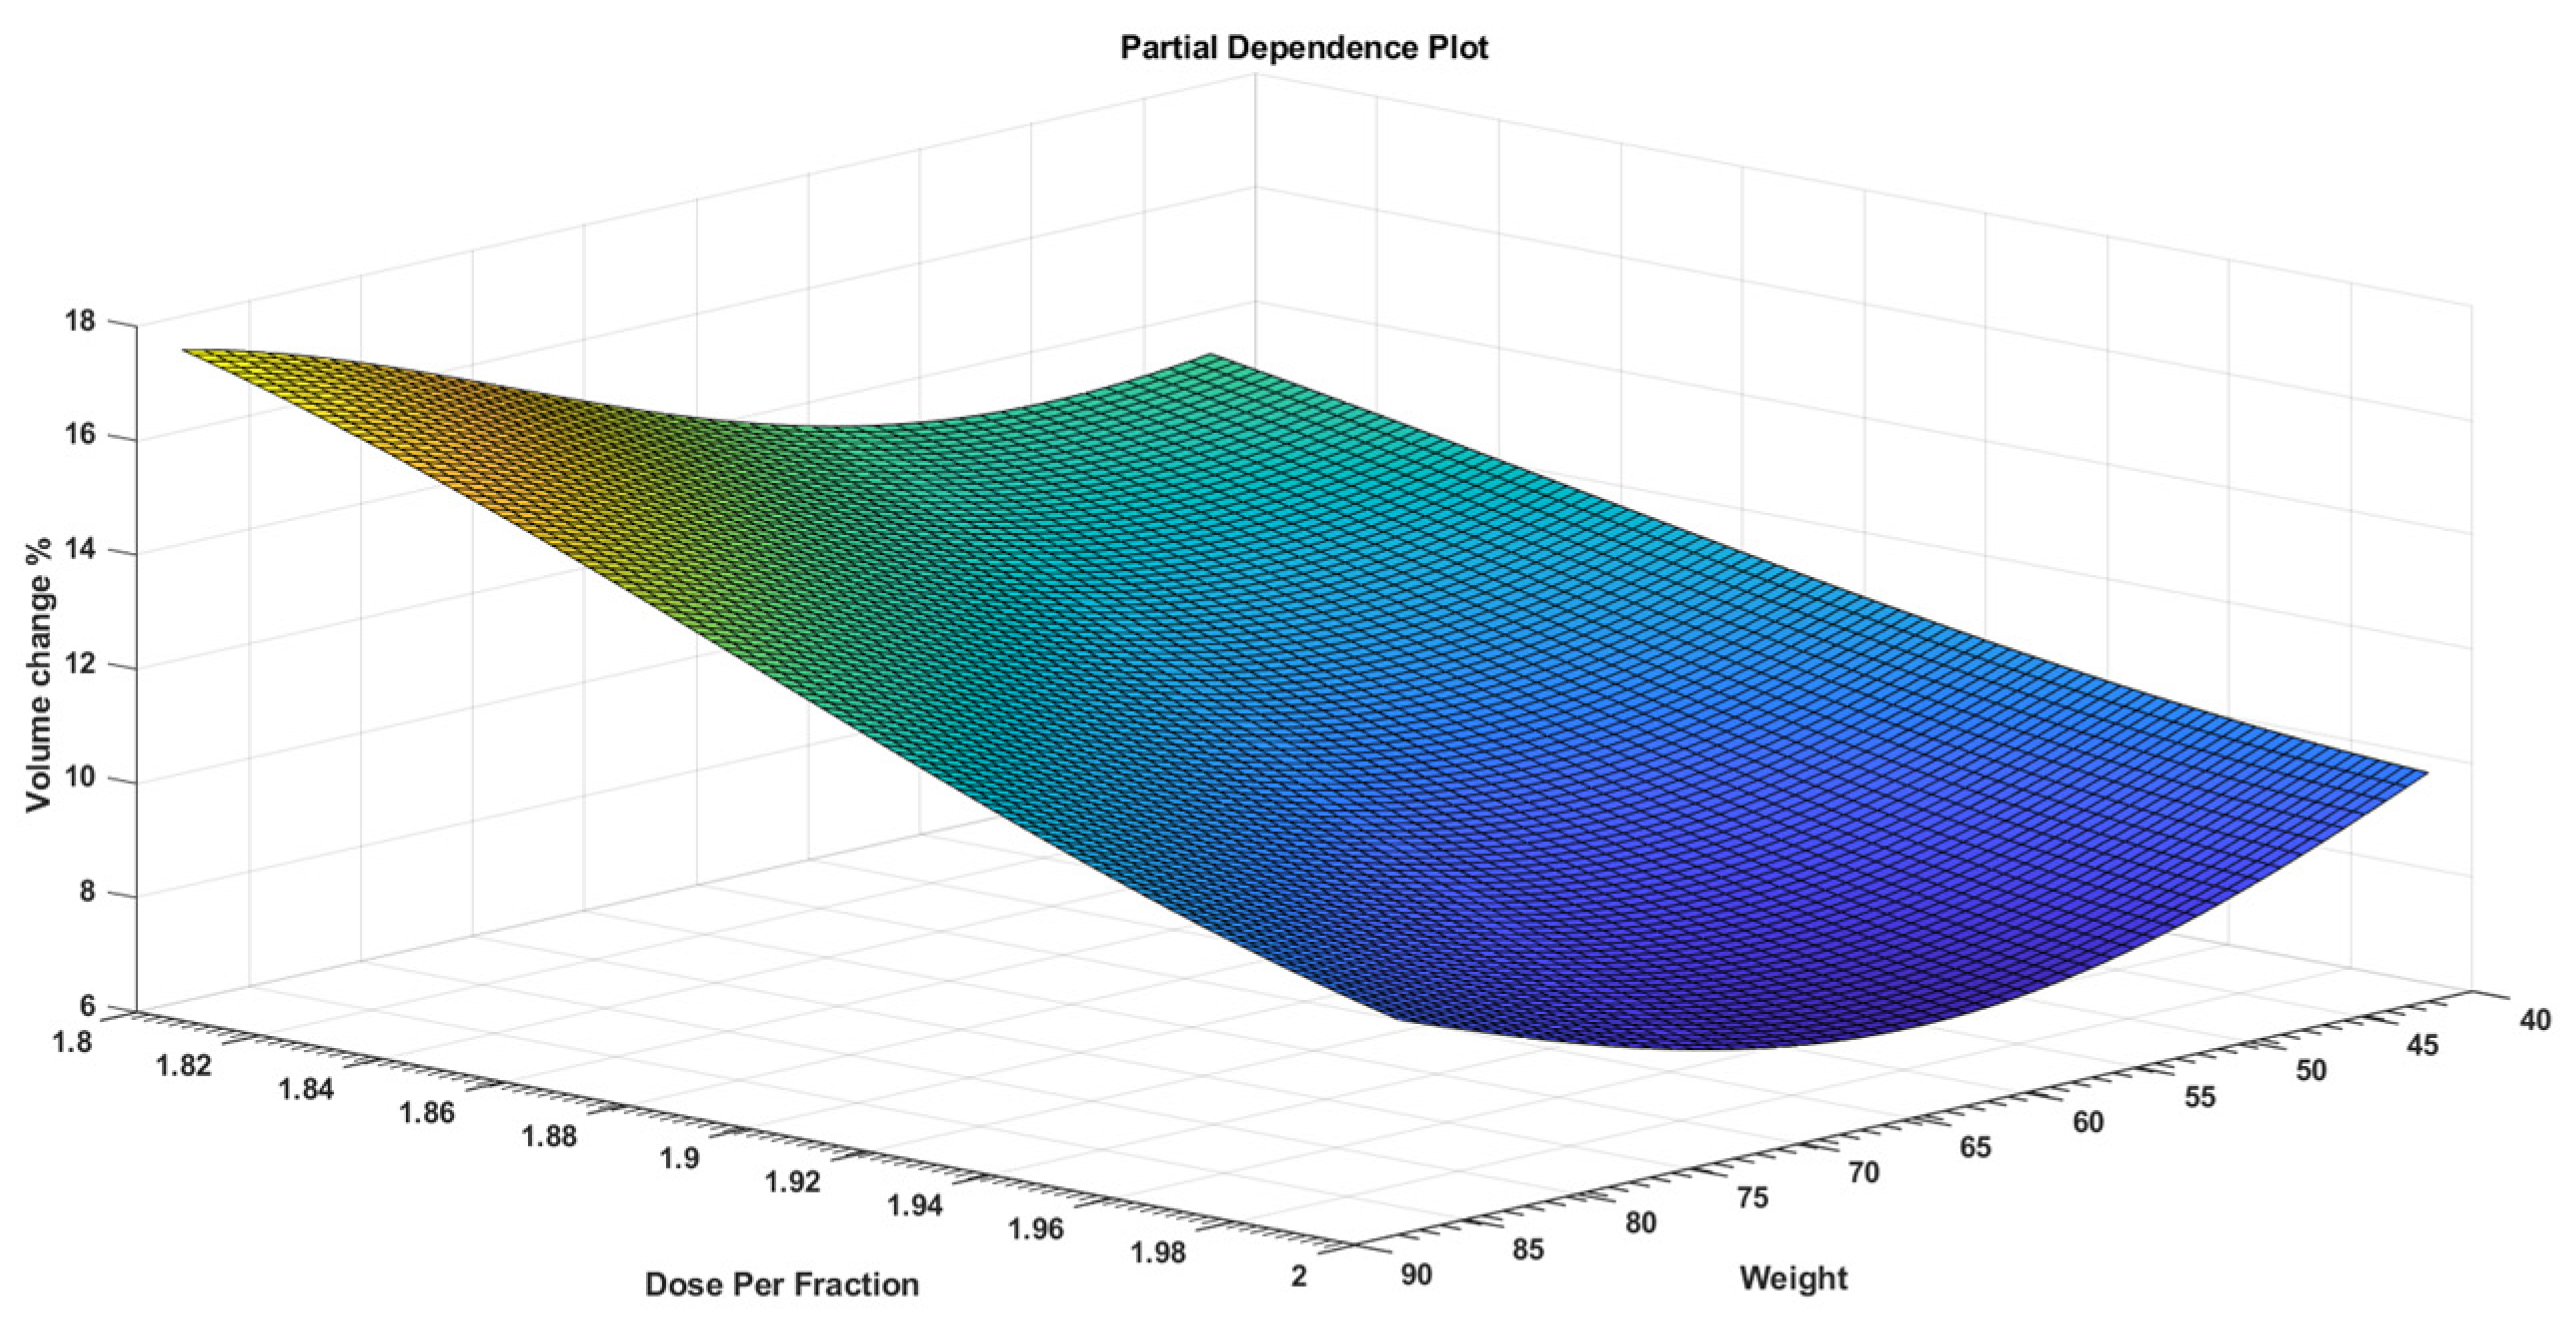
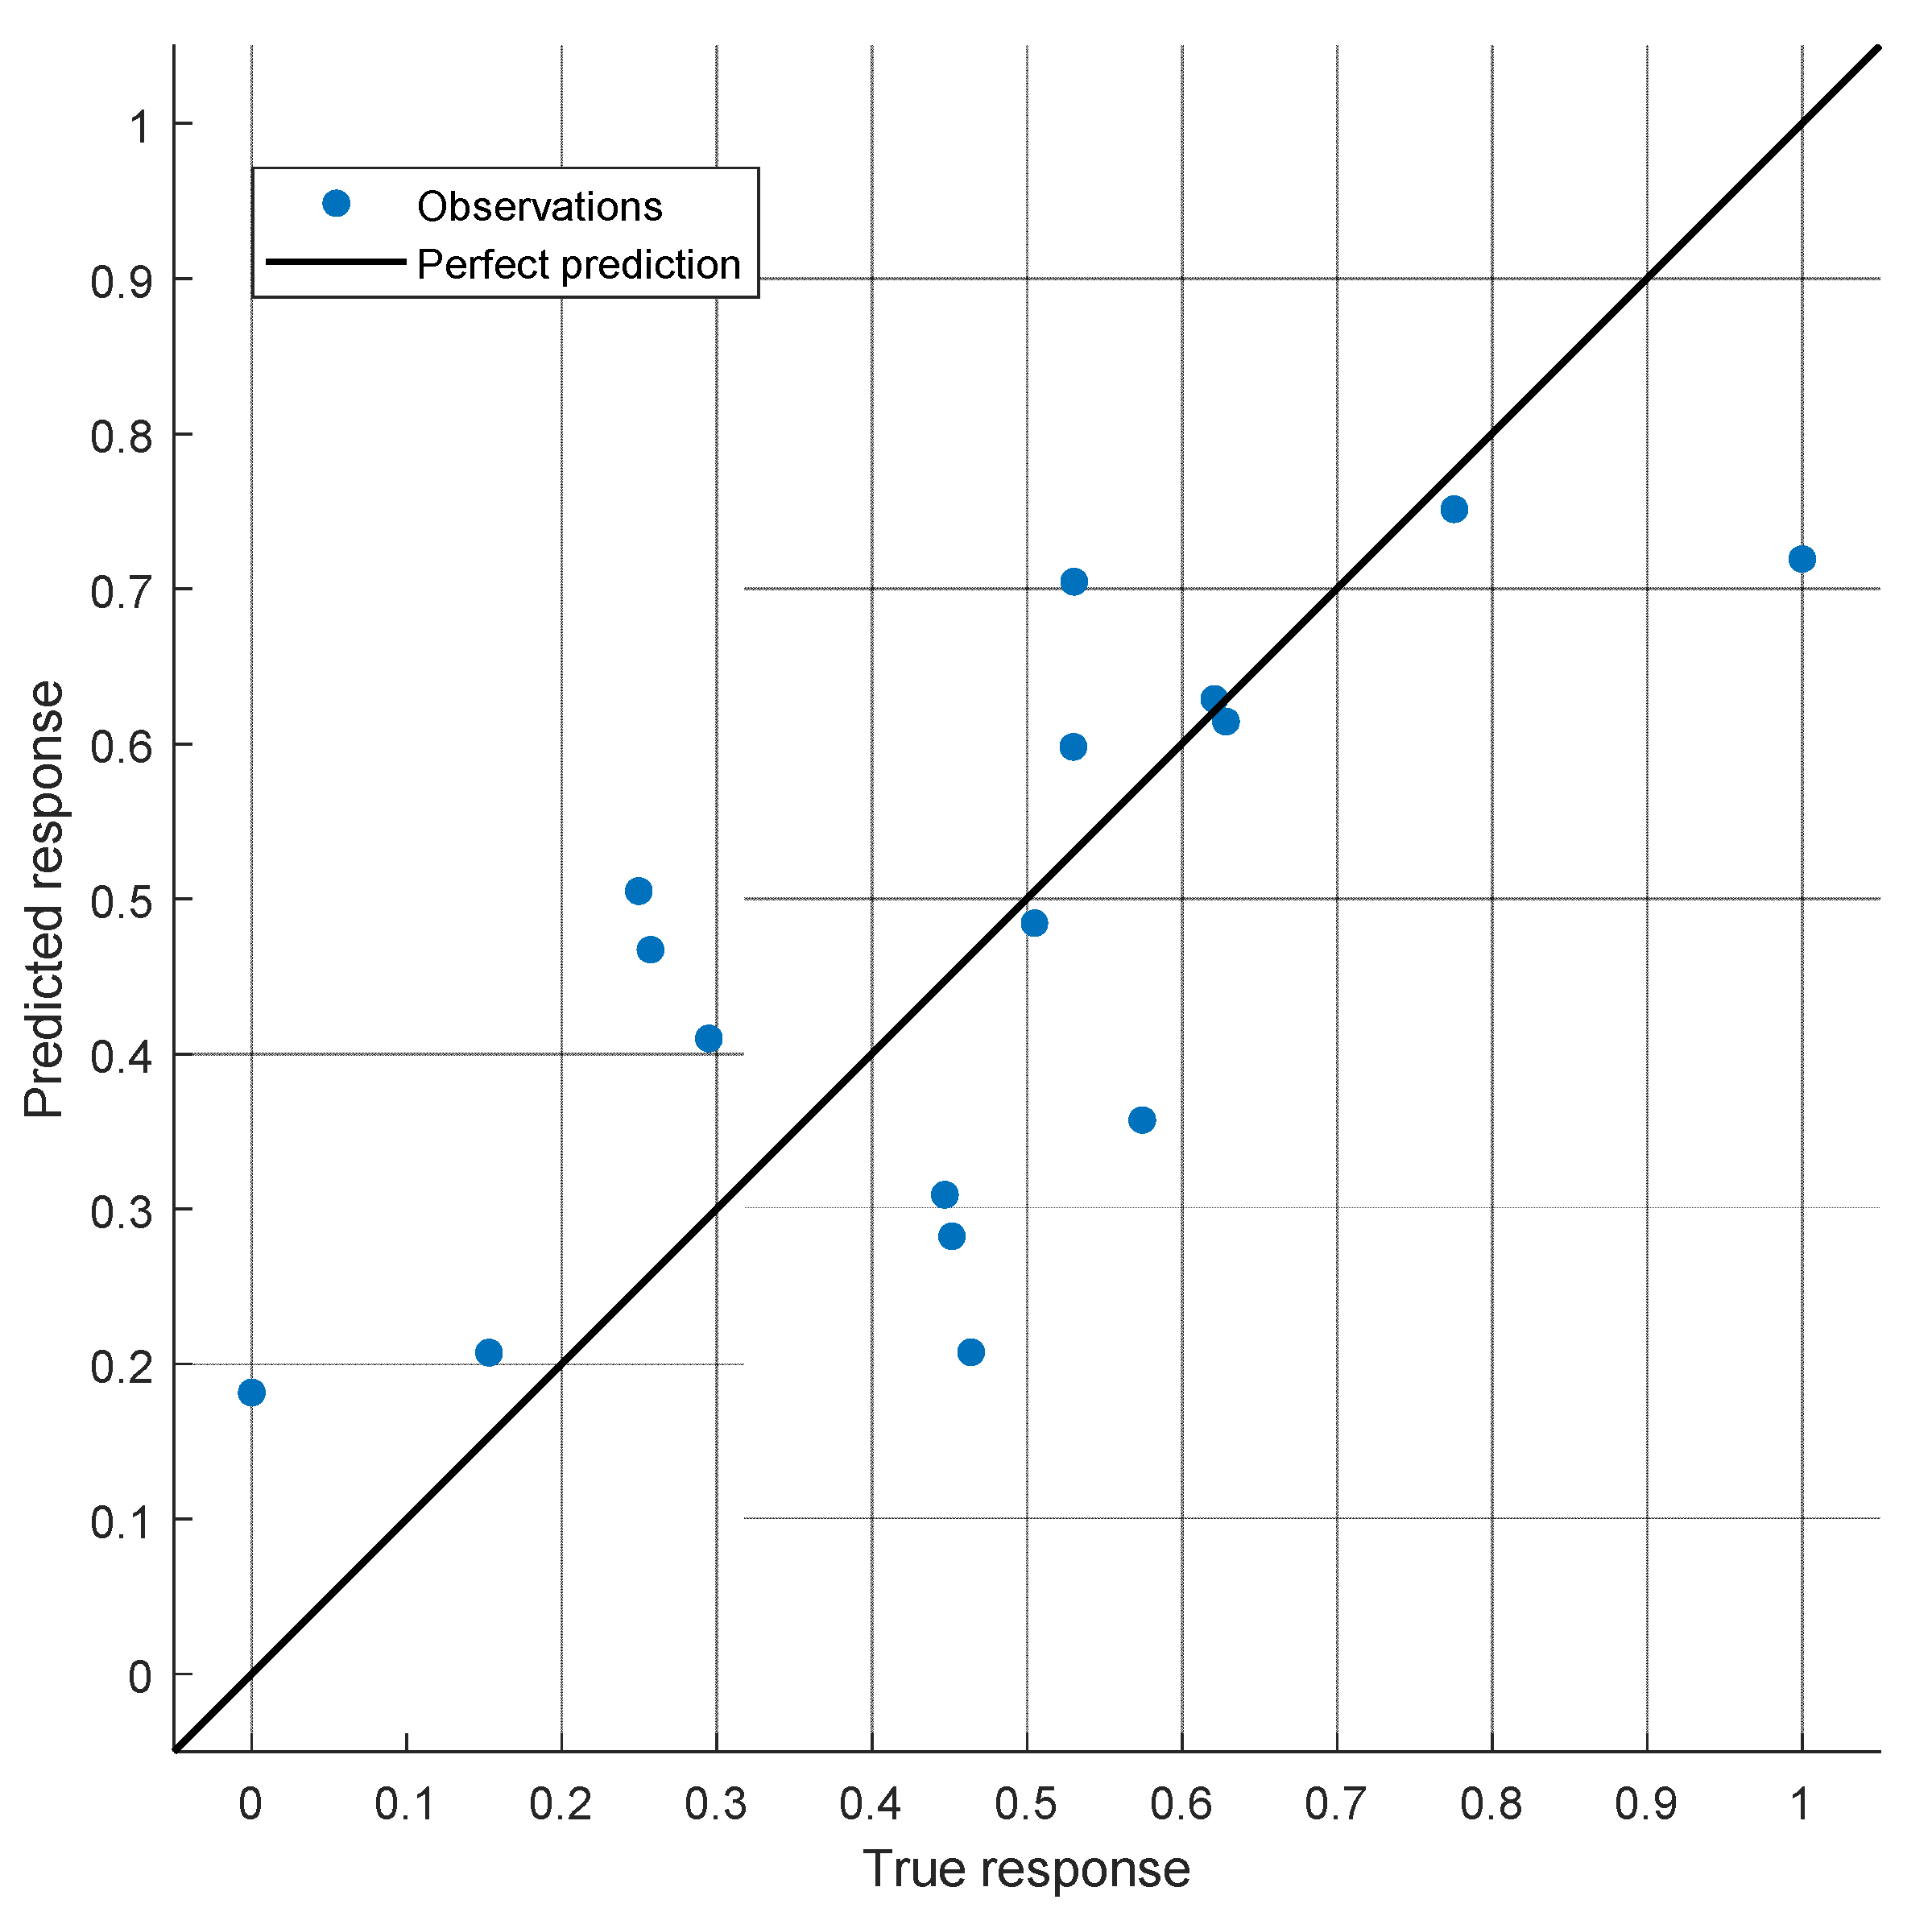
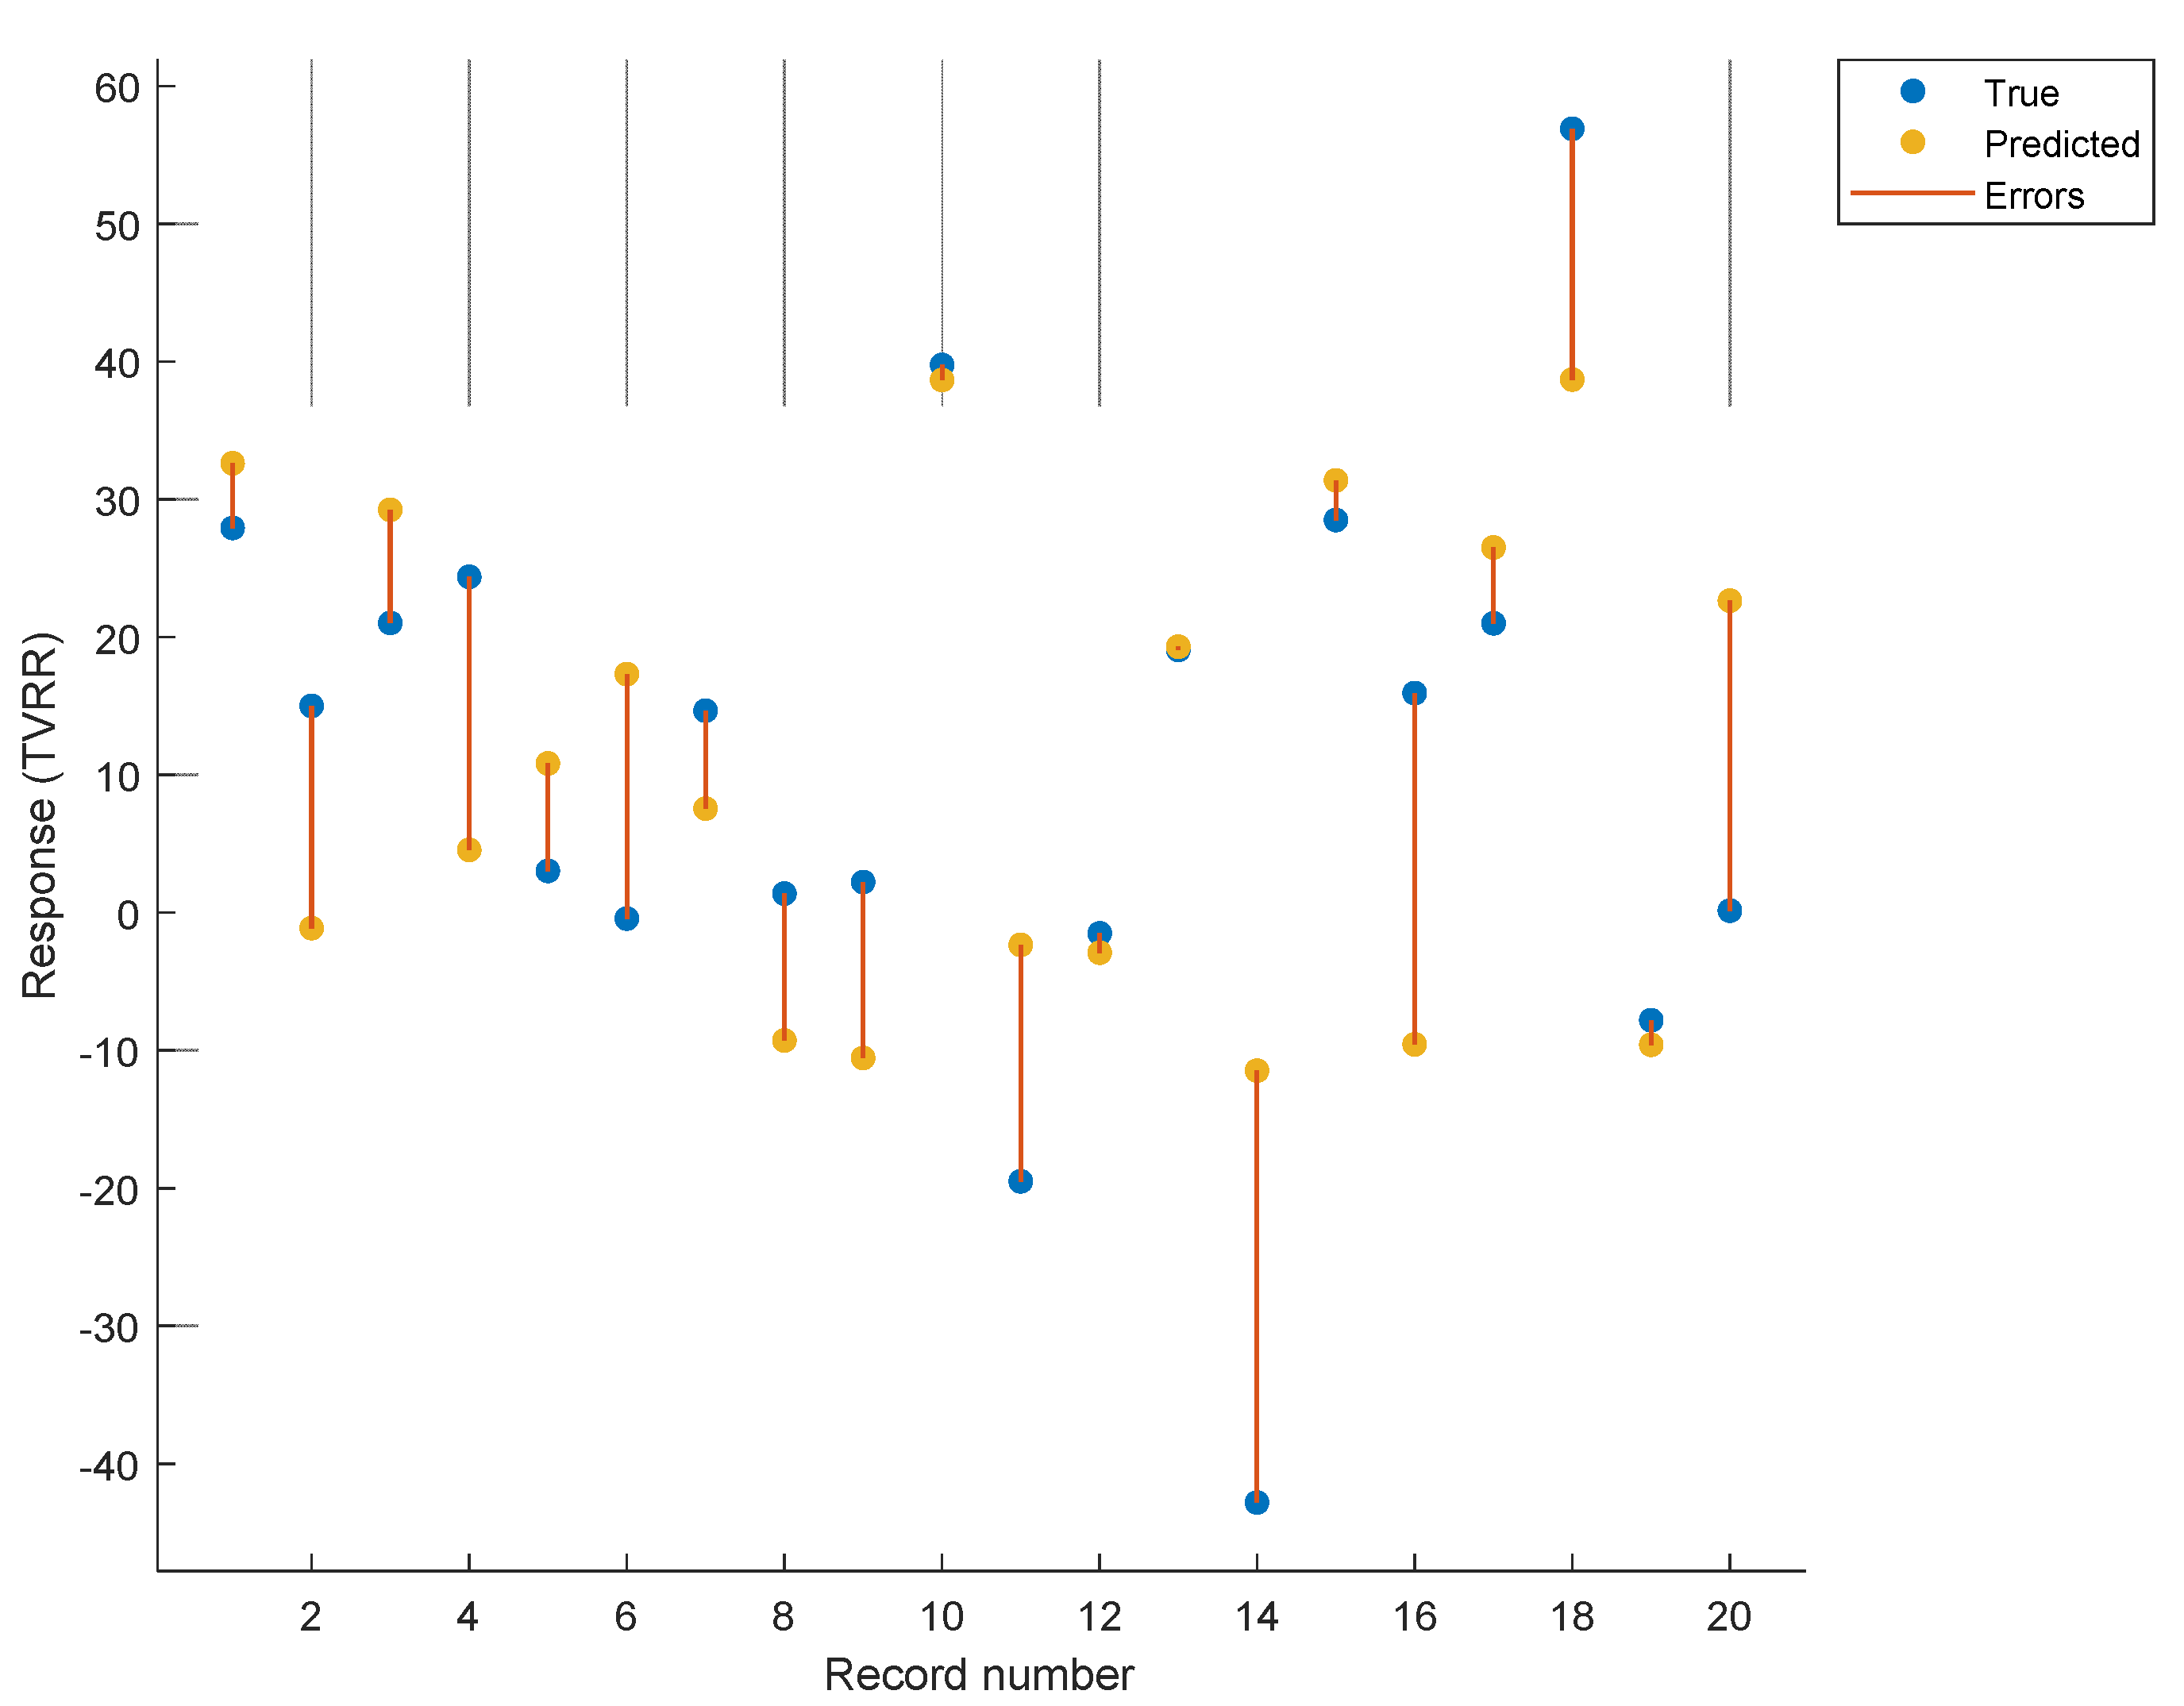
3. Results
4. Discussion
5. Conclusions
Author Contributions
Funding
Institutional Review Board Statement
Informed Consent Statement
Data Availability Statement
Conflicts of Interest
References
- Baskar, R.; Lee, K.A.; Yeo, R.; Yeoh, K.-W. Cancer and Radiation Therapy: Current Advances and Future Directions. Int. J. Med. Sci. 2012, 9, 193–199. [Google Scholar] [CrossRef] [PubMed] [Green Version]
- Khoo, V.S. Radiotherapeutic techniques for prostate cancer, dose escalation and brachytherapy. Clin. Oncol. 2005, 17, 560–571. [Google Scholar] [CrossRef]
- Teoh, M.; Clark, C.H.; Wood, K.; Whitaker, S.; Nisbet, A. Volumetric modulated arc therapy: A review of current literature and clinical use in practice. Br. J. Radiol. 2011, 84, 967–996. [Google Scholar] [CrossRef] [PubMed]
- Hussein, M.; Heijmen, B.J.M.; Verellen, D.; Nisbet, A. Automation in intensity modulated radiotherapy treatment planning-a review of recent innovations. Br. J. Radiol. 2018, 91. [Google Scholar] [CrossRef] [PubMed]
- Nwankwo, O.; Mekdash, H.; Sihono, D.S.K.; Wenz, F.; Glatting, G. Knowledge-based radiation therapy (KBRT) treatment planning versus planning by experts: Validation of a KBRT algorithm for prostate cancer treatment planning. Radiat. Oncol. 2015, 10, 111. [Google Scholar] [CrossRef] [Green Version]
- Siddique, S.; Chow, J.C.L. Artificial intelligence in radiotherapy. Rep. Pract. Oncol. Radiother. 2020, 25, 656–666. [Google Scholar] [CrossRef]
- DJarrett, D.; Stride, E.; Vallis, K.; Gooding, M.J. Applications and limitations of machine learning in radiation oncology. Br. J. Radiol. 2019, 92. [Google Scholar] [CrossRef]
- El Naqa, I.; Ruan, D.; Valdes, G.; Dekker, A.; McNutt, T.; Ge, Y.; Wu, Q.J.; Oh, J.H.; Thor, M.; Smith, W.; et al. Machine learning and modeling: Data, validation, communication challenges. Med. Phys. 2018, 45, e834–e840. [Google Scholar] [CrossRef] [PubMed] [Green Version]
- Feng, M.; Valdes, G.; Dixit, N.; Solberg, T.D. Machine Learning in Radiation Oncology: Opportunities, Requirements, and Needs. Front. Oncol. 2018, 8, 110. [Google Scholar] [CrossRef]
- Lustberg, T.; van Soest, J.; Jochems, A.; Deist, T.; van Wijk, Y.; Walsh, S.; Lambin, P.; Dekker, A. Big Data in radiation therapy: Challenges and opportunities. Br. J. Radiol. 2017, 90. [Google Scholar] [CrossRef]
- Huynh, E.; Hosny, A.; Guthier, C.; Bitterman, D.S.; Petit, S.F.; Haas-Kogan, D.A.; Kann, B.; Aerts, H.J.; Mak, R.H. Artificial intelligence in radiation oncology. Nat. Rev. Clin. Oncol. 2020, 17, 771–781. [Google Scholar] [CrossRef]
- Chan, Y.K.; Chen, Y.F.; Pham, T.; Chang, W.; Hsieh, M.Y. Artificial Intelligence in Medical Applications. J. Healthc. Eng. 2018, 2018. [Google Scholar] [CrossRef] [PubMed]
- Wang, C.; Zhu, X.; Hong, J.-C.; Zheng, D. Artificial Intelligence in Radiotherapy Treatment Planning: Present and Future. Technol. Cancer Res. Treat. 2019, 18, 153303381987392. [Google Scholar] [CrossRef] [PubMed]
- van de Bunt, L.; van der Heide, U.A.; Ketelaars, M.; de Kort, G.A.P.; Jürgenliemk-Schulz, I.M. Conventional, conformal, and intensity-modulated radiation therapy treatment planning of external beam radiotherapy for cervical cancer: The impact of tumor regression. Int. J. Radiat. Oncol. Biol. Phys. 2006, 64, 189–196. [Google Scholar] [CrossRef]
- Miras, H.; Jiménez, R.; Perales, Á.; Terrón, J.A.; Bertolet, A.; Ortiz, A.; Macías, J. Monte Carlo verification of radiotherapy treatments with CloudMC. Radiat. Oncol. 2018, 13, 99. [Google Scholar] [CrossRef] [PubMed] [Green Version]
- Liesbeth, V.; Michaël, C.; Anna, M.D.; Charlotte, L.B.; Wouter, C.; Dirk, V. Overview of artificial intelligence-based applications in radiotherapy: Recommendations for implementation and quality assurance. Radiother. Oncol. 2020, 153, 55–66. [Google Scholar] [CrossRef]
- Brouwer, C.L.; Steenbakkers, R.J.H.M.; Langendijk, J.A.; Sijtsema, N.M. Identifying patients who may benefit from adaptive radiotherapy: Does the literature on anatomic and dosimetric changes in head and neck organs at risk during radiotherapy provide information to help? Radiother. Oncol. 2015, 115, 285–294. [Google Scholar] [CrossRef] [Green Version]
- LEE, V.S.-C.; SchettIno, G.; Nisbet, A. UK adaptive radiotherapy practices for head and neck cancer patients. BJROpen 2020, 2, 20200051. [Google Scholar] [CrossRef] [PubMed]
- Humbert-Vidan, L.; Patel, V.; Oksuz, I.; King, A.P.; Guerrero Urbano, T. Comparison of machine learning methods for prediction of osteoradionecrosis incidence in patients with head and neck cancer. Br. J. Radiol. 2021, 94, 20200026. [Google Scholar] [CrossRef]
- Eisenhauer, E.A.; Therasse, P.; Bogaerts, J.; Schwartz, L.H.; Sargent, D.; Ford, R.; Dancey, J.; Arbuck, S.; Gwyther, S.; Mooney, M.; et al. New response evaluation criteria in solid tumours: Revised RECIST guideline (version 1.1). Eur. J. Cancer 2009, 45, 228–247. [Google Scholar] [CrossRef] [PubMed]
- Zhang, S.-X.; Gao, J.; Buchholz, T.A.; Wang, Z.; Salehpour, M.R.; Drezek, R.A.; Yu, T.-K. Quantifying tumor-selective radiation dose enhancements using gold nanoparticles: A monte carlo simulation study. Biomed. Microdevices 2009, 11, 925–933. [Google Scholar] [CrossRef] [PubMed]
- Tariq, I.; Humbert-Vidan, L.; Chen, T.; South, C.P.; Ezhil, V.; Kirkby, N.F.; Jena, R.; Nisbet, A. Mathematical modelling of tumour volume dynamics in response to stereotactic ablative radiotherapy for non-small cell lung cancer. Phys. Med. Biol. 2015, 60, 3695–3713. [Google Scholar] [CrossRef] [PubMed]

| Patient | GTV (cm3) | CBCT Week 1 (cm3) | CBCT Week 2 (cm3) | CBCT Week 3 (cm3) | CBCT Week 4 (cm3) | CBCT Week 5 (cm3) | Total Dose Gy | Patient Age (Years) | Patient Gender | No. of Treatment Fractions | Dose per Fraction (Gy) | Patient Weight (Kg) |
|---|---|---|---|---|---|---|---|---|---|---|---|---|
| Patient 1 | 89.9 | 87.07 | 74.97 | 49.35 | 55.3 | 64.79 | 50 | 71 | Female | 28 | 1.8 | 45 |
| Patient 2 | 47.6 | 48.62 | 39.39 | 40.37 | 40.65 | 40.46 | 50 | 60 | Male | 25 | 2 | 84 |
| Patient 3 | 57.21 | 51.498 | 43.099 | 40.199 | 40.698 | 45.188 | 50 | 58 | Female | 28 | 1.8 | 87 |
| Patient 4 | 41.42 | 34.157 | 37.807 | 35.105 | 35.437 | 31.321 | 50 | 45 | Female | 28 | 1.8 | 69 |
| Patient 5 | 90.66 | 89.871 | 93.785 | 92.89 | 90.643 | 87.908 | 50 | 53 | Female | 28 | 1.8 | 50 |
| Patient 6 | 227 | 223.9 | 225.35 | 224.77 | 228.54 | 227.98 | 50 | 50 | Male | 28 | 1.8 | 77 |
| Patient 7 | 40.86 | 36.986 | 38.564 | 37.654 | 39.876 | 34.874 | 50 | 67 | Female | 25 | 2 | 70 |
| Patient 8 | 68.03 | 61.985 | 63.986 | 64.963 | 67.734 | 67.097 | 50 | 50 | Male | 28 | 1.8 | - |
| Patient 9 | 105 | 102.95 | 101.79 | 104.88 | 106.78 | 102.65 | 50 | 74 | Male | 25 | 2 | - |
| Patient 10 | 51.86 | 35.482 | 36.725 | 38.125 | 40.228 | 31.245 | 50 | 75 | Male | 28 | 1.8 | 60 |
| Patient 11 | 32.06 | 46.151 | 33.645 | 37.559 | 44.052 | 38.312 | 50 | 56 | Male | 25 | 2 | 72 |
| Patient 12 | 47.45 | 38.38 | 42.522 | 45.725 | 41.711 | 48.162 | 50 | 56 | Male | 28 | 1.8 | - |
| Patient 13 | 35.9 | 34.486 | 32.686 | 33.512 | 28.759 | 29.051 | 59 | 59 | Male | 33 | 1.8 | 50 |
| Patient 14 | 67.48 | 86.735 | 82.028 | 103 | 96.808 | 96.375 | 45 | 39 | Female | 25 | 1.8 | - |
| Patient 15 | 89.92 | 78.076 | 74.978 | 68.008 | 65.305 | 64.289 | 45 | 71 | Female | 25 | 1.8 | 42 |
| Patient 16 | 68.87 | 67.142 | 57.852 | 88.589 | 57.852 | 57.895 | 50 | 37 | Male | 25 | 1.8 | 60 |
| Patient 17 | 64.85 | 63.481 | 53.649 | 61.882 | 54.191 | 51.232 | 50 | 59 | Male | 28 | 1.8 | 76 |
| Patient 18 | 74.34 | 69.04 | 42.188 | 43.357 | 29.12 | 32.043 | 50 | 68 | Male | 28 | 1.8 | 83 |
| Patient 19 | 56.46 | 61.975 | 59.67 | 55.891 | 58.569 | 60.864 | 45 | 38 | Female | 25 | 1.8 | 56 |
| Patient 20 | 74.98 | 80.324 | 78.983 | 77.973 | 73.848 | 74.868 | 50 | 71 | Male | 25 | 2 | 88 |
| Patient | Total Dose Gy | Age (Years) | Gender | No. of Treatment Fractions | Dose per Fraction (Gy) | Weight (kg) | Volume Change % |
|---|---|---|---|---|---|---|---|
| Patient 1 | 50.4 | 71 | Female | 28 | 1.8 | 45 | 27.93 |
| Patient 2 | 50 | 60 | Male | 25 | 2 | 84 | 15 |
| Patient 3 | 50.4 | 58 | Female | 28 | 1.8 | 87 | 21.02 |
| Patient 4 | 50.4 | 45 | Female | 28 | 1.8 | 69 | 24.38 |
| Patient 5 | 50.4 | 53 | Female | 28 | 1.8 | 50 | 3.03 |
| Patient 6 | 50.4 | 50 | Male | 28 | 1.8 | 77 | −0.43 |
| Patient 7 | 50 | 67 | Female | 25 | 2 | 70 | 14.65 |
| Patient 8 | 50.4 | 50 | Male | 28 | 1.8 | - | 1.37 |
| Patient 9 | 50 | 74 | Male | 25 | 2 | - | 2.23 |
| Patient 10 | 50.4 | 75 | Male | 28 | 1.8 | 60 | 39.75 |
| Patient 11 | 50 | 56 | Male | 25 | 2 | 72 | −19.5 |
| Patient 12 | 50.4 | 56 | Male | 28 | 1.8 | - | −1.51 |
| Patient 13 | 59.4 | 59 | Male | 33 | 1.8 | 50 | 19.07 |
| Patient 14 | 45 | 39 | Female | 25 | 1.8 | - | −42.81 |
| Patient 15 | 45 | 71 | Female | 25 | 1.8 | 42 | 28.5 |
| Patient 16 | 50.4 | 37 | Male | 25 | 1.8 | 60 | 15.94 |
| Patient 17 | 50.4 | 59 | Male | 28 | 1.8 | 76 | 20.99 |
| Patient 18 | 50.4 | 68 | Male | 28 | 1.8 | 83 | 56.9 |
| Patient 19 | 45 | 38 | Female | 25 | 1.8 | 56 | −7.81 |
| Patient 20 | 50 | 71 | Male | 25 | 2 | 88 | 0.15 |
| Iteration 1 | Iteration 2 | Iteration 3 | ||||
|---|---|---|---|---|---|---|
| Patients’ clinical variables | p Value | p Value | ||||
| Total Dose | 0.169 | Total Dose + Age | 0.282 | Total Dose + Age + Dose Per Fraction | 0.182 | |
| Age | 0.018 | |||||
| Gender | 0.704 | Gender + Age | 0.985 | Gender + Age + Dose Per Fraction | 0.485 | |
| No. of Treatment Fractions is | 0.106 | No. of Treatment Fractions + Age | 0.089 | No. of Treatment Fractions + Age + Dose Per Fraction | 0.079 | |
| Dose Per Fraction | 0.326 | Dose Per Fraction + Age | 0.016 | |||
| Weight | 0.055 | Weight + Age | 0.064 | Weight + Age + Dose Per Fraction | 0.002 | |
| Estimate | SE | tStat | p Value | |
|---|---|---|---|---|
| (Intercept) | 180.5 | 64.253 | 2.8092 | 0.0126 |
| Age | 1.2172 | 0.27207 | 4.4737 | 0.000384 |
| Dose Per Fraction | −138.86 | 37.271 | −3.7256 | 0.00184 |
| Weight | 0.31647 | 0.10096 | 3.1345 | 0.006399 |
Publisher’s Note: MDPI stays neutral with regard to jurisdictional claims in published maps and institutional affiliations. |
© 2022 by the authors. Licensee MDPI, Basel, Switzerland. This article is an open access article distributed under the terms and conditions of the Creative Commons Attribution (CC BY) license (https://creativecommons.org/licenses/by/4.0/).
Share and Cite
Alnowami, M.; Abolaban, F.; Hijazi, H.; Nisbet, A. Regression Analysis of Rectal Cancer and Possible Application of Artificial Intelligence (AI) Utilization in Radiotherapy. Appl. Sci. 2022, 12, 725. https://doi.org/10.3390/app12020725
Alnowami M, Abolaban F, Hijazi H, Nisbet A. Regression Analysis of Rectal Cancer and Possible Application of Artificial Intelligence (AI) Utilization in Radiotherapy. Applied Sciences. 2022; 12(2):725. https://doi.org/10.3390/app12020725
Chicago/Turabian StyleAlnowami, Majdi, Fouad Abolaban, Hussam Hijazi, and Andrew Nisbet. 2022. "Regression Analysis of Rectal Cancer and Possible Application of Artificial Intelligence (AI) Utilization in Radiotherapy" Applied Sciences 12, no. 2: 725. https://doi.org/10.3390/app12020725