Article

Design and Simulation of a Digital Twin Mobility Concept: An Electric Aviation System Dynamics Case Study with Capacity Constraints

by
Philipp Winkler
1,
Sergio Gallego-García
2,* and
Marcel Groten
3
1
Head of Production Planning and Control, Lilium GmbH, 82234 Wessling, Germany
2
Industrial Engineering Technologies of the International School of Doctorate, National Distance Education University (UNED), 28040 Madrid, Spain
3
Project Portfolio and Production Management, Bayer AG, Pharmaceuticals, 51373 Leverkusen, Germany
*
Author to whom correspondence should be addressed.
Appl. Sci. 2022, 12(2), 848; https://doi.org/10.3390/app12020848
Submission received: 24 November 2021 / Revised: 29 December 2021 / Accepted: 11 January 2022 / Published: 14 January 2022

Abstract

:

Featured Application

Management model for air mobility and Service-oriented On-Demand Air Mobility. Modeling method for aircraft units between different vertiports within a given region considering mobility needs, capacity constraints, maintenance and charging needs. Exemplary application in a simulation model for a regional area of fifteen vertiports and their interconnection by means of electric aircraft units.

Abstract

Vertical mobility, as a commercial service, has been considered for scheduled volume and long-distance mobility services. To overcome its limits and increase its potential coverage, flexibility, and adaptability, centralized mobility hubs, similar to airports, will need to be constructed. Within this context, a customized and on-demand air mobility concept providing high flexibility in location combinations and time schedules could provide a solution for regional mobility needs. The aim of this research was to provide a generic framework for various mobility schemes as well as to design a holistic air mobility management concept for electric vertical mobility. A system dynamics simulation case study applied the conceptual model for an on-demand air mobility network of electric aircraft in a regional area with capacity constraints including vertiports, aircraft, charging, and parking stations. Therefore, bottlenecks and delays were quantified using a digital twin tool for customized scenarios. Simulation results showed that optimized maintenance management and the redistribution of aircraft units improved service indicators such as the number of customers served, and customer wait times as well as a reduction in the amount of time an aircraft spent on the ground. As a result, a digital twin air mobility network model with simulation capabilities may be a key factor for future implementation.

1. Introduction

Transport systems, along with other infrastructure, are fundamental elements of societies and economies. They guarantee a high level of mobility, which is key for market cohesion and for quality of life. Moreover, transport systems enable socioeconomic development and job creation [1]. The vision to democratize air mobility access for the global population has been a long-held aspiration of the aeronautical community [2]. With the increasing rate of gross domestic products (GPDs) across many countries and the decreasing cost of flight fares, air travel has become affordable for most people [3]. However, in recent years, the world has faced an ongoing mobility challenge in local and national transportation, and any improvements in efficiency, reliability, safety, and accessibility could lead to positive impacts on economic development, quality of life, and the environment [2]. Air transport systems provide a service to their customers from an origin location to a destination; therefore, the flight is an intangible good [4]. The global commercial deregulation and liberalization of air transport, which began in the United States at the end of the 1970s, resulted in numerous changes including the evolution of price competition, the emergence of low-cost airlines, a growing load factor, airport and airspace capacity problems, etc. [5]. In this context, mergers, alliances, bankruptcies, shifts in market shares, and the rise of new carriers became norms of the industry [6]. As constraints on routes and the number of flights as well as regulated tariff policies were removed, prices fell dramatically, especially on popular routes [5].
The aviation industry has become essential for the socioeconomic development of many countries [7]. Shared mobility services provide users with more efficient travel options and reduced environmental impacts as a result of lower emissions. This trend has led to a research interest to explore the third dimension: the skyscape [8]. Moreover, the rise of highly populated urban areas together with an increase in travel demands has led to frequent traffic jumps all over the world, and increasing the ground capacity is not considered feasible in many cities. Therefore, the vision of opening the third dimension, i.e., altitude, for urban and regional transportation has gained momentum in the last 5–10 years to explore “on-demand” air mobility (ODAM) [9].
The COVID-19 pandemic has led to global governmental restrictions that reduce and limit mass transportation options. The air mobility sector has been impacted severely, with a 75% decrease in all commercial flight activity by mid-April 2020, as compared to 2019. Furthermore, 60% of global oil demand has been associated with mobility and aviation [10]. Therefore, in the global energy crisis and climate change, the aviation sector is a significant player [11]. Aviation currently accounts for 12% of transport-related CO2 emissions with a steadily increasing impact. In order to tackle this challenge, the European Commission and two U.S. government agencies, the International Air Transport Association (IATA) and the International Civil Aviation Organization (ICAO), formulated reduction targets such as a CO2 reduction per passenger kilometer, NOx, and perceived noise. Considering the increasing amount of air travel, these goals are unlikely to be reached by improving existing aviation technology [11]. Thus, the aviation industry needs to accelerate fleet renewal, improve non-fuel cost management, improve fleet operations, and encourage the development of alternative fuel sources [3]. Expectations for continued growth, despite the global pandemic and coupled with environmental and commercial pressures, have placed the aviation industry in a challenging position. This has led to a growing interest in the design and certification of electrically powered aircraft as they offer better efficiency and have zero emissions [7].
Within this context, the electric aircraft movement began in 2007 with the first electric aircraft symposium in San Francisco [12]. Engineering literature has also joined the trend. From 2006 to 2009, there was approximately one paper per year on electric and hybrid electric aircraft. From 2015 to the present, the volume has increased to nearly 20 papers per year [13]. The markets for aircraft, airlines, and airports are in a phase of major reconsideration, transition, and change. Moreover, a shift from international air over to national and intracontinental rail has started. As a result, electric aviation has sought to compete by adding new short-distance routes to the service offerings [14].
The economic case for electrification can be divided into two parts: first, the reduced operating costs on existing routes, as compared to conventional aircraft; and second, novel capabilities that may open new and lucrative markets [13]. The advantage of electric propulsion is energy cost [15]. Today, intercity air mobility is limited to subsidized routes, special regions such as island traffic, and the luxury segment of private jets [16]. Electrification may also provide operations that are not possible with conventional aircraft propulsion architectures. Electric vertical takeoff and landing (e-VTOL) concepts have been launched by numerous startup and mature firms worldwide [13]; dozens of companies have announced innovations employing e-VTOL [15]. However, many challenges remain in the operation management of electric aircraft. Gaps in capability are largely due to a lack of experience and historical data. In addition, designing for the future means accounting for the uncertainties of future technological advancements, including range and endurance [13].
Abstract representations of transport networks need to be developed. In practice, managers of transport infrastructure require indicators to monitor and improve the management of the locations and the service characteristics of their facilities. A wish-list of any manager would include the possibility to construct variants of any indicator for specific needs. The comparison of such changes requires a working model and involves exercises and issues that have not yet been addressed in the literature [17]. In addition, the accurate prediction of future maintenance issues associated with electric aircraft cannot be made without historical data and research [11]. As compared to gas-turbine-engine aircraft, all-electric aircraft have different operating costs, including several generations of potentially expensive batteries, and higher requirements for landing gear components due to their heavier weight. However, all-electric aircraft may also cut costs due to the relative mechanical simplicity of electric motors [18].
Within this context, the U.S. National Aeronautics and Space Administration (NASA) has developed a framework for the integration of urban air mobility airspace research with partners and stakeholders [8]. The adoption of ODAM was found to be dependent on travel distance, service fare, and level of accessibility. The market share for thin-haul ODAM services could be viable for distances over 100 km, with 60% of the market expected for distances between 200 and 400 km (i.e., intercity). Future research could therefore focus on uncertainties concerning the service attributes and business models [8]. A successful implementation of ODAM would need to consider novel operational models, given its on-demand characteristic. ODAM has the potential to radically change urban and regional mobility and shorten daily commute times [9]. Research gaps in ODAM also involve the development of a common lexicon and insufficient ODAM research problems such as ODAM demand estimation, ODAM port-location issues, ODAM scheduling, ODAM dispatching, and ODAM routing. In addition, non-revenue-generating activities must be considered when planning to meet dynamic demands; for example, movements due to scheduling conflicts are less likely in conventional scheduled air transportation, but more likely in ODAM transportation [9]. Pilot availability, certification risk, vehicle mass, and trip cost must all be carefully balanced as well [19].
ODAM research in the Munich metropolitan area was performed using simulations as Munich is Germany’s most congested metropolitan area. However, the proposed vertiport locations in the study did not consider size restrictions or capacity restraints (e.g., vehicle take-offs and landings per hour) in their simulations. Moreover, future research should examine how external shocks such as global pandemics impact air mobility networks [20]. Therefore, future air mobility models should consider capacity constraints to identify and quantify delays, events, availability, etc. The current system will need to be transformed, making the development of innovative network management methods and tools a research priority [1]. A U.S. study found that the costs related directly or indirectly to delays were approximately USD 40,700 million [21].
Modern life relies on a variety of transportation options. Although the mobility and vehicular options and capabilities are enormous in comparison with even a few decades ago, the challenges have also grown, particularly in terms of the population density in major cities around the world. One of the reasons for this increase in population density is the lack of cost- and time-efficient transportation options for daily commuting.
Different mobility options have various advantages and disadvantages. For their quantification, indicators must be established, and their parameters measured, such as transportation lead times, battery charging processes and lead times, required financial investments and operational costs, origin and destination flexibility, environmental impact, persons per trip, etc. Considering all these factors along with many others, the development of holistic models is sorely needed for theoretical as well as for practical applications to design, manage, and understand real-world mobility needs while considering a sustainable set of indicators.
Therefore, this study focused on developing an air mobility management model, first, in terms of generic air mobility and, second, for ODAM. Afterwards, the conceptual model was partially applied to a system dynamics simulation for electric aviation aircraft units within a network of vertiports with on-demand mobility requests by users. The goal was to identify bottlenecks, define measures, and, as a result, improve the potential of a networked system of aircraft to match the demand with its capabilities, its available stations and their capacities, and its maintenance performance. Moreover, the study applied a generic holistic concept for electric aviation in a regional area containing fifteen locations, one of which was a major metropolitan area where the central parking, charging, and maintenance hub was located, while the others presented small vertiports with parking and charging capabilities.
The goal of the proposed approach was for the development of a holistic management model for air mobility, its application for ODAM in an electric aviation network, and its capability to manage dynamic capacity constraints by identifying, quantifying, and reacting to bottlenecks and delays at the different vertiports. The simulation model had to manage multiple locations and their amenities (e.g., parking availability, charging bays, etc.) while handling typical transport issues such as customer requests for transport that could not be accommodated as well as insufficient landing locations for incoming aircraft. The main contribution of this research was to identify service issues that could affect customer satisfaction and operational costs. It offers a digital twin of the physical infrastructure for its efficient design as well as for its effective management and operation to maximize its contribution to society and minimize the financial and environmental impacts.

2. Methodology

2.1. Methodological Fundamentals

The methodological fundamentals are systems theory and system dynamics simulation of a digital twin model: systems theory to model the ODAM network as a holistic system without missing any essential element; and system dynamics simulation as it is a high abstraction modelling technique based on stock and flows for the assessment of different policies and measures in a continuous flow. Finally, the obtained data allowed the digital model to provide practical guidance for a similar system under different demand and lead-time conditions.
Systems theory is a multidisciplinary science and provides different approaches to solve complex problems [22]. First, a system always consists of a combination of several elements. Second, these elements are interdependent and have multiple relationships to one another. A system is the product of these interactions [23]. The third characteristic is the system boundary. It is arbitrarily determined and serves to distinguish it from the environment of the system [24]. The system environment also consists of systems and elements. If relationships exist between the system and other elements in the environment, it is an open system; otherwise, it is a closed system [23].
Models represent real-world conditions that can be simplified or made more complex to develop and test theoretical solutions to problems. To create a model, the attributes found in a real-world system must be reduced to the relevant aspects [25]. In modeling based on system theory, there is a basic procedure. In the first step, the underlying real system is transferred to a model. A delimitation of the area of investigation and a restriction to essential features of a system are necessary to reduce the complexity [26]. In the second step, the interdependencies are recorded in the model. In the last step, the model is empirically validated regarding its practical applicability and then transferred to a real system [26]. Simulations have been defined as a targeted experiment on a model to gain knowledge for solving a real-world problem [27]. A distinction can be made between two types of simulations, static and dynamic simulation. In static simulations, one point in time is considered; therefore, the time factor is irrelevant. Since time plays an essential role in our study, a dynamic simulation was chosen. A distinction can still be made here between continuous, discrete, and hybrid simulations. Continuous simulations have continuous changes in state that are described by differential equations. In discrete simulations, state changes occur according to a predefined sequence of events. Hybrid simulations use both discrete and continuous elements [28]. Dynamic simulations were defined for this research as follows: “Simulation is the reproduction of a system with its dynamic processes in an experimental model in order to obtain knowledge that can be transferred to the level of reality” [29].
Urban et el. (2017) developed a system dynamics model for the European air transport system with four stakeholders, including their passengers, airlines, airports, and aircraft manufacturers to provide guidance for airport runway and terminal expansions as well as for aircraft acquisition [4]. However, their research provided neither a holistic approach with ODAM options nor any consideration for electric aviation and its characteristics.

2.2. Research Methodology

Figure 1 represents the six iterative steps of the research methodology followed in this research.
First, the research question, the goal, and the exact definition are defined. Next, an analysis of research feasibility and scope according to available information, mobility technology, and related parameters was performed to develop a suitable methodology. All the combinations of mobility processes were described and mapped including agents involved and the characteristics of the mobility elements such as vertiports, aircraft units, etc. All relevant data, if available, were acquired from historical and real-time data using new technologies or predictions of future scenarios, i.e., defining the mobility demand for a future time horizon for all pairs of origins and destinations within a given mobility network. In the third step, a conceptual model considering different elements and factors was developed for mobility, air mobility, and ODAM with electric aircraft units and network. Mobility demand data of mobility devices such as aircraft units were prepared as input data for the simulation model and processed with a defined logic considering the vertiports and areas of movement of a mobility area as a region. In the fifth step, the model was validated in relation to the logical behavior of the system and by comparing the results with the real or simulated system. Events occurring in the region and their impact on mobility needs and bottlenecks were analyzed with the simulation results. Afterwards, adjustments were made to improve the simulation outcome, and the effects of different alternatives and policies, such as maintenance policies and redistribution options for aircraft units, were measured via key performance indicators.

3. Conceptual Model Development

3.1. Conceptual Framework for Mobility Needs and Supply Options

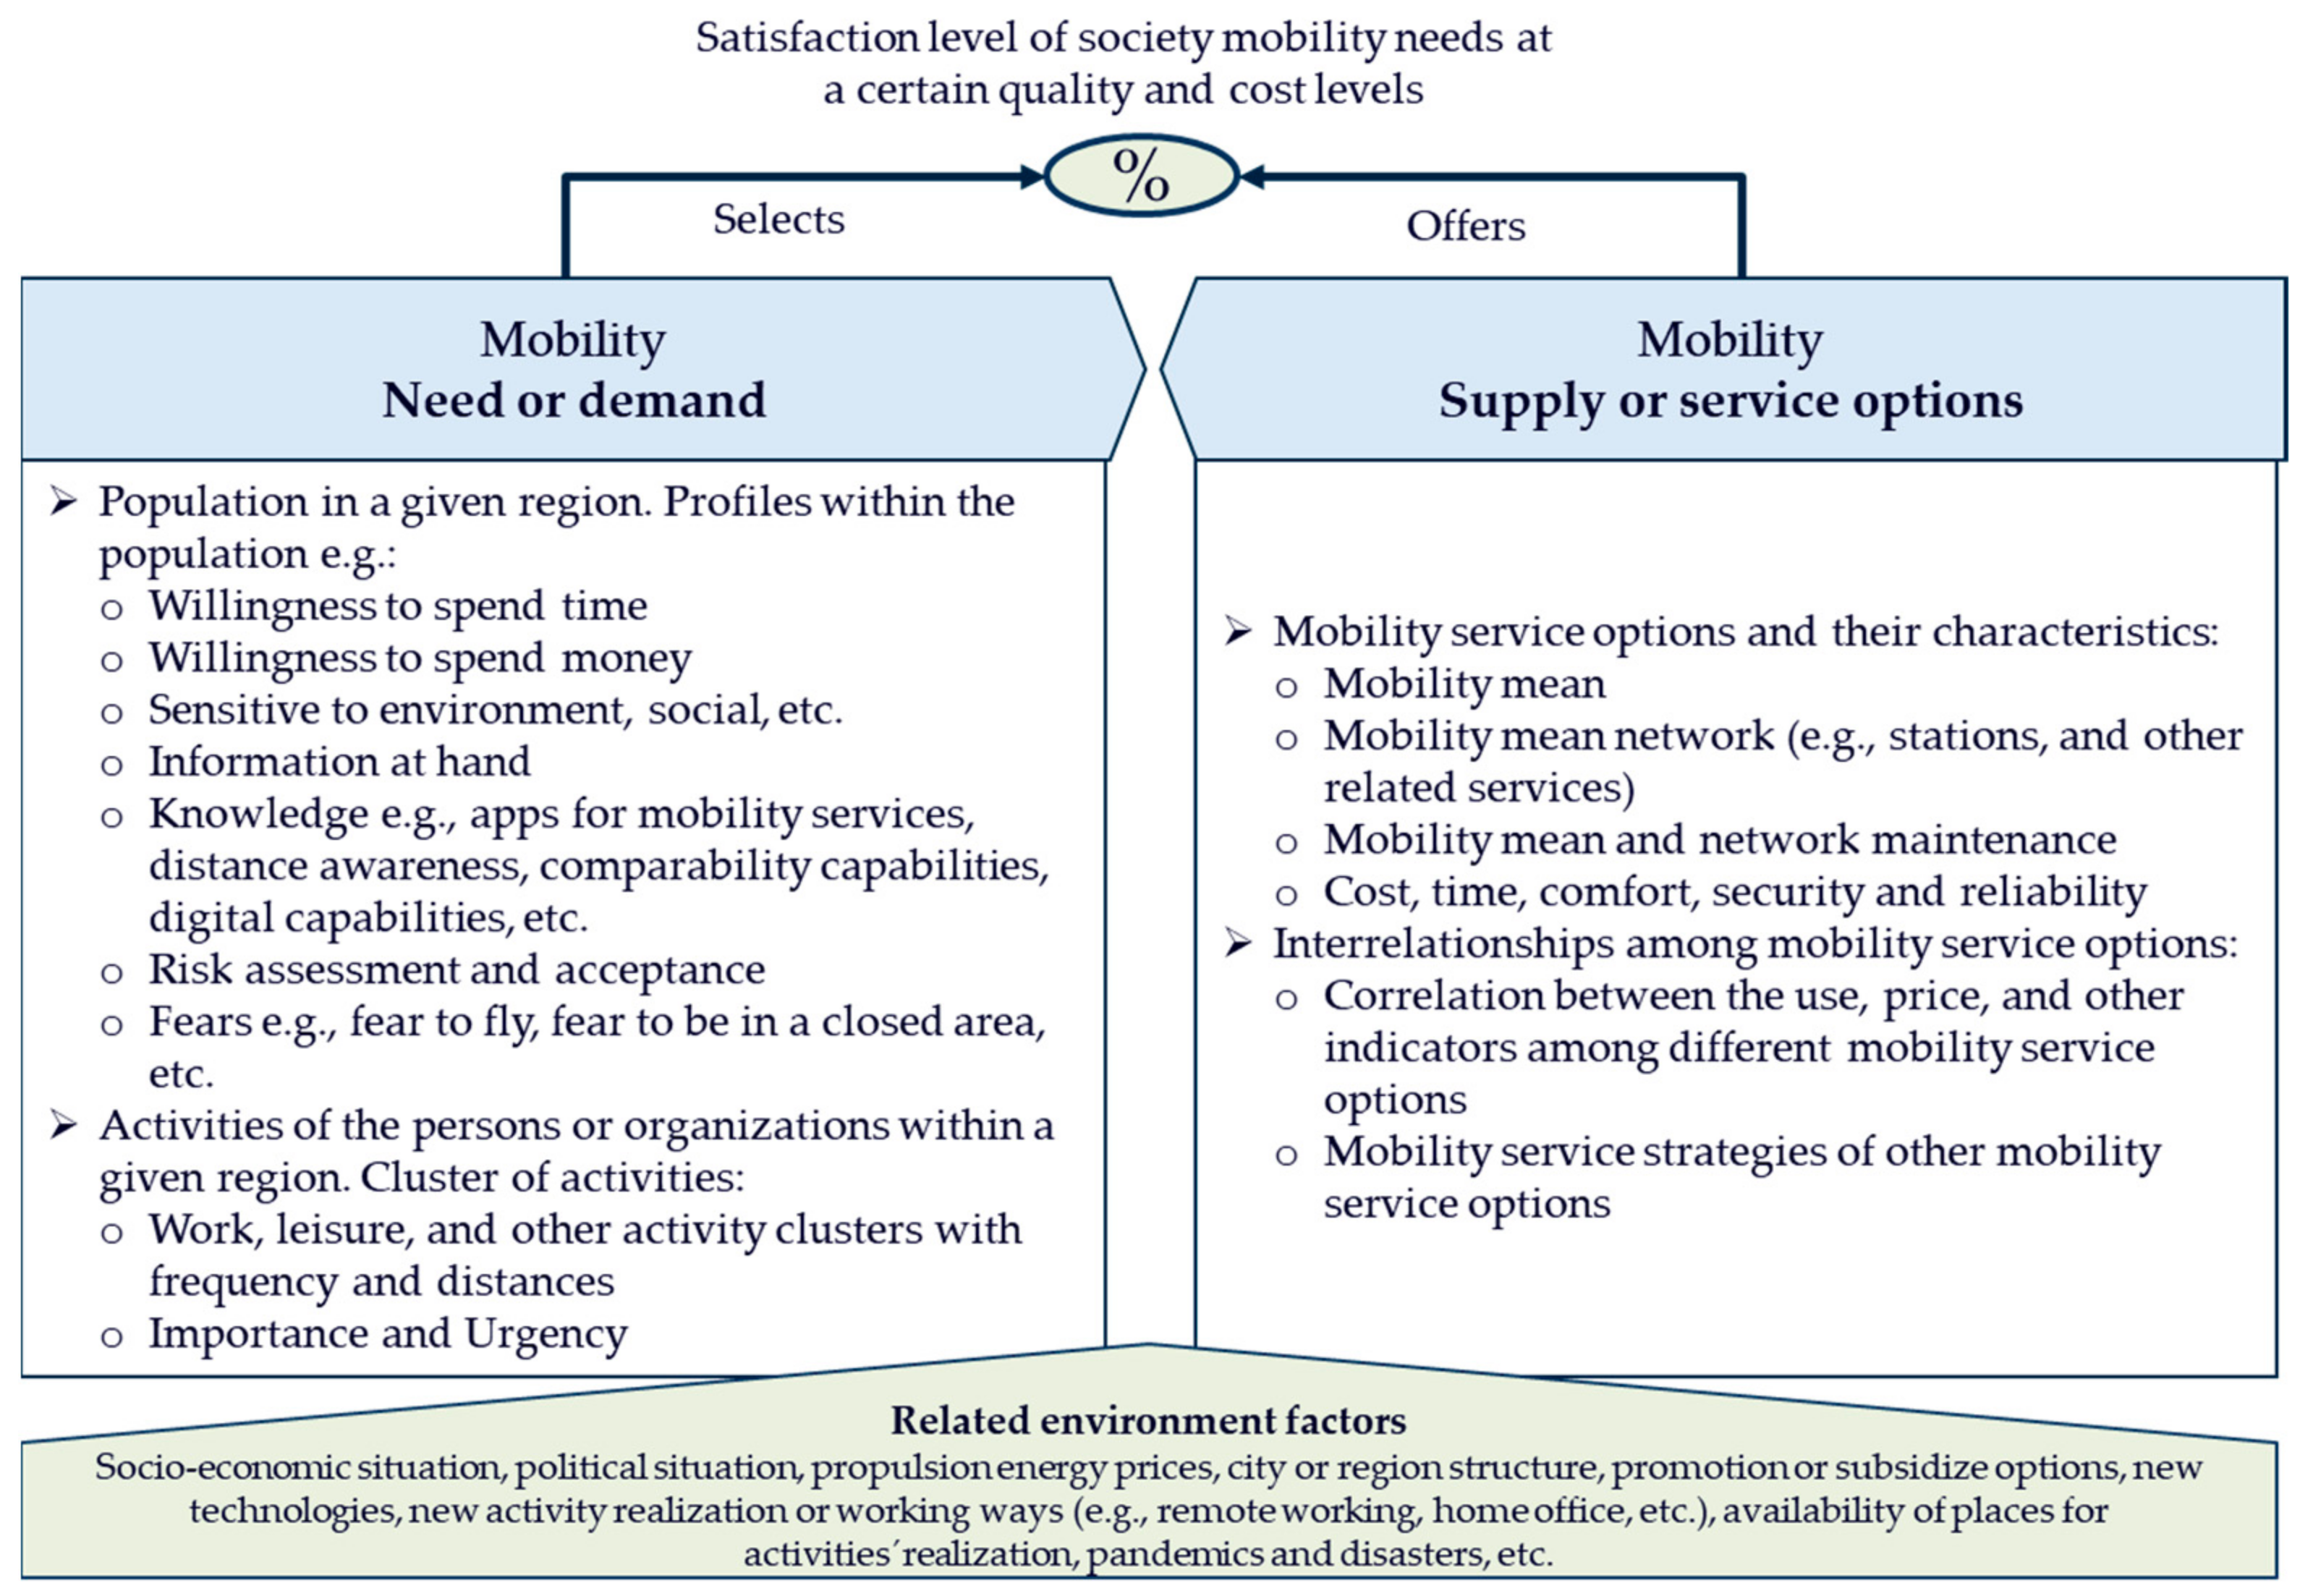
As shown in Figure 2, there were three conceptual elements when analyzing mobility in a certain region. These were the mobility needs or demands, the mobility supply or service options, and the related mobility environment.
The first one was described by the population and the activities they performed. Moreover, the population was classified in different profiles or characteristics to quantify the mobility need. The mobility service suppliers depended on the alternatives provided and their characteristics as well as the interrelationships with other transport means as they could influence the demand by their mobility service choice. Finally, the factors of the related environment such as the economic situation or potential events such as pandemics or remote working influence mobility needs and the mobility options.

3.2. Conceptual Management Model for Air Mobility

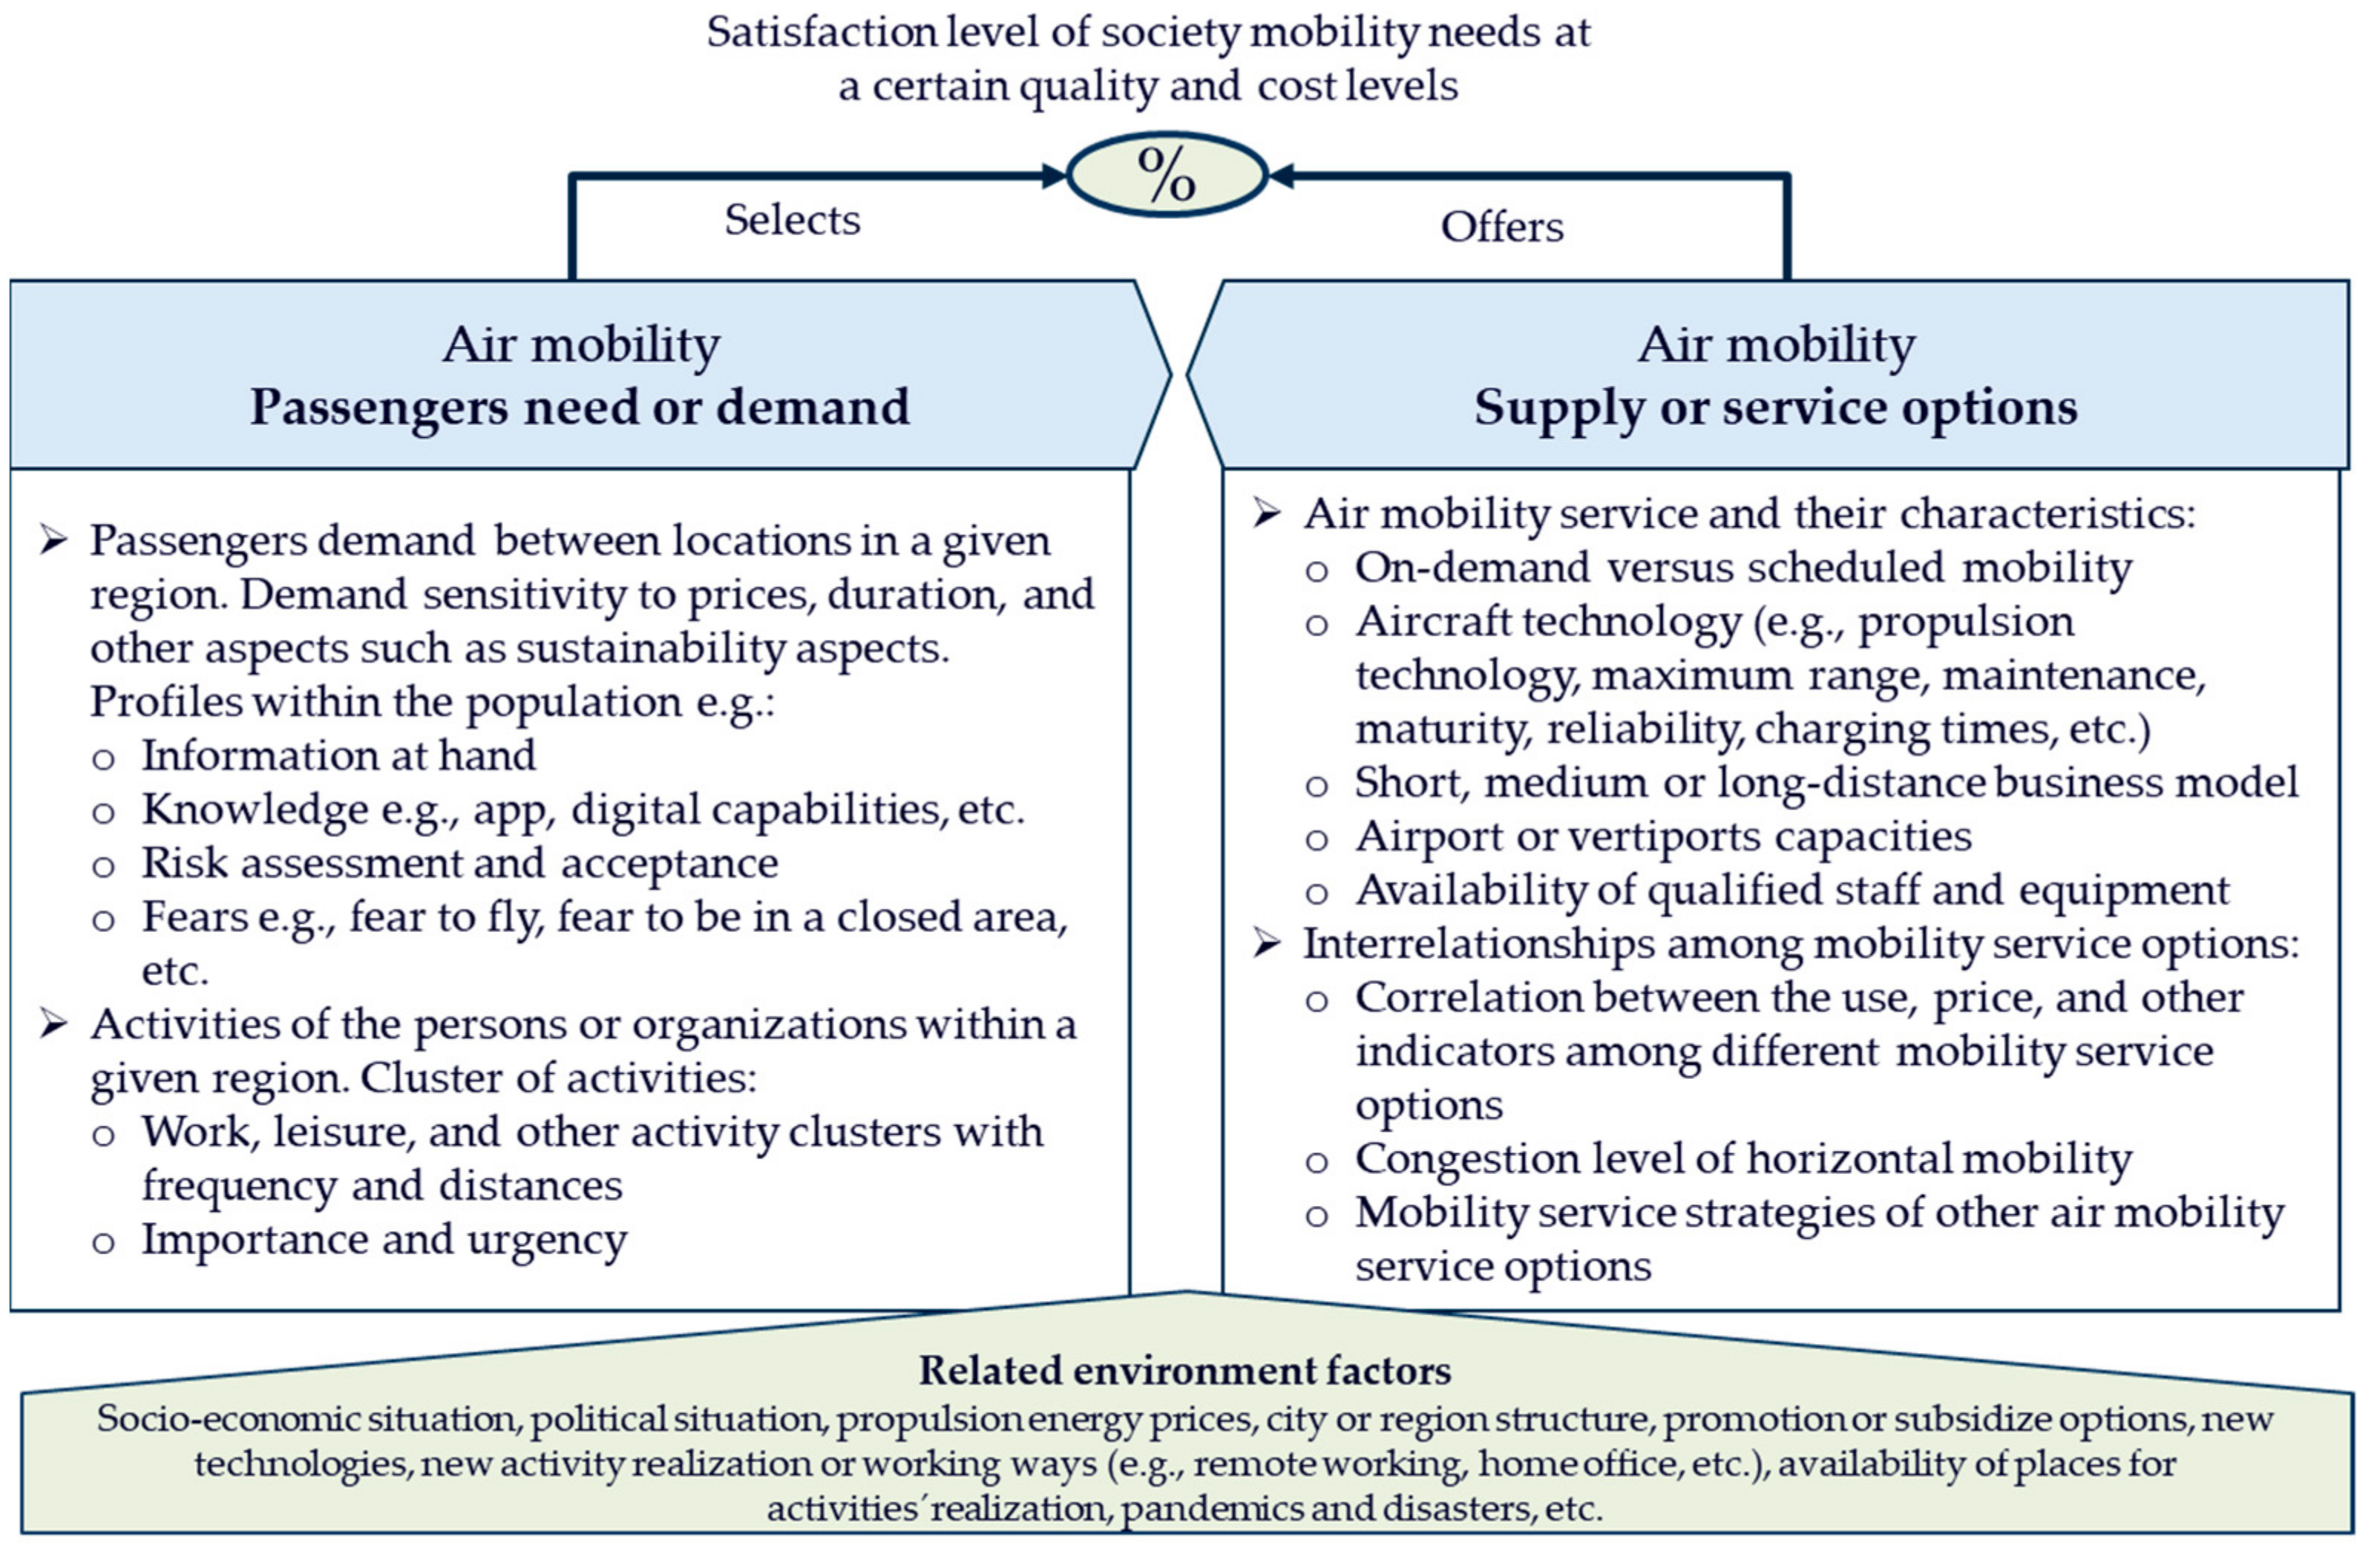
Based on the generic conceptual framework for mobility needs, the air mobility conceptual framework was derived by considering the demand for air mobility and the related passengers from one origin and destination. Moreover, the mobility service options were classified as on-demand versus scheduled air mobility, each with different technology options, as well as the distance-related business models and associated airport and vertiport locations, as shown in Figure 3.
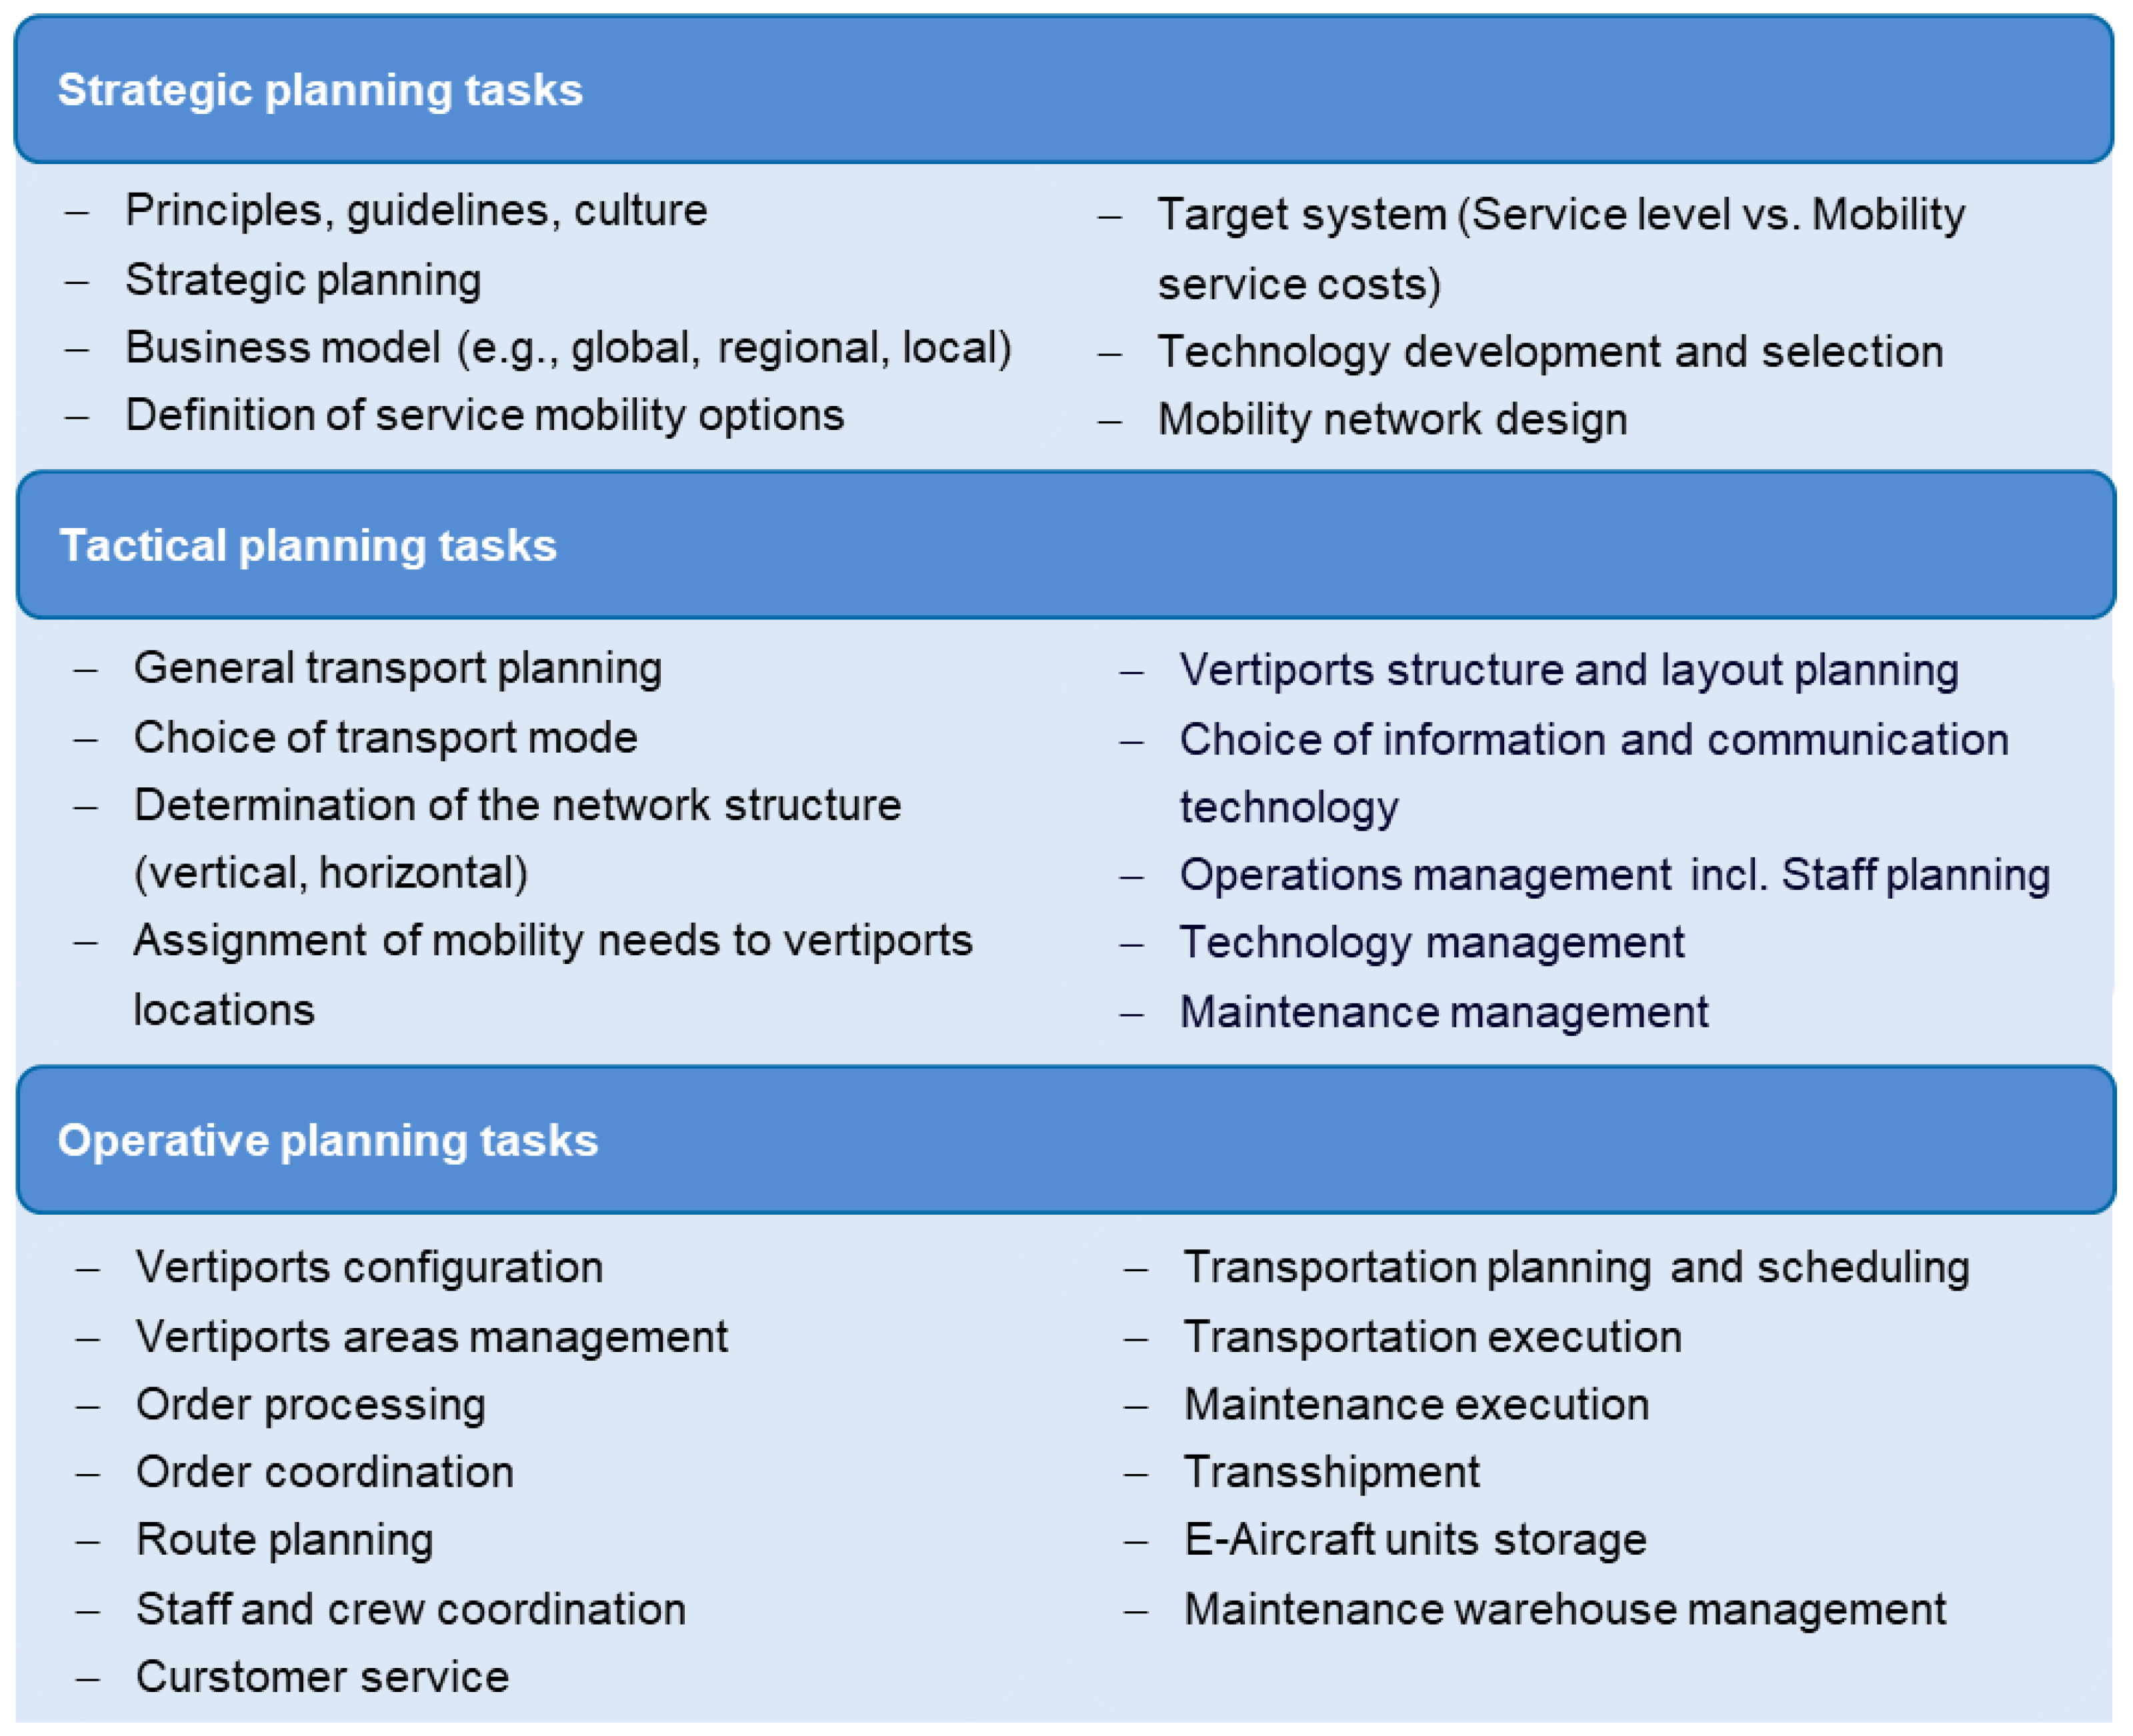
The management and planning tasks of the air mobility conceptual management model were derived from the distribution management tasks as the fundamental goal of the distribution logistics was to achieve the best possible relation between distribution performance and costs [30]. The tasks were, however, assigned according to their temporal relevance to different planning levels and were characterized by different time and planning horizons. According to the St. Gallen management model, the management levels were divided into normative, strategic, and operative planning levels [31]. In the past, the main focus has been the operational and tactical problems; however, to manage logistics management with success in the future, it required an active strategic planning level [30] such as the mobility network design and technology development, as shown in Figure 4, which summarizes the planning tasks for air mobility service management sorted according to their planning horizons and including additional planning functions.
Strategic planning defined the policy, culture, and guidelines, and guided management decisions. Moreover, it determined the business model with a global, regional, or local focus. Furthermore, the mobility network design determined the potential performance and the cost structure in the long term of the air mobility network. As a result, it comprised the long-term distribution strategy and target system as well as the planning of the service mobility options and technologies.
Tactical planning relied on information about the strategy and the key performance indicators (KPIs). It defined the air mobility network structure with a given quantity of aircraft units and vertiports, the defined business model, service options, and technology as well as developed the tactical planning tasks that consisted primarily of the assignment of mobility needs to vertiports locations, operations, technology, and maintenance management.
Operative planning determined whether activities were carried out immediately or delayed. Its main activities were vertiports management, requests and orders processing, route planning, staff coordination, detailed transportation planning and scheduling, and maintenance execution as well as customer service activities.
Based on the planning tasks to be performed, a more detailed description of modules required for successful operations management of air mobility services is provided in Figure 5.
In the first step, the environment situation was taken into consideration for the prediction of mobility demand. Based on the projected demand, the economic module assessed the potential financial performance of investments and operational costs derived from the production of aircraft units as well as from the commission of new vertiports or maintenance locations. As a result, the air network module and the means and services module were derived. From this step, operations could be initiated. For that purpose, an operations management module was required to plan the resources for satisfying mobility needs. Moreover, to do so, a maintenance and charging module was needed to track and plan maintenance intervals and activities as well as to coordinate charging times with future flights. Finally, KPIs were calculated, and service evaluations, continuous improvements, and external reporting were enabled.

3.3. Electric Aviation Mobility Elements

The conceptual model needed to determine the main elements that were considered. These elements, such as the electric aircraft units and the vertiports, were described with their main characteristics and factors, as shown in Figure 6.
Electric aircraft units were defined by a set of parameters based on their costs, variants, dimensions, passengers per unit, speed and emissions, charging times, maintenance plans, and reliability levels, among others. Vertiport elements included the quantity of parking, takeoff, charging, and hangar capacity as well as the operations and maintenance management characteristics, such as the staff, and crew.

3.4. Service-Oriented On-Demand Air Mobility Model

As the model would also be used for ODAM scenarios, any customer could initiate the process by requesting a flight. To satisfy these requests, four different elements and processes were coordinated to ensure customer satisfaction. These elements and processes are shown in Figure 7. First, the availability of the electric aircraft, i.e., that the aircraft was on-site with enough energy and without maintenance needs; secondly, the availability of the pilot and crew on-site; third, the correct and timely order processing, and, finally, that the customer was in the vertiport at the right time. All these elements and processes were tracked and optimized for successful ODAM operations:
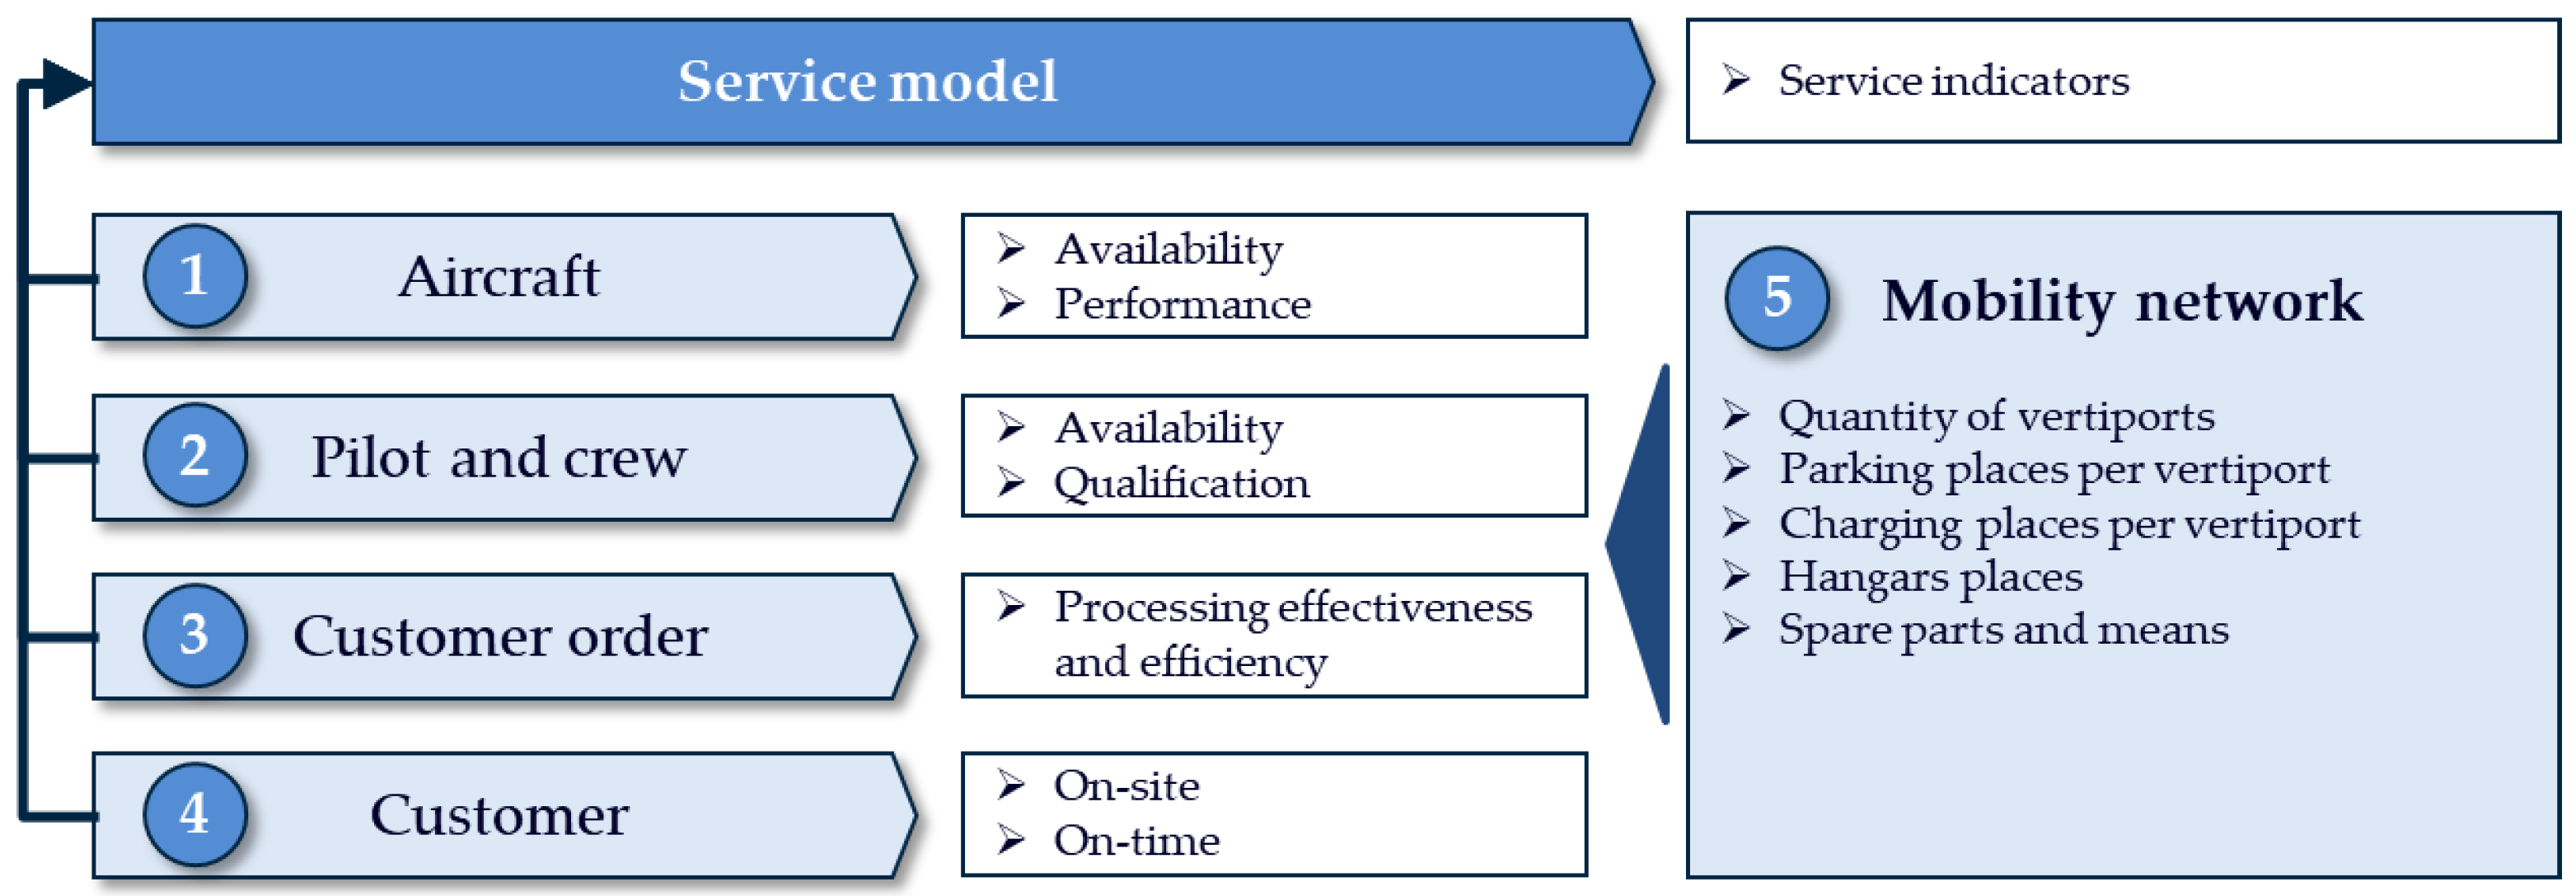
As shown in Figure 8, the service model for ODAM depended on four resources within a given mobility network. Therefore, by adding a given or potential new mobility network, there were five elements by which to assess and improve the performance of the service model.
For each of the service model elements, there were factors influencing the overall customer service provision. For the aircraft, these were its availability and performance. The pilot and the crew involved their availability and qualifications. The customer satisfaction depended on the effectiveness and efficiency of their order processing from the initial request to their arrival at their destination. For the mobility network, these were the quantity of the different spaces within the mobility network, i.e., how to manage the capacities of vertiports and places as well as how many spare parts and means were to be allocated for proper operations and maintenance of the aircraft units. Finally, for the service model, the customer had to be on-site and on-time, so an effective and efficient customer request and order processing was fundamental. The customer request and order processing for ODAM systems would also likely involve how a customer request could be placed and what communications platforms could be used (e.g., via internet with smartphones, laptops, or other devices).
As these requests for pairs of origins and destinations had not been associated with an aircraft, these requests were “process-to-stock”, as they were stored until an aircraft was assigned. When an aircraft was associated and a flight was planned, then the requests were converted into orders, and they were considered “process-to-order”. In the process of assigning an electric aircraft for a given request, one may not be available. Moreover, upon aircraft arrival and preparation to land, parking bays may not be available in the landing vertiport. As a result, for improving service levels, the global customer order lead time needed to be minimized. For doing so, three elements were key, as shown in Figure 9. If the push-pull boundary moved closer to the customer, the real mobility demand would need to be known earlier, and the request processing lead time would be lower, making the time span for planning purposes higher. The second key element was assuring the availability of charged electric aircraft units without further maintenance needs in each vertiports as this would reduce the assignment waiting times of aircraft. The third element referred to the waiting times for landing and parking at the destination. Therefore, ensuring landing space was essential in reducing flight-related lead times.

4. Simulation Model Design

4.1. Methodological Steps

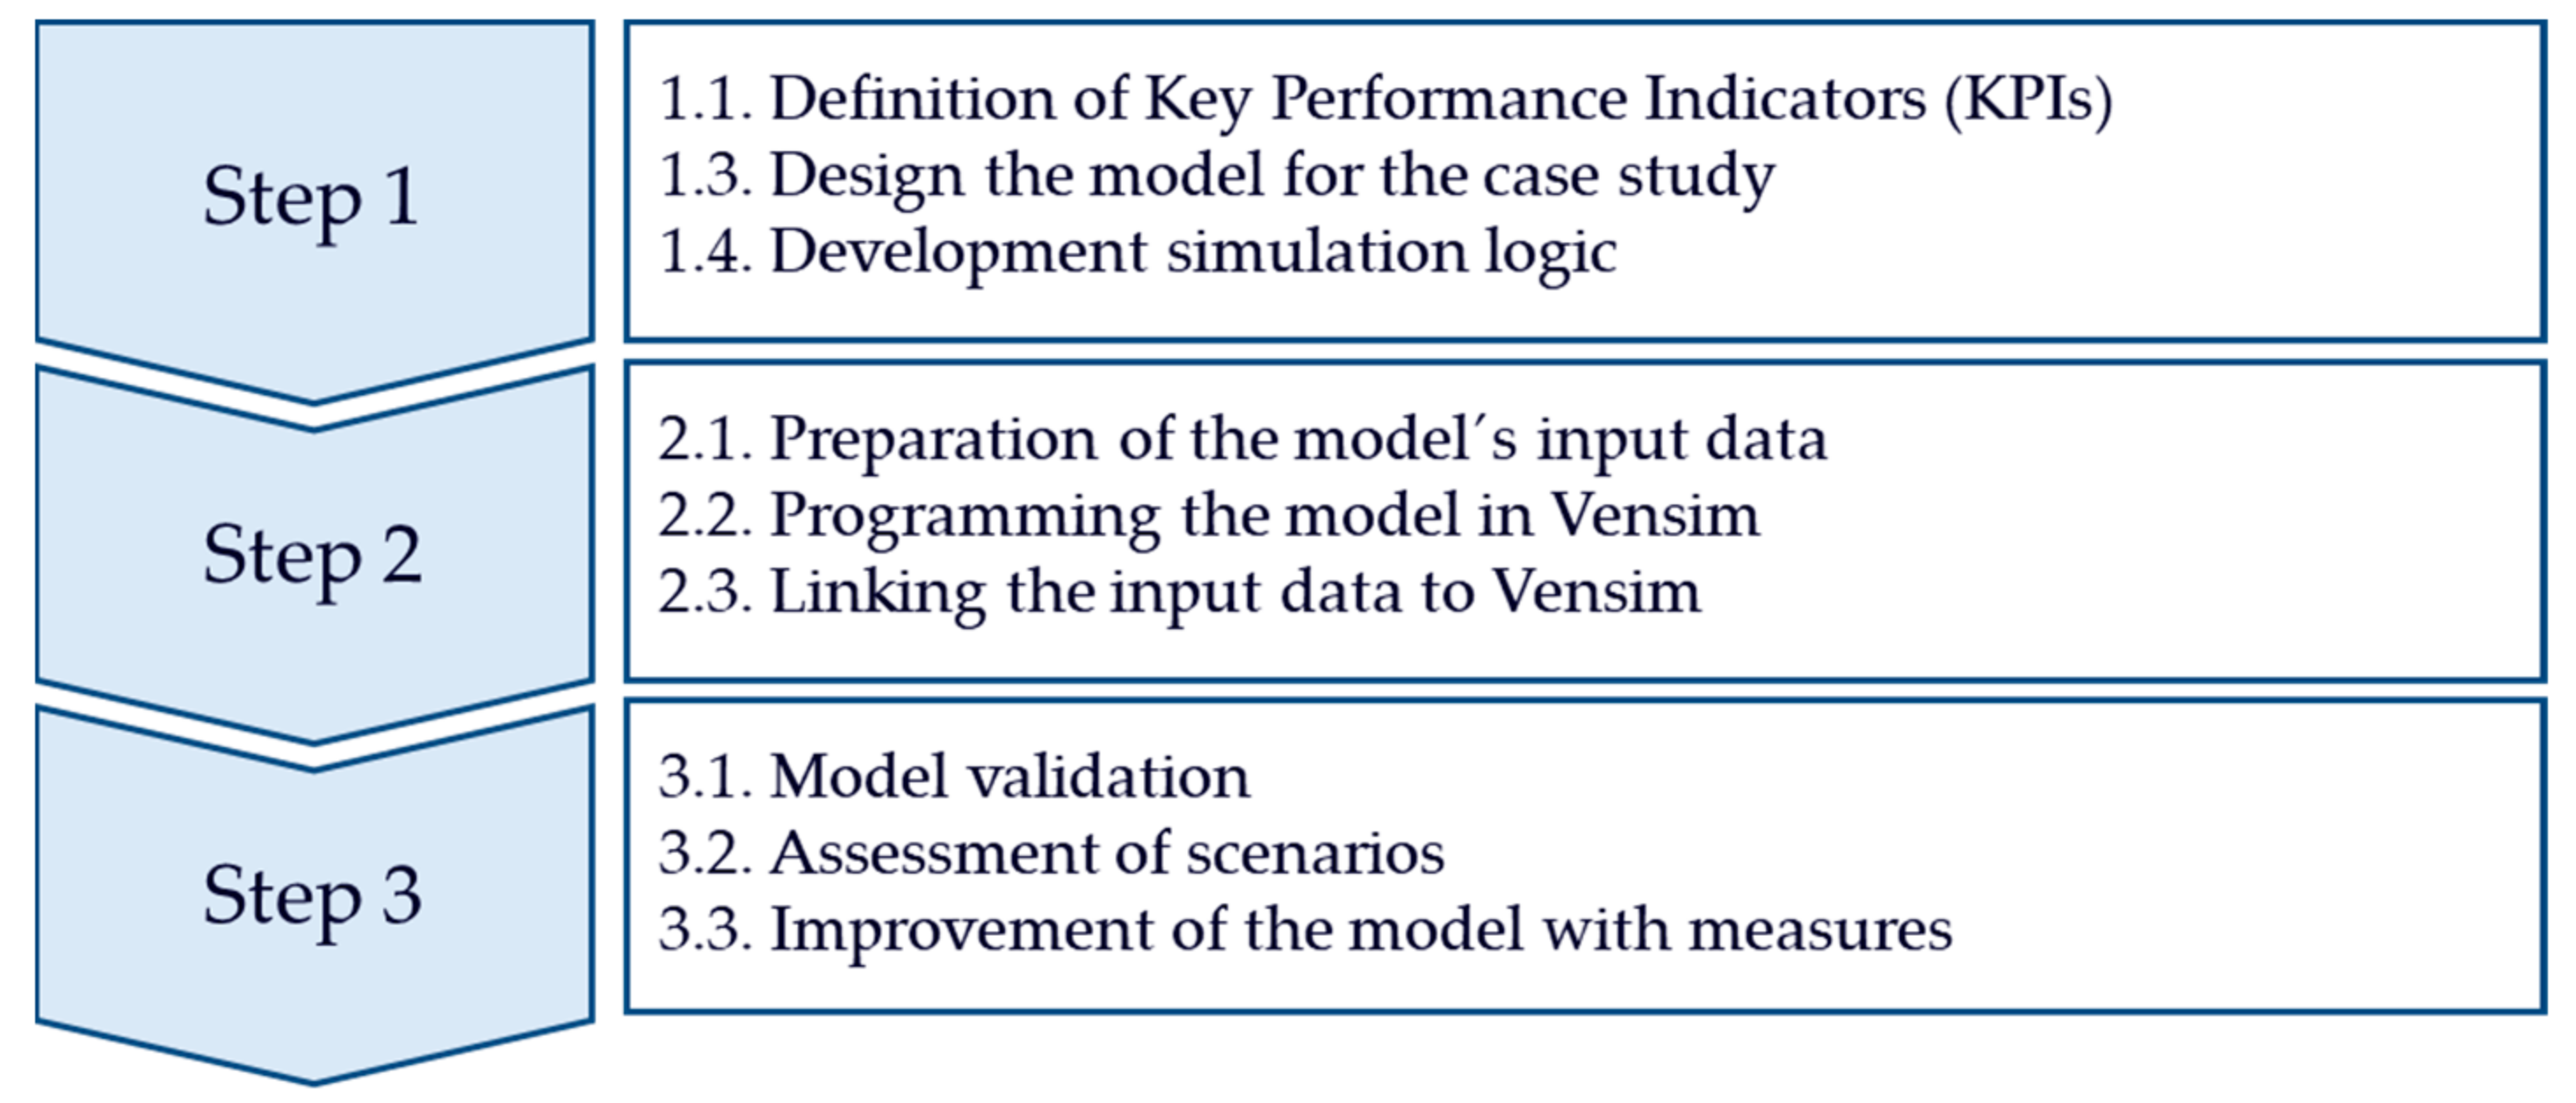
First, the main steps for designing the simulation for the case study were defined as shown in Figure 10.
The three main steps for designing the simulation were divided as follows: (1) For KPIs, design the model and its simulation logic; (2) For programming, define logic for preparing and linking the data to the simulation model; and finally, (3) For the validation, extraction of results for various scenarios as well as measures to improve the model.

4.2. Target System

The KPIs shown in Table 1 were considered to assess the simulation scenarios.
For measuring the external system performance, the KPIs with more importance were 1 (passengers), 6 (the time a passenger waits until his request is accepted), and 11 (the extra-time a passenger waits for landing). The first indicator implied how many people (quantity) were provided with the requested travelling service, and the other two indicators reflected the quality of the service in terms of the additional time over the minimum time needed to provide the service. For measuring the internal system performance, the most important KPI was 2 (the average aircraft on ground). If minimized, more trips would be made, and more potential passengers would be provided with the requested travelling service

4.3. Model Design for the Case Study

The model design was based on the three elements, as described in Section 3.4. Therefore, the model would identify and quantify:
  • When an aircraft unit is required at a vertiport and it is not available.
  • When an aircraft unit requires a place to land and park at a vertiport and no place is available.
The simulation model would provide relevant insights as this information, even with real-time and location data collection, could not be obtained. For designing the model, the following simulation assumptions were used:
  • The simulation period was set equal to 1 min.
  • The time horizon was selected for 4 days, a total of 5760 periods.
  • Every day, there was a redistribution of the aircraft units between vertiports. In the model, this occurred every 1440 periods. This function could be disabled.
  • There were 15 vertiports with distances between 100 and 300 km among them. All origin–destination pairs were available by request to customers within the 15 vertiports as potential connections.
  • The electric aircraft units had a range of 300 km.
  • The flight transportation lead times between the 15 vertiports were calculated with a normal distribution defined by a mean and a standard deviation. However, it was possible to define the mean, the standard deviation, the maximum and the minimum per possible transport route, with a total of 225 combinations.
  • If an aircraft unit could not land in a vertiport due to the location having reached its capacity, the aircraft would wait until space became available.
  • If a customer flight request for an aircraft unit could not be assigned due to the vertiport being empty, then the customer would wait until an aircraft unit was available in the same vertiport.
  • The electric aviation cycle in the simulation model followed the status shown in Figure 11. Between two flights, four cases could occur before the next flight order would be performed; direct to the next flight; charging required; maintenance required; charging and maintenance required.
Based on the assumptions, the network model of fifteen vertiports was implemented in the simulation model, as shown in Figure 12. Five main characteristics described the network model, the vertiports capacity with ten aircraft units per vertiport, the distance between vertiports, the charging times with a value up to 30 min for a fully charged battery, the quantity of passengers per aircraft with six maximum, and the maintenance parameters for planned and unplanned maintenance:
A central vertiport location was assumed as the main location with more aircraft unit capacity while all other vertiport capacities held ten aircraft units. The model assumed that after each trip, the aircraft unit remained at the vertiport until assigned to a new on-demand request, i.e., flying without passengers was not allowed in the model unless a redistribution for all aircraft units was performed. In this case, flights without passengers were performed to reallocate aircraft units within the network.

4.4. Simulation Logic

The simulation logic was built by applying the conceptual management model for air mobility described in Figure 5, with a special focus on the modules seven, eight, and nine, referring to the capacity-constrained operations and maintenance modules and the related service indicators including delays and backlogs. For this purpose, only the simulation-related conceptual model was considered, as shown in Figure 13.
First, the demand module was built outside of the simulation model with different mobility demand patterns with origin and destination mobility needs for any given simulation period. Next, the air mobility network as well as the services and means were defined based on the characteristics described in Section 4.3. Finally, the model would also calculate or derive other indicators such as emission reductions, cost savings, time savings, etc. for external monitoring or reporting.
The input data for the simulation model was prepared by defining the following parameters in Microsoft Excel files:
  • Demand of mobility between stations with origin and destination. For each time period, flight requests for each origin–destination combination were generated. Therefore, customized air mobility scenarios could be generated to simulate the on-demand nature. The data were read by the system dynamics simulation model.
  • Average transportation lead time between all combinations of vertiports, standard deviation of the transportation lead time between vertiports, as well as the maximum and minimum values for the lead times between locations were also defined and read from the simulation model. Therefore, the model allowed changes to the lead time parameters from its origin–destination combination
The simulation model was built in Vensim. For this purpose, stock with capacity limitations was built for the fifteen vertiports as well as transportation streams of aircraft units between vertiports and their transportation times.

4.5. Simulation Models and Scenarios

Finally, two different scenarios were considered, as shown in Figure 14, one with a high demand level that simulated a four-day period in which there were events in the region that required higher mobility needs, and a scenario with low demand levels such as on typical weekdays without vacation periods.
Finally, different simulation models were developed based on relevant factors of the air mobility network, its elements, and their characteristics. For example, in the case study, two factors were simulated: the maintenance performance and the daily redistribution of aircraft units. Based on these factors, four different simulation models were derived, as shown in Figure 15.
The high-performance maintenance model reduced the number of unexpected breakdowns and, therefore, reduced the probability of corrective maintenance due to more efficient preventive plans, as compared to the low performance simulation model. Moreover, the redistribution simulation model had the capability to perform a daily reorganization of the aircraft units within the vertiport air mobility network to balance the capacity utilization of the vertiports and meet predicted demands, while the no-redistribution simulation model initiated each new day with the distribution of aircraft units as it was at the end of the previous day.

5. Case Study Results

This section provides the results for the maintenance and redistribution simulation models, as shown in Table 2 and Table 3, for the high demand scenarios:
Based on the results, the passengers transported in each comparison were higher when the maintenance performance was high and when the daily redistribution of the aircraft units between locations was allowed. Moreover, the backlog levels in both comparisons were also higher in the quantity of the requests waiting to be assigned and the minutes for the no-redistribution and low maintenance performance models. The only parameter that improved was the percentage of minutes during which the vertiport was not empty in the low performance simulation model. However, this could be explained due to the aircraft units spending more time in the vertiports as maintenance requires longer lead times and the vertiport was full, but the aircraft units could not be assigned. Finally, the simulation model that did not allow for the daily redistribution had almost double the average values of full and empty vertiports over the four-day simulation as the distribution disequilibrium of one day bled over to the next.

6. Discussion

The conceptual model described the elements, factors, and aspects considered and provided guidance for the design, management, and improvement of mobility networks, vertiports, and aircraft units. The simulation model and the design methodology provided a step-by-step methodology that could be applied to any area and mobility system to optimize overall system performance and improve customer experiences and satisfaction. In this case, it was applied for electric aviation to show the considerable optimization potential. Using this tool, capacity bottlenecks due to excess aircraft units were reduced, and its accuracy may increase once real-world data can be obtained. The simulation provided an overview of the vertiports and the aircraft units needed to reach a certain service level for the population of a regional area.
There will always be challenges to the system’s capacity, wherein bookings exceed available flights or unexpected circumstances impact the overall efficiency. For those very likely scenarios, the following measures along with a digital twin model should be considered:
  • The real-time monitoring of vertiports with their capacity. Allowing users of smart-device apps to view where and what options are available for on-demand transport. Short-term reservations could be an option, such as within 30-min time frames.
  • An app could also connect users and allow them to meet and transfer seats and improve the utilization rate of the e-aircraft while minimizing the use of the capacities at the stations and reducing wait times.
  • A team could be allocated to redistribute aircraft to meet on-demand bookings and prevent overcrowding at vertiports.
  • Additional services could be provided, such as a business option for those who need on-demand transportation and can afford to pay extra for customized processing such as longer reservation windows or long-term bookings.

7. Conclusions

The proposed research provided a methodology for modelling mobility networks. The importance of the network design as well as its elements and options has been shown based on our results. Moreover, the following conclusions were reached: a generic air mobility management model as well as an ODAM management model were developed; the ODAM conceptual model was applied to a simulation model for electric aviation aircraft units within a network of vertiports with on-demand bookings. For this purpose, the customer request processing model and electric aviation cycle were applied. As a result, the system dynamics simulation provided an ideal framework to compare different scenarios. The simulation model analyzed the variance of factors such as maintenance policies and redistribution of aircraft units while considering given aircraft capacities, vertiports capacities, the distribution of charging times and battery lifespan, as well as distances and lead times between vertiport locations. The simulation case study provided an application with constrained capacity management of vertiport capacities in an electric air mobility network as well as insights into vertiport capacities for a given demand (i.e., which routes and circumstances had service problems and needed to be adjusted). The simulation results showed how high-performance maintenance management and daily redistributions of aircraft significantly improved the external service provision in quantity of passengers and in quality with less minutes per trip, as well as the aircraft on-ground time percentage. In conclusion, this proposed approach could increase travel demand satisfaction via time savings for passengers and operators as well as with a better utilization of assets.
Future research areas may include:
  • An extension of the conceptual model for an integrated mobility concept with scalability.
  • A detailed analysis of the factors of the simulation model.
  • An application of the model for route scheduling and traffic management as well as for monitoring indicators for the continuous optimization of the network, balancing mobility needs against operational costs, and environmental impacts.
  • An extension of the functionality of the simulation model including an economic model with price fluctuations, economic cycles, the evolution of shared mobility, population characteristics and demographics, the impact of global events such as COVID-19, increased flexibility of the distribution network, different regions and stations, and the mobility vehicle life cycle.
  • An application of the conceptual model methodology and the simulation model to a real-world mobility network for a region.
This kind of model and assessment provide guidance for new network configurations as well as for the optimization of existing networks. For this reason, many public and private organizations and professionals, such as suppliers, operators, administration authorities, and users, may provide personalized data and customized details to obtain more accurate predictions and assessments.

Author Contributions

Conceptualization, P.W., M.G., and S.G.-G.; data curation, S.G.-G.; formal analysis, S.G.-G.; Investigation, P.W. and S.G.-G.; methodology, M.G. and S.G.-G.; resources, S.G.-G.; software, S.G.-G.; supervision, S.G.-G.; validation, P.W. and S.G.-G.; writing—original draft, S.G.-G. All authors have read and agreed to the published version of the manuscript.

Funding

This research received no external funding.

Institutional Review Board Statement

Not applicable.

Informed Consent Statement

Not applicable.

Conflicts of Interest

The authors declare no conflict of interest.

References

  1. Zanin, M.; Lillo, F. Modelling the air transport with complex networks: A short review. Eur. Phys. J. Spéc. Top. 2013, 215, 5–21. [Google Scholar] [CrossRef] [Green Version]
  2. Holmes, B.J. A Vision and Opportunity for Transformation of On-Demand Air Mobility. In Proceedings of the 16th AIAA Aviation Technology, Integration, and Operations Conference, Washington, DC, USA, 13–17 June 2016; p. 3465. [Google Scholar]
  3. Friedrich, C.; Robertson, P.A. Hybrid-electric propulsion for automotive and aviation applications. CEAS Aeronaut. J. 2015, 6, 279–290. [Google Scholar] [CrossRef] [Green Version]
  4. Urban, M.; Kluge, U.; Plötner, K.O.; Barbeito, G.; Pickl, S.; Hornung, M. Modelling the European Air Transport System: A System Dynamics Approach. Deutsche Gesellschaft für Luft-und Raumfahrt-Lilienthal-Oberth eV. 2017. Available online: https://www.dglr.de/publikationen/2017/450125.pdf (accessed on 6 January 2022).
  5. Legeza, E.; Selymes, P.; Torok, A. Investigation of European air transport traffic by utility-based decision model. Aviation 2010, 14, 90–94. [Google Scholar] [CrossRef]
  6. Lijesen, M.G.; Nijkamp, P.; Rietveld, P. Measuring competition in civil aviation. J. Air Transp. Manag. 2002, 8, 189–197. [Google Scholar] [CrossRef]
  7. Jain, A.; Martinetti, A.; van Dongen, L. Mapping the Needs of Design for Maintenance in Electric Aviation; Elsevier: Amsterdam, The Netherlands, 2021; Available online: https://ssrn.com/abstract=3945107 (accessed on 6 January 2022).
  8. Al Haddad, C.; Chaniotakis, E.; Straubinger, A.; Plötner, K.; Antoniou, C. Factors affecting the adoption and use of urban air mobility. Transp. Res. Part A Policy Pract. 2020, 132, 696–712. [Google Scholar] [CrossRef]
  9. Sun, X.; Wandelt, S.; Husemann, M.; Stumpf, E. Operational Considerations regarding On-Demand Air Mobility: A Literature Review and Research Challenges. J. Adv. Transp. 2021, 2021, 3591034. [Google Scholar] [CrossRef]
  10. Abu-Rayash, A.; Dincer, I. Analysis of mobility trends during the COVID-19 coronavirus pandemic: Exploring the impacts on global aviation and travel in selected cities. Energy Res. Soc. Sci. 2020, 68, 101693. [Google Scholar] [CrossRef] [PubMed]
  11. Kadyk, T.; Winnefeld, C.; Hanke-Rauschenbach, R.; Krewer, U. Analysis and Design of Fuel Cell Systems for Aviation. Energies 2018, 11, 375. [Google Scholar] [CrossRef] [Green Version]
  12. Seeley, B.A.; Seeley, D.; Rakas, J. A Report on the Future of Electric Aviation; The Regents of the University of California: Berkeley, CA, USA, 2020. [Google Scholar]
  13. Brelje, B.J.; Martins, J.R. Electric, hybrid, and turboelectric fixed-wing aircraft: A review of concepts, models, and design approaches. Prog. Aerosp. Sci. 2019, 104, 1–19. [Google Scholar] [CrossRef]
  14. Westin, L. Towards Electric Aviation in the Kvarken Region; Kvarken Council: Vaasa, Finland, 2021. [Google Scholar]
  15. Brown, A.; Harris, W. A Vehicle Design and Optimization Model for On-Demand Aviation. In Proceedings of the 2018 AIAA/ASCE/AHS/ASC Structures, Structural Dynamics, and Materials Conference, Kissimmee, FL, USA, 8–12 January 2018; p. 0105. [Google Scholar]
  16. Paproth, Y.; Adam, F.; Stich, V.; Kampker, A. Model for future thin-haul air mobility demand in Germany. In Proceedings of the 2020 IEEE International Conference on Engineering, Technology and Innovation (ICE/ITMC), Cardiff, UK, 15–17 June 2020; pp. 1–8. [Google Scholar]
  17. Mandel, B.; Gaudry, M.; Ungemach, D. Europe-Wide Aviation Connectivity Measures and the PATH Theorem; Université de Montréal: Montréal, QC, Canada, 2017; Volume 21, Agora Jules Dupuit, Publication AJD-161. [Google Scholar]
  18. Schäfer, A.W.; Barrett, S.R.; Doyme, K.; Dray, L.M.; Gnadt, A.R.; Self, R.; O’Sullivan, A.; Synodinos, A.P.; Torija, A.J. Technological, economic and environmental prospects of all-electric aircraft. Nat. Energy 2019, 4, 160–166. [Google Scholar] [CrossRef] [Green Version]
  19. Brown, A.; Harris, W.L. Vehicle Design and Optimization Model for Urban Air Mobility. J. Aircr. 2020, 57, 1003–1013. [Google Scholar] [CrossRef]
  20. Ploetner, K.O.; Al Haddad, C.; Antoniou, C.; Frank, F.; Fu, M.; Kabel, S.; Llorca, C.; Moeckel, R.; Moreno, A.T.; Pukhova, A.; et al. Long-term application potential of urban air mobility complementing public transport: An upper Bavaria example. CEAS Aeronaut. J. 2020, 11, 991–1007. [Google Scholar] [CrossRef] [PubMed]
  21. Campanelli, B.; Fleurquin, P.; Eguiluz, V.M.; Ramasco, J.J.; Arranz, A.; Etxebarria, I.; Ciruelos, C. Modeling reactionary delays in the European air transport network. In Proceedings of the Fourth SESAR Innovation Days, Madrid, Spain, 25–27 November 2014. [Google Scholar]
  22. Gomez, P.; Malik, F.; Oeller, K.H. Systemmethodik-Grundlagen Einer Methodik zur Erforschung und Gestaltung Komplexer Soziotechnischer Systeme; Haupt, P., Translator; Paul Haupt: Bern, Swizertland, 1975. [Google Scholar]
  23. Patzak, G. Systemtechnik—Planung Komplexer Innovativer Systeme: Grundlagen, Methoden, Techniken; Springer: Berlin/Heidelberg, Germany, 2013. [Google Scholar]
  24. Haberfellner, R.; Nagel, P.; Becker, M.; Büchel, A.; von Massow, H. “Systems Engineering” Methodik und Praxis; Industrielle Organisation: Zürich, Switzerland, 2002. [Google Scholar]
  25. Moron, O. Unterstützung Strategischer Entscheidungen in Produzierenden Unternehmen; Shaker: Aachen, Germany, 1998. [Google Scholar]
  26. Friedrich, M. Beurteilung Automatisierter Prozesskoordination in der Technischen Auftragsabwicklung; Shaker: Aachen, Germany, 2002. [Google Scholar]
  27. Franz, V. (Ed.) Simulation von Unikatprozessen: Neue Anwendungen aus Forschung und Praxis; 2. IBW-Workshop; 24. März 2011 an der Universität Kassel; Kassel University Press GmbH: Kassel, Germany, 2011; Volume 2. [Google Scholar]
  28. Domschke, W.; Drexl, A. Einführung in Operations Research; 7. Überarb. Aufl.: Mit 63 Tabellen (No. 30389); Department of Business Administration, Economics and Law, Institute for Business Studies (BWL), Darmstadt Technical University: Darmstadt, Germany, 2007. [Google Scholar]
  29. Richtlinie, V.D.I. Blatt 1: Simulation von Logistik-, Materialfluß-und Produktionssystemen–Grundlagen; Beuth: Berlin, Germany, 2000. [Google Scholar]
  30. Schuh, G.; Stich, V. Logistikmanagement: Handbuch Produktion und Management 6; 2. Vollst. Neu Bearb. und Erw. Imprint; VDI-Buch, 6; Springer: Berlin/Heidelberg, Germany, 2013. [Google Scholar]
  31. Bleicher, K. Das Konzept Integriertes Management: Visionen-Missionen-Programme; Campus Verlag: Frankfurt, Germany, 2011. [Google Scholar]
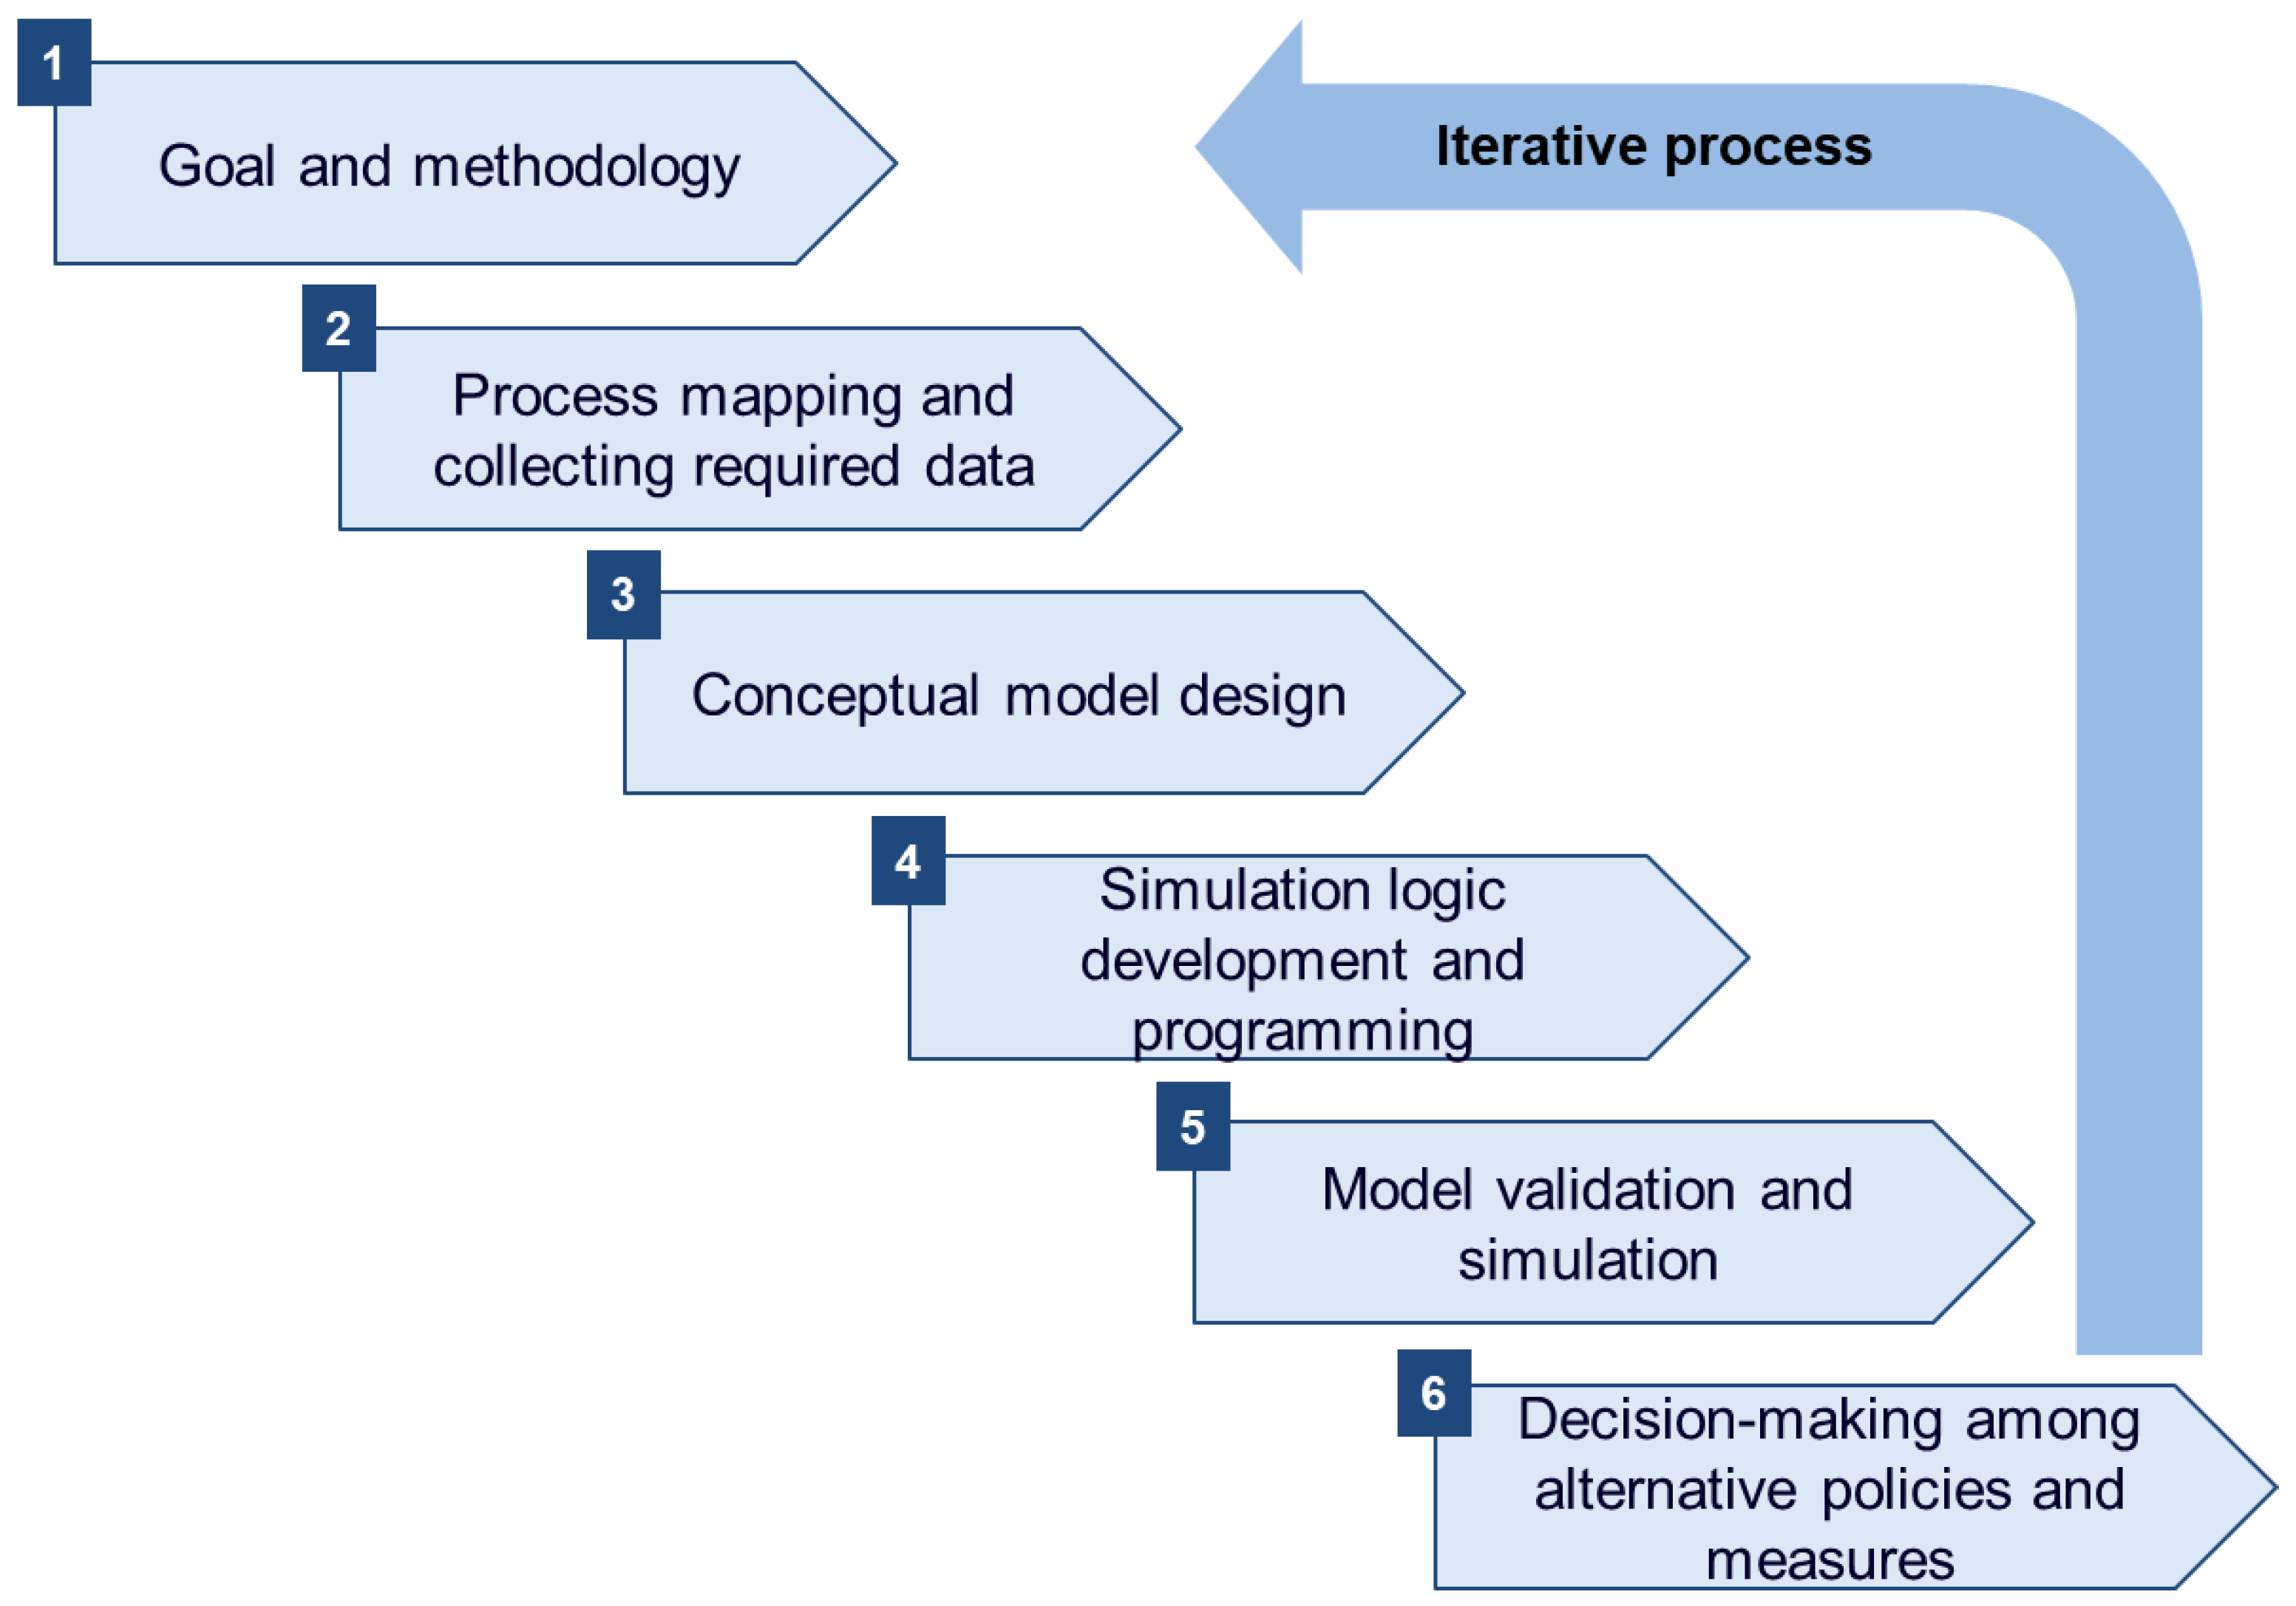
Figure 1. Research Methodology.
Applsci 12 00848 g001
Figure 2. Conceptual framework for Mobility Needs and Supply Options.
Applsci 12 00848 g002
Figure 3. Conceptual framework for Air Mobility Needs and Supply Options.
Applsci 12 00848 g003
Figure 4. Planning tasks for an aviation mobility supplier.
Applsci 12 00848 g004
Figure 5. Conceptual Model for Electric Air Mobility Operations Management.
Applsci 12 00848 g005
Figure 6. Electric Aviation Mobility Elements.
Applsci 12 00848 g006
Figure 7. On-Demand Air Mobility Requests.
Applsci 12 00848 g007
Figure 8. Service model and its five elements.
Applsci 12 00848 g008
Figure 9. Customer Request Processing: Push-pull boundary and non-availability of aircraft and parking places.
Applsci 12 00848 g009
Figure 10. Simulation Design Methodology.
Applsci 12 00848 g010
Figure 11. Electric Aviation Cycle.
Applsci 12 00848 g011
Figure 12. Model Network Design and related parameters.
Applsci 12 00848 g012
Figure 13. Simulation logic.
Applsci 12 00848 g013
Figure 14. Mobility Demand Scenarios.
Applsci 12 00848 g014
Figure 15. Simulation Models.
Applsci 12 00848 g015
Table 1. Key Performance Indicators.
No.Key Performance Indicators (KPIs), Units, and Formulas
IndicatorFormula
1Passengers (persons)   Passengers
2Average aircraft on ground (%) Time   on   ground Simulation   time × 100 %
3Average aircraft availability (%)100%-Average Maintenance time (%)
4Average aircraft utilization rate (%)100%-Average aircraft on ground (%)
5Average flight request backlog (# requests) (   Request   without   aircraft   unit ) / Simulation   time
6Average flight request backlog (minutes) (   Periods   without   aircraft   unit   for   a   request ) / Simulation   time
7Average capacity utilization rate of vertiports (%) ( Aircraft   units   in   vertiport Vertiport   Capacity × 100 % ) / Simulation   time
8Average vertiports full (%) (   Periods   with   vertiport   full ) / Simulation   time
9Average vertiports empty (%) (   Periods   with   vertiport   empty ) / Simulation   time
10Average arrival backlog (aircraft units) (   Aircraft   units   waiting   for   landing ) / Simulation   time
11Average arrival backlog (minutes) (   Waiting   time   of   aircraft   units   for   landing ) / Simulation   time
Table 2. Simulation results for maintenance factor in a high demand scenario.
No.IndicatorHigh PerformanceLow Performance
1Passengers (# persons)68886720
2Average aircraft on ground (%)81.9982.43
3Average aircraft availability (%)98.772.2
4Average aircraft utilization rate (%)18.0117.57
5Average flight request backlog (# requests)6.18.2
6Average flight request backlog (minutes)8.3 10.3
7Average capacity utilization rate of vertiports (%)43 50
8Average vertiports full (%)14.7 20.3
9Average vertiports empty (%)14.1 11.8
10Average arrival backlog (aircraft units)10.4 12.5
11Average arrival backlog (minutes)5.8 7.6
Table 3. Simulation results for redistribution factor in a high demand scenario.
No.IndicatorRedistribution ModelNo Redistribution Model
1Passengers (# persons)68886773
2Average aircraft on ground (%)81.9982.29
3Average aircraft availability (%)98.798.7
4Average aircraft utilization rate (%)18.0117.71
5Average flight request backlog (# requests)6.125.7
6Average flight request backlog (minutes)8.3 12.9
7Average capacity utilization rate of vertiports (%)43 42
8Average vertiports full (%)14.7 28.3
9Average vertiports empty (%)14.1 28.4
10Average arrival backlog (aircraft units)10.4 47.9
11Average arrival backlog (minutes)5.8 9.9
Publisher’s Note: MDPI stays neutral with regard to jurisdictional claims in published maps and institutional affiliations.