Article

In Situ Microstructure Characterization of Potassium Di-Phosphate (KDP) Densification during Cold Sintering

1
Materials Measurement Science Division, National Institute of Standards and Technology, Gaithersburg, MD 20899, USA
2
X-ray Science Division, Argonne National Laboratory, Argonne, IL 60439, USA
*
Author to whom correspondence should be addressed.
Appl. Sci. 2022, 12(20), 10493; https://doi.org/10.3390/app122010493
Submission received: 8 September 2022 / Revised: 5 October 2022 / Accepted: 11 October 2022 / Published: 18 October 2022
(This article belongs to the Special Issue Multidimensional Additive Manufacturing)

Abstract

:

Featured Application

Ceramic additive manufacturing (AM) denotes an emerging group of advanced ceramic component manufacturing routes. Low energy densification of AM ceramic green bodies is highly desirable, and the cold sintering process (CSP) is a promising candidate, illustrated here by an in situ study of CSP for a model system, potassium di-phosphate (KDP).

Abstract

In order for ceramic additive manufacturing (AM) to achieve its full potential, it is increasingly important to develop a more rigorous understanding of fundamental phenomena that govern the kinetics and thermodynamics of ceramic AM processes. In the case of additive build processes, such as direct ink write and ceramic extrusion, methods for densifying the resulting green-body product need to be considered to complement the efficiencies of ceramics AM, itself. One densification route, at least for monolithic components, built layer-by-layer, is offered by the recently developed cold sintering process, whereby high-density final product is achieved through addition of a small amount of liquid solvent and application of modest uniaxial compressive stress at relatively low temperature. In situ small-angle X-ray scattering methods and X-ray diffraction have been applied to characterize and quantify the pore morphology evolution during cold sintering for a model system: potassium di-phosphate, KH2PO4 (KDP). It is shown that both temperature and applied stress affect the densification rate, but stress has a stronger effect on the evolving morphology. A regime with an approximate linear densification rate can be identified, yielding an effective densification activation energy of ≈90 kJ/mol.

Graphical Abstract

1. Introduction

Additive manufacturing methods offer enormous potential opportunities for computer-based digital-designed builds of complex multi-dimensional components comprised of metal alloy, polymer, ceramic, or composite materials [1]. Whereas the additive build processes for metal alloys, polymers, even composites, usually involve the melting of feedstock, additive processes for ceramics more frequently need to build green-body components from feedstock powders. These must then be subjected to de-binding and sintering post-processes [2,3]. Densification of ceramics is traditionally a high-temperature sintering process, sometimes also requiring high stresses, that can add very significantly to the energy requirements for the processing of final ceramic components. Densification processes that are less demanding in energy consumption are highly desirable, especially where these can be incorporated into post-processing for other advanced manufacturing methods, such as the case with ceramic additive-manufactured (AM) green bodies. The cold sintering process (CSP) was developed by Randall et al. [4,5] and can produce ceramic parts more than 95% dense at unusually low temperatures compared to conventional ceramic sintering. In CSP, water, an alkaline or acidic aqueous solution, or a non-aqueous organic solvent, is used to facilitate densification of a ceramic green body under uniaxial stress. In contrast to traditional high-temperature ceramic sintering processes (mass-diffusion controlled processes requiring temperatures that can approach the melting point), CSP temperatures offer reduced energy consumption hence reduced carbon emissions. Like ceramics AM in general, CSP can play a role in advanced manufacturing of ceramic materials if developed as a post-process densification step. Although originally demonstrated for metal oxides, CSP can now be applied to a wide range of ceramic systems, including non-oxides and has been applied to ceramic materials for applications that encompass composites, solid-state battery electrolytes, dielectrics, and various structural ceramics [6,7,8,9,10]. In this connection, it should be noted that while the application of uniaxial stress suggests finished components with planar or layered geometries, these can include components with gradient microstructures or composites with quite complex 3D morphologies, or layered structures with different melting temperatures.
Despite these successes, fundamental aspects of the cold sintering mechanisms remain unclear. While incongruous dissolution and reprecipitation of the ceramic phase in the presence of added liquid solvent is considered the dominant mechanism, other sintering modes such as viscous sintering may also play a role [11]. Furthermore, while a low-density high-defect phase has been shown to form between the ceramic grains during CSP both in potassium di-phosphate (studied here) [6] and in ZnO [12], it is not clear whether this phase densifies to full theoretical density during the later stages of CSP. In many cases, the onset and time scale for expulsion/evaporation of excess liquid solvent during CSP also remain uncertain [13]. Finally, the coexistence of multiple phenomena associated with densification can obfuscate the physical meaning of activation energy values extracted from Arrhenius analyses of the CSP temperature dependence at constant stress, based on a master sintering curve approach [14]. However, it is shown below that the temperature dependence of the densification rate during part of the CSP regime can be used to extract an effective activation energy with potential predictive capabilities at least for some aspects of CSP during densification of potassium di-phosphate.
In order to explore these issues, in situ ultra-small- and small-angle X-ray scattering (USAXS and SAXS) [15,16] methods have been applied to characterize the evolving pore morphology during CSP in a model ceramic system: potassium di-phosphate or KH2PO4 (KDP). USAXS and SAXS provide information on the pore/solid microstructure evolution while wide-angle X-ray scattering (WAXS) provides simultaneous structural information. Initial studies published previously [17], used an adapted compression stage. Its performance, with the applied stress and consequent sintering/densification somewhat stochastic in nature, was insufficient to provide results for systematically selected temperatures and stresses, but it was possible to capture various aspects of CSP. These early studies showed evidence of a core–shell void morphology over the early part of the sintering range, followed by a discrete regime in which excess pore fluid (water) was excluded, with a sharp transition from water saturated CSP to effective dry-state sintering. The present studies have been carried out in real-time under controlled conditions of temperature and uniaxial stress, utilizing a purpose-built cold sintering stage. The new stage with its optimized uniaxial stress control, together with a new feedstock particle morphology, has enabled CSP phenomena to be studied under a range of controlled stress and temperature conditions. The new sample morphology and a higher water content to aid the cold sintering have resulted in a significantly higher scattering background that masks the previous direct observation of core–shell pore features in the scattering. Nevertheless, the core–shell features can be modeled, based on residual variation of the scattering profile and an assumption of an equivalent shell thickness for both the nanoscale and macroscale pore populations. Due to the more efficient and smooth operation of the customized CSP stage, as well as the higher water content, the previously observed sharp transition from wet to dry conditions during densification is replaced by progressive removal of fluid as densification proceeds.
KDP has been shown to densify readily under CSP conditions [5] even though it cannot be densified at conventional sintering temperatures since it decomposes well below those required for conventional sintering. However, with its relative molecular mass of 136.09 and theoretical density of 2.34 g/cm3, use of KDP as a model material for CSP allows absorption and multiple scattering effects of the X-ray beam to be minimized for the available beam line X-ray energy while using a sample thickness sufficient to be compatible with the in situ uniaxial stress geometry requirements for CSP. In this paper, we describe in situ CSP studies using the new custom-built instrumented CSP stage. Results are presented after checking the CSP process visually using a lab-based video camera, through microstructure and structure evaluation using synchrotron-based SAXS and WAXS (XRD) measurements. Results are presented in regard to the evolving residual pore morphology as densification progresses for CSP experiments carried out at three different temperatures (40 °C, 50 °C, 60 °C) and two applied uniaxial compressive stresses, p (100 MPa and 125 MPa) with one additional experiment conducted at 60 °C with 150 MPa). The results are discussed both in terms of the temperature- and stress-dependence for CSP of KDP, and in terms of the more fundamental questions underlying CSP phenomena raised above, including the applicability of potential Arrhenius analysis to at least some aspects of CSP. The potential for extending these methods to a broader range of technologically applicable systems is also briefly considered.

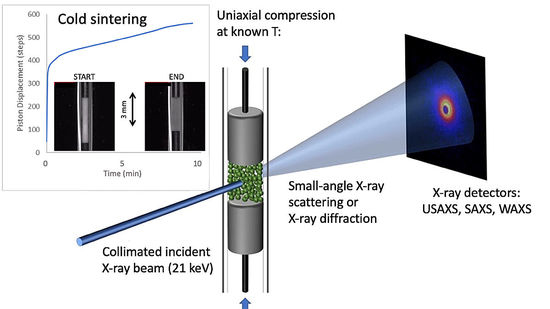
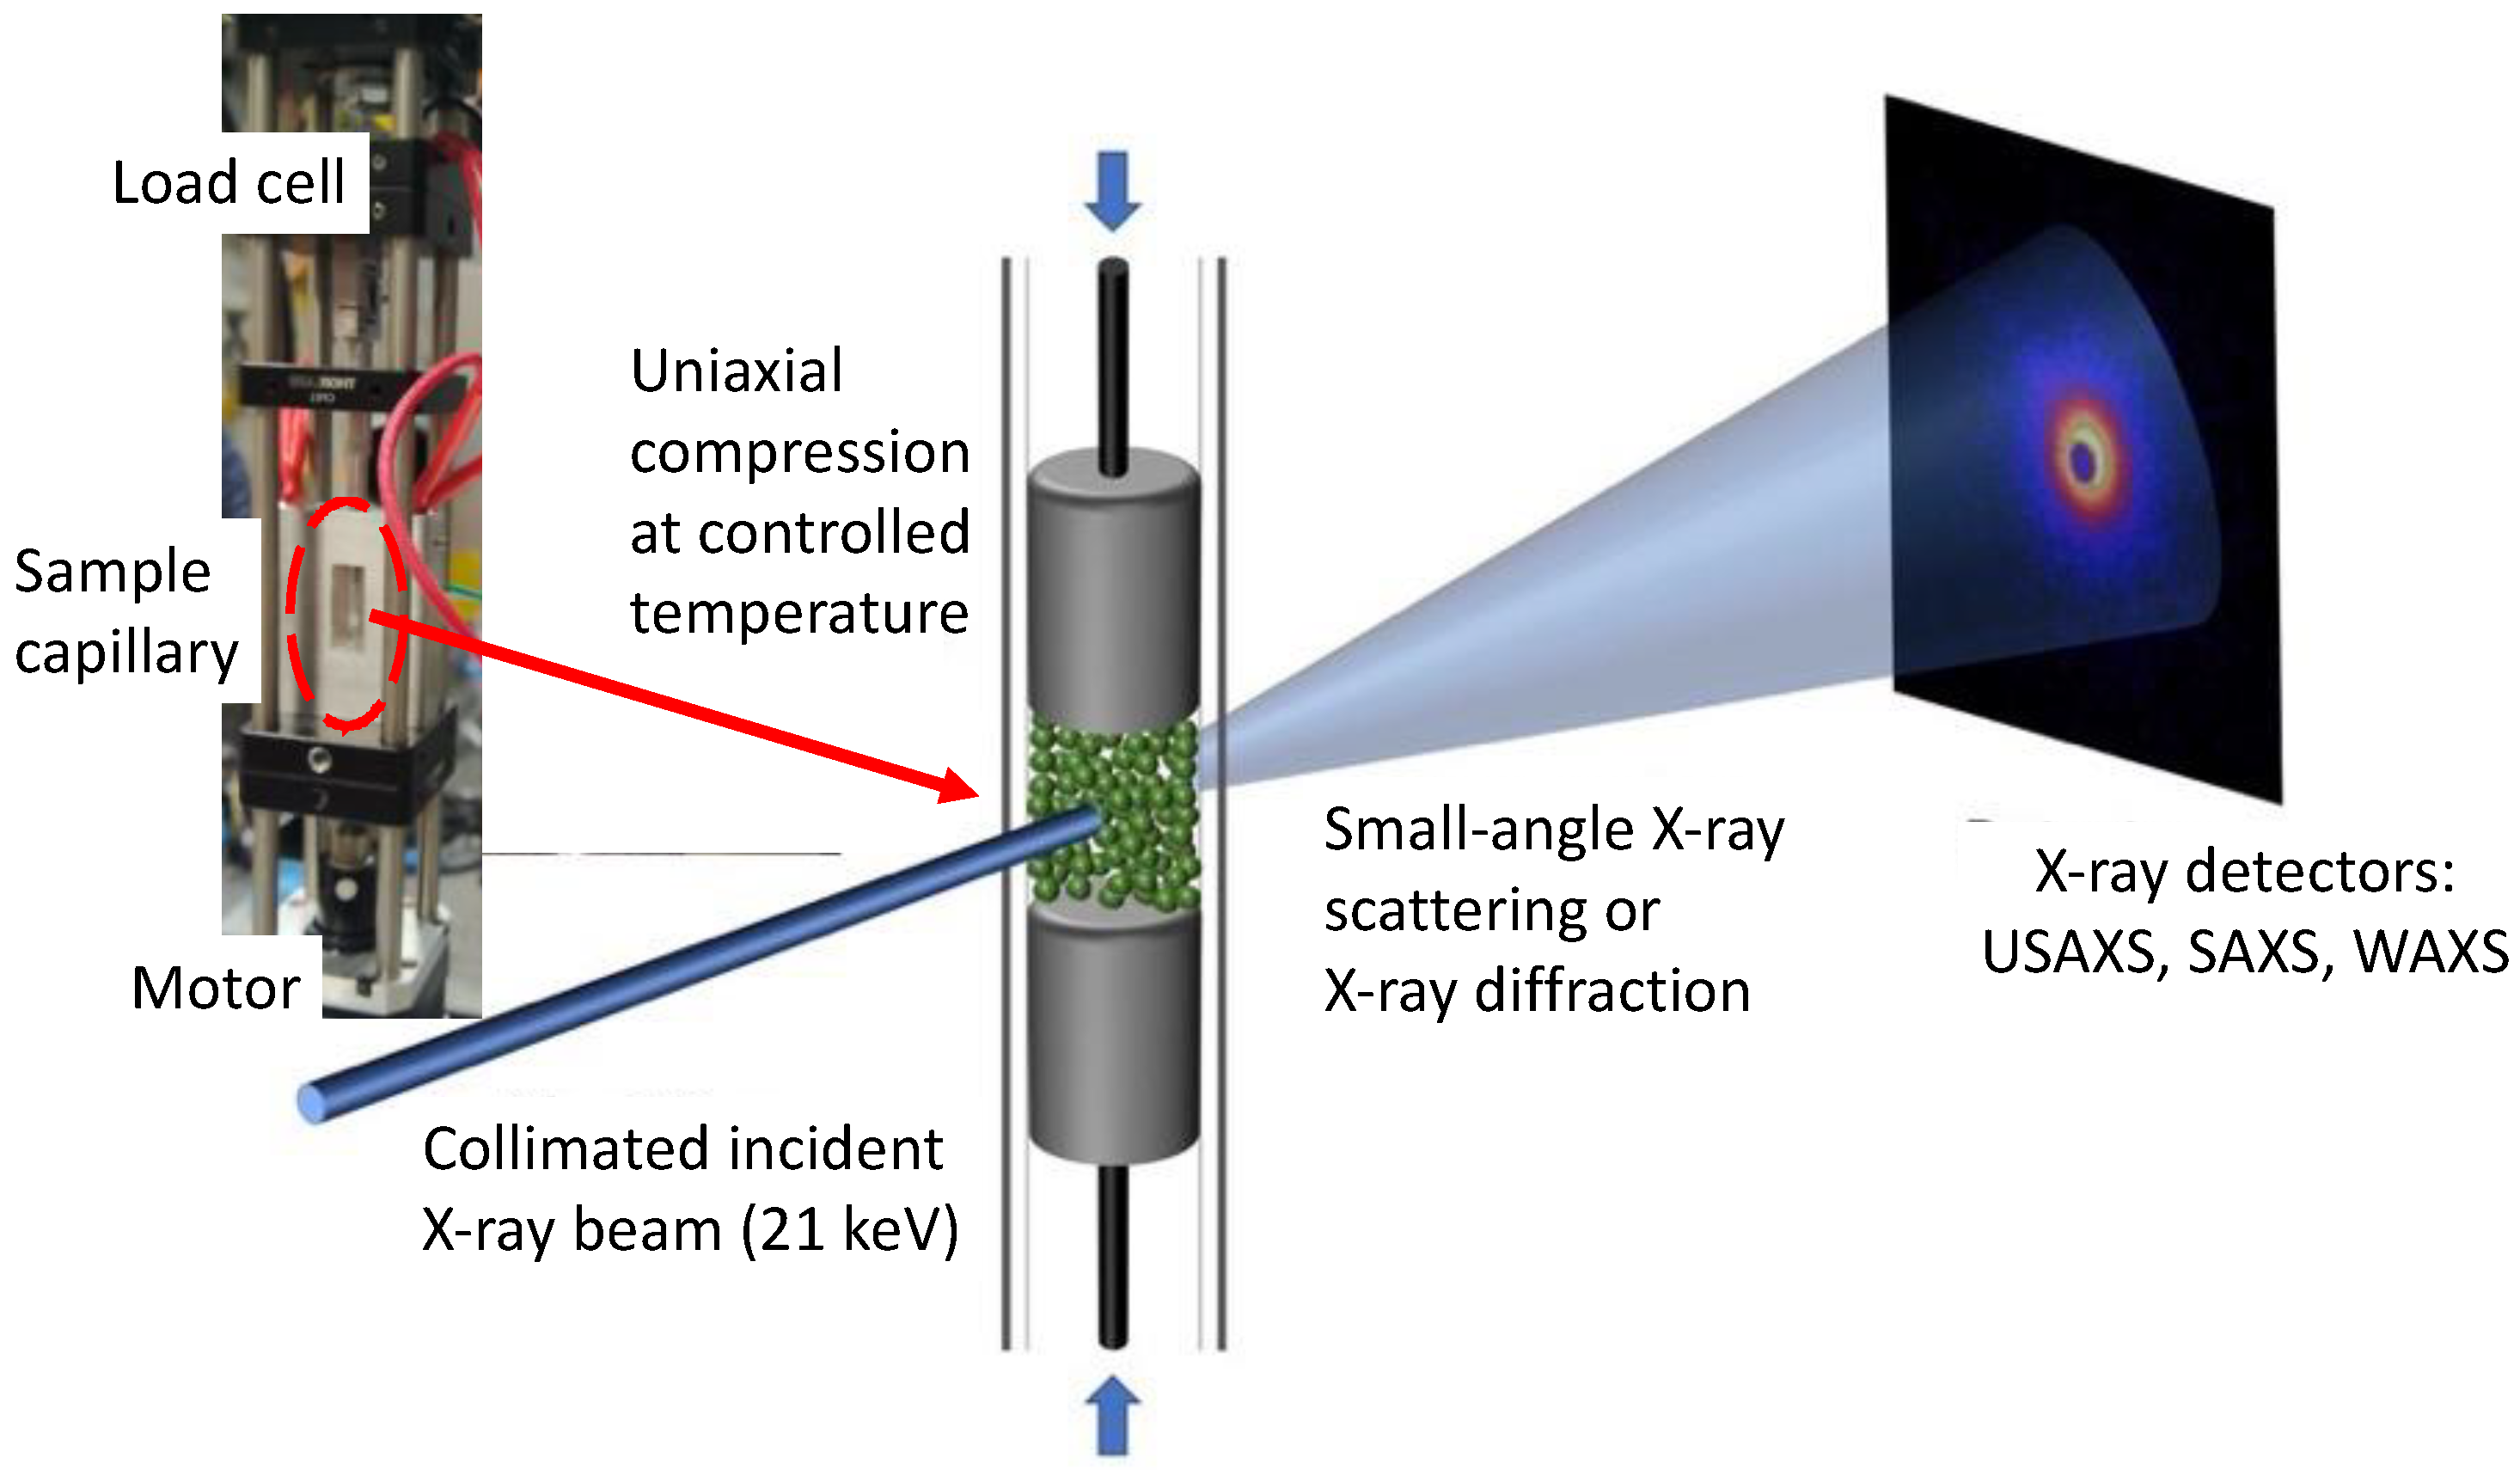
2. Materials and Methods

For the present experiments, high-purity potassium di-phosphate KH2PO4 (KDP) feedstock material was obtained from Sigma Aldrich (ACS reagent, ≥99.0%, CAS Number: 7778-77-0, Sigma Aldrich, St. Louis, MO, USA) (Certain commercial products are identified in this paper to specify the materials used and the procedures employed. In no case does such identification imply endorsement or recommendation by the National Institute of Standards and Technology, nor does it indicate that the products are necessarily the best available for the purpose.). The as-received powder was milled dry without a solvent using a high energy planetary mill. While the resulting powder retains a small fraction of coarse macroscale particles within the mix, most of the powder particle volume is sub-micrometer in size. The fine particle size, combined with the large volume fraction of water mixed with the powder prior to cold sintering (20% mass, 46.8% volume of deionized water) results in a smooth CSP densification process, with water or water vapor progressively released from each end of the sample capillary as densification progresses. This feedstock differs from that used in our earlier studies (KDP powder catalog no. P285, >95% mass pure from Thermo Fisher Scientific Inc., Fair Lawn, NJ, USA, used as received for CSP tests with addition of deionized water at 5% mass). The previous material, used with a much smaller water addition, gave rise to a lower X-ray scattering background and allowed direct observation of X-ray scattering features associated with core–shell effects in fine pores between the KDP grains [17]. Here, the higher water fraction and associated scattering background [18], especially when increased by presence of dissolved or low-density KDP, precluded such direct observation but allowed for a better controlled and smoother CSP process. Core-shell effects could be accommodated in the model fitting to the scattering data by assuming a single time-dependent core shell thickness for all pores in the microstructure.
Prior to each CSP measurement, deionized water was added to KDP powder at 20% mass to form a small sample pellet. The pellet was pushed into a 0.75 mm internal diameter quartz capillary, which was then mounted between two pistons within the customized, heated cold sintering stage. Using calibrated heating coils and thermocouple, motor and load cell, force was applied to one of the pistons to generate controlled uniaxial compressive stresses at pre-set temperatures. Load cell accuracy was rated as within ±1 N (±2.3 MPa uniaxial stress) and the temperature was calibrated to within ±1 °C. Figure 1 shows the visual change in the sample during CSP under two different uniaxial stress and temperature conditions. The time dependence of the piston movement is also shown in each case. Following a rapid initial powder consolidation step, a regime of linear densification is revealed, followed by an extended period of slow incremental densification, associated with forcing residual porosity and aqueous fluid out of the system. The samples were found to be well-sintered at the end of each run, despite the different time scales involved. Figure 2 shows schematically the arrangement of the CSP cell in the X-ray beam for X-ray scattering and diffraction measurements.
In situ X-ray studies of CSP were carried out at the USAXS facility, sector 9-ID of the Advanced Photon Source (APS), Argonne National Laboratory, Argonne, IL. As described elsewhere [15,16], complete USAXS, SAXS and WAXS (XRD) measurements can be made in less than 5 min at this facility without disturbing the sample geometry. The scattering and diffracted intensity data, I(q), were measured as a function of q = (4π/λ) sinθ, where λ is the X-ray wavelength (0.05904 nm for the 21 keV X-rays used here) and θ is one half of the scattering or diffraction angle. Due to the Bonse-Hart crystal diffraction optics underlying the USAXS measurement configuration, USAXS data are intrinsically slit-smeared. While the data can be de-smeared, the de-smearing step introduces noise artifacts into the data and it is preferable to slit-smear the SAXS data before merging with the USAXS data and fit a slit-smeared model to the combined slit-smeared data. Here, slit-smeared USAXS and sector-averaged SAXS data were reduced and absolute-intensity calibrated using the USAXS facility analysis software macro suite: Indra, Irena and Nika, written in Igor Pro (Wavemetrics Inc., Lake Oswego, OR, USA) [19,20]. Corresponding USAXS and SAXS datasets were merged to form a contiguous small-angle scattering dataset for absolute-intensity-calibrated I(q) versus q over the q range: 0.001 nm−1 < q < 17 nm−1. The practical maximum q for scattering was ≈3 nm−1 for there to be significant SAXS signal above the scattering background. However, the first XRD peak (101) was also captured in the SAXS data at q = 12.37 nm−1. WAXS data were reduced separately, also using the above USAXS facility software macro suite, to provide XRD data in the range 13 nm−1 < q < 63 nm−1. Figure 3a presents combined USAXS/SAXS I(q) versus q datasets for KDP CSP using p = 125 MPa at 60 °C, presented on a log-log plot. Figure 3b presents the corresponding WAXS data (combined with the high-q part of the SAXS datasets to capture the XRD 101 peak) on a linear-linear plot. As detailed below, the USAXS/SAXS data were subjected to microstructural model fitting to characterize the evolving pore morphology during CSP, while the XRD data were inspected to detect the presence of reprecipitated nanoscale material and/or the transient appearance of metastable phases during CSP.
In situ USAXS/SAXS/WAXS CSP studies were carried out under the following conditions of uniaxial compression and temperature: p = 100 MPa at 40 °C, 50 °C and 60 °C; p = 125 MPa at 40 °C, 50 °C and 60 °C, and finally p = 150 MPa at 60 °C. A further comparison of the runs using all 3 compressions at 60 °C was also carried out. The small-angle scattering was assumed to arise primarily from the evolving pore morphology of the densifying sample and required a 3-component microstructure model to fit the data. The 3 components comprised (i) coarse voids (porosity) between the KDP powder grains; (ii) fine nanoscale pores where multiple grains meet, and where active dissolution and re-precipitation of KDP is most likely to occur; and (iii) semi-dense dissolved and re-precipitated solid KDP material at sintered junctions between grains, possibly containing a high concentration of vacancy defects. For (i) and (ii), it is assumed that the pore-space is filled with water due to the large water content in the system. Unlike what was found in the earlier studies, there was no obvious point during CSP where it could be assumed that all pore fluid had been removed. With each of (i) and (ii), it was assumed that the “matrix” external to the pores is fully dense KDP, but that a layer exists around each pore of low-density KDP, representing dissolved and re-precipitated, high-defect density material, possibly also with hydrogenous content. Here, it was assumed that the thickness of this shell layer was the same for all pores (all solid/pore interfaces) for both macropores and nanoscale pores but was allowed to vary with time during CSP. Constraining the core–shell thickness to be the same for (i) and (ii) differs from the assumption made in our earlier study [17], necessitated by the higher background scattering masking the more complete observation of core–shell features possible previously. The 3rd component assumed to be present is also low-density high-defect KDP, dissolved and re-precipitated between sintered KDP powder grains. This component is assumed to be nanoscale in thickness, no longer associated necessarily with porosity, hence likely to be water-free. All 3 of these components were needed to fit the data.
For convenience, all 3 components were assumed to have a lognormal volume-fraction size distribution (a commonly used, analytically accessible, size distribution assumption in small-angle scattering); the pore populations, (i) and (ii), were assumed globular in nature with a core–shell structure (water-filled pore body, low-density KDP around the perimeter), and the standalone low-density KDP was assumed cylindrical in nature with both needle-like or sheet-like shapes allowed during fitting. Table 1 summarizes these morphology assumptions with the X-ray scattering length (atomic form-factor) density (SLD) derived from published X-ray form-factor tables [21]. The X-ray SLD values shown in Table 1 assume the medium outside of all scattering features to be fully dense KDP, and the pores (both (i) and (ii)) to have water-filled cores. The solid shell around each pore is assumed to have an SLD value mid-way between water and fully dense KDP, based on the shell phase having many vacant defects potentially occupied by H2O molecules. The low-density KDP phase (iii), not associated with pores, is assumed to be 50% dense KDP, with vacant defects not occupied by H2O molecules. Some evidence for the formation of a low-density high-defect solid phase during CSP has been revealed in transmission electron microscopy (TEM) studies of various CSP systems [22]. Here, while inevitably over-simplifying the true situation somewhat, these overall assumptions provide a caliper for quantifying changes in the evolving pore morphology during CSP.
Typical 3-component fits to the combined USAXS/SAXS data are shown in Figure S1 of the Supplementary Materials. These are shown both for the slit-smeared data and, equivalently, after desmearing the data, which amplifies the statistical scatter. Figure S2 of the Supplementary Materials shows how each component typically contributes to the overall model fit, and also presents the 3 lognormal size distribution components, themselves, from which the results presented below have been derived. The applicability of using lognormal size distribution analysis to small angle scattering measurements is well established, e.g., [23]. Fits to the smoother slit-smeared data have been conducted for the remainder of this study. The in situ slit-smeared USAXS/SAXS datasets, used for model fitting, are presented in Figures S3–S5 of the Supplementary Materials.
Finally, scanning electron microscopy (SEM) was conducted on densified samples following CSP under the two conditions presented in Figure 1 (50 MPa, 60 °C, 100 min; and 150 MPa, 60 °C, 10 min). SEM was performed on both the external (uncut) surfaces and fracture surfaces of the densified KDP samples using a JEOL 7100-FT FE-SEM (JEOL Peabody, MA, USA). The main objective of the SEM studies was to evaluate the degree of grain growth occurring during CSP.

3. Results

Here, results are presented from model-fitting the reduced and calibrated combined USAXS/SAXS data, first for the representative pore/grain morphology evolution during densification by CSP, then for the core–shell morphology and inferred presence of a high-defect, low-density KDP component, and finally results from the corresponding WAXS (XRD) data for KDP, also measured in situ during CSP, based on full analyses of selected datasets as needed to capture the representative time variations.

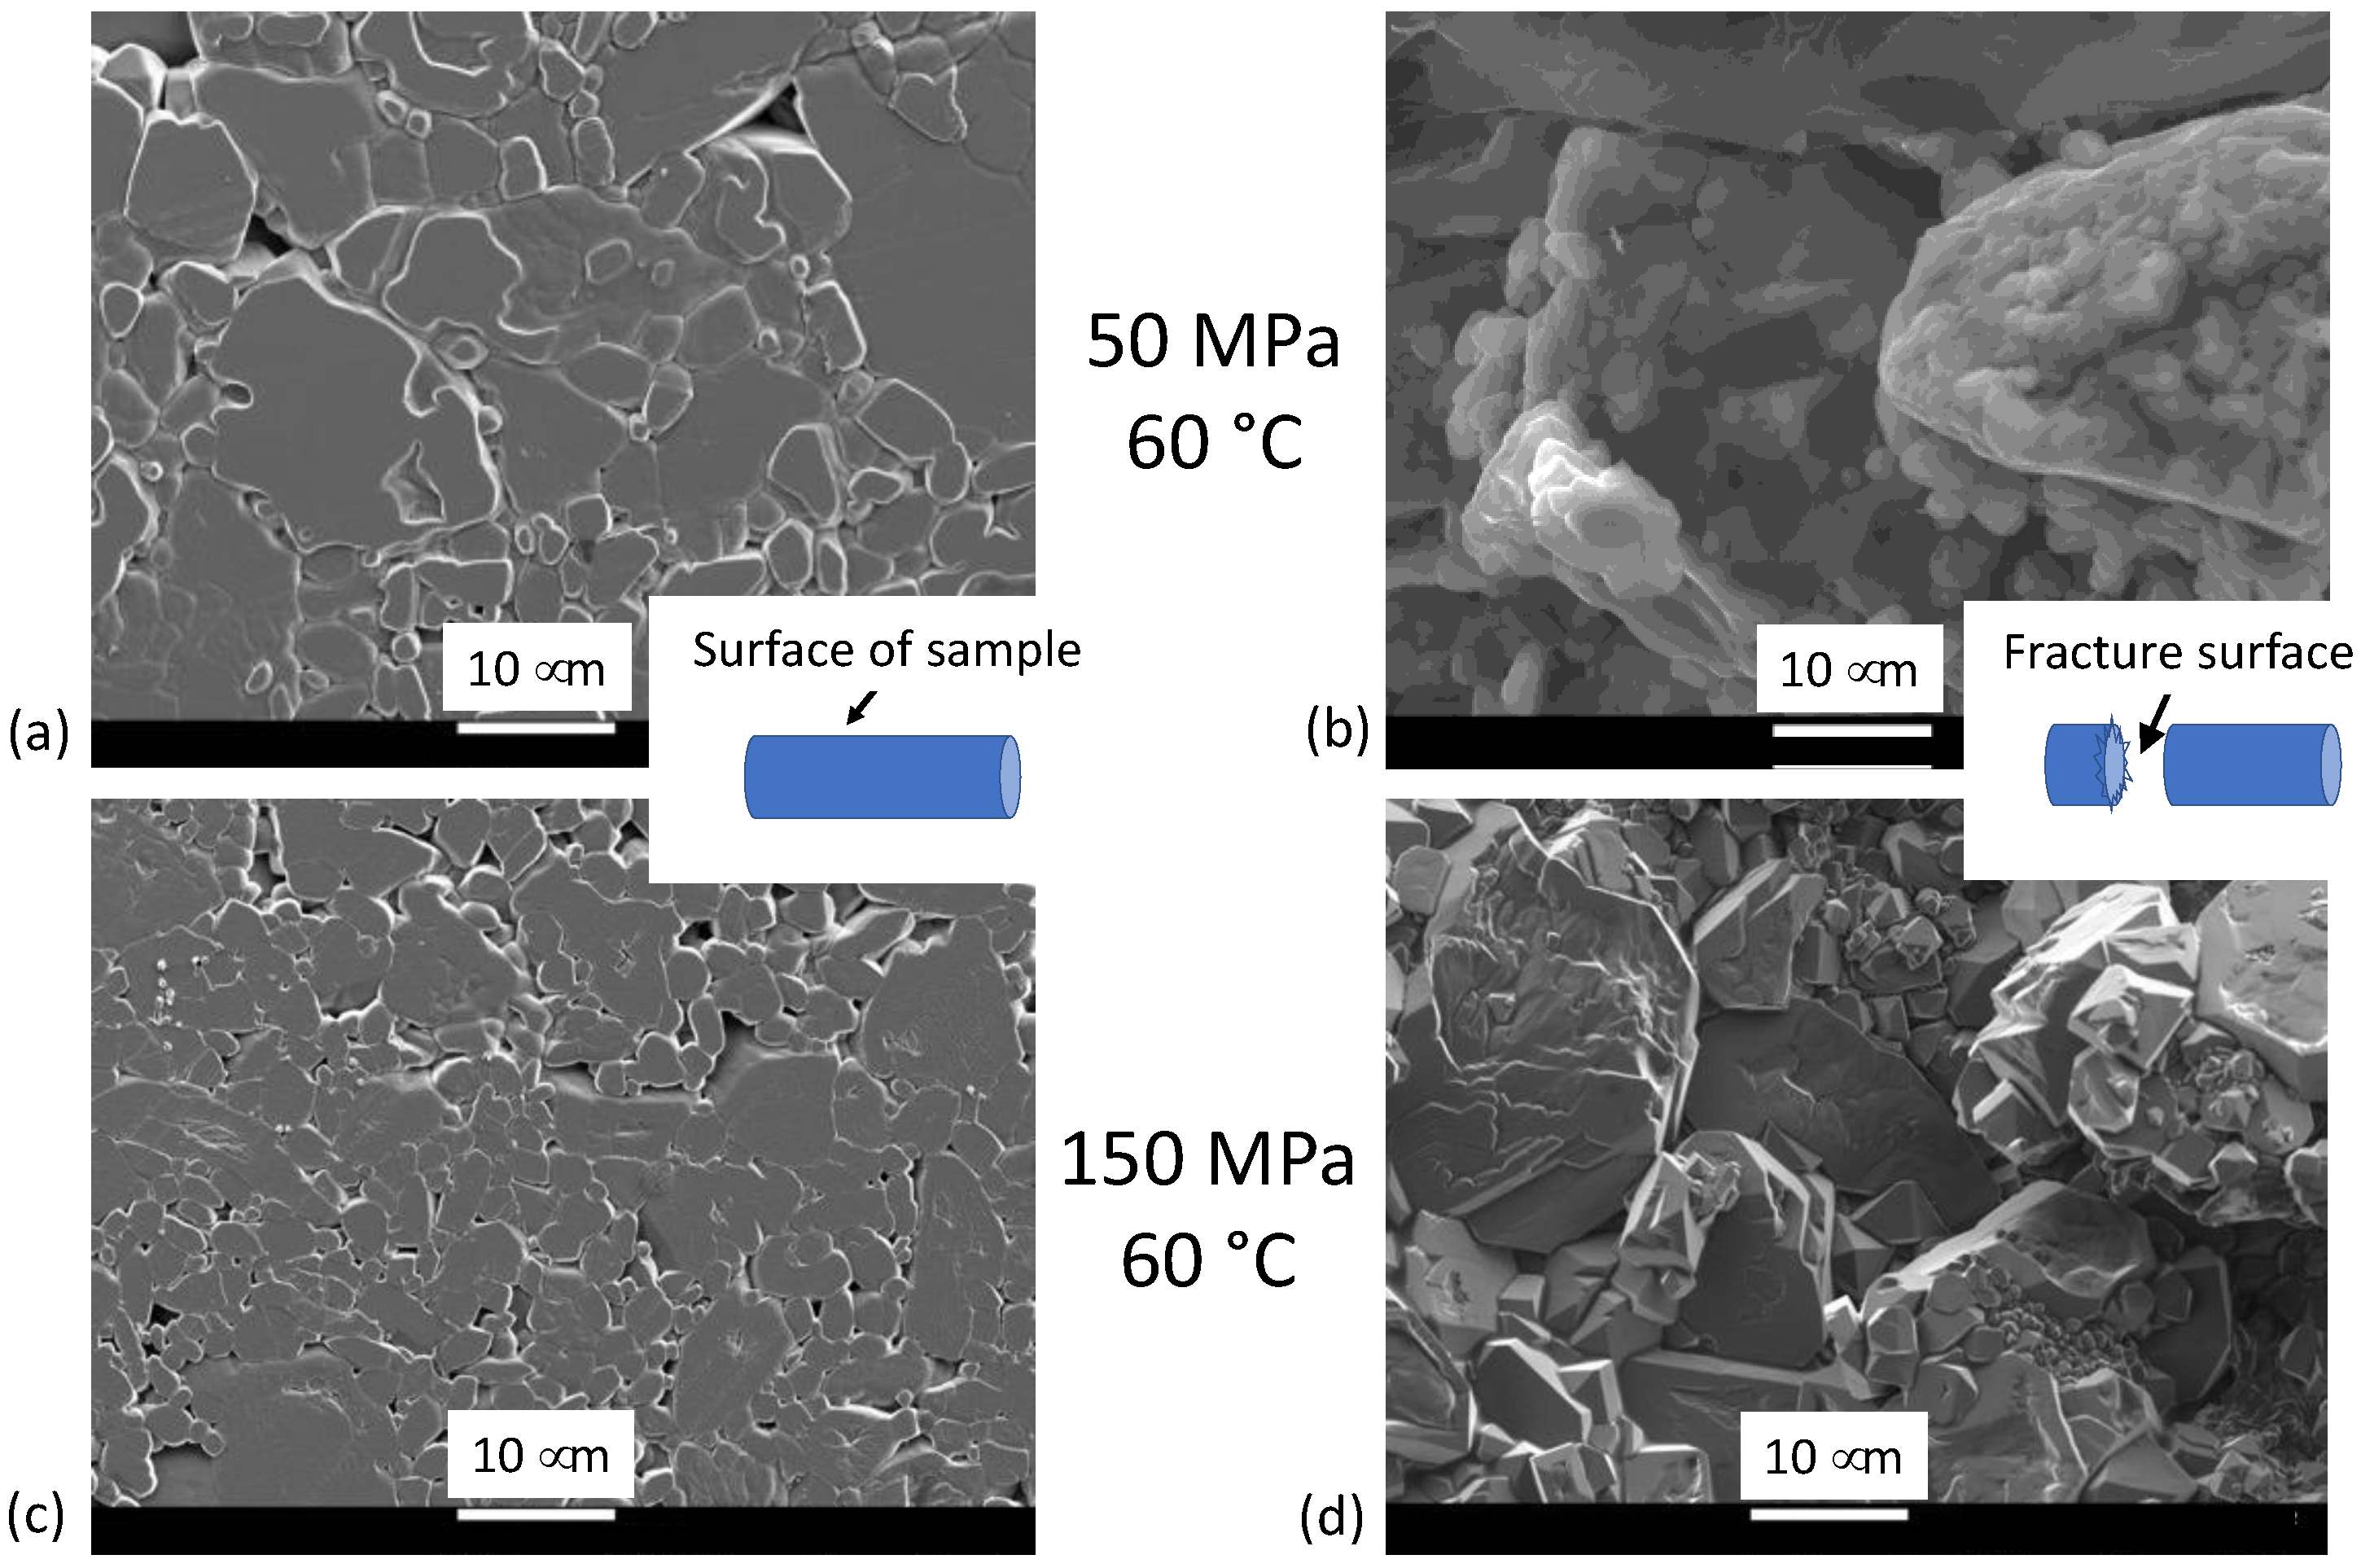
3.1. Pore/Grain Morphology Evolution during CSP

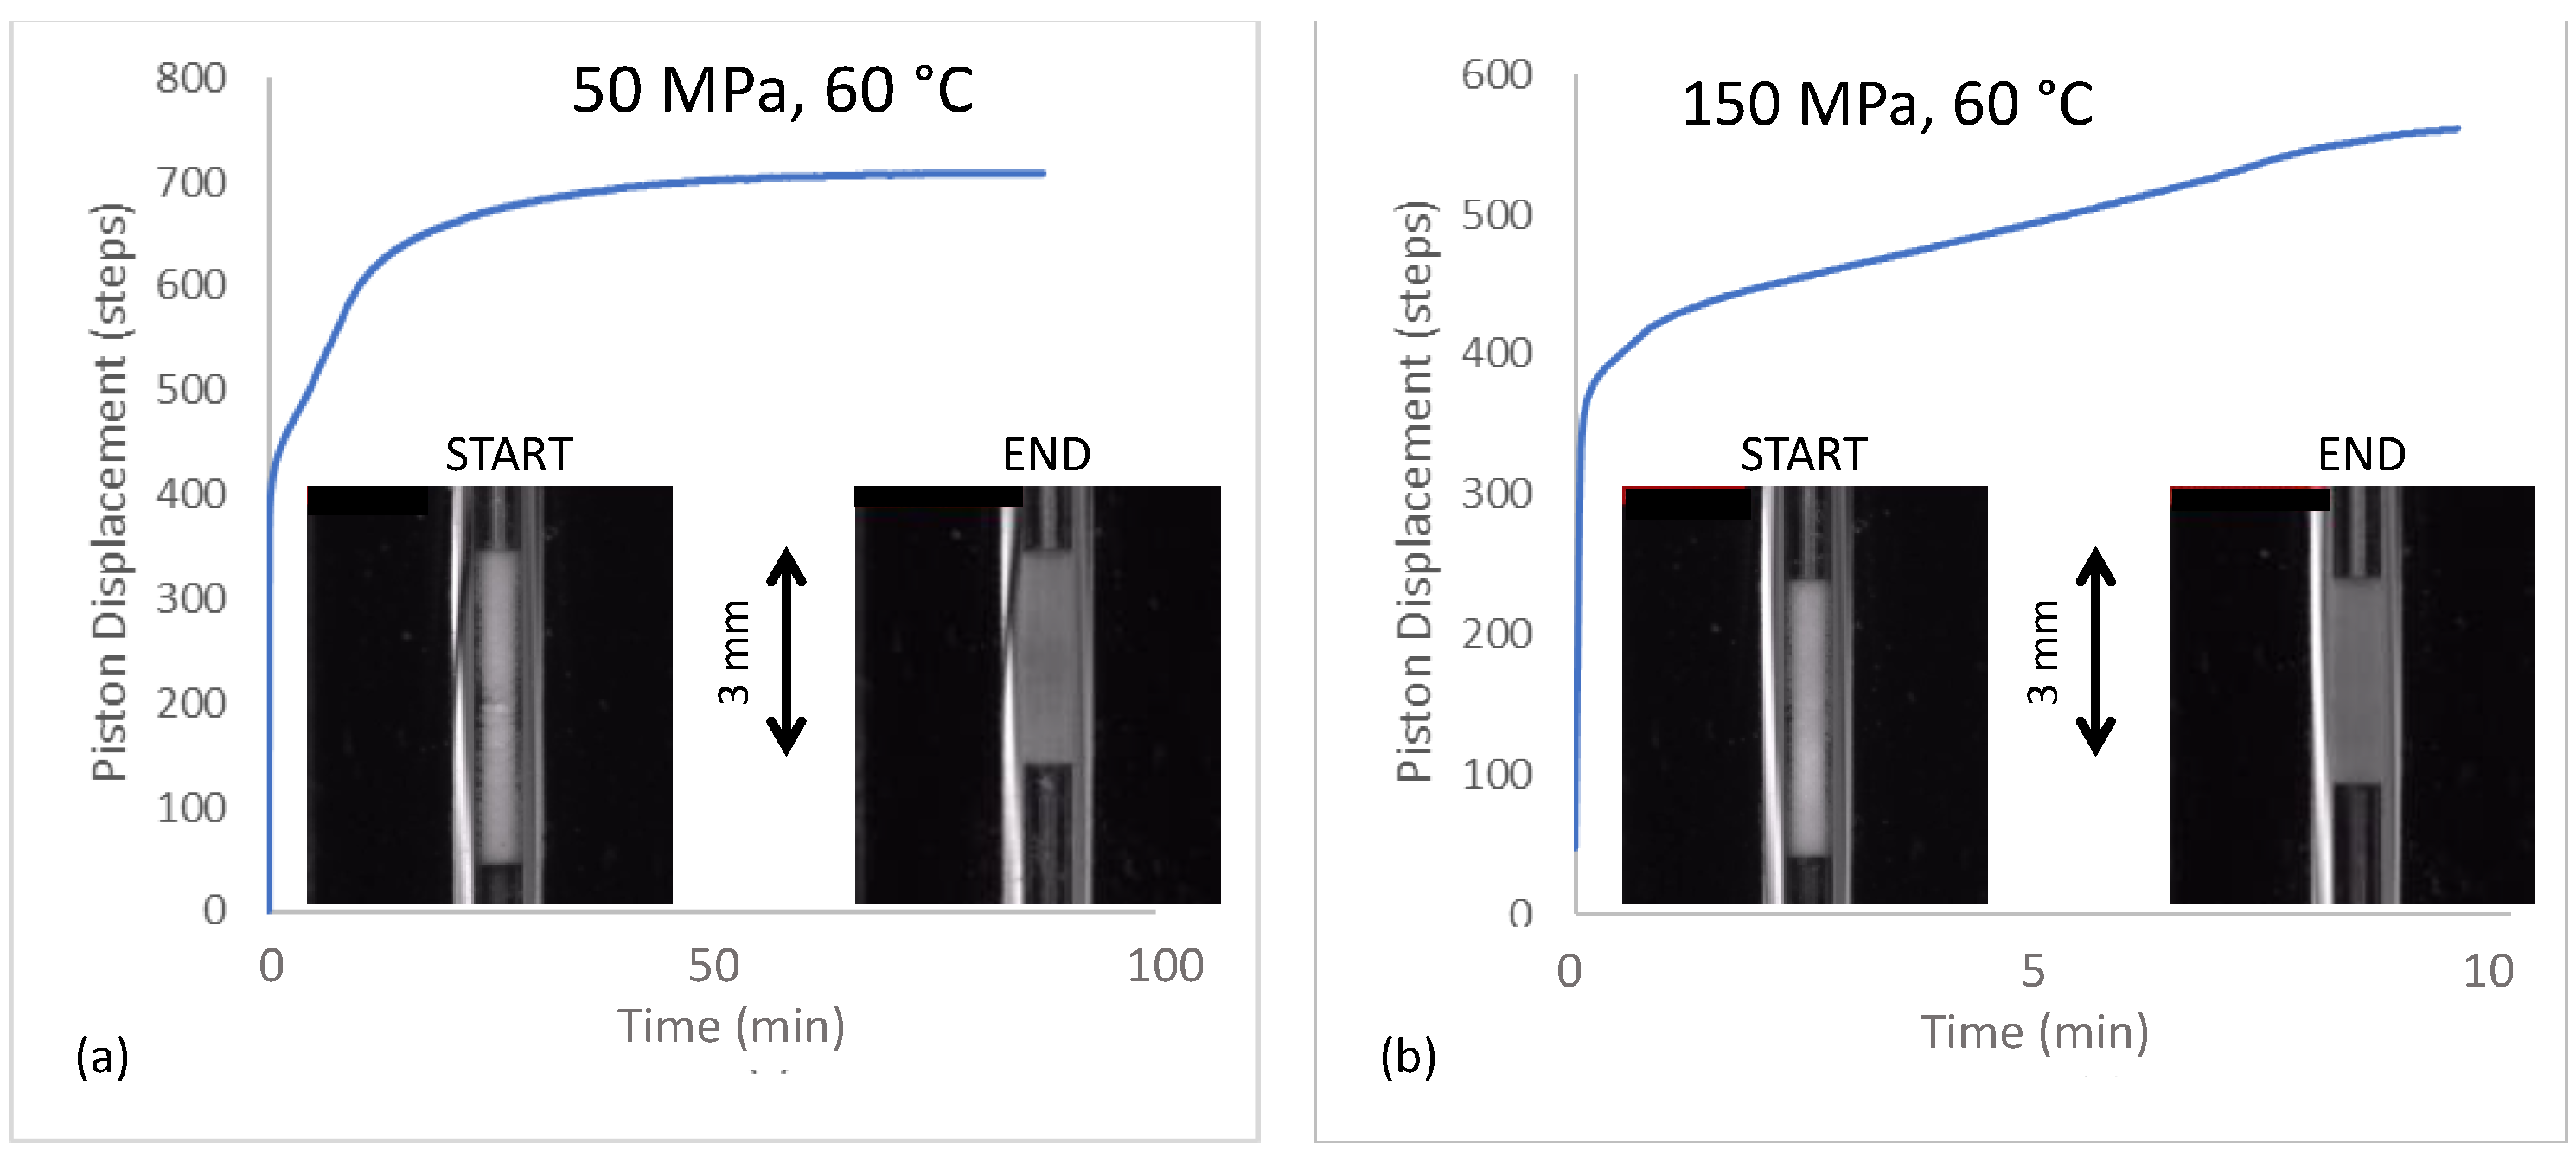
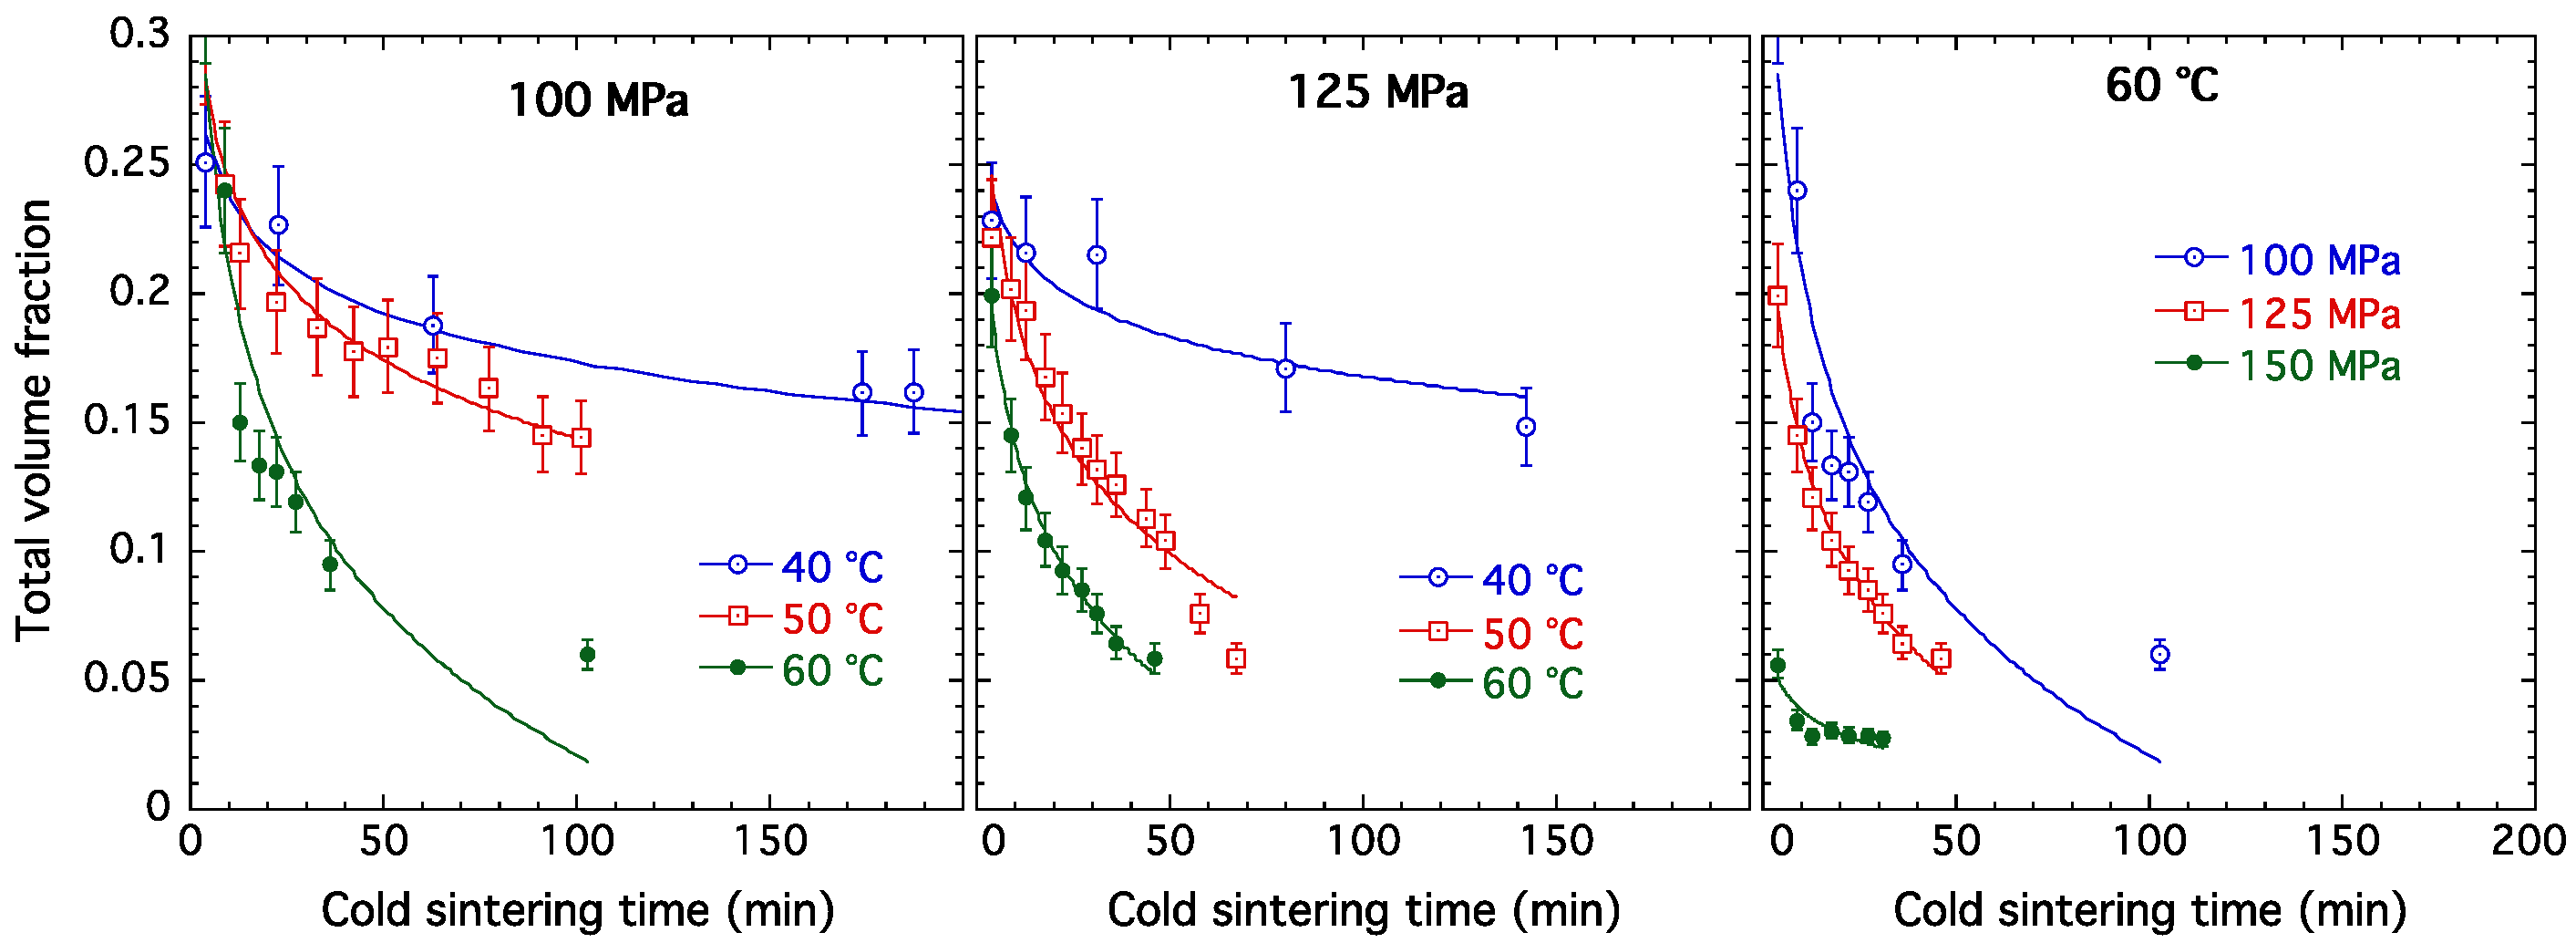
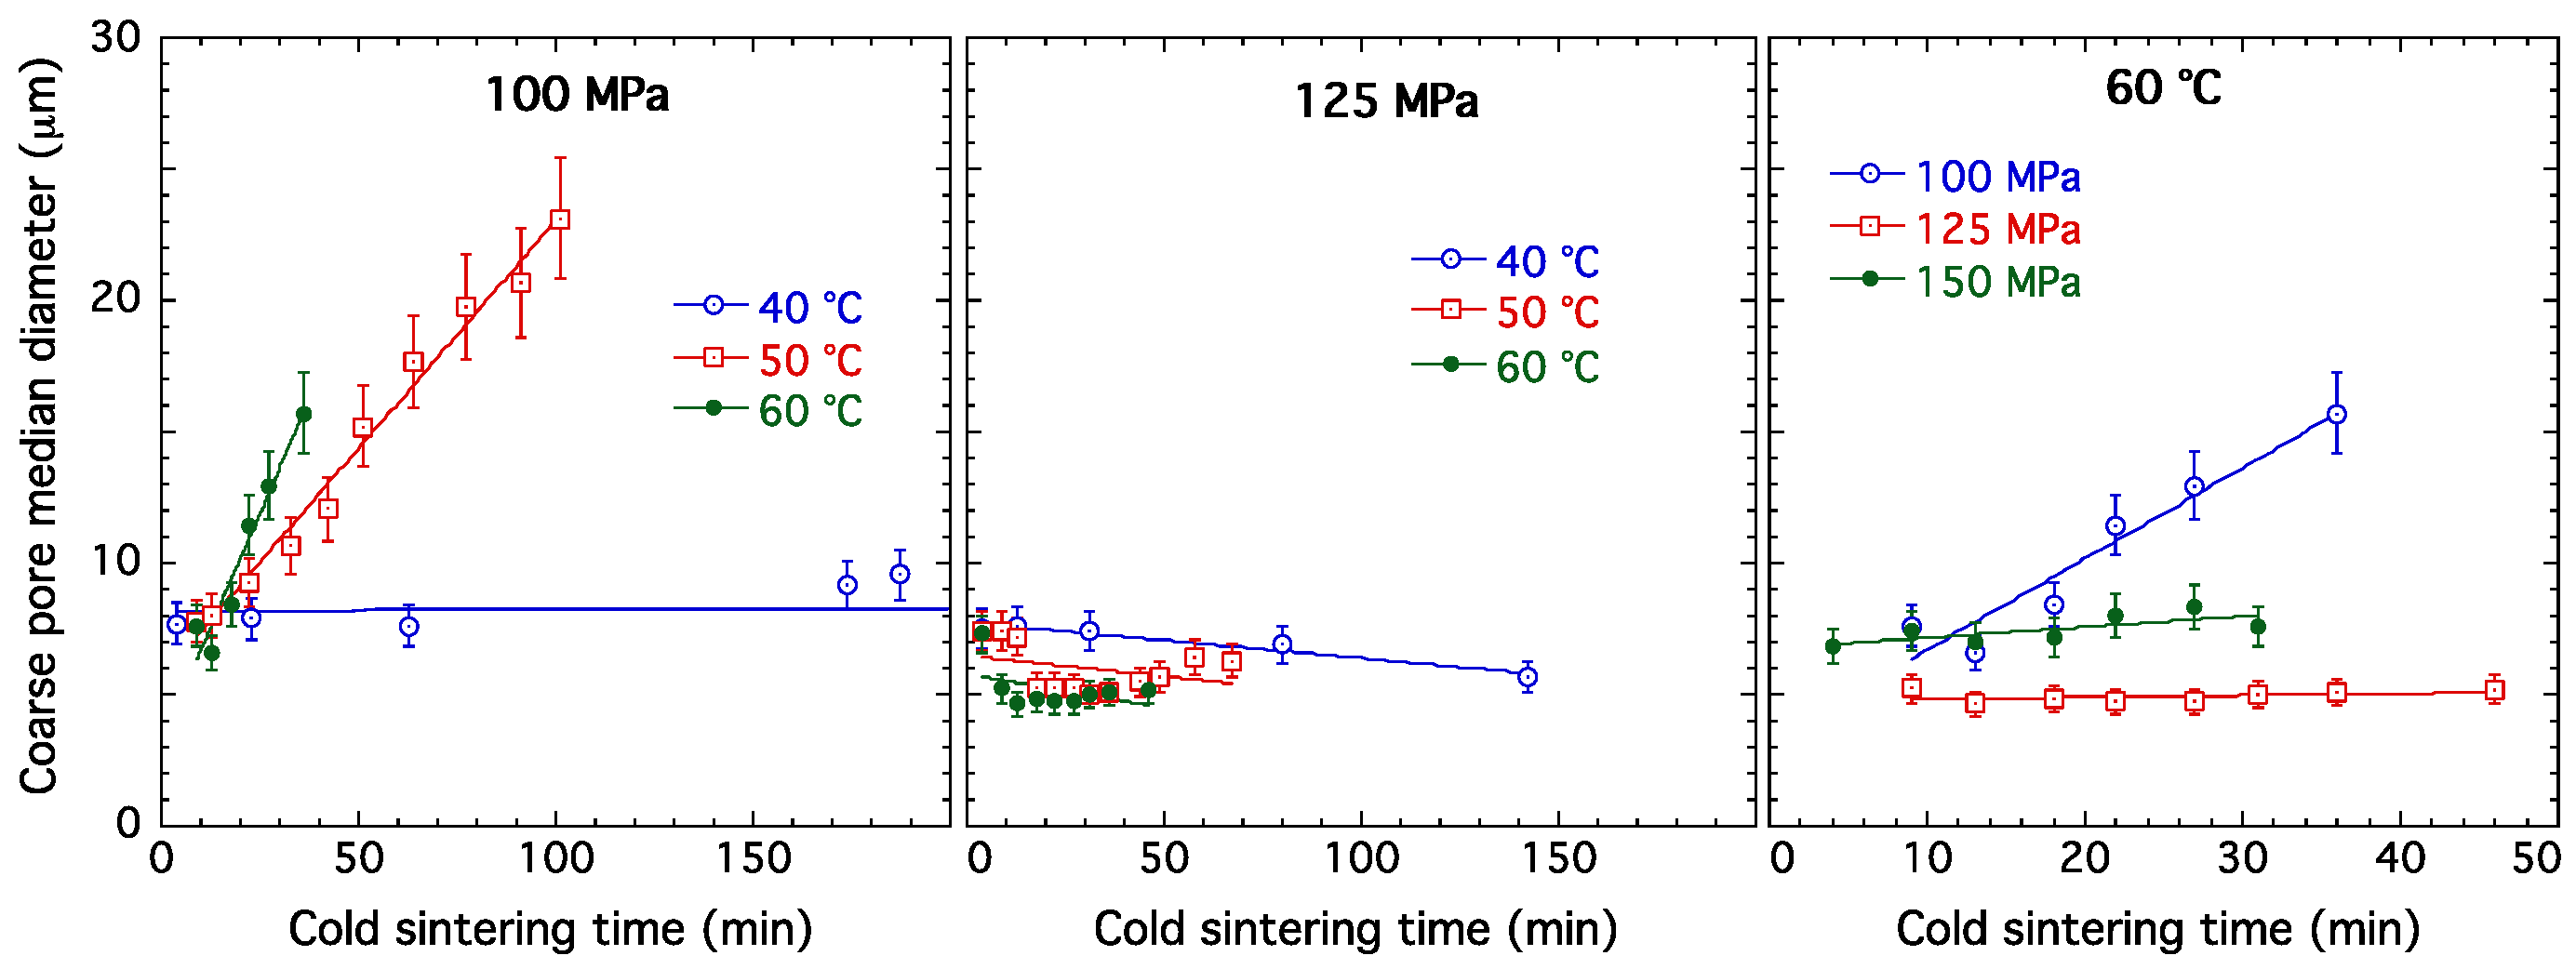
3.1.1. Coarse (Macroscale) Pore Population and Densification

Figure 4 presents the variation with cold sintering time of the combined volume fractions of the lognormal pore components representing the macroscopic coarse pores separating powder grains and the separate population of nanoscale pores near triple-point contacts, etc. (populations (i) and (ii) defined above). As indicated below, this total porosity is dominated by the macroscopic pores, which represent more than 98% of the pore volume. The rate and degree of reduction in total porosity (densification) is clearly a function of both temperature and compressive pressure, p. At 40 °C, loss of porosity and densification by CSP is only partially effective with either p = 100 MPa or p = 125 MPa. At 50 °C, this is still the case for p = 100 MPa, but densification is significantly more effective with p = 125 MPa applied compression. At 60 °C, densification appears to be effective at all 3 compressive stresses: p = 100 MPa, 125 MPa, and 150 MPa. (Additionally, see Figure 1) Indeed, densification at 60 °C for p = 150 MPa seems too fast to be captured properly with the real-time resolution of these experiments.
Figure 5 presents the variation in coarse pore (macropore) median diameter versus cold sintering time. It should be emphasized that these median diameters have been derived from the lognormal size distributions for the coarse pore component fitted to the scattering data. Diameters greater than ≈10 μm imply some significant extrapolation beyond the maximum size that can be measured directly from USAXS data but do emerge from the model fitting. Nevertheless, these variations of the derived coarse pore median diameter with cold sintering time can be used as a measure of how the representative pore diameter changes during CSP. (The median diameter is used because it is at least smaller than the mean diameter.) Note that coarsening of the median or mean pore diameter does not necessarily mean that individual pores become coarser, but more likely implies the loss of finer pores from the distribution due to sintering (and of course the porosities do decrease during sintering). Nevertheless, it is reasonable to associate the mean size of the remaining pores with the mean grain size. In this connection, it is noted that CSP with p = 125 MPa or 150 MPa produces no significant coarsening of the pore size distribution. With p = 100 MPa, significant coarsening of the median pore diameter is indicated at 50 °C and even more so at 60 °C, but there is no coarsening at 40 °C. Comparison of Figure 5 with Figure 4 indicates that significant loss of porosity and densification occurs in all cases (even if not always fully effective as discussed above). While globular pores have been assumed here for convenience, CSP, like other sintering processes [13,24], seems to cause large pores to flatten and become more oblate with their larger dimensions remaining representative of neighboring grain sizes that may or may not coarsen during sintering. The progressive flattening of the pore shape implies a reduction in pore volume, and hence densification of the sample. With KDP, there appears to be grain coarsening at higher temperatures (50 °C, 60 °C) for a lower compression (p = 100 MPa).

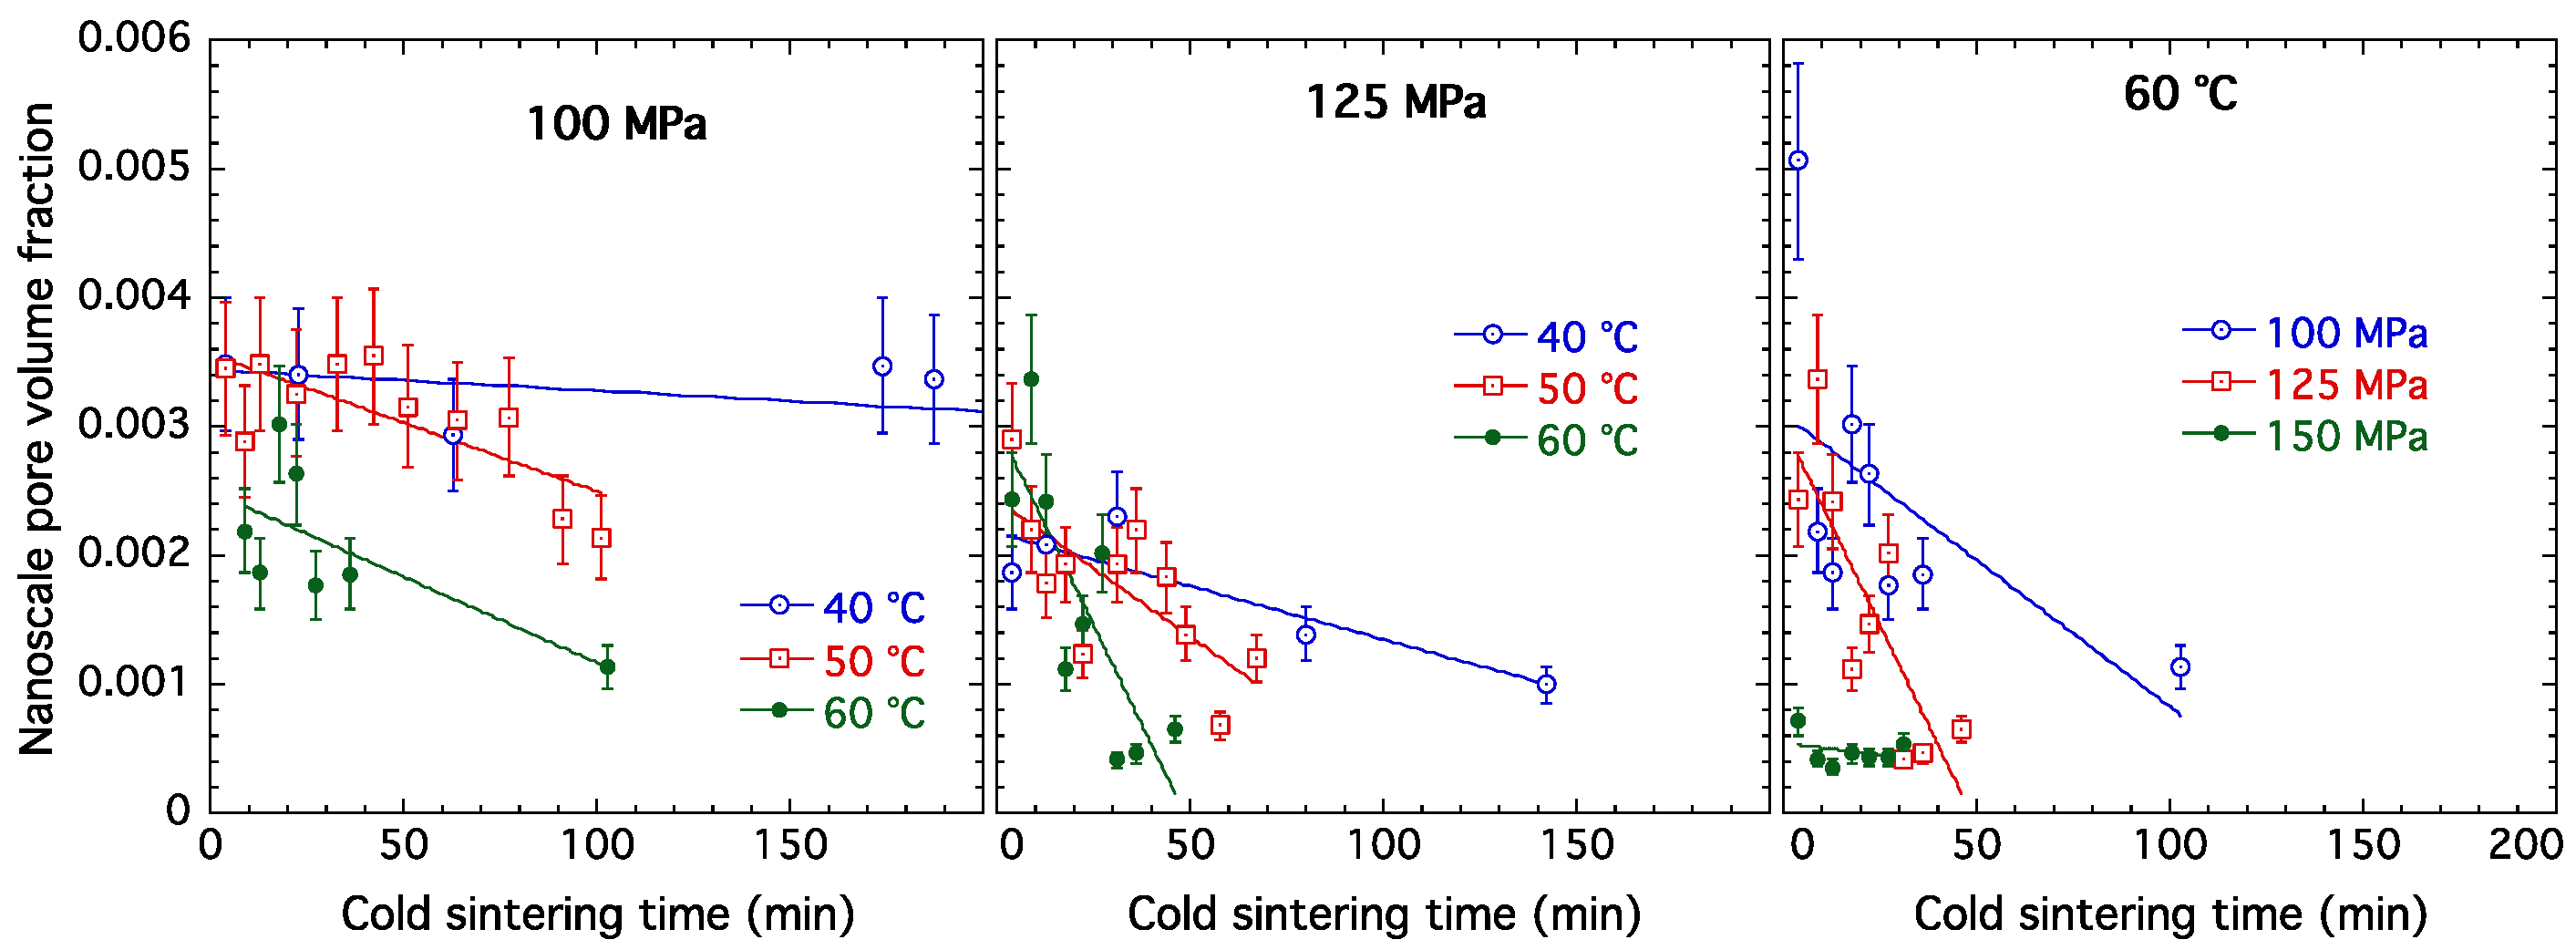
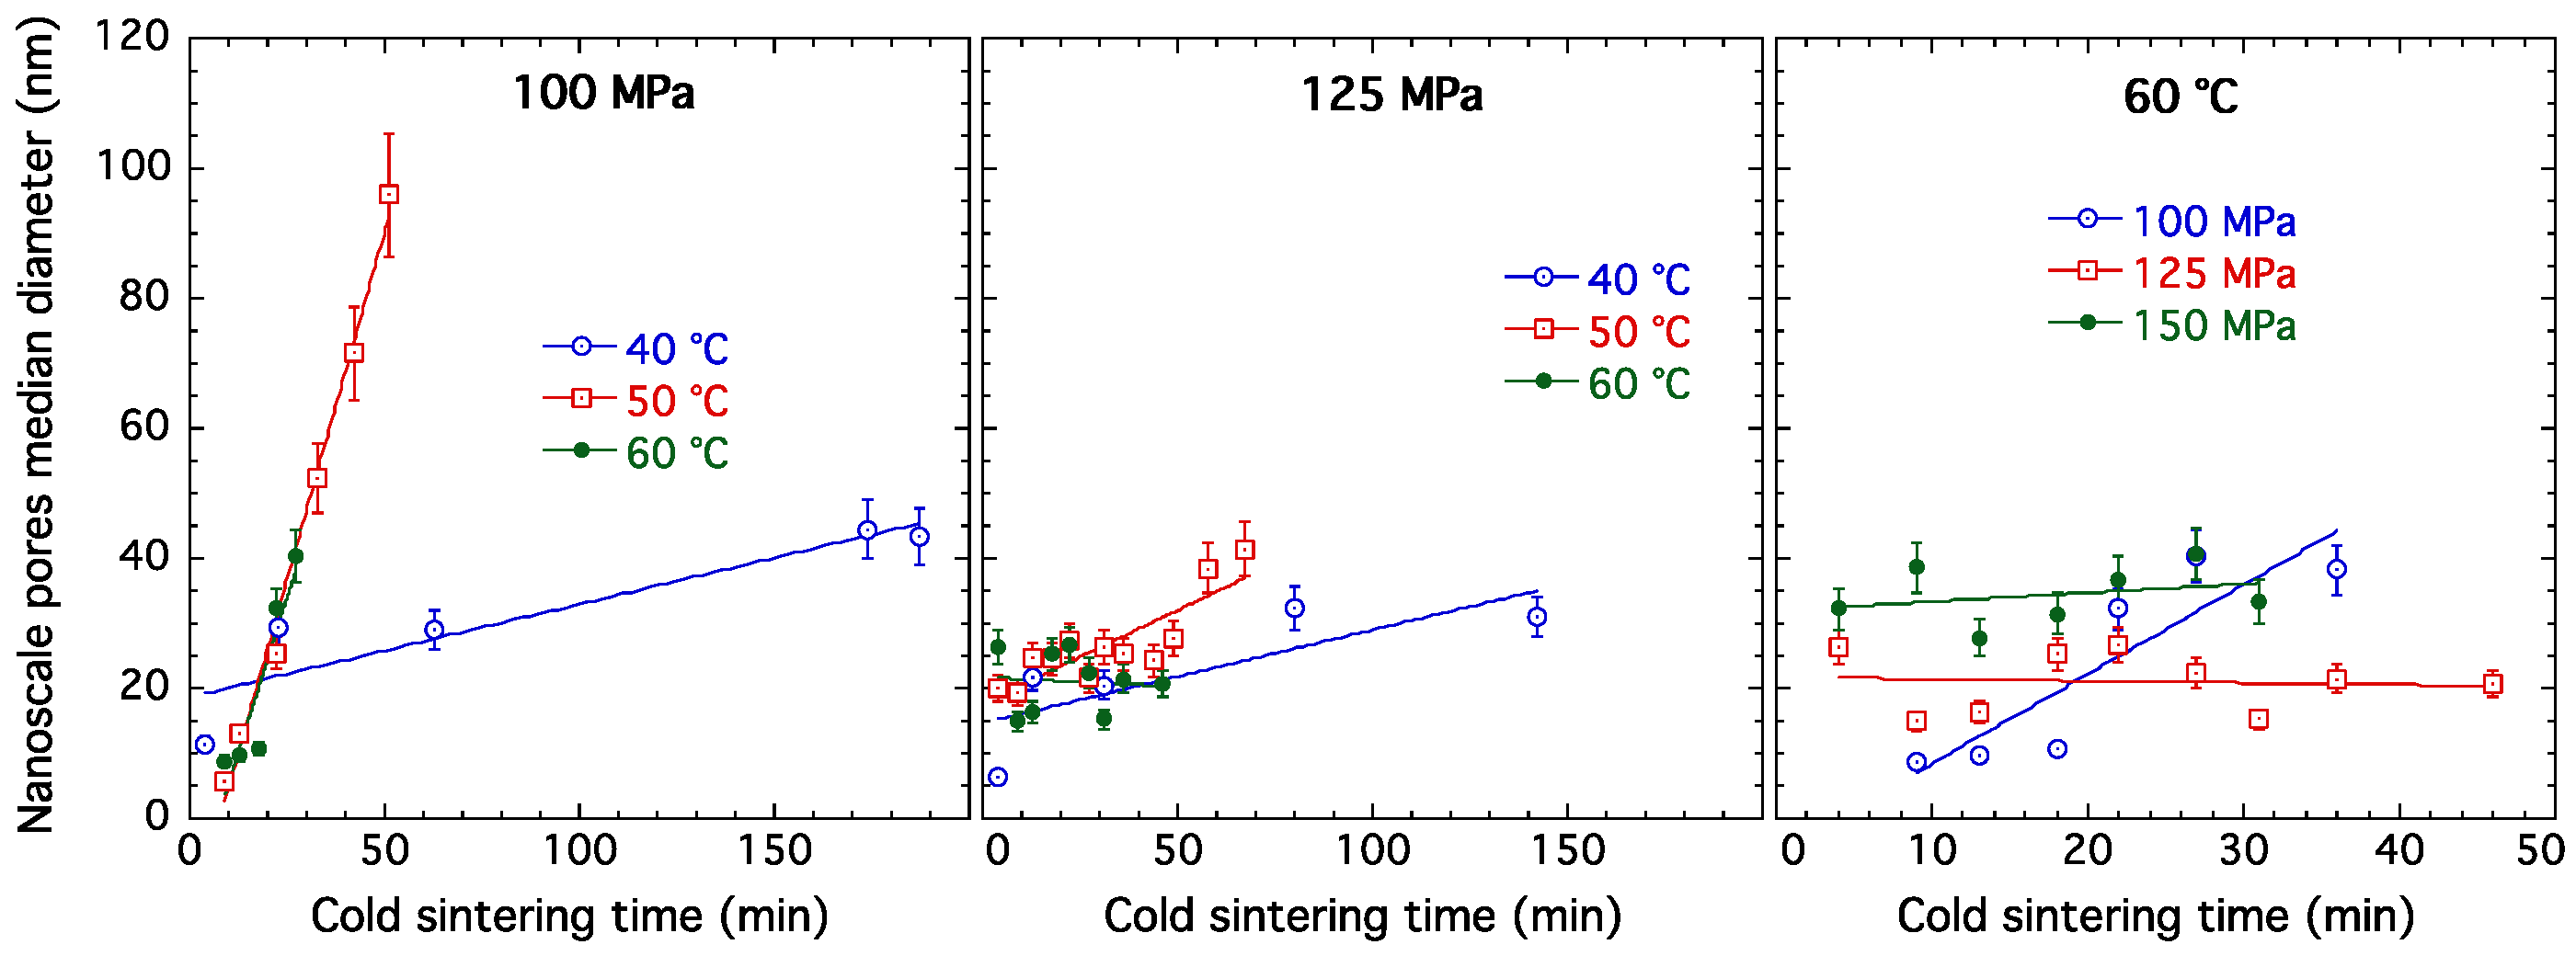
3.1.2. Fine (Nanoscale) Pore Population

Figure 6 presents the variation with cold sintering time of the volume fraction of the lognormal pore component representing just the population of nanoscale pores. The uncertainties (vertical bars) represent estimated standard uncertainties again resulting from some stochastics in the CSP stage, but also somewhat more prominently here reflecting the uncertainties in extracting the nanoscale component volume fraction from the fits. This is also reflected in the data scatter of the points plotted in Figure 6. Note that the nanoscale pore volume fraction is typically 1% to 2% of the total pore volume fractions presented in Figure 4. As with the coarse macroscopic, hence total, pore volume fractions, the nanoscale volume fraction is assumed to include the shell layer of low-density KDP surrounding each pore at the pore/solid interface. Although showing more data-point scatter than seen in Figure 4, the general trends are similar. At 40 °C, the loss of nanoscale pores is negligible with p = 100 MPa, and only slight with p = 125 MPa. At 50 °C, there is some loss of nanoscale porosity with p = 100 MPa, but more with p = 125 MPa. At 60 °C, nanoscale porosity is removed at all 3 compressive stresses used. Once more, the loss of nanoscale pore volume at 60 °C with p = 150 MPa occurs too rapidly to be captured properly with the real-time resolution of these experiments.
Figure 7 presents the variation in nanoscale pore mean diameter versus cold sintering time. A globular pore shape is again assumed for simplicity but, in this case, the mean diameter refers to the core diameter of the pore, excluding the shell thickness of low density KDP material that is discussed further below. These trends also echo to some extent those observed for the macropore diameters presented in Figure 5. Note that CSP with p = 125 MPa or 150 MPa produces little or no significant coarsening of the nanopore pore population. With p = 100 MPa, significant coarsening of the nanoscale pore mean diameter is indicated at 50 °C and even more so at 60 °C, but only slight coarsening is observed at 40 °C. These results suggest that the nanoscale pore population, although identified as a distinct population from the main macropore population, is nevertheless influenced by grain coarsening effects in a similar way. One important distinction between the macropores and the nanopores is that the shell thickness of low-density KDP phase is negligible compared to the macropore dimensions but, for much of the CSP duration, it is significant compared to the core dimensions of the nanopores (as indicated below).

3.1.3. Grain Morphology Changes during CSP

Figure 8 shows SEM pictures of the sample surfaces, both intact exterior surfaces and fracture surfaces for samples subjected to the same CSP conditions as shown in the photographs of Figure 1. Some of the sintered grain dimensions for KDP subjected to CSP with p = 50 MPa at 60 °C appear as small as 10 μm, but there is clear evidence of grain coarsening to 20 μm to 30 μm, and beyond. While these exact conditions were not used in the in situ USAXS/SAXS/WAXS studies, the SEM observations are consistent with expectations based on the macropore median diameter results for CSP with p = 100 MPa at 60 °C, shown in Figure 5. By contrast, the sintered grain dimensions discernible for KDP subjected to CSP with p = 150 MPa at 60 °C, do not appear to have coarsened to the same degree, and indeed appear broadly consistent with the macropore median diameter remaining below 10 μm for this condition, as indicated in Figure 5. The SEM pictures of the fracture surfaces confirm the grain coarsening for the p = 50 MPa at 60 °C case, but also reveal the multiple facetted fracture interfaces opened up between the KDP grains, especially in the p = 150 MPa at 60 °C case. This observation is consistent with such fracture, even at a local level, resulting in a dramatic increase in the USAXS/SAXS scattering intensity, and a departure from the progressively decreasing scattering intensity associated with densification during CSP—as shown for the p = 150 MPa at 60 °C case presented in Figure S5 of the Supplementary Materials.

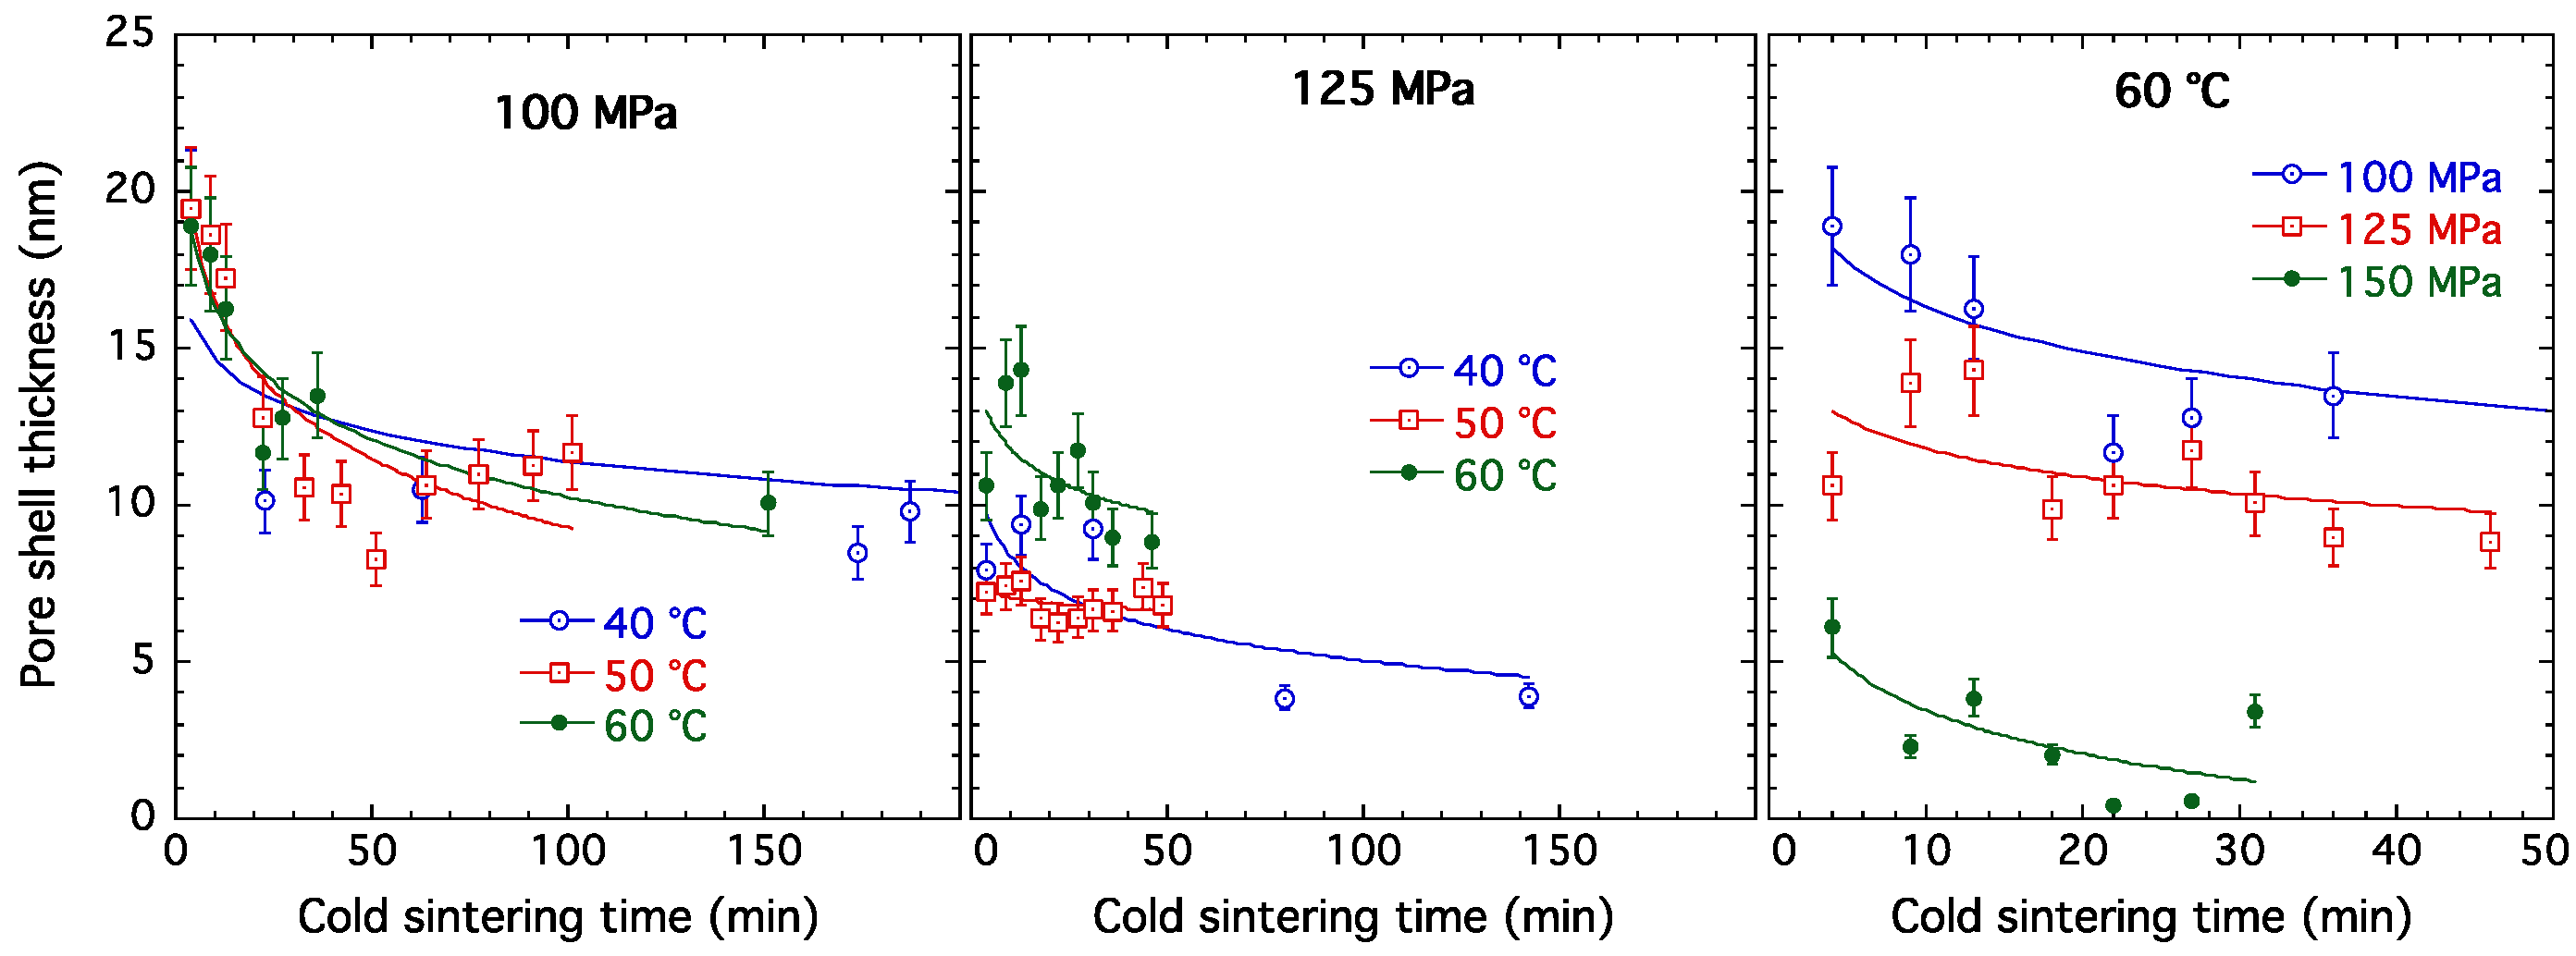
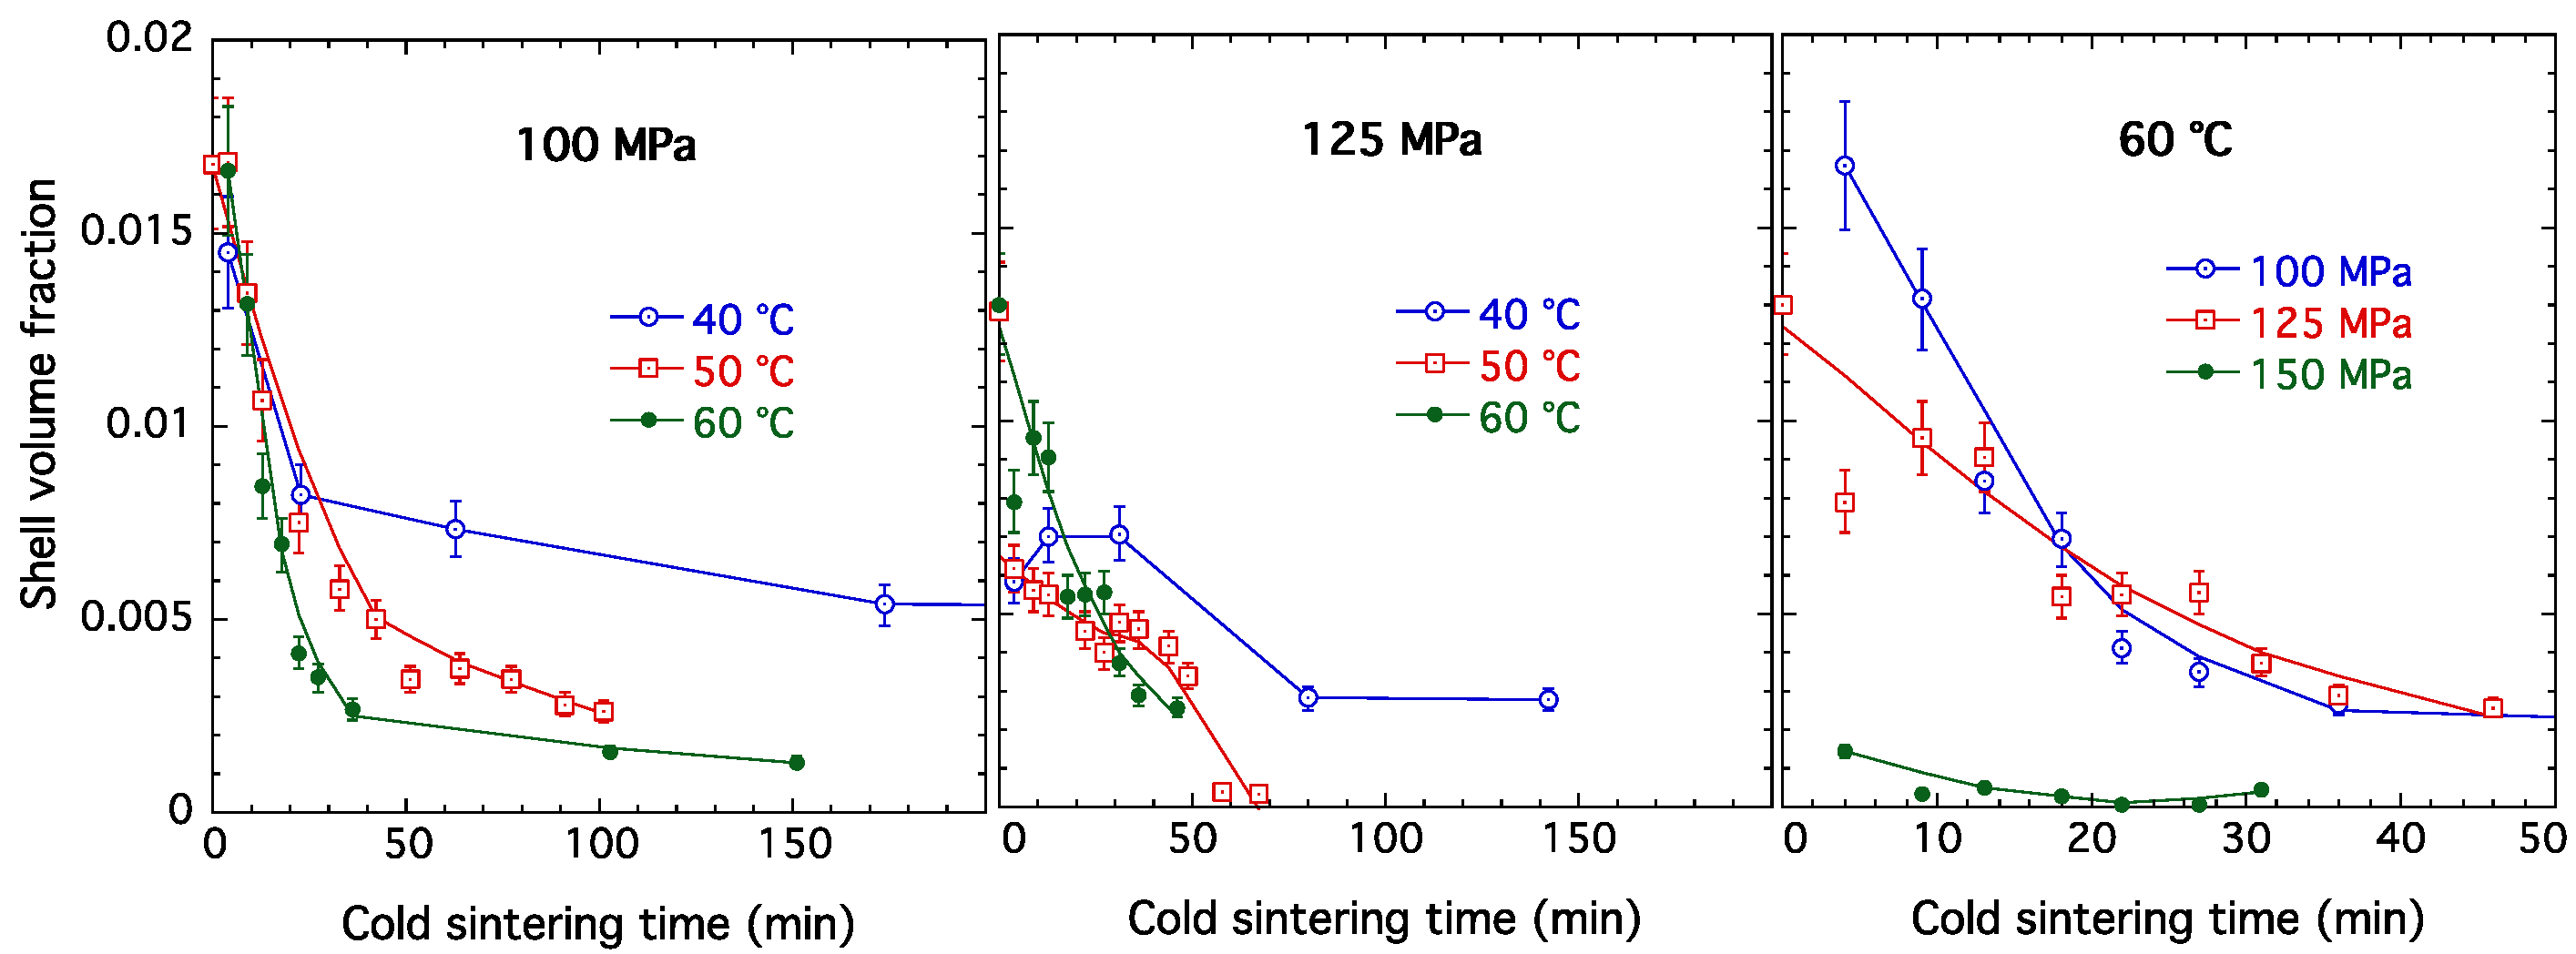
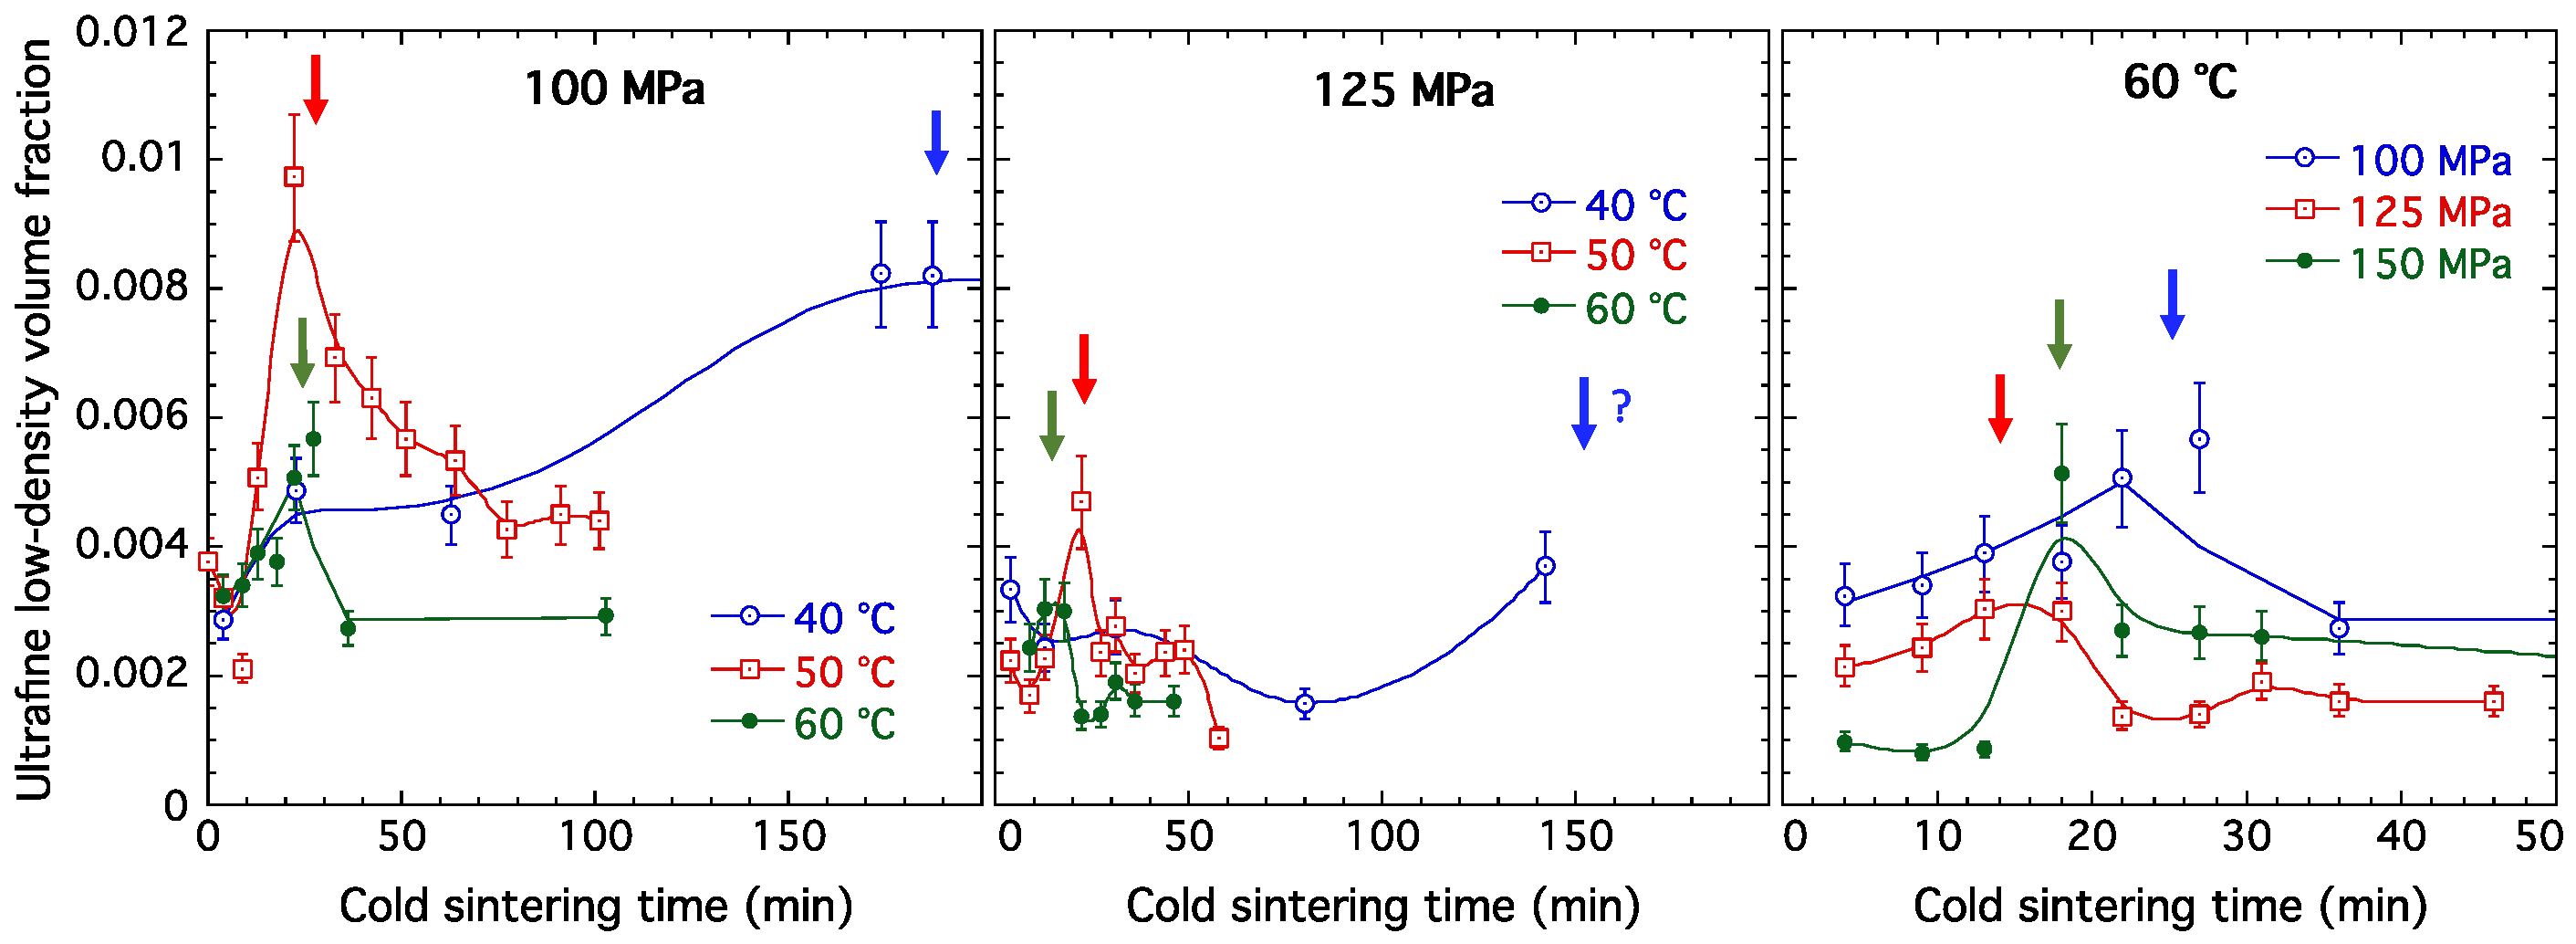
3.2. Core-Shell Features and High-Defect Low-Density KDP Component

3.2.1. Pore Shell Evolution during CSP

The existence of a transient, high-defect, possibly amorphous, low-density, dissolved and re-precipitated, solid phase at grain boundaries during CSP is becoming better established [12,25]. Here, improved fits to the data were obtained by assuming this to be a low-density shell at the pore/grain interface. Given the hydrogenous nature of the morphology during CSP, it has been assumed that this shell has an X-ray scattering-length (form-factor) density half-way between water (in the pores) and fully dense KDP. Additionally, the shell thickness was constrained to be the same for both the macroscale and nanoscale pore populations. These assumptions maximize the information that can be extracted here from the microstructural model fitting to the USAXS/SAXS data, but it is recognized that they represent a likely over-simplification of the true situation. Figure 9 presents the variation of the fitted shell thickness with CSP sintering time. Note that, whereas the shell thickness values (<20 nm) are negligible compared to the macroscale median pore diameters, they are clearly very significant compared to the nanoscale pore mean diameters. There is more scatter in these shell thickness results than indicated by the expected fitting standard uncertainties, probably associated with some stochastics as CSP progresses, even for the custom-designed stage used. Nevertheless, the shell thickness clearly decreases during CSP. However, only in the case of CSP for p = 150 MPa at 60 °C does the shell thickness decrease to near zero. The volume of low-density hydrogenous KDP material in the pore shell layers adjacent to the solid KDP grains was also deduced versus cold sintering time. The total surface area per unit sample volume of any lognormal distribution is given by a standard analytical result [23], and this can be calculated either for pores including the shell layer or excluding the shell layer (core volume only). In this case, the latter can simply be multiplied by the shell thickness to obtain the volume fraction of shell material in the sample. Figure 10 presents the variation in low-density KDP shell phase versus cold sintering time for each of the in situ CSP studies. The initial volume fraction of the shell phase is ≈1.5%, significantly greater than the nanoscale porosity of ≈0.3% (Figure 6). The larger value for the shell arises due to including the shell volume associated with the much larger population of macroscale pores. The transient nature of this phase is clearly revealed by the significant decrease in its volume fraction during CSP. However, note that some residual pore shell volume fraction persists after CSP at 100 MPa at any of the 3 temperatures used, and the shell volume fraction goes to near zero only for the case of CSP with p = 150 MPa at 60 °C.

3.2.2. Ultrafine High-Defect Low-Density KDP Component during CSP

In addition to accommodating a core–shell morphology for the water-filled pore populations described above, a 3rd ultrafine population of scattering features was needed to provide a complete microstructural scattering model for the data (see Figure S2 in the Supplementary Materials). Consistent among the in situ studies, especially at intermediate sintering times during CSP, this need can be associated with a feature in the USAXS/SAXS profile at q ≈ 0.8 nm−1 visible in the plots of Figures S3–S5 in the Supplementary Materials. The rise and fall of this component can also be correlated with an associated rise and fall in the scattering flat background, suggesting it may be a glassy or amorphous phase, as has been observed near grain boundaries in other systems undergoing CSP such as ZnO [4,22,24]. Due to the weak nature of this ultrafine feature above the scattering background, it was not possible to determine unambiguously the morphology of this component between sheet-like or needle-like features, or they may even have a dendritic fractal-like morphology. With some stochastics, a radius of gyration, Rg, generally in the range of 5 nm to 10 nm was found for the fits. A cylindrical shape and a density one half that of fully dense KDP were assumed as a working model to evaluate evolution of this ultrafine component during CSP.
With these working assumptions, Figure 11 presents the variations in volume fraction of this component with sintering time during the in situ CSP studies. Despite the fit uncertainties, maxima in the volume fraction of this ultrafine low-density phase (as indicated by arrows) are strongly suggested in all cases measured at 60 °C, and for both p = 100 MPa and p = 125 MPa at 50 °C (as well as at 60 °C). At 40 °C, any maximum volume fraction appears to occur at later times than those measured for p = 100 MPa or 125 MPa, but the maximum does occur within the in situ measurement time for the case of p = 150 MPa at 40 °C. Generally, the maximum volume fraction occurs at a shorter cold sintering time for higher temperature and/or greater compressive force. Note that the cold sintering time associated with the maximum in the ultrafine low-density component approximates to that at which the main decrease in volume fraction of low-density KDP shell around the pores is completed, suggesting some of the shell material may be isolated from the porosity as it closes off and densification progresses. Interpretation of this component as low-density KDP phase between sintering grains is reasonable in this context.

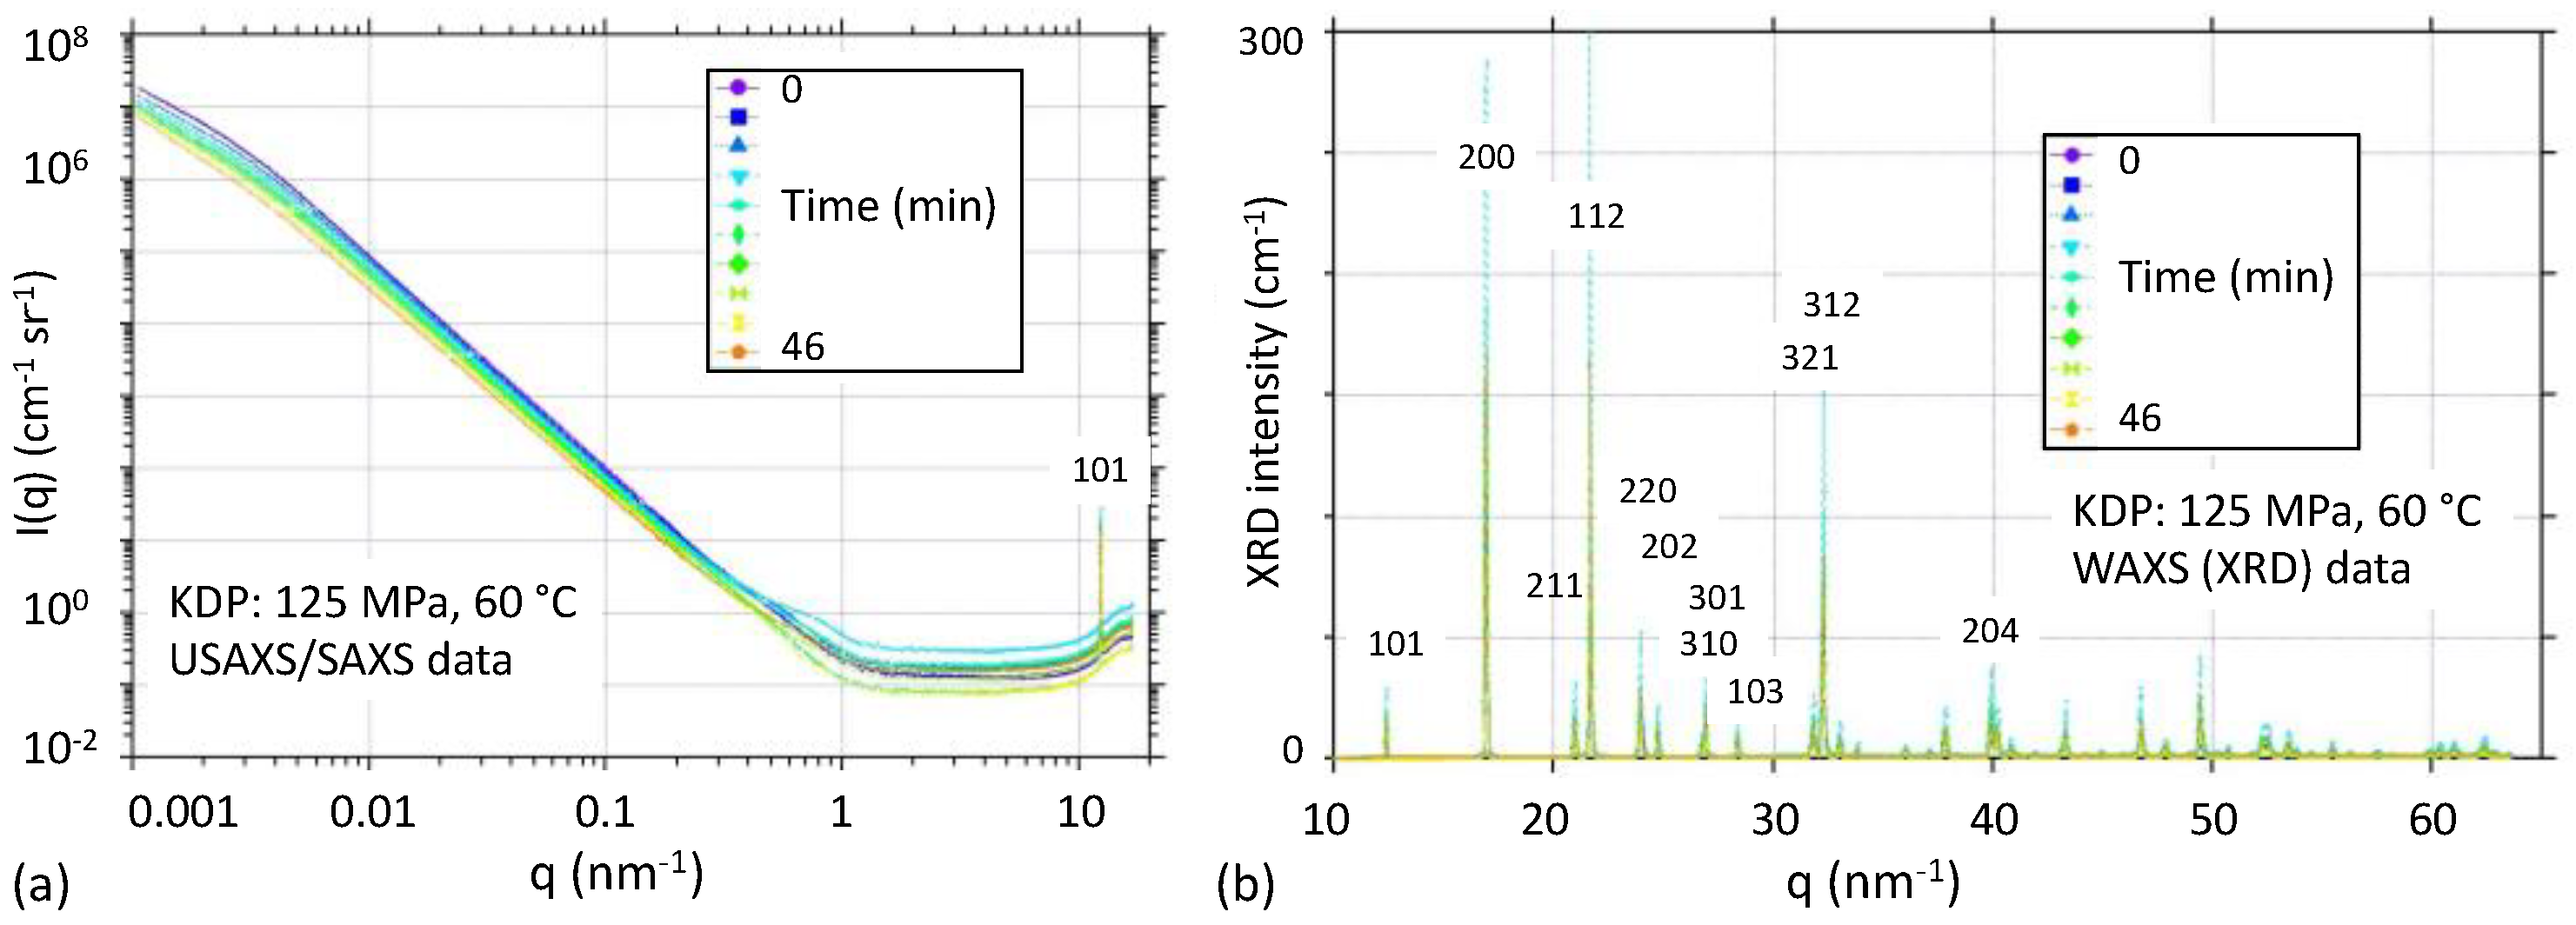
3.3. XRD Pattern Evolution during CSP

3.3.1. KDP XRD Pattern Evolution during CSP

Figure 3b shows the characteristic XRD patterns for in situ measurements of KDP during CSP for p = 125 MPa at 60 °C. The XRD patterns are similar for all the in situ studies. Changes in XRD peak position (and hence lattice spacing) on compressional loading are broadly in agreement with the published value of the KDP elastic modulus (54 GPa to 66 GPa) [26] giving compressional strains of order 1.7 × 10⁻³ for the compressional stresses applied, with some slight relaxation of the strain as CSP progresses. XRD peak amplitudes generally increase during CSP mainly due to more solid crystalline KDP being pulled into the X-ray sampling volume as densification proceeds. Apart from changes in the flat background referred to above, there was no measurable evidence of a nanoscale-broadened component around the base of the XRD peaks. However, this is not surprising given the small nanoscale porosity and associated volume of nanoscale diffracting regions. Nevertheless, some variation in the full width at half maximum (FWHM) of the XRD peaks was observed and this is discussed below.

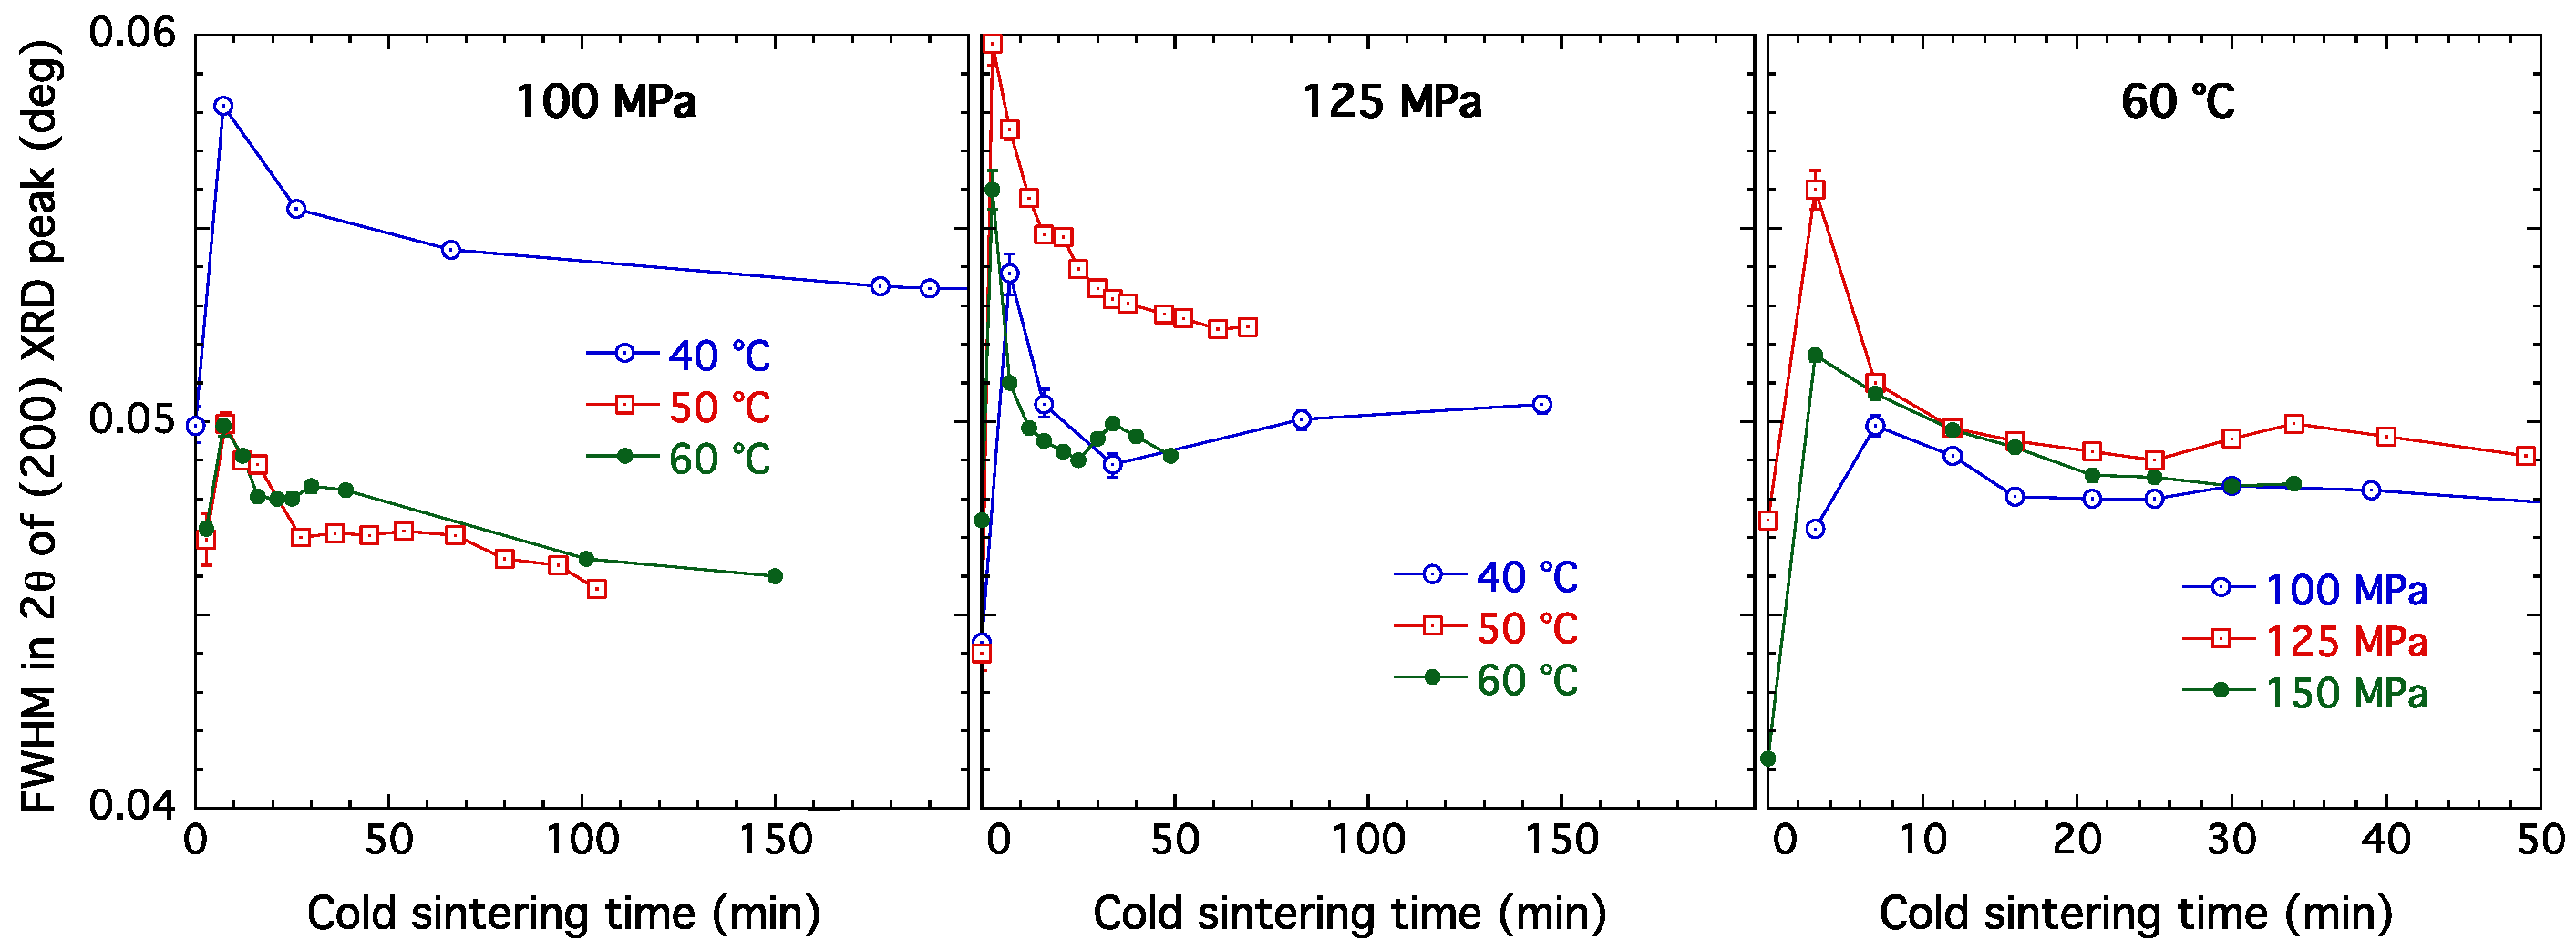
3.3.2. XRD Peak Width

Figure 12 presents variations in the FWHM for the 200 XRD peak during the CSP in situ studies. Relative to the initial value, the FWHM increases as the sample is both loaded with compressive stress and heated to the desired CSP temperature. It is assumed that the heterogeneous nature of the powder and water mix result in significant microstrains once the powder is under load. These microstrains are then expected to dissipate somewhat as the densification proceeds and water is expelled from the sample. In principle, at 100% theoretical density the only microstrains remaining would reflect the anisotropic elastic constants of the KDP crystal structure, depending on the local environment surrounding any given crystallite. Regardless of the degree of microstrain that sets in for one of the in situ tests, the relaxation effect (relative reduction in FWHM with time) in Figure 12 is a complex function of overall densification, loss of nanoscale pores, and the lubricating effect of dissolving and re-precipitating low-density KDP material—whether as an aqueous shell around each water-filed pore or as a phase at grain boundaries as surrounding grains sinter together. The 2θ value for the KDP 200 XRD peak at the 21 keV X-ray energy used is ≈9.15°. The FWHM of this peak is ≈0.05° but the additional FWHM, apparent in the early stages of CSP but dissipating somewhat later is typically ≈0.01° (Figure 12). Measured in microstrain, Δd/d, where d is the 200 XRD peak lattice spacing, this would amount to ≈1.1 × 10⁻³, or ±5.5 × 10⁻⁴, which is reasonable compared to the overall compressive strain expected (1.7 × 10⁻³ to 2.5 × 10⁻³ for p = 100 MPa to 150 MPa) given the likely degree of inhomogeneity in the system during CSP. Some peak narrowing may also be associated with grain growth and removal of crystal defects by diffusion.

4. Discussion and Conclusions

4.1. Summary of In Situ CSP Results

Using KDP as a model system, we have employed uniaxial compressive stresses and temperatures intended to bring about densification through CSP, but to do so at a rate sufficiently slowed so to permit aspects of the process to be interrogated during in situ USAXS/SAXS/WAXS studies of CSP. As to be expected, either higher temperature or application of greater compressive stress increases the densification rate, and also the final density achieved. With p = 100 MPa, temperatures of 40 °C or 50 °C may not be sufficient to achieve full density, but near full density does appear to be achievable at 60 °C. However, this may be at the cost of unwanted grain growth at higher temperatures. With p = 125 MPa, CSP at 40 °C still may not be able to achieve full densification, but this is possible at both 50 °C and 60 °C, and there is no significant accompanying grain coarsening. Densification by CSP at 60 °C with p = 150 MPa is more rapid and complete within the time regime studied, also without grain coarsening. Regardless of densification progress, and sometimes grain coarsening, as reflected in measurements of the main macroscale pore population, CSP clearly brings about changes at the nanoscale level. In almost all the in situ CSP runs studied, there is a reduction both in the nanoscale pore population volume fraction, and in the volume fraction of low-density KDP shell phase. (This is not wholly true for p = 100 MPa at 40 °C.) The ultrafine low-density KDP volume fraction appears to rise to a maximum and then subsides as overall CSP densification progresses. While specific X-ray scattering-length densities have been assumed for the model-fitting, it is reasonable to assume the true situation is more complex, with some densification of the low-density KDP shell phase as water is removed. As nanoscale pores are lost, some of the now dried shell material is isolated from the pore system, thus providing a source of increasing ultrafine low-density KDP phase. This is then densified by continued application of the compressive stress, causing it to merge with the fully dense KDP in the solid grains, and rendering it increasingly invisible to small-angle scattering (decreasing volume fraction after the maximum). This appearance and behavior of low-density, perhaps amorphous, dissolved and re-precipitated KDP would appear to be the underlying phenomenon enabling CSP that has been observed in other systems, sometimes more clearly when there is also a transient compositional variation [12,25]. The in situ WAXS (XRD) data reveals the presence of microstrain within the sample under compression, likely moderated by the distribution of transient low-density KDP phase, with the microstrain dissipating at later times as the amount of such high-defect, low-density, potentially soft, KDP phase is reduced. Finally, it should be pointed out how densification processes in KDP may be limited by the tendency to fracture along crystal facets, as observed in some cases here, and probably attributable in part to the anisotropic elastic constants of KDP. As far as we are aware, this tendency is not reproduced in other materials suitable for CSP that have more isotropic mechanical properties.

4.2. Arrhenius Analysis of CSP for KDP

As summarized above, CSP is clearly a multi-component process, likely to involve various competing phenomena, e.g., densification versus grain growth. In such situations, caution must be used in applying an over-simplified Arrhenius analysis to make predictions of the kinetics [14,27,28]. Nevertheless, Figure 4 does suggest that a linear densification regime may exist over part of the CSP time regime. This prompts us to attempt an Arrhenius analysis of the densification process over the relevant time regimes, using data at the 3 temperatures obtained for both p = 100 MPa and p = 125 MPa. Figure 13 presents linear fits to the loss of porosity in the linear densification regimes, and then Arrhenius plots and fits based on absolute temperature, T, densification rate, and normalization with respect to moles of KDP that filling the pore volume as a result of densification. In accordance with accepted sintering theory [28,29], note that the Arrhenius plots fitted are for ln(T x densification rate) versus 1/T. The activation energies obtained for the two compressive stresses, p = 100 MPa and 125 MPa, are: (88.3 ± 8.1) kJ/mol and (91.9 ± 7.2) kJ/mol, respectively. These values are acceptably close to each other, are significantly less than quoted in the literature for ceramic sintering processes at more conventional temperatures [27,28,29] and are within the range of activation energies found for CSP, elsewhere [6].

4.3. Concluding Remarks

We conclude by pointing out the generic applicability of the characteristic features of cold sintering measured and quantified (at some initial level) by the in situ scattering studies of cold sintering for potassium di-phosphate, KDP, and the associated microstructural model analysis described, together with accompanying XRD characterization. It is anticipated that these methods can be extended and made applicable to more technologically important cases such as the cold sintering of ZnO. The importance of cold sintering is clear for reducing the manufacturing carbon footprint. Indeed, as demonstrated here, the activation energy for cold sintering can be up to an order of magnitude smaller than required for conventional sintering. Its importance is especially relevant to planar components, but these may, nevertheless, possess complex gradient morphologies either within the plane or orthogonal to it, e.g., in solid oxide fuel cells, or in layered multi-dimensional additive manufactured composite structures where successive layers may even have different melting temperatures. The relevance of cold sintering to mitigating industrial carbon emissions [30] makes this ceramic densification route especially suited when coupled with other primary “green” processing routes such as those being increasingly used in ceramics additive manufacturing.

Supplementary Materials

The following supporting information can be downloaded at: https://www.mdpi.com/article/10.3390/app122010493/s1, Figure S1: Typical slit-smeared and desmeared USAXS/SAXS data with model fits, Figure S2: Breakdown of microstructural model contributions and corresponding component distributions for KDP during CSP, Figure S3: In situ slit-smeared USAXS/SAXS line-trace data for KDP subject to CSP under 100 MPa uniaxial compression, Figure S4: In situ slit-smeared USAXS/SAXS line-trace data for KDP subject to CSP under 125 MPa uniaxial compression, Figure S5: In situ slit-smeared USAXS/SAXS line-trace data for KDP subject to CSP at 60 °C.

Author Contributions

Conceptualization, A.J.A. and R.A.M.; methodology, A.J.A., R.A.M., F.Z., I.K. and J.I.; software, R.A.M.; validation, A.J.A., R.A.M., I.K. and J.I.; formal analysis, A.J.A.; investigation, A.J.A., R.A.M. and F.Z.; resources, A.J.A., R.A.M., F.Z., I.K. and J.I.; data curation, A.J.A. and R.A.M.; writing—original draft preparation, A.J.A.; writing—review and editing, A.J.A., R.A.M., F.Z., I.K. and J.I.; visualization, R.A.M. and I.K.; supervision, A.J.A. and R.A.M.; project administration, A.J.A. and R.A.M. All authors have read and agreed to the published version of the manuscript.

Funding

This research used resources of the Advanced Photon Source, a U.S. Department of Energy (DOE) Office of Science user facility operated for the DOE Office of Science by Argonne National Laboratory under Contract No. DE-AC02-06CH11357.

Institutional Review Board Statement

Not applicable.

Informed Consent Statement

Not applicable.

Data Availability Statement

The data presented in this study are available on reasonable request from the corresponding author.

Conflicts of Interest

The authors declare no conflict of interest.

References

  1. Zhang, C.; Chen, F.; Huang, Z.; Jia, M.; Chen, G.; Ye, Y.; Lin, Y.; Liu, W.; Chen, B.; Shen, Q.; et al. Additive manufacturing of functionally graded materials: A review. Mater. Sci. Eng. A 2019, 764, 138209. [Google Scholar] [CrossRef]
  2. Allen, A.J.; Levin, I.; Witt, S.E. Materials research and measurement needs for ceramics additive manufacturing. J. Am. Ceram. Soc. 2020, 103, 6055–6069. [Google Scholar] [CrossRef] [PubMed]
  3. Allen, A.J.; Levin, I.; Maier, R.A. Research, standards, and data needs for industrialization of ceramic direct ink writing. Int. J. Ceram. Eng. Sci. 2022, 4, 302–308. [Google Scholar] [CrossRef]
  4. Guo, J.; Guo, H.; Baker, A.L.; Lanagan, M.T.; Kupp, E.R.; Messing, G.L.; Randall, C.A. Cold sintering: A paradigm shift for processing and integration of ceramics. Angew. Chem. Int. Ed. 2016, 55, 11457–11461. [Google Scholar] [CrossRef] [PubMed]
  5. Guo, H.; Baker, A.L.; Guo, J.; Randall, C.A. Cold sintering process: A novel technique for low-temperature ceramic processing of ferroelectrics. J. Am. Ceram. Soc. 2016, 99, 3489–3507. [Google Scholar] [CrossRef]
  6. Guo, J.; Floyd, R.; Lowum, S.; Maria, J.-P.; de Beauvoir, T.H.; Seo, J.-H.; Randall, C.A. Cold sintering: Progress, challenges, and future opportunities. Annu. Rev. Mater. Res. 2019, 49, 275–295. [Google Scholar] [CrossRef]
  7. Faouri, S.S.; Mostaed, A.; Dean, J.S.; Wang, D.; Sinclair, D.C.; Zhang, S.; Whittow, W.G.; Vardaxoglou, Y.; Reaney, I.M. High quality factor cold sintered Li2MoO4–BaFe12O19 composites for microwave applications. Acta Mater. 2019, 166, 202–207. [Google Scholar] [CrossRef] [Green Version]
  8. Liu, Y.; Sun, Q.; Wang, D.; Adair, K.; Liang, J.; Sun, X. Development of the cold sintering process and its application in solid-state lithium batteries. J. Power Sources 2018, 393, 193–203. [Google Scholar] [CrossRef]
  9. Hong, W.B.; Li, L.; Yan, H.; Chen, X.M. Cold sintering and microwave dielectric properties of dense HBO2-II ceramics. J. Am. Ceram. Soc. 2019, 102, 5934–5940. [Google Scholar] [CrossRef]
  10. Guo, H.; Bayer, T.J.M.; Guo, J.; Baker, A.; Randall, C.A. Current progress and perspectives of applying cold sintering process to ZrO2-based ceramics. Scr. Mater. 2017, 136, 141–148. [Google Scholar] [CrossRef]
  11. Grasso, S.; Biesuz, M.; Zoli, L.; Taveri, G.; Duff, A.I.; Ke, D.; Jiang, A.; Reece, M.J. A review of cold sintering processes. Adv. Appl. Ceram. 2020, 119, 115–143. [Google Scholar] [CrossRef] [Green Version]
  12. Gonzalez-Julian, J.; Neuhaus, K.; Bernemann, M.; da Silva, J.P.; Laptev, A.; Bram, M.; Guillon, O. Unveiling the mechanisms of cold sintering of ZnO at 250 °C by varying applied stress and characterizing grain boundaries by Kelvin Probe Force Microscopy. Acta Mater. 2018, 144, 116–128. [Google Scholar] [CrossRef] [Green Version]
  13. Galotta, A.; Sglavo, V.M. The cold sintering process: A review on processing features, densification mechanisms and perspectives. J. Eur. Ceram. Soc. 2021, 41, 1–17. [Google Scholar] [CrossRef]
  14. Frueh, T.; Ozer, I.O.; Poterala, S.F.; Lee, H.; Kupp, E.R.; Compson, C.; Atria, J.; Messing, G.L. A critique of master sintering curve analysis. J. Eur. Ceram. Soc. 2018, 38, 1030–1037. [Google Scholar] [CrossRef]
  15. Ilavsky, J.; Jemian, P.R.; Allen, A.J.; Zhang, F.; Levine, L.E.; Long, G.G. Ultra-small-angle X-ray scattering at the Advanced Photon Source. J. Appl. Crystallogr. 2009, 42, 469–479. [Google Scholar] [CrossRef]
  16. Ilavsky, J.; Zhang, F.; Andrews, R.N.; Kuzmenko, I.; Jemian, P.R.; Levine, L.E.; Allen, A.J. Development of combined microstructure and structure characterization facility for in situ and operando studies at the Advanced Photon Source. J. Appl. Crystallogr. 2018, 51, 867–882. [Google Scholar] [CrossRef]
  17. Allen, A.J.; Levin, I.; Maier, R.A.; Witt, S.E.; Zhang, F.; Kuzmenko, I. In situ characterization of ceramic cold sintering by small-angle scattering. J. Am. Ceram. Soc. 2020, 104, 2442–2448. [Google Scholar] [CrossRef]
  18. Orthaber, D.; Bergmann, A.; Glatter, O. SAXS experiments on absolute scale with Kratky systems using water as a secondary standard. J. Appl. Crystallogr. 2000, 33, 218–225. [Google Scholar] [CrossRef]
  19. Ilavsky, J.; Jemian, P.R. Irena: Tool suite for modeling and analysis of small-angle scattering. J. Appl. Crystallogr. 2009, 42, 347–353. [Google Scholar] [CrossRef]
  20. Ilavsky, J. Nika: Software for two-dimensional data reduction. J. Appl. Crystallogr. 2012, 45, 324–328. [Google Scholar] [CrossRef]
  21. Chantler, C.T.; Olsen, K.; Dragoset, R.A.; Chang, J.; Kishore, A.R.; Kotochigova, S.A.; Zucker, D.S. X-ray Form Factor, Attenuation, and Scattering Tables, Version 2.1; National Institute of Standards and Technology (NIST): Gaithersburg, MD, USA, 2005. [CrossRef]
  22. Si, M.; Hao, J.; Zhao, E.; Zhao, X.; Guo, J.; Wang, H.; Randall, C.A. Preparation of zinc oxide/poly-ether-ether-ketone (PEEK) composites via the cold sintering process. Acta Mater. 2021, 215, 117036. [Google Scholar] [CrossRef]
  23. Pauw, B.R.; Kastner, C.; Thunemann, A.F. Nanoparticle size distribution quantification: Results of a small-angle X-ray scattering inter-laboratory comparison. J. Appl. Crystallogr. 2017, 50, 1280–1288. [Google Scholar] [CrossRef] [PubMed] [Green Version]
  24. Ivakin, Y.D.; Smirnov, A.V.; Kormilitsin, M.N.; Kholodkova, A.A.; Vasin, A.A.; Kornyushin, M.V.; Tarasovskii, V.P.; Rybal’chenko, V.V. Effect of mechanical pressure on the recrystallization of zinc oxide in a water fluid medium under cold sintering. Russ. J. Phys. Chem. B 2021, 15, 1228–1250. [Google Scholar] [CrossRef]
  25. Maria, J.P.; Kang, X.; Floyd, R.D.; Dickey, E.C.; Guo, H.; Guo, J.; Baker, A.; Funihashi, S.; Randall, C.A. Cold sintering: Current status and prospects. J. Mater. Res. 2017, 32, 3205–3218. [Google Scholar] [CrossRef] [Green Version]
  26. Yang, S.; Zhang, L.; Wu, Z. Effect of anisotropy of potassium dihydrogen phosphate crystals on its deformation mechanisms subjected to nanoindentation. ACS Appl. Mater. Interfaces 2021, 13, 41351–41360. [Google Scholar] [CrossRef]
  27. Shao, W.Q.; Chen, S.O.; Li, D.; Cao, H.S.; Zhang, Y.C.; Zhang, S.S. Apparent activation energy for densification of α-Al2O3 powder at constant heating-rate sintering. Bull. Mater. Sci. 2008, 31, 903–906. [Google Scholar] [CrossRef]
  28. Zuo, F.; Badev, A.; Saunier, S.; Goeuriot, D.; Heuguet, R.; Marinel, S. Microwave versus conventional sintering: Estimate of the apparent activation energy for densification of α-alumina and zinc oxide. J. Eur. Ceram. Soc. 2014, 34, 3103–3110. [Google Scholar] [CrossRef]
  29. Xie, D.; Wan, L.; Song, D.; Wang, S.; Lin, F.; Pan, X.; Xu, J. Pressureless sintering curve and sintering activation energy of Fe–Co–Cu pre-alloyed powders. Mater. Des. 2015, 87, 482–487. [Google Scholar] [CrossRef]
  30. Ibn-Mohammed, T.; Randall, C.A.; Mustapha, K.B.; Guo, J.; Walker, J.; Berbano, S.; Koh, S.C.L.; Wang, D.; Sinclair, D.C.; Reaney, I.M. Decarbonising ceramic manufacturing: A techno-economic analysis of energy efficient sintering technologies in the functional materials sector. J. Eur. Ceram. Soc. 2019, 39, 5213–5235. [Google Scholar] [CrossRef]
Figure 1. Photographic images of KDP samples at early and late stage CSP with (a) 50 MPa uniaxial compression at 60 °C; (b) 150 MPa at 60 °C. Additionally, plotted are piston displacements versus cold sintering time for each CSP condition (1 mm displacement ≈ 500 piston steps).
Applsci 12 10493 g001
Figure 2. Schematic of CSP stage geometry for in situ USAXS/SAXS/WAXS measurements. Inset shows photograph of actual stage in operation.
Applsci 12 10493 g002
Figure 3. (a) In situ slit-smeared USAXS/SAXS line-trace data versus q for KDP CSP using p = 125 MPa at 60 °C. Point-to-point data uncertainties are indicated by scatter in the line traces. (b) Corresponding in situ WAXS (XRD) data with selected XRD peaks indexed.
Applsci 12 10493 g003
Figure 4. Total pore volume fraction versus cold sintering time for 40 °C, 50 °C, 60 °C with p = 100 MPa and 125 MPa, and for p = 100 MPa, 125 MPa, 150 MPa at 60 °C. Logarithmic line fits are guides to the eye. Vertical bars in this and subsequent figures (unless stated) are estimated standard uncertainties based on USAXS intensity calibration and residual stochastics in CSP densification still present using the custom-built CSP stage.
Applsci 12 10493 g004
Figure 5. Coarse pore median diameter versus cold sintering time for 40 °C, 50 °C, 60 °C with p = 100 MPa and 125 MPa, and for p = 100 MPa, 125 MPa, 150 MPa at 60 °C. Straight-line fits are simply guides to the eye. The 60 °C data for all 3 stresses are plotted out to just 50 min to show more clearly the different variations with time.
Applsci 12 10493 g005
Figure 6. Nanoscale pore volume fraction versus cold sintering time for 40 °C, 50 °C, 60 °C with p = 100 MPa and 125 MPa, and for p = 100 MPa, 125 MPa, 150 MPa at 60 °C. Straight-line fits are guides to the eye.
Applsci 12 10493 g006
Figure 7. Nanoscale pore median diameter versus cold sintering time for 40 °C, 50 °C, 60 °C with p = 100 MPa and 125 MPa, and for p = 100 MPa, 125 MPa, 150 MPa at 60 °C. Straight-line fits are guides to the eye. The 60 °C data for all 3 compressive stresses are plotted out to just 50 min, in this and future real-time plots to show more clearly the different variations with time.
Applsci 12 10493 g007
Figure 8. SEM micrographs of KDP samples after fracture during late-stage CSP for (a,b) p = 50 MPa at 60 °C; (c,d) p = 150 MPa at 60 °C. (a,c) show intact outer surfaces of the samples after CSP; (b,d) show the fracture surfaces.
Applsci 12 10493 g008
Figure 9. Pore shell thickness versus cold sintering time for 40 °C, 50 °C, 60 °C with p = 100 MPa and 125 MPa, and for p = 100 MPa, 125 MPa, 150 MPa at 60 °C. Logarithmic line fits are guides to the eye.
Applsci 12 10493 g009
Figure 10. Shell volume fraction versus cold sintering time for 40 °C, 50 °C, 60 °C with p = 100 MPa and 125 MPa, and for p = 100 MPa, 125 MPa, 150 MPa at 60 °C. Lines are guide to the eye.
Applsci 12 10493 g010
Figure 11. Ultrafine low-density volume fraction versus cold sintering time for 40 °C, 50 °C, 60 °C with p = 100 MPa and 125 MPa, and for p = 100 MPa, 125 MPa, 150 MPa at 60 °C. Lines are guide to the eye. Arrows indicate maxima in the volume fractions during each in situ study.
Applsci 12 10493 g011
Figure 12. FWHM in 2θ of 200 XRD peak versus cold sintering time for 40 °C, 50 °C, 60 °C with p = 100 MPa and 125 MPa, and for p = 100 MPa, 125 MPa, 150 MPa at 60 °C. Lines are guide to the eye. Vertical bars represent the computed peak fitting standard uncertainties, and are mainly smaller than the data points, themselves.
Applsci 12 10493 g012
Figure 13. Arrhenius analyses of CSP for (a,b) p = 100 MPa; (c,d) p = 125 MPa, using data for total pore volume fraction at 40 °C, 50 °C, and 60 °C. The activation energy is with respect to loss of porosity per mole of solid KDP that fills the pore space during densification. Vertical bars are computed standard uncertainties of the straight-line fits.
Applsci 12 10493 g013
Table 1. Summary of microstructure assumptions for modeling and fitting in situ CSP USAXS/SAXS data 1.
ComponentFormX-ray SLD (1014 m−2)Shell SLD (1014 m−2)
(i) Macropores
      (water-filled)
Core-shell globular9.4214.63
(ii) Nanoscale pores
      (water-filled)
Core-shell globular9.4214.63
(iii) Low-density KDP
      (solid)
Cylindrical
needle or sheet
9.92N/A
(iv) Fully dense KDP
      (solid)
Surrounding medium19.84N/A
1 Lognormal volume-fraction size (diameter) distributions assumed for (i), (ii) and (iii).
Publisher’s Note: MDPI stays neutral with regard to jurisdictional claims in published maps and institutional affiliations.

