Abstract
The upper reaches of the Crocodile River (West) system are located in the western basin of the Witwatersrand mountain chain, an area heavily influenced by gold mining. After the spill of highly acidic and contaminated mining-influenced water into the river system in 2002, chemical water treatment was implemented to compensate for the consequences of acid mine drainage. Some studies thereafter have shown metal concentrations of concern in the system, but never considered longer periods of time. For this study, we investigated water and sediments over a period of 13 months from 7 sampling sites in the system. In addition to physico-chemical parameters such as temperature, pH, and electrical conductivity, a multi-element analysis was conducted. We used various versions of atomic-absorption-spectroscopy, total reflection x-ray fluorescence spectroscopy, and inductively coupled plasma mass spectrometry in filtered and acidified water samples as well as sediment leachates. Concentrations of Ni, Zn, As, Pb, and U in the sediment were clearly elevated at the site closest to the mine as well as further downstream, some of them far exceeding quality guidelines. Moreover, dissolved Mn, Fe, Ni, Zn and U occurred irregularly in concentrations of concern at the site of mining-influenced water inflow. Our findings clearly indicate a risk of further and chronic mobilization of toxic elements from this site and a possible threat to the connected river system.
1. Introduction
Metals and metalloids occur naturally in the environment and can be redistributed through natural processes as well as anthropogenic activities. Industrialization and urbanization have led to an accelerated pollution with those potentially toxic elements in the biosphere [1,2]. The contamination of surface waterbodies through anthropogenic sources, for example, increased drastically over the past few decades and presents a risk to aquatic life when certain levels are exceeded [3]. Next to human activities such as the burning of fossil fuels, smelting, municipal waste disposal and the use of fertilizers, the mining of metals has made a huge contribution to the pollution of aquatic ecosystems [4]. South Africa is a country rich in mining history and is well aware of this issue. The discovery of gold in the Witwatersrand region in the late 19th century greatly shaped the country’s development and economy [5]. The once-rural region associated with farming around today’s Johannesburg (Gauteng) quickly became densely populated and is now inhabited by more than 16 million people [6,7]. Besides rich gold deposits, the findings of larger quantities of uranium oxides led to the mining of both metals in the region. After the geological exhaustion of the metal-rich rock beds, numerous mines started to shut down from the 1960s onwards. Mining companies were forced to stop operating, or, more recently, shifted to reclaiming the remaining gold from the huge, golden shimmery mine dumps that dominate the landscape [8]. In the western mining basin on West Rand near Krugersdorp, underground gold and uranium mining was carried out until 1998. Once mining stopped, the dewatering pumps in the mineshafts were also switched off. Consequently, groundwater started to fill the shafts, leading to a phenomenon termed acid mine drainage (AMD) [9].
AMD occurs when sulfide minerals, mainly pyrite (FeS2), react with water and oxygen, generating acid by sulfide oxidation in two stages. First, sulfuric acid and ferrous sulfate are formed and, subsequently, ferric hydroxide and more sulfuric acid are accrued [10]. Thereby the pH of the water filling the mine drops significantly, resulting in a high mineralization of the mine water. In addition to easily soluble metals such as Na and K, the content of metals and metalloids in this solution increases due to the acidic conditions, enhancing the solubility of these otherwise antisoluble components. Even though the chemistry behind AMD is straightforward, the composition of the solution in mining-influenced water (MIW) is highly dependent on the host rock composition and may contain high loads of e.g., aluminium, manganese, iron, nickel, zinc, lead, and uranium as well as arsenic [11]. Gold and coal mines with their high content of pyrite are particularly vulnerable to AMD. The mining process generates a large surface area for water and oxygen to react with the sulfur-bearing minerals. Thereby, neutralization processes during the reaction of acid with minerals such as calcite (CaCO3) or dolomite (CaMg(CO3)2) are overpowered by the quantity of acid, leaving the MIW acidic. Deterioration of water quality of the MIW filling the void becomes inevitable [10]. Rising MIW levels in mines pose a risk to groundwater resources and eventually also for surface waters once the MIW starts to spill. The highly toxic solution then enters the proximate aquatic environment, which pollutes the sediment and water of nearby surface waters [12]. Physico-chemical parameters such as salinity and pH of both MIW and surface water highly influence the precipitation and dissolution processes of metals at the water–sediment interface [13]. The resulting adsorption/desorption behavior of metals within these compartments in aquatic environments might over time lead to their long-distance transport within river systems and thus cause contamination far from the pollution source [14,15,16].
In the case of the South African gold mines of the Witwatersrand basin, a lack of larger quantities of neutralizing minerals and the high abundance of iron sulfides favored the formation of AMD. Scientists had been well aware of the issue in the region and had predicted the overflow of a borehole and an old shaft of the Harmony Gold Mine near Krugersdorp years before it happened in the South African winter months of 2002 [17] and references therein. The pH of the MIW entering the environment was extremely low and it contained high loads of dissolved metals, and metalloids as well as high sulfate concentrations. An estimation of initially 7 ML per day of MIW in summer and 12.5 ML per day in winter were released into the Tweelopiespruit [18], a small river in the upper reaches of the Crocodile River (West) system. Once the MIW was diluted with water from Tweelopiespruit and was exposed to air, the pH increased, followed by the precipitation of various metals. The water was polluted and stained orange, and the sediments were covered with a thick orange-red deposit of ferrihydrite. This phenomenon is typically seen as a consequence of AMD. A number of studies [9,19,20] examined the water of Tweelopiespruit after the spill and found the metal and metalloid loads to be extremely high and toxic for the aquatic environment and for the local communities. A neutralization treatment of the MIW was therefore implemented to substantially improve the water quality. This treatment facility is, in a modified form, still operating today. The so-called “chemical process” used, utilizes limestone as a neutralization agent. First, the MIW is treated with limestone to a slightly alkaline pH and subsequently aerated with oxygen. Thereby, a ferric hydroxide precipitate is produced, which is put into a settling chamber, where metals and metalloids are removed from the solution [21]. For an increased settling efficiency of particles, the treatment might also include coagulants (such as aluminum sulfate) [22].
Almost 20 years passed since the spill of MIW in the West Rand was first reported, and the treatment facility has been operating for many years as well. Nonetheless, the post-treatment water and sediment quality in the upper reaches of the Crocodile River (West) system was rarely discussed in a scientific setting. This calls for examining Tweelopiespruit and the connected rivers to investigate the general water quality of the river system. For this study, we had the unique opportunity to take water as well as sediment samples over a 13-month period. Thereby making it the first study looking at sediment and water quality in the area over a longer period of time, after the implementation of water treatment. This yielded insights into both: the momentary situation of the water and sediment composition as well as the potential seasonal changes. The aim of this study was to determine the physico-chemical parameters, including the chemical composition of dissolved components in the water phase, as well as the metal content in the sediment. This should enable a characterization of the post-treatment state of the system but also an estimation of possible hazards for the aquatic environment in the region.
2. Materials and Methods
2.1. Study Area
The Crocodile River (West) originates in the Witwatersrand to the east of Krugersdorp, near the city of Johannesburg in South Africa. It is the main tributary of the Hartbeespoort Dam and later merges with the Limpopo River. The upper reaches of the river system are largely influenced by urbanization, industry, mining, and agriculture [23]. Smaller tributaries of the system in the West Rand district include the streams “Bloubankspruit” and “Tweelopiespruit”. They are located near Krugersdorp in the province Gauteng in South Africa (Figure 1). The Tweelopiespruit is fed with water from an abandoned gold mine in Randfontein and is a tributary to the Bloubankspruit, which then confluences with the Crocodile River (West). Shortly after, the Crocodile River (West) is dammed up to the Lake Heritage Dam by the Franz Richter wall, constructed in 2006. As a lodge is located on the lake, it is used for fly fishing, paddling, canoeing, and open-water swimming.
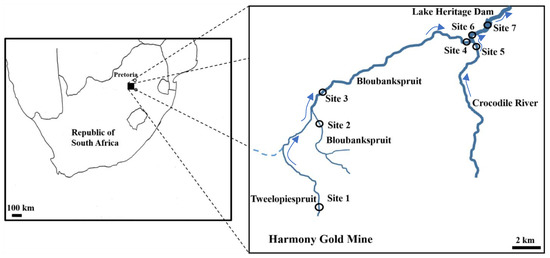
Figure 1.
The Republic of South Africa with a black square indicating the sampling area. Black rings specify the sampling sites 1–7.
The seven sampling sites are indicated in Figure 1 and their coordinates are given in Table 1. Sampling sites 1–7 were chosen along the river system, especially considering confluences. Site 1 is located at Tweelopiespruit after the outflow of the treated MIW enters the system from the abandoned gold mine. Sites 2 and 3 are situated along Bloubankspruit before and after the inflow of Tweelopiespruit, an area influenced by agriculture. Sites 4, 5, and 6 are located in the area of a hotel resort. At site 4 the flow rate of Bloubankspruit is decreased as the river is slightly dammed. Site 5 is located along the Crocodile River (West) before the inflow of Bloubankspruit. Site 6 is located along the Crocodile River (West) shortly after the confluence of the rivers. Site 7 is situated where the Crocodile River (West) is dammed by the Lake Heritage Dam.

Table 1.
Coordinates of sampling sites and information on the respective rivers at each site.
2.2. Sampling and Sample Preparation for Analysis
Water and sediment samples from each study site were taken monthly over a 13-month period from January 2019 to February 2020.
Water samples were filtered through a 0.45 µm PTFE syringe filter (VWR), acidified in situ (pH~2) with nitric acid (>68%, PrimarPlus trace analysis grade, Fisher Scientific, Waltham, MA, USA) and stored in 15 mL PP centrifuge tubes for further analysis.
For the determination of the activity concentrations of 238U and 234U, two 1.5 L, acid-prewashed PE bottles were filled with filtered water, acidified to pH~2 with nitric acid and transported to the University of Vienna.
Surface sediment samples were taken by hand using nitrile gloves by scooping sediment directly into 50 mL PP centrifuge tubes. Subsequently, samples were transported to the laboratory at the Zoology department of the University of Johannesburg under cooled conditions and protected from light. Samples were frozen at −21 °C for 48 h and subsequently freeze-dried (Christ ALPHA 2-4LD plus, Osterode am Harz, Germany). The freeze-dried sediment samples were sent to the University of Vienna, Institute of Inorganic Chemistry. There, the samples were homogenized with a mortar and pestle, sieved through an analytical nylon sieve with a pore size of 1 mm, and filled into 15 mL centrifuge tubes for further processing.
On an analytical balance, approximately 0.5 g of each freeze-dried, homogenized sediment sample was weighed into a glass tube. Samples were leached using 4.5 mL MilliQ water, 4.5 mL aqua regia, which was always freshly prepared in a molar ratio of 3:1 of HCl: HNO3 (HCl: 34–37%, Trace Metal Grade, Fisher Scientific, HNO3: >68%, PrimarPlus-trace analysis grade, Fisher Scientific, Waltham, MA, USA), and 1 mL of H2O2 (>30%, for trace analysis, Sigma-Aldrich, St. Louis, MI, USA). Covered with air coolers, sediment samples were leached for 2 h at 130 °C in a heating block. The leached samples were transferred into 20 mL volumetric flasks and filled up to volume with MilliQ water. The content was subsequently filtered through 0.45 µm PTFE syringe filter (VWR, Radnor, PA, USA) and stored in 15 mL centrifuge tubes until analyses. Samples of the certified reference material “marine sediment PACS-2” obtained from the National Research Council Canada (NRCC) were digested and treated in the same manner as described for the sediment samples.
Additionally, about 1 g of the freeze-dried, homogenized sediment was weighed into crucibles and ashed in a muffle furnace for 2 h at 550 °C to estimate the organic matter (OM) as percent ash free dry weight (AFDW) by loss on ignition [24].
2.3. Analytical Measurements
At all sampling sites, temperature (T), pH, electrical conductivity (EC), total dissolved solids (TDS), and salinity were determined monthly at approximately 10 cm below the water surface using a 556 MPS Handheld Multiparameter Instrument (YSI, Yellow Springs, OH, USA).
The analysis of dissolved Na, Mg, K, Ca, Mn, Fe, Co, Ni, Zn, As, Sr and Cd in water was carried out using flame atomic absorption spectroscopy (F-AAS, AAnayst 200 by Perkin Elmer, Waltham, MA, USA), total x-ray reflection fluorescence spectroscopy (TXRF, S2 PicoFox, Bruker, Billerica, MA, USA) or graphite furnace atomic absorption spectroscopy (GF-AAS, PinAAcle 900Z by Perkin Elmer, Waltham, MA, USA), depending on the concentration of the elements in the samples and the limits of detection of the instruments used. The determination of dissolved Ag, Pt, Au and U in the water samples was conducted in the Analytical Facility, University of Johannesburg, using inductively coupled plasma mass spectrometry (ICP-MS, NeXION 300x by Perkin Elmer, Waltham, MA, USA). For ICP-MS measurements, Ir and Rh functioned as internal standards.
For the determination of the activity concentrations of 238U and 234U, total uranium was separated from the acidified water sample (8 M HCl solution) by ion exchange on Dowex 1 × 2 (100–200 mesh), followed by elution with 0.1 M HCl. After microprecipitation of U with neodymium fluoride, this alpha-source was measured with a PIPS Si surface barrier detector (Canberra™, Atlanta, GA, USA).
The trace elements Ti, V, Ni, Cu, Zn, As, Rb, Sr, Ag, Cd, Pt, Au, Hg, Pb and U in sediment leachates were measured using TXRF or GF-AAS, depending on the element and content. The total mercury (Hg) content of sediment samples was measured using a cold vapor atomic absorption spectrometer (CV-AAS; FIMS 400 by Perkin Elmer, Waltham, MA, USA). The trace element content in sediment was determined as mg/kg of dry weight (dw). Table S1 gives the limits of detection for elements using the corresponding method as well as the recovery rates of the reference material PACS-2 by NRCC for the respective methods under applied conditions.
2.4. Evaluation of Sediment and Water Quality
Where applicable and published, the South African Water Quality Guidelines (SA-WQG) were used to evaluate the pollution of the water [25]. Additionally, the environmental quality standards in the field of water policy from the European Union [26] as well as the Guidelines for Alberta Surface waters [27] were consulted. The parameters taken from these guidelines were the target water quality range (TWQR), the chronic effect value (CEV) as well as the acute effect value (AEV). The TWQR refers to the ideal or desired concentration range, and the CEV describes the concentration limit that is considered safe for most aquatic organisms during continuous exposure, with the risk of unacceptable long-term and short-term effects when exceeded. The AEV describes a concentration at which (and above which) a statistically significant acute adverse effect is predicted to occur [28].
Parameters for the evaluation of sediments were not available from South African authorities, which is why the following references were used: Canadian Sediment Quality Guidelines [29], as well as Australian and New Zealand Quality Guidelines [30]. The parameters used were the threshold effect level (TEL), the consensus-based levels below which toxic effects are rarely observed in sediment-dwelling organisms; consensus-based probable effect level (PEL), the concentrations above which toxic effects are generally observed. Additionally, the Shale–Upper Earth’s crust geochemical average background value was taken to estimate elevated contents of toxic elements [31].
2.5. Statistical Analysis
To evaluate the statistical differences in element content in water and sediments from different sites, SigmaPlot 14.0 (Systat Software Inc., San Jose, CA, USA) was used. Normality of the data was checked using the Shapiro-Wilk test. As all data sets were not normally distributed, the non-parametric Mann-Whitney U test was performed for pairwise comparisons. All differences were tested for significance at p < 0.05. For the determination of the correlation between U content in sediment and the OM content in sediment a Spearman’s Rank Order Correlation was performed using Origin 2020b (OriginLab, Northampton, MA, USA).
3. Results and Discussion
3.1. Physico-Chemical Water Parameters, Dissolved Major Components
The physico-chemical water parameters from all sampling sites, as well as the results of the dissolved major and trace element analyses, are presented in Table 2. The mean EC and TDS content were significantly higher at site 1. This site is directly fed by the MIW from the treatment plant. Neutralization methods in the treatment—including the addition of limestone, aeration, settling, and coagulation—substantially increase the EC and TDS of the water at site 1. Especially the addition of limestone (CaCO3) can explain the high EC. Following the course of the river system, major dilution effects were observed during the whole observation period, resulting in significantly lower mean values for EC. A pre-treatment EC measurement at site 1 by Coetzee et al. [19] of 3.6 mS/cm is well comparable to our mean results. They credited the high mineralization of the water even before treatment at site 1 to AMD and the subsequent dissolution of elements from the host rock including Al, Mn, Ca, and Mg as well as high quantities of sulfates. The Mg and Ca concentrations detected in this study were much higher than reported in pre-treatment times [20]. They can be attributed to AMD treatment and were exceeded by far by the contributions from aquifers in the area rich in Ca2+ and Mg2+, as described by Hobbs and Cobbing [18]. Importantly, the pH of 3.14 measured by Coetzee et al. [19] at the same site was much lower than any of our measured pH values, which can easily be explained by the alkalinization during AMD treatment. Interestingly, during the winter months a significant drop in pH was observed at site 1, which was not recorded at any other sampling site. This raised the question if the AMD treatment was fully functional at this time. Irregularities in the treatment potentially causing the temporary increase were also reported by the Trans-Caledon Tunnel Authority [32]. During our observation period and analogous to the mean EC value, the mean concentrations of Ca2+ as well as Mg2+ decreased significantly from site 1 to site 7. Further downstream from site 1, where the Bloubankspruit and the Crocodile River (West) merge with the Tweelopiespruit, a clear dilution effect is evident because the Mg2+ and Ca2+ concentrations in those two rivers were comparatively low (Table 2).
Table 2.
Mean, as well as, Min—Max values of physico-chemical parameters and soluble analytes from sampling sites 1–7, b.d.: below the limit of detection (LOD), sampling size for each site: n = 13.
Similar dilution effects were also observed for Na+, with significantly higher levels in site 1 and continuously decreasing concentrations downstream. However, there were no significant differences in the concentrations of K+ in the water phase for any sampling sites. This indicates that AMD and water treatment did not influence the concentration of this metal.
3.2. Dissolved Trace Elements
Similarly to major components, trace element concentrations were significantly higher at site 1. The order of mean concentrations of dissolved trace elements in water at site 1 was the following: Mn > Fe > Ni > Sr > Zn > Co > U > As > Cd. Dissolved Pt, Au, and Pb could not be detected in any of the samples. All other observed element concentrations were subject to high temporal variations, with the highest concentrations recorded for Mn, Fe, Ni, and Zn during the months from June to August (Figure 2). Cd and As concentrations were comparatively low (Table 2) and did not occur in concentrations of concern. In the following, trace elements that were abundant in concentrations of environmental concern as well as elements experiencing high temporal variations are discussed.
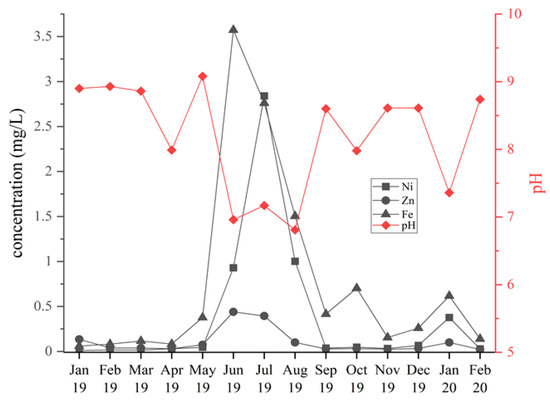
Figure 2.
Temporal variation of dissolved trace elements at sampling site 1 and change in pH during the same period of time (second y-axis).
3.2.1. Manganese
Dissolved Mn concentrations at site 1 showed extremely high temporal variation (Table 2). During the South African winter months, a maximum concentration of 178 mg/L dissolved Mn was recorded. However, Mn concentrations in the water phase of site 1 did not exceed 1 mg/L in 9 out of the 13 samples, leading to an extremely high standard deviation (mean: 21.6 ± 49.1 mg/L). Previous publications examining site 1 found concentrations of dissolved Mn between 11.4 and 192 mg/L [19,20,33], which is well comparable to those measured in this study. Under AMD conditions, large quantities of Mn (II) are typically present in acidic MIW. Through limestone and aeration treatment and the resulting change in pH and redox conditions, the metal is oxidized, hydrolyzed, and precipitated as Mn (IV) oxides [34]. Therefore, high Mn concentrations in pre-treated acidic MIW were expected; nonetheless, finding similar concentrations in some of our post-treatment samples was unexpected. In June, July, and August the Mn concentration was much higher than in all other months. These South African winter months mark the dry season of the year, which would introduce evapoconcentration as a possible cause of elevated metal concentrations in the water phase [35]. However, looking at major cations and especially Ca2+, a clear concentration decrease in the same period was observable, which speaks against presumptions of precipitation/ evaporation influences. Additionally, lower values of other physico-chemical parameters such as pH and EC were evident for the same months. The pH at site 1, for example (mean of 8.21 ± 0.77), was lowest, and ranged between 6.81 and 7.17 from June to August. Sufficient removal of Mn requires a pH of ~8 according to Silvia et al. [36], explaining the sharp increase of Mn during that time. The mean concentrations of dissolved Mn at sampling site 2 were not significantly different from site 1. One reason could be the geographical proximity of site 2 to mine dumps, abandoned mines, and the potential inflow of MIW in, e.g., rainy periods in the South African summer months. Significantly lower concentrations of dissolved Mn were found at sites 5–7 (versus sites 1–4). This can be attributed to dilution effects from confluences, as the Crocodile River (West) site 5 contained the lowest levels of dissolved Mn. The SA-WQG for aquatic ecosystems [25] by the Department of Water Affairs and Forestry provided information on dissolved Mn with a TWQR of ≤0.18 mg/L Mn, a CEV = 0.37 mg/L Mn as well as an AEV = 1.3 mg/L Mn. The maximum concentrations of dissolved Mn in sites 1–4 all exceeded the AEV, and the mean concentrations of these sites also surpassed the CEV. Only the concentrations at sites 5–7 were predominantly (<90%) in the TWQR and mean concentrations were below the CEV, indicating potential toxic effects for aquatic organisms, especially at site 1.
3.2.2. Iron
The mean dissolved Fe concentration at site 1 was significantly higher than at sites 3–7, with a maximum content of 3.71 mg/L in June. Pre-treatment concentrations of dissolved Fe showed highly diverse results ranging from 9.3 to 438 mg/L [18,19,20]. Even the maximum level in our study was significantly lower compared to previously published values. The dissolution of Fe is highly dependent on pH and redox potential, and the metal is easily mobilized in acidic settings [37]. Interestingly, the Fe concentrations correspondingly increased in the same period as Mn, even if the extent of the surge was less pronounced. Differences in the increase of Fe and Mn concentrations could be explained by the chemical behavior in terms of the solubility of both metals with rising pH. Whereas the removal of dissolved Mn from the aqueous phase is sufficient at a pH of around 8, Fe precipitates as Fe(III) in Schwertmannite (Fe163+[O16(OH)10(SO4)3]·10H2O) at pH < 4 and ferrihydrite (Fe3+10O14(OH)2) at pH > 4 [36,38]. The temporary increase of Fe and other metals as well as the decrease in pH indicated that the MIW treatment was somehow flawed over a certain period (Figure 2).
The mean concentrations of dissolved Fe in sampling site 2 were not significantly different from site 1. The same reasoning as explained for Mn could be responsible because the dissolution of both metals is a primary indicator for AMD or acidic rock drainage (ARD). The low solubility of Fe (III) became evident in the further course of the river system: dissolved Fe concentrations were significantly lower in sites 3–7. According to the TWQR in the SA-WQG, a variation of the background iron concentration of more than 10 % is undesired. Regardless of the background, the dissolved concentrations varied greatly during sampling and increased by 995 % at site 1 from May to June. We, therefore, conclude that the TWQR was not reached either at site 1 or at the other sampling sites.
3.2.3. Nickel
The mean dissolved Ni concentration was significantly higher at site 1 than at all other sites. Sites 2–7 did not experience significant differences when compared to one another and remained rather constant during the 13-month sampling period. Comparison with pre-treatment concentrations of dissolved Ni at site 1 by Coetzee et al. [19] showed that the content decreased drastically from 16 mg/L to a mean concentration of 0.391 mg/L in our study, still showing a high variability with concentrations ranging from 0.011–2.84 mg/L. The fate and decrease of Ni in treated MIW have been associated with the co-precipitation of the trace metal with iron [39]. Batch experiments by Miller et al. [40] showed that interactions with surface sites of precipitated Fe and Al compounds and rising pH led to an increased removal of Ni. In this regard, some pathways in which Fe(III) hydroxides acted as a sink for Ni and other trace metals in MIW treatment have already been described in the literature, including adsorption, absorption, surface precipitation, and co-precipitation [38,40,41,42]. The SA-WQG does not include data on Ni. After consulting the guidelines of the European Union as well as the Alberta Government, a solid assessment concerning the toxicity of dissolved Ni towards aquatic organisms in the freshwater system is not trivial because different guidelines suggest a wide concentration range [26,27]. The reasoning for that is the reduced toxicity of this metal with the rising hardness of the water. Due to the extremely high content of Ca2+ as well as Mg2+ in the water of site 1, the immediate effect on aquatic environments is more difficult to predict. However, note that the temporarily reached concentrations are up to 100x higher than in typical surface freshwater bodies, underlining the burden of dissolved Ni in the MIW at site 1.
3.2.4. Zinc
A similar, yet less pronounced trend was evident for Zn in previously published literature [18,19,20] for site 1: the values in those earlier studies ranged between 0.19 and 6.8 mg/L of dissolved Zn compared to the mean concentration of 0.11 mg/L in this study. Analogous to Ni, Zn potentially co-precipitates with Fe, which would explain the comparatively lower concentrations in our post-treatment study. In all other sampling sites, significantly lower mean concentrations were measured compared to site 1. The SA-WQG report for aquatic ecosystems proposed a TWQR of ≤0.002 mg/L and a CEV of 0.0036 mg/L dissolved Zn, which were surpassed in every measurement at all sampling sites. The AEV of 0.036 mg/L was also exceeded at least once at every sampling site and in the mean content of sites 1 and 3. This indicates that, according to the guidelines, the system and especially site 1 is still heavily polluted with Zn, potentially causing adverse chronic and acute effects.
3.2.5. Uranium
The mean dissolved U concentrations (Figure 3) at site 1 were significantly higher than at all other sampling sites. The mean concentration there was 18.1 ± 15.1 µg/L, which was lower than pre-treatment measurements with concentrations ranging between 36 and 232 µg/L [19,20]. In January 2019, the activity concentrations of 238U and 234U were additionally measured and were 77.5 ± 4.2 and 87.5 ± 4.5 mBq/L, respectively, corresponding to a uranium mass concentration of 6.3 ± 0.3 μg/L. The 234U/238U activity ratio was 1.13 ± 0.08, a value typical for dissolved natural uranium. In all other sampling sites, the mean concentrations of dissolved U did not exceed 1 µg/L. In the oxidized condition as present in the MIW, U occurs as readily soluble and mobile UO22+, forming complexes in the prevalent neutral conditions [43,44].
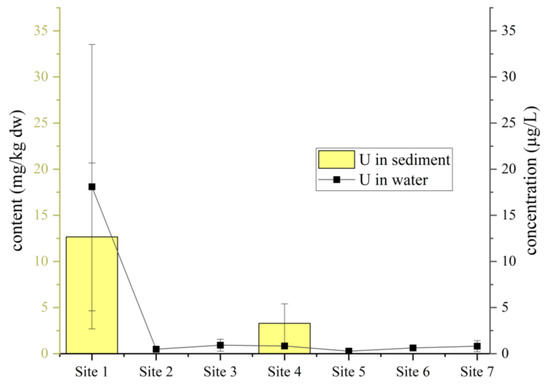
Figure 3.
Mean ± SD uranium content in sediments and dissolved U concentrations in water of sampling sites along the course of mining-influenced water.
The lower mean concentrations in the following sampling sites can be explained by the sorption of U(VI) on Fe-oxide minerals as well as organic materials, thereby reducing environmental transportation [45]. The SA-WQG for aquatic life does not include this element, and international guidelines for concentrations of U in freshwater systems for the protection of aquatic life are scarce. Water quality guidelines for the protection of aquatic life in Canada include U and introduce a maximum short-term concentration of 33 µg/L and a long-term concentration of 15 µg/L. Although the international comparison is difficult because the toxicity of metals depends on many factors such as climate, geological soil composition, and water composition, the highest concentration measured (66 µg/L) clearly surpassed all limits and the mean concentration also exceeded the long-term concentration limit of 15 µg/L. Therefore, dissolved U levels at site 1 must be considered toxic for aquatic organisms.
3.3. Trace Elements in Sediments
The mean concentrations (±SD) of trace elements and the organic matter content in the sediment of sampling sites 1–7 over time are summarized in Table 3. The content of Fe and Mn in sediment was within the range of percentages described in the literature for AMD and mining-impacted areas [46]. Therefore, their content was not included in the results and discussion of trace elements in sediments.
Table 3.
Content of trace elements (mg/kg dw) and organic matter content (OM in %) in surface sediment samples from all sampling sites, b.d.: below the limit of detection (LOD), sampling size for each site: n = 13.
Comparatively higher concentrations for most trace elements were measured at sites 1 and 4. The concentration order of trace elements in sediment for site 1 was Ti > Zn > Ni > Cr > As > Sr > V > Cu > Pb > U > Rb > Au > Hg > Cd > Ag, which is similar to site 4 but nonetheless showed some significant differences. Site 1 showed a significantly higher mean content for Zn, Ni, As and U, whereas significantly higher contents of Cr and Cu, were measured at site 4. The only element experiencing a higher content at another sampling site besides 1 and 4 was Ti at site 7.
The mean OM content of sediments was significantly higher at site 1 than at any other sampling site. Additionally, a significantly higher content (compared to sites 2, 3, 5, 6, and 7) was measured at site 4.
Hg and Cd concentrations in sediments of all sampling sites were not of concern and are not furtherly discussed.
Elements that either appeared in concentrations of concern or displayed an interesting behavior are discussed in the following:
3.3.1. Nickel
The mean Ni content of sediment (±SD) from all sites is shown in Table 3. For the graphical depiction (Figure 4), we chose to omit sites 2 and 5 because the metal contents there had no apparent impact on sediment levels in the following system. Moreover, physico-chemical reactions leading to the observed distribution were easier to follow from site 1 onwards along the course of the MIW. The Ni content at sites 1 and 4 was significantly higher than at any other site (Figure 4). The highest content was measured at site 1 (107 ± 43 mg/kg), reflecting AMD and the fast (co-)precipitation of Ni from the water phase as previously discussed. The elevated value at site 4 can be attributed to slower flow velocity and thereby a higher sedimentation rate; the recorded higher OM content at this site might also contribute to capturing Ni in the sediment [47]. Low levels in site 7 point to a depletion of Ni from the system during downstream transportation, especially at site 4, leading to lower levels in the sediment of site 7. Regarding the risk associated with Ni levels, note that no data are available from the Canadian sediment quality guidelines, but the Australian and New Zealand Guidelines introduced a TEL of 15.9 mg/kg and a PEL of 42.8 mg/kg for Ni in sediment [30]. The mean value at sites 1 and 4 exceeded the PEL, and the mean content at sites 2, 3, 6 and 7 was above the TEL. The influence of MIW regarding Ni on the entire system was clear. Only the mean content at site 5 was slightly below the TEL. We assume that the Ni content at site 1 (highest value: 165 mg/kg) is harmful to aquatic life, even though the bioavailability and toxicity of Ni on sediment-dwelling organisms is discussed controversially and highly dependent on a combination of factors including DOC, Fe, and Mn content as well as the acid volatile sulfide content [48,49,50].
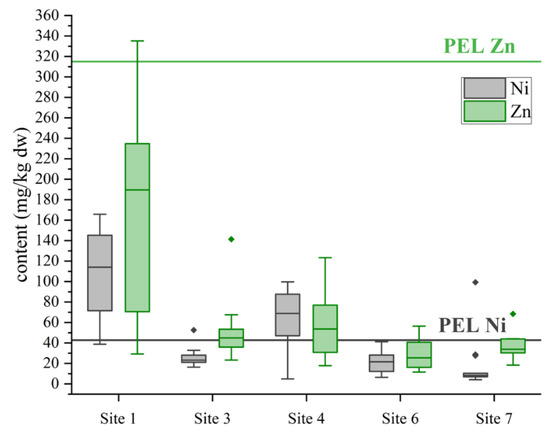
Figure 4.
Box plot including probable effect level (PEL) for Ni and Zn indicated with straight lines in sediments from sites along the course of the mining-influenced water.
3.3.2. Zinc
The PEL of 315 mg/kg was never exceeded for Zn, and the TEL of 123 mg/kg was exceeded in some samples at sites 1 and 4. As described for Ni above, the two upstream sampling sites 2 and 5 had no apparent major influence on the Zn content in the following system, which is why they were excluded from Figure 4, where the distribution of Zn in sediment along the course of the MIW is presented. Interestingly, the concentrations in the dissolved phase gave reason for greater concern, compared to the sediment phase. Our results suggest that most of the Zn sedimentation took place at sites 1 and 4. At site 1 this can be interpreted as a sign of fast (co-)precipitation of Zn under the circum-neutral conditions of the treated MIW. At site 4, Zn followed the pattern of Ni and the higher content indicated a possible accumulation at this organic-rich sediment site [47,51]. Zn is an essential element and is tightly regulated by aquatic organisms. Hence, slightly elevated levels in the sediment, as occurring at site 1, might not pose a risk to aquatic biota [52,53].
3.3.3. Arsenic
The mean As content of sediment at site 1 was significantly higher than at all other sites. To elucidate the trend along the course of the MIW, sites 2 and 5 were again not included in Figure 5, where the As content at the different sampling sites is depicted. The As pollution at site 1 has been described in the past [54]. Singh et al. [54] stated a content of 21 mg/kg As in sediment, which is lower than the mean content measured in this study (76.2 ± 39.7 mg/kg). In general, arsenic pollution of sediments caused by AMD is a known issue. This is because As can replace S in most metal sulfide minerals (such as pyrite) due to their geochemical resemblance [55]. Similar to other trace elements and depending on factors such as dissolved oxygen and pH, As is easily soluble in MIW. Through treatment and neutralizing water parameters, the fate of dissolved As is determined by sorption onto, e.g., iron hydroxides and co-precipitation. This explains the significantly higher content on the site closest to the mine in our study [56,57]. The PEL of 17 mg/kg was by far transcended in all samples at site 1. Additionally, the mean contents at sites 2, 3, and 7 were above the TEL. Especially sediment at site 1 was contaminated and problematic for benthic and thus also pelagic aquatic ecosystems. Even years after the implementation of the MIW treatment, the sediment at site 1 was still heavily polluted with As, showing an ongoing process of deposition of As compounds into the sediment. In the water phase, dissolved As was not detectable, but in the case of As, iron-rich sediment has proven to be the accumulating compartment for As [58] because prevalent As species display a high affinity toward iron oxides [55]. Cruz-Hernández et al. [58] described that the transformation of the mainly occurring AMD iron precipitation (schwertmannite) to goethite over time potentially causes some of the previously retained As to be released. Accordingly, even though As precipitation occurred, a subsequent remobilization should be considered and potentially explains the content above the TEL at site 3.
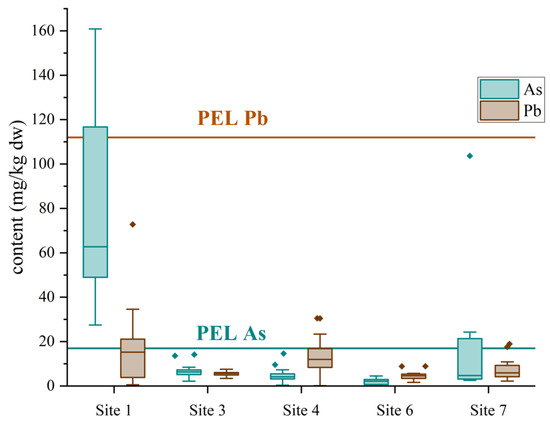
Figure 5.
Box plot, as well as the probable effect level (PEL) for Ni and Zn, indicated with straight lines in sediments from sites along the course of the mining-influenced water.
3.3.4. Lead
The mean Pb content of sediment was significantly higher at site 1 than elsewhere along the course of the mining-influenced water (Figure 5) and showed slightly higher concentrations at the organic matter-rich sediment site 4, thereby following the trend of several metals. The PEL of 112 mg/kg was never exceeded in any measurement. The TEL of 30.2 mg/kg was transcended for only a few measurements at sites 1 and 4. We assume that most of the Pb co-precipitated with Fe under the circum-neutral conditions because no Pb was detectable in the water phase at any sampling site [38]. Pb is a non-essential element and studies indicate that already extremely small amounts might lead to adverse health effects in biota [59]. However, considering that Pb was not detectable in water and hardly exceeded the TEL in sediment, we conclude that Pb in the river system was less likely to cause adverse effects in aquatic organisms compared to other more abundant trace elements in the system such as As.
3.3.5. Uranium
The mean U content in sediment at site 1 was 12.7 ± 8.9 mg/kg and 3.29 ± 2.12 at site 4 (Figure 3). Elsewhere, it was below the limit of detection (2 mg/kg). The highest levels were expected close to the MIW discharge due to the described sorption of dissolved U onto Fe-oxides and their consequent precipitation. The concentration in the water phase was quite constant from sites 2–7, which was not seen for sediment samples (Figure 3). At site 4, precipitation was elevated. Besides co-precipitation, other factors such as lowered flow velocity of the river and higher organic carbon content in sediment are important factors in retaining U in sediments [60]. At site 4, the water was slightly dammed and the flow decreased compared to other sampling sites. The OM content was significantly higher compared to all other sites except site 1. We also identified a strong positive correlation between U and OM content in sediment from these sites (Figure 6), which is consistent with the literature [61,62]. Although no governmental data for risk assessment of U in sediment are available, the comparison of our levels with the earth’s crust means (3.5 mg/kg) clearly shows elevated values [31]. Singh et al. [54] stated adverse effects in biota at a U sediment concentration of 30 and 34 mg/kg at the same localities. The maximum content of 32.2 mg/kg U measured in this study is well comparable to the previously published values and also indicated harmful effects on the immediate biological environment.
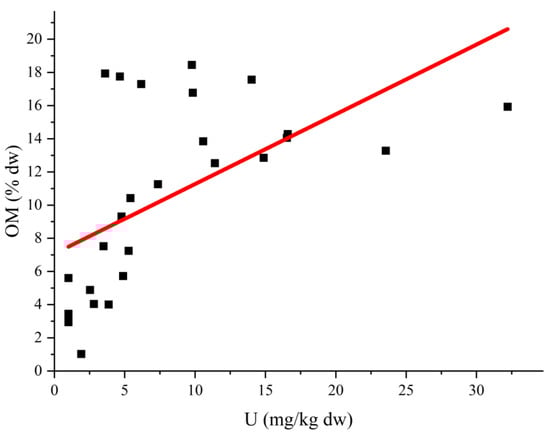
Figure 6.
Positive correlation (Spearman’s Rank Order Correlation = 0.69) of OM and uranium content in sediment from sites 1 and 4.
4. Conclusions
Combining the results of water and sediment analysis over the 13-month period shed light on the physico-chemical state of the post-treatment upper reaches of the Crocodile River (West) system. During the period of investigation, elevated levels of dissolved as well as sedimentary elements were recorded, no doubt due to the outflow from a former gold mine. The concentration of some dissolved metals (e.g., Ni, Fe, Zn) increased significantly between June and August at the sampling site closest to the mine. This demonstrates the fragility of the river system and the necessity for continuous treatment of mine-influenced water entering into it. Otherwise, as shown in this study, the (temporary) release of dissolved metals and metalloids in environmentally toxic concentrations continues to contaminate water and sediment in the river system. These findings are also important indicators for other river systems around the globe and imply that the monitoring of AMD-affected rivers should be continued even after the implementation of treatment facilities. The pollution of the sediment in this case study was especially severe at sampling sites 1 and 4, with a high content of several toxic elements including As, U and Ni. This demonstrates that site 1 is clearly polluted with the deposition of metals in the sediment following their (co-)precipitation as a result of AMD and inefficient treatment. This also indicates chronic mobilization of toxic elements from this polluted site, leading to elevated and potentially harmful contents in the sediment at downstream sites, especially site 4. To elucidate the possible effects of the chronic contamination within the river system on the biota, including plants and fish, a follow-up study will be conducted.
Supplementary Materials
The following supporting information can be downloaded at: https://www.mdpi.com/article/10.3390/app122010531/s1, Table S1: Recovery rates for the analyses of certified reference material PACS-2 by NRCC for respective methods and LODs under the applied conditions; Table S2: Limits of detection (LOD) for dissolved componence in the water phase for the different methods used under applied conditions.
Author Contributions
Conceptualization, F.J. and A.A.-O.; validation, J.W. and A.G.; sample preparation and analysis, J.W., A.G. and G.W.; investigation J.W., B.M.G. and Q.M.D.S.; data curation, J.W.; writing—original draft preparation, J.W.; writing—review and editing, J.W., F.J. and A.A.-O.; supervision, F.J. and A.A.-O. All authors have read and agreed to the published version of the manuscript.
Funding
This research was partly funded by the OeAD, Austria’s Agency for Education and Internationalisation, with a grant within a Scientific & Technological Cooperation (S & T Cooperation) (Grant nr. ZA 072019). South African National Research Foundation (Grant nr. STGR180409318751) bilateral program funding, University of Johannesburg (UJ) URC and FRC funding and infrastructure to A.A.-O. and UJ-GES for Post-doctoral funding to Q.M.D.S., UJ Spectrum for Postdoctoral funding to B.M.G.
Acknowledgments
The authors would like to thank Jabulani Ndaba for assisting in sampling and in situ measurements and Michael Stachowitsch for proofreading the manuscript.
Conflicts of Interest
The authors declare no conflict of interest.
References
- Nriagu, J.O. Global inventory of natural and anthropogenic emissions of trace metals to the atmosphere. Nature 1979, 279, 409–411. [Google Scholar] [CrossRef] [PubMed]
- Rai, P. Heavy Metal Pollution in Aquatic Ecosystems and Its Phytoremediation Using Wetland Plants: An Ecosustainable Approach. Int. J. Phytoremediat. 2008, 10, 131–158. [Google Scholar] [CrossRef] [PubMed]
- Miller, J.R.; Hudson-Edwards, K.A.; Lechler, P.J.; Preston, D.; Macklin, M.G. Heavy metal contamination of water, soil and produce within riverine communities of the Río Pilcomayo basin, Bolivia. Sci. Total Environ. 2004, 320, 189–209. [Google Scholar] [CrossRef]
- Kabata-Pendias, A. Trace Elements in Soils and Plants, 4th ed.; CRC Press, Taylor & Francis Group: Boca Raton, FL, USA, 2011; p. 520. [Google Scholar]
- Sorensen, P. Mining in South Africa: A mature industry? Int. J. Environ. Stud. 2011, 68, 625–649. [Google Scholar] [CrossRef]
- Naicker, K.; Cukrowska, E.; McCarthy, T.S. Acid mine drainage arising from gold mining activity in Johannesburg, South Africa and environs. Environ. Pollut. 2003, 122, 29–40. [Google Scholar] [CrossRef]
- Statistic South Africa. Statistical Release P0302, Mid-Year Population Estimates; Statistic South Africa: Pretoria, South Africa, 2022; p. 50. [Google Scholar]
- Lusilao-Makiese, J.G.; Cukrowska, E.M.; Tessier, E.; Amouroux, D.; Weiersbye, I. The impact of post gold mining on mercury pollution in the West Rand region, Gauteng, South Africa. J. Geochem. Explor. 2013, 134, 111–119. [Google Scholar] [CrossRef]
- Cobbing, J.E. Institutional Linkages and Acid Mine Drainage: The Case of the Western Basin in South Africa. Int. J. Water Resour. Dev. 2008, 24, 451–462. [Google Scholar] [CrossRef]
- McCarthy, T.S. The impact of acid mine drainage in South Africa. S. Afr. J. Sci. 2011, 107, 1–7. [Google Scholar] [CrossRef]
- Gray, N.F. Acid mine drainage composition and the implications for its impact on lotic systems. Water Res. 1998, 32, 2122–2134. [Google Scholar] [CrossRef]
- Simate, G.S.; Ndlovu, S. Acid mine drainage: Challenges and opportunities. J. Environ. Chem. Eng. 2014, 2, 1785–1803. [Google Scholar] [CrossRef]
- Miranda, L.S.; Wijesiri, B.; Ayoko, G.A.; Egodawatta, P.; Goonetilleke, A. Water-sediment interactions and mobility of heavy metals in aquatic environments. Water Res. 2021, 202, 117386. [Google Scholar] [CrossRef] [PubMed]
- Cheng, H.; Hu, Y.; Luo, J.; Xu, B.; Zhao, J. Geochemical processes controlling fate and transport of arsenic in acid mine drainage (AMD) and natural systems. J. Hazard. Mater. 2009, 165, 13–26. [Google Scholar] [CrossRef] [PubMed]
- Malinovsky, D.; Rodushkin, I.; Moiseenko, T.; Öhlander, B. Aqueous transport and fate of pollutants in mining area: A case study of Khibiny apatite–nepheline mines, the Kola Peninsula, Russia. Environ. Geol. 2002, 43, 172–187. [Google Scholar] [CrossRef]
- Mayes, W.M.; Potter, H.A.B.; Jarvis, A.P. Inventory of aquatic contaminant flux arising from historical metal mining in England and Wales. Sci. Total Environ. 2010, 408, 3576–3583. [Google Scholar] [CrossRef] [PubMed]
- Wolkersdorfer, C.; Mugova, E.; Daga, V.S.; Charvet, P.; Vitule, J.R.S. Effects of Mining on Surface Water—Case Studies. In Encyclopedia of Inland Waters, 2nd ed.; Mehner, T., Tockner, K., Eds.; Elsevier: Oxford, UK, 2022; pp. 210–224. [Google Scholar] [CrossRef]
- Hobbs, P.J.; Cobbing, J.E. Hydrogeological Assessment of Acid Mine Drainage Impacts in the West Rand Basin, Gauteng Province; CSIR (Council for Scientific and Industrial Research)/THRIP (Technology and Human Resource for Industry Programme: Pretoria, South Africa, 2007. [Google Scholar]
- Coetzee, H.; Horstmann, U.; Ntsume, G.; Croukamp, L. The potential environmental impact of the decant of water from Witwatersrand. In Proceedings of the 8th International Congress on Mine Water and the Environment, Johannesburg, South Africa, 23–26 June 2003. [Google Scholar]
- Durand, J.F. The impact of gold mining on the Witwatersrand on the rivers and karst system of Gauteng and North West Province, South Africa. J. Afr. Earth Sci. 2012, 68, 24–43. [Google Scholar] [CrossRef]
- Akcil, A.; Koldas, S. Acid Mine Drainage (AMD): Causes, treatment and case studies. J. Clean. Prod. 2006, 14, 1139–1145. [Google Scholar] [CrossRef]
- Skousen, J. Overview of Acid Mine Drainage Treatment with Chemicals. In Acid Mine Drainage, Rock Drainage, and Acid Sulfate Soils; John Wiley & Sons: Hoboken, NJ, USA, 2014; pp. 325–337. [Google Scholar] [CrossRef]
- DWAF. The Development of a Reconciliation Strategy for the Crocodile (West) Water Supply System: Summary of Previous and Current Studies; Department of Water Affairs and Forestry: Pretoria, South Africa, 2008; p. 62.
- Wetzel, R.G.; Likens, G.E. Limnological Analyses; Springer: New York, NY, USA, 1991. [Google Scholar] [CrossRef]
- DWAF. South African Water Quality Guidelines, Volume 7: Aquatic Ecosystems, 2nd ed.; Department of Water Affairs and Forestry, CSIR (Council for Scientific and Industrial Research) Environmental Services Pretoria, Republic of South Africa: Pretoria, South Africa, 1996; p. 145.
- EU. Directive 2008/105/EC of the European Parliament and of the Council of 16 December 2008 on environmental quality standards in the field of water policy, amending and subsequently repealing Council Directives 82/176/EEC, 83/513/EEC, 84/156/EEC, 84/491/EEC, 86/280/EEC and amending Directive 2000/60/EC of the European Parliament and of the Council. Off. J. Eur. Union 2008, L348, 84–97. [Google Scholar]
- GoA. Guidelines for Alberta Surface Waters; Government of Alberta; Water Policy Branch, Alberta Environment and Parks: Edmonton, AB, Canada, 2018.
- Roux, D.; Jooste, S.; MacKay, H.M. Substance-specific water quality criteria for the protection of South African freshwater ecosystems: Methods for derivation and initial results for some inorganic toxic substances. S. Afr. J. Sci. 1996, 92, 198–206. [Google Scholar]
- CCME. Canadian sediment quality guidelines for the protection of aquatic life. In Canadian Environmental Quality Guidelines; Canadian Council of Ministers of the Environment: Winnipeg, MB, Canada, 1999. [Google Scholar]
- ANZECC & ARMCANZ. Australian and New Zealand Guidelines for Fresh and Marine Water Quality. Volume 2: Aquatic Ecosystems—Rationale and Background Information; Australian and New Zealand Environment and Conservation Council and Agriculture and Resource Management Council of Australia and New Zealand: Artarmon, Australia, 2000.
- Turekian, K.T.; Wedepohl, K.H. Distribution of the Elements in Some Major Units of the Earth’s Crust. GSA Bull. 1961, 72, 175–192. [Google Scholar] [CrossRef]
- Contributor, G. Western Basin Faces Latest Acid Mine Drainage Decant Threat. Available online: https://www.miningreview.com/southern-africa/western-basin-faces-acid-mine-drainage-decant-threat/ (accessed on 16 August 2022).
- Shapi, M.; Jordaan, M.A.; Mbambo, A.T.; Davies, T.C.; Chirenje, E.; Dube, M. Determination of Potentially Harmful Element (PHE). Distribution in Water Bodies in Krugersdorp, a Mining City in the West Rand, Gauteng Province, South Africa. Minerals 2021, 11, 1133. [Google Scholar] [CrossRef]
- España, J.; Pamo, E.; Santofimia, E.; Andrés, J.; RubÍ, J. The Impact of Acid Mine Drainage on the Water Quality of the Odiel River (Huelva, Spain): Evolution of Precipitate Mineralogy and Aqueous Geochemistry Along the Concepción-Tintillo Segment. Water Air Soil Pollut. 2006, 173, 121–149. [Google Scholar] [CrossRef]
- DFFE. Historical Rain, South African Weather Service. Available online: https://www.weathersa.co.za/home/historicalrain (accessed on 30 September 2022).
- Silva, A.M.; Cruz, F.L.S.; Lima, R.M.F.; Teixeira, M.C.; Leão, V.A. Manganese and limestone interactions during mine water treatment. J. Hazard. Mater. 2010, 181, 514–520. [Google Scholar] [CrossRef] [PubMed]
- Dillon, P.J.; Evans, H.E.; Scholer, P.J. The effects of acidification on metal budgets of lakes and catchments. Biogeochemistry 1988, 5, 201–220. [Google Scholar] [CrossRef]
- Lee, G.; Bigham, J.M.; Faure, G. Removal of trace metals by coprecipitation with Fe, Al and Mn from natural waters contaminated with acid mine drainage in the Ducktown Mining District, Tennessee. Appl. Geochem. 2002, 17, 569–581. [Google Scholar] [CrossRef]
- Cravotta, C.; Trahan, M. Limestone drains to increase pH and remove dissolved metals from acidic mine drainage. Appl. Geochem. 1999, 14, 581–606. [Google Scholar] [CrossRef]
- Miller, A.; Figueroa, L.; Wildeman, T. Zinc and nickel removal in simulated limestone treatment of mining influenced water. Appl. Geochem. 2011, 26, 125–132. [Google Scholar] [CrossRef]
- Karthikeyan, K.G.; Elliott, H.A.; Cannon, F.S. Adsorption and Coprecipitation of Copper with the Hydrous Oxides of Iron and Aluminum. Environ. Sci. Technol. 1997, 31, 2721–2725. [Google Scholar] [CrossRef]
- Kairies, C.L.; Capo, R.C.; Watzlaf, G.R. Chemical and physical properties of iron hydroxide precipitates associated with passively treated coal mine drainage in the Bituminous Region of Pennsylvania and Maryland. Appl. Geochem. 2005, 20, 1445–1460. [Google Scholar] [CrossRef]
- Waseem, A.; Ullah, H.; Rauf, M.K.; Ahmad, I. Distribution of Natural Uranium in Surface and Groundwater Resources: A Review. Crit. Rev. Environ. Sci. Technol. 2015, 45, 2391–2423. [Google Scholar] [CrossRef]
- Osmond, J.K.; Ivanovich, M. Uranium-Series Mobilization and Surface Hydrology; Clarendon Press: Oxford, UK, 1992. [Google Scholar]
- Duff, M.C.; Coughlin, J.U.; Hunter, D.B. Uranium co-precipitation with iron oxide minerals. Geochim. Cosmochim. Acta 2002, 66, 3533–3547. [Google Scholar] [CrossRef]
- Filipek, L.H.; Nordstrom, D.K.; Ficklin, W.H. Interaction of acid mine drainage with waters and sediments of West Squaw Creek in the West Shasta Mining District, California. Environ. Sci. Technol. 1987, 21, 388–396. [Google Scholar] [CrossRef] [PubMed]
- Shi, Z.; Peltier, E.; Sparks, D.L. Kinetics of Ni Sorption in Soils: Roles of Soil Organic Matter and Ni Precipitation. Environ. Sci. Technol. 2012, 46, 2212–2219. [Google Scholar] [CrossRef] [PubMed]
- Vangheluwe, M.L.; Verdonck, F.A.; Besser, J.M.; Brumbaugh, W.G.; Ingersoll, C.G.; Schlekat, C.E.; Garman, E.R. Improving sediment-quality guidelines for nickel: Development and application of predictive bioavailability models to assess chronic toxicity of nickel in freshwater sediments. Environ. Toxicol. Chem. 2013, 32, 2507–2519. [Google Scholar] [CrossRef] [PubMed]
- Berry, W.J.; Hansen, D.J.; Boothman, W.S.; Mahony, J.D.; Robson, D.L.; Di Toro, D.M.; Shipley, B.P.; Rogers, B.; Corbin, J.M. Predicting the toxicity of metal-spiked laboratory sediments using acid-volatile sulfide and interstitial water normalizations. Environ. Toxicol. Chem. 1996, 15, 2067–2079. [Google Scholar] [CrossRef]
- Besser, J.M.; Brumbaugh, W.G.; Ingersoll, C.G.; Ivey, C.D.; Kunz, J.L.; Kemble, N.E.; Schlekat, C.E.; Garman, E.R. Chronic toxicity of nickel-spiked freshwater sediments: Variation in toxicity among eight invertebrate taxa and eight sediments. Environ. Toxicol. Chem. 2013, 32, 2495–2506. [Google Scholar] [CrossRef]
- Nissenbaum, A.; Swaine, D.J. Organic matter-metal interactions in Recent sediments: The role of humic substances. Geochim. Cosmochim. Acta 1976, 40, 809–816. [Google Scholar] [CrossRef]
- Jirsa, F.; Leodolter-Dvorak, M.; Krachler, R.; Frank, C. Heavy Metals in the Nase, Chondrostoma nasus (L. 1758), and Its Intestinal Parasite Caryophyllaeus laticeps (Pallas 1781) from Austrian Rivers: Bioindicative Aspects. Arch. Environ. Contam. Toxicol. 2008, 55, 619–626. [Google Scholar] [CrossRef]
- Bury, N.R.; Walker, P.A.; Glover, C.N. Nutritive metal uptake in teleost fish. J. Exp. Biol. 2003, 206, 11–23. [Google Scholar] [CrossRef]
- Singh, P.; Nel, A.; Durand, J. The use of bioassays to assess the toxicity of sediment in an acid mine drainage impacted river in Gauteng (South Africa). Water SA 2017, 43, 673–683. [Google Scholar] [CrossRef][Green Version]
- Paikaray, S. Arsenic Geochemistry of Acid Mine Drainage. Mine Water Environ. 2015, 34, 181–196. [Google Scholar] [CrossRef]
- Asta, M.P.; Ayora, C.; Román-Ross, G.; Cama, J.; Acero, P.; Gault, A.G.; Charnock, J.M.; Bardelli, F. Natural attenuation of arsenic in the Tinto Santa Rosa acid stream (Iberian Pyritic Belt, SW Spain): The role of iron precipitates. Chem. Geol. 2010, 271, 1–12. [Google Scholar] [CrossRef]
- Fukushi, K.; Sasaki, M.; Sato, T.; Yanase, N.; Amano, H.; Ikeda, H. A natural attenuation of arsenic in drainage from an abandoned arsenic mine dump. Appl. Geochem. 2003, 18, 1267–1278. [Google Scholar] [CrossRef]
- Cruz-Hernández, P.; Peréz-López, R.; Nieto, J.M. Role of Arsenic During the Aging of Acid Mine Drainage Precipitates. Procedia Environ. Sci. 2017, 17, 233–236. [Google Scholar] [CrossRef][Green Version]
- Demayo, A.; Taylor, M.C.; Taylor, K.W.; Hodson, P.V.; Hammond, P.B. Toxic effects of lead and lead compounds on human health, aquatic life, wildlife plants, and livestock. C R C Crit. Rev. Environ. Control 1982, 12, 257–305. [Google Scholar] [CrossRef]
- Raji, I.B.; Hoffmann, E.; Ngie, A.; Winde, F. Assessing Uranium Pollution Levels in the Rietspruit River, Far West Rand Goldfield, South Africa. Int. J. Environ. Res. Public Health 2021, 18, 8466. [Google Scholar] [CrossRef] [PubMed]
- Klinkhammer, G.P.; Palmer, M.R. Uranium in the oceans: Where it goes and why. Geochim. Cosmochim. Acta 1991, 55, 1799–1806. [Google Scholar] [CrossRef]
- Spirakis, C.S. The roles of organic matter in the formation of uranium deposits in sedimentary rocks. Ore Geol. Rev. 1996, 11, 53–69. [Google Scholar] [CrossRef]


Publisher’s Note: MDPI stays neutral with regard to jurisdictional claims in published maps and institutional affiliations. |
© 2022 by the authors. Licensee MDPI, Basel, Switzerland. This article is an open access article distributed under the terms and conditions of the Creative Commons Attribution (CC BY) license (https://creativecommons.org/licenses/by/4.0/).