Article

Influence of Finely Chopped Meat Addition on Quality Parameters of Minced Meat

1
DIL German Institute of Food Technologies, Prof.-v.-Klitzing-Str. 7, 49610 Quakenbrueck, Germany
2
Department of Food Material Science, Institute of Food Science and Biotechnology, University of Hohenheim, Garbenstr. 25, 70599 Stuttgart, Germany
3
Meat Technology, Department of Life Science Technologies, University of Applied Sciences and Arts, Campus Allee 12, 32657 Lemgo, Germany
*
Author to whom correspondence should be addressed.
Appl. Sci. 2022, 12(20), 10590; https://doi.org/10.3390/app122010590
Submission received: 29 September 2022 / Revised: 14 October 2022 / Accepted: 17 October 2022 / Published: 20 October 2022
(This article belongs to the Special Issue Quality and Safety Control of Meat Products)

Abstract

:
Larger processing equipment to produce minced meat could affect its structure due to intensive processing and a high energy intake in the meat mass. To assess if this would result in alterations in the minced meat quality, finely chopped meat (FCM) was added in different concentrations (15, 30, 45, 60, 75, 90, and 100%) to minced meat and quality parameters were analyzed. FCM was used to simulate different intensity of an unintended destruction of meat cells due to various processes. The amount of non-intact cells (ANIC) was determined histologically and furthermore, soluble protein content, water holding capacity, mechanical and sensory texture, and scanning electron and confocal laser scanning microscopy was applied to analyze the meat structure and quality. ANIC indicated that even adding 15% FCM was statistically (p < 0.05) distinguishable from 100% minced meat and 30% FCM had already 50 Vol.-% ANIC. In contrast, the addition of 15% or 30% FCM did not result in significant differences in drip loss of raw and cooked meat as well as mechanical and sensory texture analysis. This study showed that intensive processing might be detectable via ANIC, but that the minced meat quality was not affected.

1. Introduction

Regardless of the increasing numbers of scientific studies in the assessment of plant-based proteins as meat alternatives with both a familiar shape and taste of meat products [1,2,3,4,5], the research interest and need in understanding and assessing meat and meat products [6,7] especially minced meat is still high [8,9,10].
Minced meat is still one of the most produced meat products in the meat industry, in both food service and retail. Consumer interest is still high due to the easy handling, standardized quality, and versatility of minced meat. In terms of shelf life, minced meat is a very sensitive product due to the mechanical cell disintegration of meat cells upon mincing [11]. Moreover, cell disintegration leads to an increased cooking loss during heating and during cooking proteins denature [12]. At temperatures above 55 °C, protein in connective tissue shrink, resulting in an increased loss of water, jelly, or fat [13] due to the capacity of immobilizing water dependent on the gel network’s strength [14].
Processing meat muscles into minced meat requires energy to reduce the size, resulting in mechanical disintegration of muscle fibers [15,16] and thus solubilized proteins [17]. In minced meat production, meat is subjected to four main processing steps: pre-mincing of meat muscles or meat pieces, mixing, mincing, and forming into a tray. These steps cumulatively increase the amount of work, resp. energy, applied to the meat and the amount of non-intact cells (ANIC) [15,18]. Meat is considered as plastic-elastic material since it can—to a certain degree—store the affecting force [16,18]. During processing, different stresses are working on the meat mechanically: compression, wall friction, shear forces, and applied pressures. Wall friction forces act on the meat during mincing and mixing [19]. Pressure acts on the meat during mincing as it is forced through the perforated discs, resulting in an increased pressure with a smaller diameter of the perforated discs [20]. Meat is exposed to shear force due to conveying—in particular if screws are used—and due to cutting of the meat by a rotating knife at the end of the perforated disc [19]. Mincing is widely used for size reduction in meat [17] and a continuous way of comminuting meat [20]. During mincing the meat is conveyed towards the cutting set [19], extruded through the perforated discs, and cut by a rotating knife. Firstly, meat is minced to 13–19 mm for further processing and to obtain a homogenous distribution, meat and fat are mixed. Secondly, meat is minced to an end particle size of app. 3 mm [17]. The extent of disintegration of muscle fibers is depending on the raw material, technology utilized, and applied force and stress. Thus, a key factor for disintegration of muscle fibers is mechanical processing, such as mixing or forming under pressure [15].
Based on these processes the muscle fiber structures are degraded and structural and mechanical properties of the meat are altered [18,20]. This mechanical rupture of cells opens the internal structure so that proteins are available for extraction [21] and the amount of extracted soluble proteins increases. The German Guidelines for meat and meat products regulated the ANIC in meat products [22]: an ANIC of 20 Vol.-% is allowed in minced meat products, determined by histometric analysis [15]. According to Beneke [15] an increasing ANIC can lead to a soft and paste-like mouthfeel.
In addition to histology, well-established methods exist to measure disintegration of muscle structure, resp. the meat quality, e.g. the extraction of water- and salt-soluble proteins or electron microscopy [21]. Moreover, with the water holding capacity, the ability of meat to retain added water is described [23] and mechanical and sensory texture analyses predict the firmness of the cooked meat [24]. Thus, meat quality and sensory perceptions of the consumer are strongly dependent on the changes of cellular structures during processing [23].
In the literature, quality changes in minced meat and meat products are reported, which can be caused by, e.g., process technologies, that altered in size and form in the last years [25]. To understand the possible effects of alteration in process technology, the relation between minced meat quality and meats disintegration needs to be investigated. Therefore, the relation between raw materials, process parameters and the appearance of cell destruction in the mincing process needs to be examined in more detail.
Based on the literature, we assumed that a more intense processing results in finer meat, which then results in minced meat with a high ANIC. We hypothesized that a more intense processing leads to structural changes in minced meat. To simulate an intensive processing, finely chopped meat (FCM) was added in different portions to minced meat and subsequently quality parameters were analyzed. The working hypothesizes was that morphological changes in minced meat resulting from FCM addition impact meats’ properties and quality parameters. To test the hypothesis, the ANIC was determined by histometric analysis. Furthermore, to analyze meats’ structure, soluble protein content, water holding capacity, and scanning electron and confocal laser scanning microscopy, as well as mechanical and sensory texture analysis were applied. The aim of this study was to characterize if the ANIC allow any inference on the quality of minced meat and, if a certain processing intensity, simulated by FCM, exists, whether that changes minced meats’ quality negatively.

2. Materials and Methods

2.1. Meat Processing

Deboned pork shoulder (Mm. supraspinatus, deltoideus, omotransversarius, trapezius) and pork loin (M. longissimus lumborum et thoracis) was delivered one day prior production (Landschlachterei G.H. Diekmann, Essen Oldenburg, Germany), having a temperature of app. 2 °C. The described minced meat production was performed three times in three consecutive weeks to produce three biological replicates.

2.1.1. Finely Chopped Pork Loin

Pork loin was used instead of pork shoulder since loin is less fatty and has less tendons. After delivery, pork loin was cut into fist-sized dices (app. 5 × 5 × 5 cm) and tendons and fat coarsely trimmed to obtain sheer pork loin. Dices were then minced to 3 mm with a 3-piece cutting system, consisting of a pre-cutter, 3-blade-knife, and 3 mm perforated disc (MEW 713 Primus, MADO GmbH, Dornhan, Germany). One half was frozen over night at app. −18 °C, to ensure low temperature in the bowl chopper. The other half was cooled at app. 2 °C. On the production day, cooled and frozen pork loin was comminuted in a bowl chopper (5000 Express, 30 L, Kilia GmbH, Bad Fallingbostel, Germany) at 3500 rpm until meat reached a temperature of 10 °C.

2.1.2. Minced Pork Shoulder

After delivery, pork shoulder was cut into fist-sized dices (app. 5 × 5 × 5 cm) and tendons coarsely trimmed. Dices were then cooled until next day. On production day, meat mincer (MD 114, Maschinenfabrik Seydelmann KG, Aalen, Germany), equipped with a double mixing arm, was used. After mixing for 1 min at 13 rpm, meat was minced to 18 mm using a meat mincer equipped with a 3-piece cutting system, consisting of a pre-cutter, 4-blade-knife, and 18 mm perforated disc (turbocut Joop GmbH, Bad Neustadt an der Saale, Germany) (Figure 1, MD 114). After pre-mincing, the 18 mm minced meat was transferred to a vacuum filling machine, powered by a vane pump feed system (VF 838 S, Albert Handtmann Maschinenfabrik GmbH & Co. KG, Biberach an der Riß, Germany). Filling machine was equipped with the inline grinding system GD 451, containing a 5-piece cutting set, consisting of a pre-cutter, 4-arm × 4-half arm double cut ring knife, 9 mm perforated disc, 3-arm × 3-half arm double cut ring knife, 5 mm perforated disc and cross-type support (Figure 1, GD 451). GD 451 was followed by the inline grinding attachment GD 452 with a 3-piece cutting set, consisting of a pre-cutter, 6-arm double cut sickle ring knife and a 2.8 mm perforated disc (Figure 1, GD 452). Before and after each mincing step, pH value and temperature were checked for irregular divergences (n = 5) (testo 208, Testo SE & Co. KGaA, Lenzkirch, Germany).

2.1.3. Addition of Finely Chopped Pork Loin to Minced Pork Shoulder

To analyze the effect of cell destruction on minced meat quality, minced pork shoulder was mixed with 15, 30, 45, 60, 75, and 90% finely chopped pork loin. As controls, 100% minced meat as well as 100% finely chopped pork loin, were used. Mixing was carefully conducted from the same person by hand until homogeneously distributed. After mixing, pH was measured (n = 5) and samples were sealed (J. Pack Srl, Val Brembilla BG, Italy) in shells (shells: Nespak S.p.A., Massa Lombarda, Italy, foil: PET12/PE70, J. Pack Srl) in modified atmosphere (Aligal 28 (80% O2 + 20% CO2), AirLiquide, Paris, France). Minced meat was stored at app. 2 °C until analyses at day 2 after production (Figure 1). In this study, “minced meat” defines minced pork shoulder, minced to 2.8 mm and “finely chopped meat” (FCM) defines finely, batter-like chopped pork loin, whereas “minced meat mixtures” defines mixtures of 0 to 100% FCM.

2.2. Analyses of Proximate Composition

2.2.1. Fat

Fat content of 100% minced pork shoulder and 100% finely chopped pork loin were each analyzed by Caviezel method, described in §64 LFGB L 06.00-6, previously performed by, e.g., Baune, et al. [2]. Contents were calculated as the triglyceride content per 100 g sample and examined in a technical single determination per biological replicate, resulting in n = 3. Fat contents of 15 to 90% FCM were interpolated.

2.2.2. Protein

Crude protein of 100% minced pork shoulder and 100% finely chopped pork loin were analyzed by Kjeldahl method, previously performed by Schiel, et al. [26], described in §64 LFGB L 06.00-7 2014-08. Results were converted with a nitrogen to protein conversion factor of 6.25. Contents were calculated as the crude protein per 100 g sample and examined in a technical double determination per biological replicate, resulting in n = 6. Protein contents of 15 to 90% FCM were interpolated.
Soluble protein content was determined after extracting water and salt soluble protein from the samples with a solution consisting of 73% w/w distilled water and 2% w/w NaCl. To this salt solution, 25% w/w of the sample were added, and the mixture stirred for 2 h. Then, the mixture was centrifuged at 13,000× g for 10 min (Sorvall RC6 Plus, Thermo Fisher Scientific Inc., Waltham, MA, USA). The supernatant was analyzed for protein content using Kjeldahl method (described above).
Protein content was calculated, using interpolated protein content for proteinsample (Equation (1)). Extraction of soluble protein content was conducted in a technical triple determination for each biological replicate and analyzed once, resulting in n = 9.
soluble   protein   ( % ) = protein supernatant   ·   ( m salt   solution + m water   in   sample )   protein sample   ·   m sample     · 100
where proteinsupernatant and proteinsample are the protein contents of the supernatant and sample, resp. msalt solution, msample, and mwater in sample are the weight of the salt solution (water and salt), sample and the water in the sample, resp.

2.2.3. pH Values

pH values were determined 2 h after stirring in meat solution, prepared for soluble protein content analyses, with a SevenEasy pH meter (Mettler Toledo, Columbus, OH, USA). Analyses was repeated as triple determination for each biological replicate, resulting in n = 9.

2.2.4. Moisture

Moisture content was analyzed from 0–100% FCM with sea-sand method as performed by Witte, et al. [7], described in §64 LFGB L 06.00-3 2004-07. Moisture content was calculated per 100 g and examined in a technical triple determination for each biological replicate, resulting in n = 9.

2.3. Determination of Water Holding Capacity

2.3.1. Filter Press

To determine water holding capacity of raw meat, method of Grau and Hamm [27] was modified: 5 g ± 0.02 g meat mass were placed between two glass fiber filters (Whatman GF 6 Glass Fiber Filters, GE Healthcare UK Ltd., Little Chalfont, Buckinghamshire, UK). To ensure identical procedure, minced meat mixtures were placed in a round mold with 4 cm in diameter. On top of the meat, a second filter was added and then a 2 kg weight was placed on top of the filter. After 2 min, the weight was removed, and filters and samples were weighed again to calculate the drip loss (Equation (2)). Analysis was executed as a technical triple determination for each biological replicate, resulting in n = 9.
drip   loss   ( % ) = m initial   m final m initial
where minitial is the weight of minced meat mixture prior to applying the weight and mfinal is the weight after applying the weight for 2 min.

2.3.2. Cooking Loss

Water holding capacity of cooked minced meat mixtures, determined via cooking loss, was conducted by a modified method of Irmscher, et al. [28]: 350 ± 0.5 g were filled in cans (folding lid can 99/63 mm, Dosen-Zentrale Züchner GmbH, Hilden, Germany) and closed with the can sealing machine (DV 10 PS, Stiller GmbH, Bad Rappenau, Germany). Then, cans were cooked for 60 min in an oven (Joker B, Eloma GmbH, Maisach, Germany) with combined heat at 135 °C. After that, cooked cans were cooled for 10 min in ice water, opened, and cooked meat was weighed again to calculate the cooking loss using Equation (2). Analysis was executed as a technical triple determination for each biological replicate, resulting in n = 9.

2.4. Histological Analysis of Amount of Non-Intact Cells

Histological analysis was conducted to assess amount of non-intact cells (ANIC). For histological examination, app. 100 g of each minced meat mixture was vacuum-sealed, frozen at −18 °C and sent to the Laboratory of Raw Material Science Animal of the University of Applied Sciences and Arts (Lemgo, Germany). There samples were prepared by the laboratory staff using the paraffin embedding technique according to Friedelsheimer, et al. [29]. First, a 2 × 2 cm piece with a maximum thickness of 3 mm was cut out of the frozen minced meat. Then, the samples were submerged in a 10% formaldehyde solution for 24 h before being completely dehydrated with an increasing alcohol series from 50 to 100% ethanol using an automatic Spin Tissue Processor (STP 120, Microm International GmbH, Walldorf, Germany). At the end of the dehydration cycle, the samples were transferred to xylene as an intermediate medium. Then, samples were soak in paraffin wax. As a result of this 21.5 h lasting dehydration process, the paraffin wax-soaked samples were placed in a mold, which is filled up with paraffin wax to produce cuttable paraffin blocks. By using the Electronic Rotary Microtome (HM 340, Thermo Fisher Scientific, Waltham, USA) eight 10 µm sections were cut and placed on microscope slides and held with coverslips and a slide mounting media. After that, the cuts were stained using the staining method after CALLEJA (L 06.00-13 [30]) to produce eight stained slides per sample.
For evaluation, slides were scanned with a microscope slide scanner (MIRAX) and analyzed with the corresponding software (Panoramic viewer, 3D Histech Ltd., Budapest, Hungary), which separates each slide into 250 single pictures. Single pictures were analyzed separately by deciding on the type of tissue under the central crosshatch between intact muscle cells, destroyed, resp. non-intact muscle cells, different tissue, and empty space. The ANIC is calculated for the respective sample from mean of the eight slides (Equation (3)).
ANIC   ( % ) = destroyed   muscle   cells destroyed   muscle   cells +   intact   muscle   cells   · 100

2.5. Images

2.5.1. Confocal Laser Scanning Microscopy

In the minced meat mixtures, fat was stained by Nile red (Fluka Analytical, St. Gallen, Switzerland) and protein by fluorescein isothiocyanate isomer I (FITC; AppliChem GmbH, Darmstadt, Germany). For imaging, a CLSM Nikon ECLIPSE E 600 (Nikon Corporation, Tokyo, Japan) with an oil-corrected 60 × objective was used. Fluorescence was excited with Ar-laser at 488 and He-Ne-laser at 543 nm. Method was performed previously by Baune, et al. [2].

2.5.2. Scanning Electron Microscopy

Microstructure of 0, 45 and 100% FCM was visualized by scanning electron microscopy (SEM). Samples were frozen in super-cooled liquid nitrogen and inserted into a cryo-preparation system (K 1250, Emitech SAS, Montigny-le-bretonneux, France), so that free water sublimated. Then, samples surface was sputtered with gold and transferred into the scanning electron microscope (JSM 6460 LV, JEOL, Akishima, Japan) at app. −180 °C. For analyses, an electron beam was generated and accelerated to 1–30 kV voltage. For visual analyses, images of different magnifications were carried out with a connected PC. Method was performed previously by Smetana, et al. [31].

2.6. Texture Analyses

2.6.1. Mechanical

Texture analysis was performed from raw and cooked minced meat, as well as from cooked meatballs, carried out with a Texture Analyzer (TA-XT2) and the corresponding software (Texture Expert Exceed) (Stable Micro Systems Ltd., Guildford, UK). Cooked minced meat was used from cooking loss (Section 2.3.2.) and cooled down prior analysis.
For texture analysis of raw and cooked minced meat, a cylindric probe (2 cm diameter) was driven by the texture analyzer into the sample with a constant speed of 1 mm/s. For raw meat analysis, app. 30 g were placed in a plastic beaker (4.2 cm diameter) (Th. Geyer, Renningen, Germany) and compressed to 75% of original height. Cooked meat was compressed to 60% of original height and was also placed in a plastic beaker (2.5 cm diameter) (Th. Geyer, Renningen, Germany).
The maximum force needed to compress the sample as well as the maximum force to separate the probe and the sample was measured. Furthermore, the distance needed to separate the probe and the sample was measured. From measured force to compress and separate sample and probe the compression (Pa) and adhesiveness (Pa) were calculated by Equation (4). Texture analysis was carried out as technical triple determination for each biological replicate, resulting in n = 12 for raw and n = 27 for cooked minced meat. Method was performed previously by Baune, et al. [2].
P = F   A   = F π   ·   r 2
where p (Pa) is the pressure, resulting from the measured force F (N) and divided with the surface area (m2) A of the cylindric probe.
For texture analysis of cooked meatballs, ten meatballs were formed manually using app. 30 g of minced meat each. Meatballs were cooked in the oven (Joker B, Eloma GmbH, Maisach, Germany) at 150 °C until an internal temperature of 78 °C was reached. After meatballs were cooled down to ambient temperature, cutting strength was measured with texture analyzer, equipped with a razor blade. Therefore, meatball was placed in a slot and got cut through by the razor blade with a constant speed of 2 mm/s. The maximum force (N) to cut through the meatball was measured ten times for each biological replicate, resulting in n = 30.
To gain more knowledge about the elasticity, an oscillation rheometer (AR 2000, TA Instruments, Eschborn, Germany) with a gap of 2500 µm to the equipped cross-hatched parallel plate configuration was used. Raw minced meat samples were placed on the bottom plate, that has a diameter of 4 cm and was tempered to 20 °C. Measurement was carried out over a frequency range of 0.1 to 9.997 Hz with a constant oscillation torque of 500 µNm. With the corresponding software Rheology Advantage (TA Instruments, Eschborn, Germany), the storage modulus as a function of the frequency were measured as a technical duplicate for each biological replicate, resulting in n = 6.

2.6.2. Sensory

For sensory evaluation of minced meat’s structure, meatballs were prepared as described in 2.6.1. for texture analysis of cooked meatballs. A panel, trained through regular sensory examinations, consisting of 10 people used an 11-point-scale to evaluate cooked meatballs. During the test, panelists received a meatball of each sample labeled with a randomized three-digit number. The rating of firmness, juiciness, internal cohesion, and internal structure was carried out using a questionnaire according to DIN 10,969 with a scale from 0 to 10 with 0.25 steps. On this scale 0 means firm, dry, fine inner structure, and loose cohesion, while 10 means soft, juicy, rough inner structure, and strong cohesion.

2.7. Statistics

Three biological replicates with at least two technical, resp. analytical, replicates were carried out (see individual method). Results indicate mean ± standard deviation, calculated by Excel (Microsoft, Redmond, WA, USA). Graphs were illustrated by SigmaPlot 14.0 (Systat Software Inc., San Jose, CA, USA). Statistical analyses were also conducted using SigmaPlot 14.0. First, data were tested for normal distribution using Shapiro-Wilk test and Brown-Forsythe test for equal variance with a significance of α = 0.05. If tests were passed, data were analyzed for significant differences using One-Way Analysis of Variance (ANOVA) and Tukey’s multiple comparison test with a significance level of α = 0.05. If either normality or equal variance test was not passed, an ANOVA on ranks with Tukey’s multiple comparison test was conducted with a significance level of α = 0.05. Significant differences (p < 0.05) are indicated in tables and graphs with different small (uppercase) letters.
To check differences between repetitions in results of ANIC, a Two-Way-ANOVA was carried out with the FCM portion (0–100%) as first factor and the replicate (one or two) as second factor. Procedure was conducted as described for One-Way-ANOVA with a significance level of α = 0.05.

3. Results and Discussion

3.1. Cell Disintegration

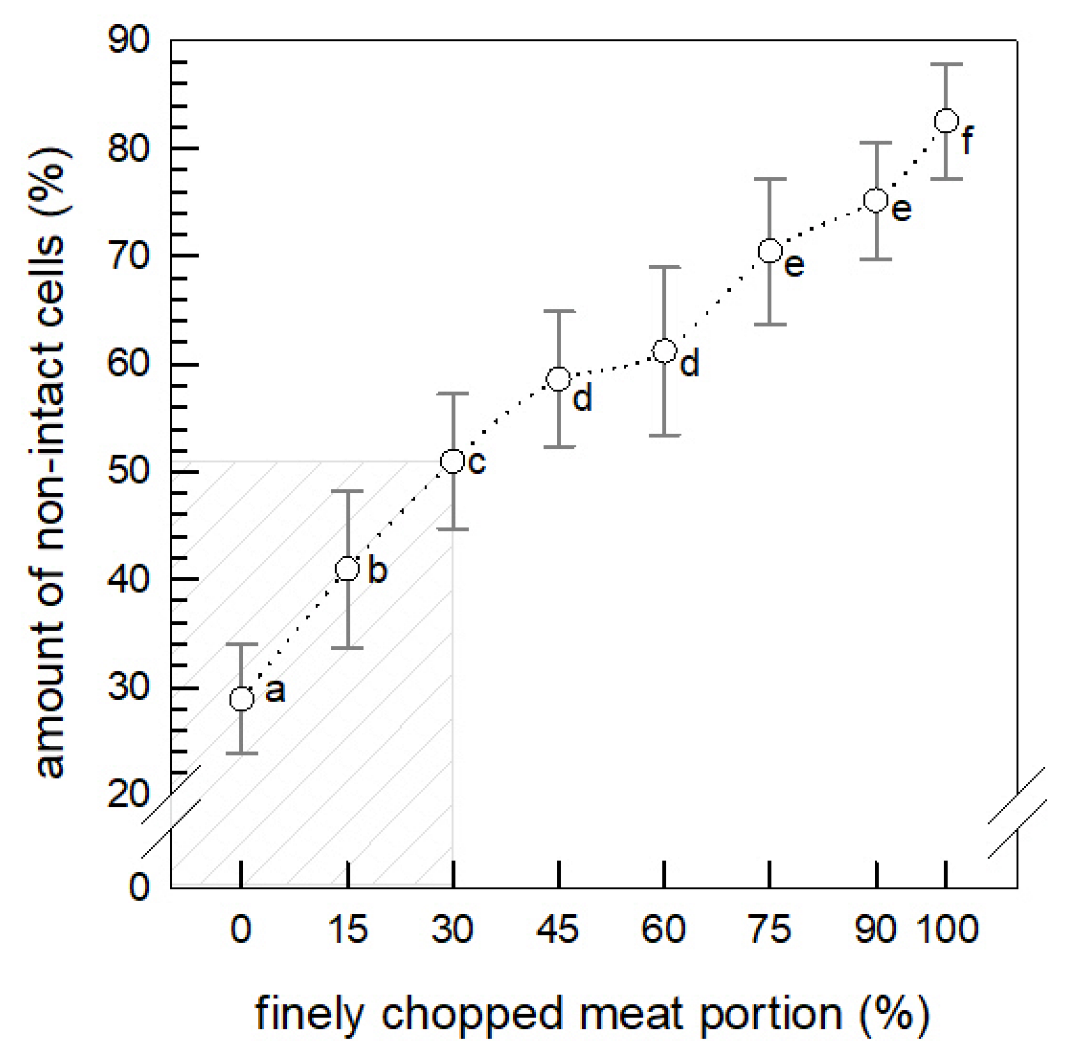
3.1.1. Amount of Non-Intact Cells
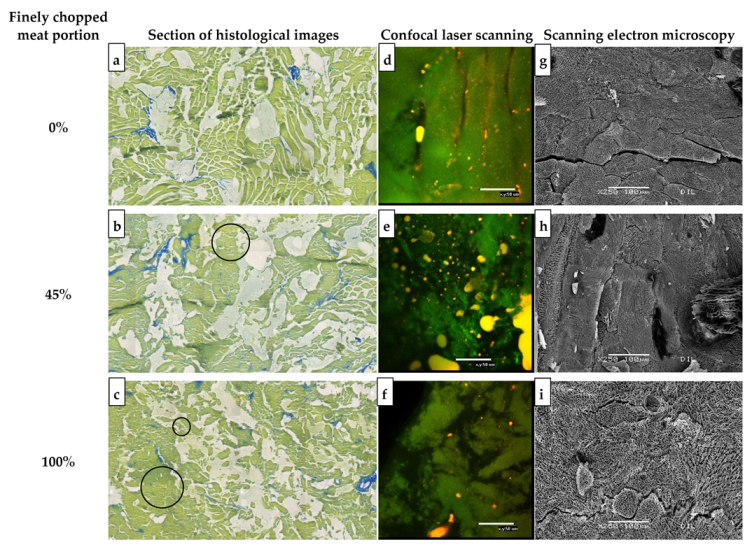
The amount of non-intact cells (ANIC) significantly (p < 0.05) increases with an increased portion of finely chopped meat (FCM) added to the minced meat (Figure 2). Highest ANIC was measured for 100% FCM with 82.48 Vol.-% and lowest ANIC for minced meat (0% FCM) with 28.83 Vol.-%. This indicates that even processing in a pilot hall scale (30 kg) with eleven cutting levels and manual handling results in an ANIC over 20 Vol.-%, which is the officially defined threshold for minced meat in Germany [22]. According to Hildebrandt and Jöckel [32], in minced meat products such as hamburger, it is technologically unavoidable to obtain an ANIC ≤ 10 Vol.-%. Moreover, when frozen meat is added, an ANIC ≤ 20 Vol.-% is technologically unavoidable [32]. Since the process of mincing meat changed [33] due to increased production volume and the need for faster production [15], higher ANIC are inevitable. Thus, Beneke [15] stated that muscle abrasion, calculated to ANIC, in raw minced meat might not be the best indicator to determine minced meat quality. Otto-Kuhn and Tichaczek-Dischinger [34] found only two out of 34 artisan produced minced meat with an ANIC higher than 20 Vol.-%, whereas they found eight out of 18 industrial produced minced meat with an ANIC over 20 Vol.-%. This supports statements that the ANIC might not be the best indicator to characterize minced meat quality. Berger, et al. [8] recommended to also consider raw material properties resulting from species, sex, age, and conditions during slaughter as these can influence batches. By comparing conventional with novel objective methods to detect cell destruction in minced chicken mixed with meat batter, Raudsepp, et al. [18] found that immunohistochemical worked best in comparison to three histological approaches.
For this study, the ANIC proves that the idea of simulating an intensive processing of meat while producing minced meat with FCM is possible. By mixing different portions of FCM with minced meat, the ANIC could be set to a specific value. Regarding meat quality, a meaningful amount of FCM addition lays between 0 and 30% FCM, which results already in 50 Vol.-% ANIC. Other than Berger, et al. [8] study, few studies reported an ANIC in minced meat between 20 and 50 Vol.-% [9,34]. This underlines that an ANIC over 50 Vol.-% or the addition of more than 30% FCM is highly unrealistic [35].
Berger, et al. [9] reported that the second mincing step results in highest ANIC in minced beef. In their study, six cutting levels result in app. 24 Vol.-% ANIC. Schering [36] pointed out that in histometric analysis a scope for assessment exists, meaning that the result is dependent on the evaluator. Thus, Schering [37] referred to Beck, et al. [38], who demanded the analysis of further properties of minced meat in addition to the ANIC. Beneke [15] is in line with this demand. Berger, et al. [8] stated that the higher the ANIC, the more multidimensional morphological changes are created leading to a heterogeneous system. Thus, further quality and material properties shall be considered during evaluation of minced meat, which could be influenced by morphological changes. As described, an ANIC over 50 Vol.-% would not be detected in industrial produced minced meat, which is why less than 30% FCM were discussed (see Figure 2, hatched area) to achieve the aim of this study: if the ANIC would allow any inferences on the quality of minced meat.

3.1.2. Imaging

Histological images were derived from scanned slides (prepared to analyze ANIC) show typical sections, confocal laser scanning (CLSM) show stained (protein) muscle structures and scanning electron microscopy (SEM) enables a closer look on the muscle fibers after lyophilization (Figure 3). The increased cell destruction is visible in histological images (Figure 3a–c). CLSM images underline these finding, since at 0% FCM muscle fibers are visible with some fat particles overlying (Figure 3d), whereas at 100% FCM no intact cell structure is visible (Figure 3f). Additionally, SEM images of 0% FCM show intact muscle bundles with intramuscular spaces (Figure 3g), with 45% FCM a mixture of different complexes (Figure 3h), and in 100% FCM a dissolved network can be seen (Figure 3i). The impression that FCM is courser than minced meat, might be caused by an increased amount of cell fragments resulting in a heterogenous system.
According to Berger, et al. [8] exceeding 25% meat batter addition alters system properties from dispersed to emulsified characteristics for beef burger patties. This could also be proven by CLSM images of 45% FCM as fat droplets might be emulsified by proteins (Figure 3e). Overall, images illustrate clearly that in FCM particle sizes are reduced [39] and 100% FCM could be defined as a system with a smaller particle size with a high soluble protein content [14] probably equalizing drip and cooking loss of minced meat resulting in an increased firmness.

3.2. Quality Characterization of Minced Meat

Proximate composition of minced meat and FCM was analyzed. Mean protein content for minced meat (0% FCM) was 19.57 ± 0.79 g/100 g and for 100% FCM 21.98 ± 0.34 g/100 g. Mean fat content for minced meat was 8.33 ± 1.19 g/100 g and for 100% FCM 4.28 ± 0.48 g/100 g. According to Souci, et al. [40] pork skeletal muscle has typically 71.60–75.5% moisture, 19.2–22.8% protein, 1.2–6.3% fat, and 1.1–1.2% minerals. Fat content of 100% FCM was significantly lower (p < 0.05) than fat content of 100% minced meat. This is caused by a generally lower fat content of trimmed pork loin in comparison to pork shoulder [41]. However, the lean muscle was chosen due to the absence of connective tissue and fat prevent emulsifying of fat in the FCM. Protein and fat contents of 15 to 90% FCM were interpolated, resulting for 15 and 30% FCM, resp., in a protein content of 19.93 and 20.29 g/100 g and a fat content of 7.72 and 7.12 g/100 g. These results show that protein and fat content of 30% FCM are in the range of the standard deviation of 0% FCM (protein: 20.36, fat: 9.52 g/100 g), indicating that even 30% FCM is similar to 0% FCM and that these range can be used to assess minced meat quality.

3.2.1. Water Holding Capacity

Moisture content and cooking loss do show almost the same significant differences, whereas drip loss by filter press method is not influenced by FCM content (Table 1). In other words, these important quality factors for consumers [23]—the volume of the minced meat mass in the pan—of minced meat are not influenced by the addition of 30% FCM with 50 Vol.-% ANIC.
The moisture content in minced meat was significantly (p < 0.05) increased when over 30% of FCM were added. This can be explained by the fact that the minced meat consists of pork shoulder and the FCM consists of pork loin and therefore meat composition, especially fat content, varies [40]. Directly after slaughter, lean meat contains app. 75% water [42]. In general, cutting of meat destroys the cellular and fibrillar structure [43], and the comminution increases the surface area of meat which results in a higher drip loss, allowing the immobilized water to excess the cells [44]. Moreover, changes in cell structure and water holding capacity correlate [23] since drip loss is influenced by the release of intracellular proteins as well as morphological changes [45]. A correlation between damaged myofibrils and water release in pork was also shown by Tyszkiewicz, et al. [21]. Changes occur due to differences in spacing between thick and thin filaments, where water is held in myofibrils, as well as the fact that myofibrils shrink postmortem and fluid is drained by gravity [42].
Referring to emulsified sausages, Krickmeier [46] described a lower drip loss with more intensive comminution as the myofibrillar proteins are solubilized and are enabled to bind water. The drip loss is not showing significant decreased values, even though the soluble protein content is increased for samples with an increased FCM portion (see Figure 4). However, as cooking loss decreases, the higher the FCM portion; these results are in line with Krickmeier [46] as this effect is probably caused by an increased water binding based on the high amount of soluble proteins in FCM. Generally, meat without any additions can lose up to 40% weight due to cooking [42]. The decreased cooking loss with an increased FCM portion, resp. moisture content, can also be explained by the lower fat content. This is due to the fact that in the cooking loss, in addition to water loss due to protein denaturation [47], the fat loss is also measured [48].
Moreover, SEM images (see Figure 3g,i) support the idea that the water holding capacity of 0 and 100% FCM is similar, as the fibrous structures have app. the same thickness. Assuming that even with losing the intact muscle cell structure, the intermolecular spaces are still intact, water is immobilized by capillary force [44]. Generally, water is bound in various ways in the muscle: app. 70% water is firmly bound in the myofibrillar proteins as hydration water (protein-bound), whereas immobilized water is bound to filaments as well as fibrils. App. 20% of freely mobile water is present in the sarcoplasmic space and is only prevented from leaving by the cell membrane [49]. Thus, when the cell membrane is destructed, the capillary space is also ruptured resulting in the loss of free water [50], e.g., during determination of drip loss. Bejerholm, et al. [48] reported that intermolecular spaces between myofibrils can impact cooking loss and SEM reveals the loss of intermolecular spaces. However, loss due to cooking is less when intermolecular spaces were lost, probably due to emulsifying. Overall, as simulated in our study, if alterations in minced meat would occur through an intensive processing, the meats’ release of water would be offset by the side effects of the increased processing.

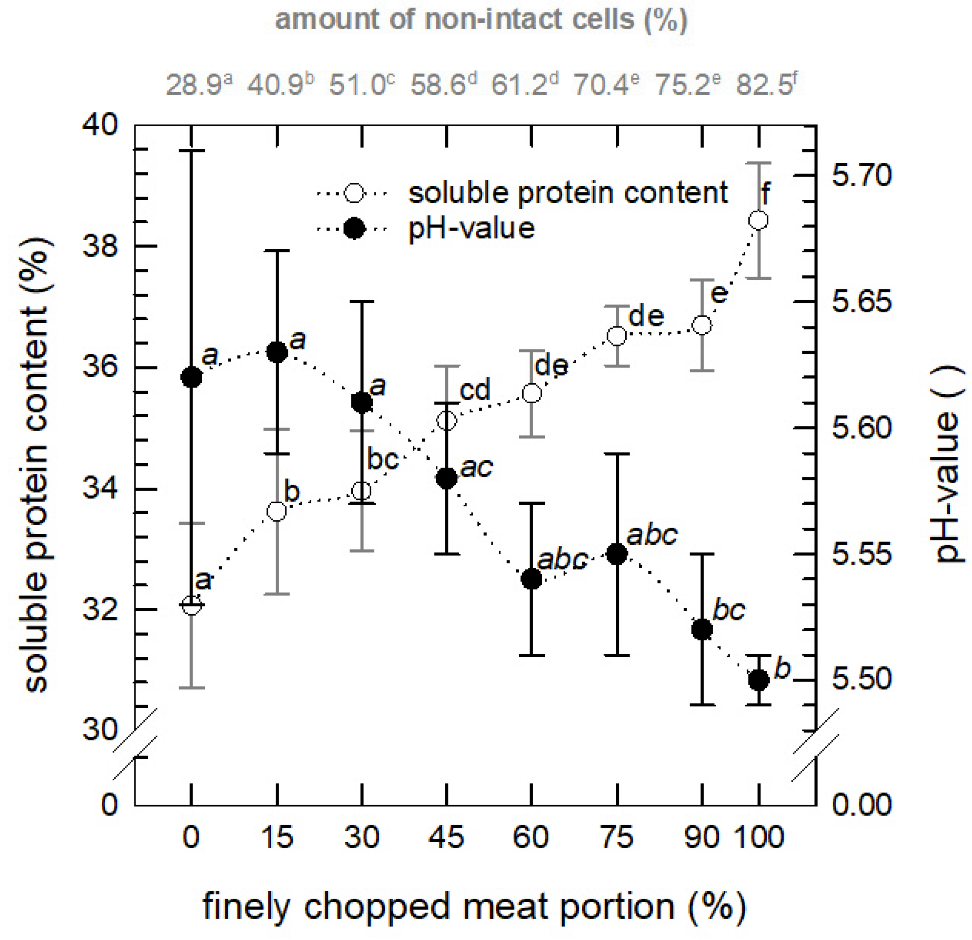
3.2.2. Soluble Protein and pH Value

With the addition of FCM, soluble protein content increased, and pH values decreased, significantly (p < 0.05) (Figure 4). The alterations are attributed to the raw materials used, as 0% FCM has a mean pH value of 5.62 and 100% FCM of 5.50. Based on standard deviations, variations due to replications seem higher in pork shoulder than in pork loin. As mentioned, pH values influence drip loss, water-holding, and water-binding capacity due to arrangement of myofibrils [51]. Honikel and Hamm [23] reported an increased drip loss with a lower pH value for M. longissimus dorsi. However, the influence of the pH value on drip loss (see Table 1) seems neglectable as difference between 100% minced meat and 100% FCM in pH value is app. 0.12. In comparison with the literature, pH values between 5.4 and 5.6 and a drip loss of app. 10 to 17% were found for lean meat [23] and are in line with the results of the present study. In particular, the alterations in the range of 30% FCM or 50 Vol.-% ANIC are insignificant and therefore the pH is not influencing the results in regard to meat quality.
The higher degree of comminution and, therefore, the more disrupted and extracted myofibrillar proteins in the FCM lead to an increased soluble protein content [46]. In general, soluble proteins cause functional properties such as emulsification and heat gelation [52]. The closer meshed protein framework [46] could have resulted in a higher water holding capacity (Table 1). Furthermore, morphology and structure are altered resulting in different molecular interactions [42,53]. Tyszkiewicz, et al. [21] found that with an intense destruction, more sarcoplasmic proteins are released and due to the rupture of muscle fibers, more myofibrillar proteins were also found. Moreover, meat mixtures consist of different ratios of intact and non-intact cells as well as fragments obtaining a different size, resulting in different network formation [14]. Based on the findings of this study, the higher the FCM portion, the more soluble proteins can interact molecularly and functionally. According to Shi, et al. [54], as well as cell destruction, fatty acids also influence salt-soluble proteins in pork longissimus dorsi. This fact can be explained by variations between contents of soluble protein depending on FCM content. As mentioned, the increased content of soluble proteins is a factor that can counteract higher water loss due to an increased destruction of myofibrils.

3.3. Texture Analyses

3.3.1. Mechanical Texture Analysis

Compression of raw meat mixtures containing a higher portion of FCM significantly (p < 0.05) decreased, whereas compression of cooked meat mixtures containing a higher portion of FCM significantly (p < 0.05) increased (Figure 5a). Significantly increased firmness of cooked meat with increased FCM portion might result from the significantly increased soluble protein content (see Figure 4) due to the disintegration of muscle fibers, illustrated by the significantly increased ANIC (see Figure 2). The contrary tendency of raw and cooked firmness with increasing FCM portion could be caused by the soluble proteins. This could be due to the comminution of FCM, which let to structural changes, such as the disruption of myofibrils, resulting in an increased soluble protein content [46]. In addition, the impact of increased soluble proteins is first shown after cooking. Moreover, due to the increased FCM portion, more disrupted collagen crosslinks exist resulting in decreased firmness of raw meat mixtures with an increased FCM portion [55]. A more solid finely chopped meat results from the cooking process, causing proteins to unfold so that intermolecular protein interactions are formed [14]. According to the number of significant differences, cooked meat mixtures seem to be more different than raw meat mixtures. In reference to the minced meat quality, the compression of raw and cooked meat does not alter significantly (p < 0.05) in the range of 0–30% FCM or up to 50 Vol.-% ANIC.
For the cutting force, the same effect is noticeable as for compression of raw meat mixtures as with an increased FCM portion cutting force significantly (p < 0.05) decreased (Figure 5b). However, due to high standard deviations and small differences in mean, the cutting force is not as significantly different as the compression of raw and cooked meat mixtures. As no significant differences are detectable for 0–30% FCM in cutting force, as well as raw and cooked compression, no effect on the quality parameters could be found. These findings underline that the ANIC does not support alteration in the quality of minced meat, though the ANIC is meaningful when describing the disintegration of muscle fibers.
Adhesiveness of raw meat mixtures, resp. stickiness, does not show significant differences in dependence of FCM. Furthermore, the storage modulus of the meat mixtures, measured over frequency by oscillation rheometer, also do not show significant differences in dependence of FCM. Therefore, it is concluded that elasticity does not alter by increasing FCM portion. This could be explained by Krickmeier [46] findings as the water binding capacity, aging time, and intramuscular fat, as well as the temperature and pressure influence meats’ rheological properties. The higher the water binding capacity, the more the meat swells, resulting in an increased viscosity. However, as water holding capacity does not alter with increased FCM portion, the indifferent elasticity of FCM portions is declared.

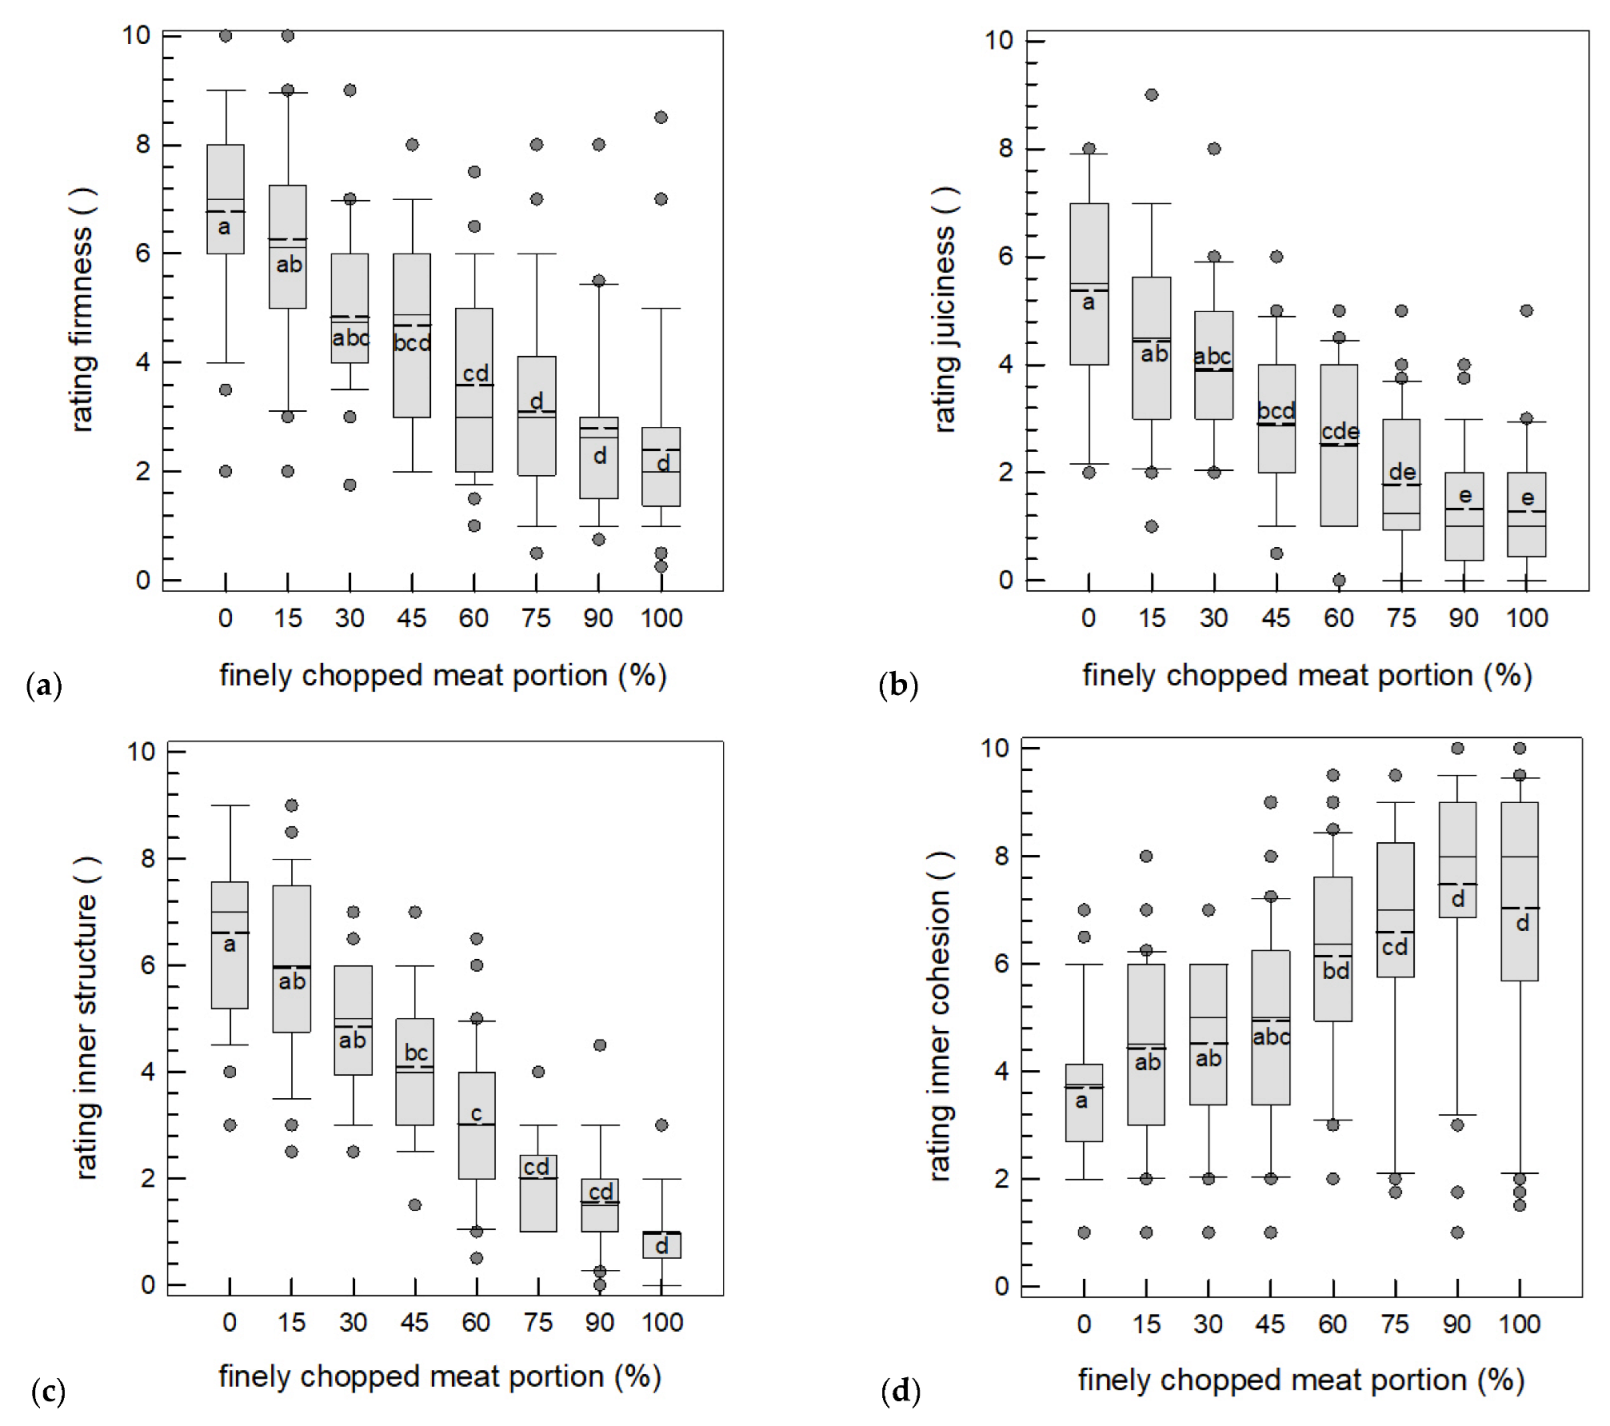
3.3.2. Sensory Texture Analysis

Samples containing an increased FCM portion were rated as firmer than samples with less FCM (Figure 6a). Comparing sensory rating of firmness to results of texture analysis of cooked meat (see Figure 5a), the tendency towards an increased firmness with the addition of FCM is obvious. However, the increased sensory firmness of cooked meatballs is not supported by the decreased cutting force with increased FCM portion (see Figure 5b). In comparison to the compression of cooked meat, this could be due to the difference in the analysis. De Huidobro, et al. [24] stated that sensory analysis of cooked beef predicts significantly better firmness than Warner–Bratzler-shear force. Correlation between sensory and instrumental hardness, performed with a texture profile analysis, shown for fish sausages, underline the comparability of sensory and mechanical texture analysis [56,57]. By investigating different cooking techniques and core temperatures of two muscles, Bejerholm and Aaslyng [58] found that sensory tenderness and hardness at first bite highly correlate (r = −0.98).
With increasing sensory firmness due to higher FCM portions, meatballs became less juicy (Figure 6b). The lower fat content in samples with an increased FCM portion could be a reason for the lower juiciness rating as some fat is released while chewing contributing to the perception of juiciness [44]. The impact of cooking loss can be excluded as this loss is uniform throughout the different samples (see Table 1). In addition to the impact of fat, the interrelation between tenderness and juiciness needs be considered too: firmness and juiciness show inversely related tendencies—the firmer, the dryer. As chewing time and hardness at first bite highly correlate (r = 0.97) [58], the decreasing juiciness is inevitable.
The inner structure of the cooked meatballs was evaluated as courser with less FCM and as finer with an increased FCM portion (Figure 6c). The disrupted structure is also visible in the SEM pictures as 100% FCM shows significantly fewer intact muscle cells (see Figure 3c,f,i). Bejerholm and Aaslyng [58] found a high correlation of pork’s structure with the hardness at first bite (r = 0.82) with the chewing time (r = 0.86), probably influencing juiciness rating.
Inner cohesion was rated as stronger the higher the FCM portion (Figure 6d). This finding supports the results of compression of cooked meat mixtures, which show the same increase due to a higher FCM portion (see Figure 5a). The firmness of cooked meat mixtures as well as the rating of inner cohesion are most likely connected with the increased soluble protein content due to an increased FCM portion [46] (see Figure 4). Using 126 trained sensory panelists, Sifre, et al. [59] found a strong correlation (r = 0.95) between the destructuration, meaning the loss or modification of muscle fiber structure, and the sensory assessment.

4. Conclusions

Adding finely chopped meat to minced meat results in significantly (p < 0.05) increased amount of non-intact cells (ANIC). The increase in the ANIC is caused by structural changes in meats structure, that are assumed to be caused by morphological changes. These alterations are assumed to be due to the disintegration of meats structure and were illustrated by confocal laser scanning and scanning electron microscopy. Moreover, the ANIC shall not be utilized exclusively for evaluation of minced meat quality since the ANIC depends on multiple factors such as the properties of the muscle and especially the production process. The overall conclusion of our study is that by comparing 100% minced meat with minced meat with 30% finely chopped meat added, the ANIC is higher, but the quality is not altered.
To underpin these results, in further experiments minced meat without any ANIC should be investigated, although production might be difficult as due to mincing, ANIC originates. Finally, the limitation of our study is that we have not examined the effect of the type of meat, deep freezing of meat, and/or type of grinder. Our future studies will make sure to explore these effects and their influence on the amount of ANIC and the quality of minced meat.

Author Contributions

Conceptualization, F.W. and N.T.; methodology, F.W., A.R., M.U., A.J., U.B. and N.T.; validation, F.W.; formal analysis, F.W.; investigation, F.W., E.S., M.U., E.J., A.J. and U.B.; resources, F.W., M.U., A.J., U.B. and N.T.; data curation, F.W.; writing—original draft, F.W.; writing—review and editing, F.W., E.S., L.M.B., M.G., J.W., A.R., M.U., E.J., A.J., U.B., V.H. and N.T.; visualization, F.W.; supervision, N.T.; project administration, F.W., L.M.B., M.G., J.W. and N.T.; funding acquisition, F.W., M.G., J.W., V.H. and N.T.; All authors have read and agreed to the published version of the manuscript.

Funding

This IGF Project of the FEI was supported via AiF within the program for promoting the Industrial Collective Research (IGF) of the German Ministry of Economics and Climate Action (BMWK) based on a resolution of the German Parliament. Project AiF 20384 N.

Institutional Review Board Statement

Not applicable.

Informed Consent Statement

Informed consent was obtained from all subjects involved in the study.

Data Availability Statement

Most data are included in the article.

Acknowledgments

We would like to thank Christian Trumme, Florian Singer, Frank Schilling, Berit Fitzner, and Frank Herkenhoff for their help as well as the chemistry lab for providing protein and fat results.

Conflicts of Interest

The authors declare no conflict of interest.

References

  1. Dreher, J.; König, M.; Herrmann, K.; Terjung, N.; Gibis, M.; Weiss, J. Varying the amount of solid fat in animal fat mimetics for plant-based salami analogues influences texture, appearance and sensory characteristics. LWT—J. Food Sci. Technol. 2021, 143, 111140. [Google Scholar] [CrossRef]
  2. Baune, M.-C.; Schroeder, S.; Witte, F.; Heinz, V.; Bindrich, U.; Weiss, J.; Terjung, N. Analysis of protein-network formation of different vegetable proteins during emulsification to produce solid fat substitutes. J. Food Meas. Charact. 2021, 15, 2399–2416. [Google Scholar] [CrossRef]
  3. Profeta, A.; Baune, M.-C.; Smetana, S.; Bornkessel, S.; Broucke, K.; Van Royen, G.; Enneking, U.; Weiss, J.; Heinz, V.; Hieke, S. Preferences of german consumers for meat products blended with plant-based proteins. Sustainability 2021, 13, 650. [Google Scholar] [CrossRef]
  4. He, J.; Evans, N.M.; Liu, H.; Shao, S. A review of research on plant-based meat alternatives: Driving forces, history, manufacturing, and consumer attitudes. Compr. Rev. Food Sci. Food Saf. 2020, 19, 2639–2656. [Google Scholar] [CrossRef]
  5. Boukid, F. Plant-based meat analogues: From niche to mainstream. Eur. Food Res. Technol. 2021, 247, 297–308. [Google Scholar] [CrossRef]
  6. Terjung, N.; Witte, F.; Heinz, V. The dry aged beef paradox: Why dry aging is sometimes not better than wet aging. Meat Sci. 2021, 172, 108355. [Google Scholar] [CrossRef] [PubMed]
  7. Witte, F.; Smetana, S.; Heinz, V.; Terjung, N. High-pressure processing of usually discarded dry aged beef trimmings for subsequent processing. Meat Sci. 2020, 170, 108241. [Google Scholar] [CrossRef]
  8. Berger, L.; Gibis, M.; Witte, F.; Terjung, N.; Weiss, J. Influence of meat batter addition in ground beef on structural properties and quality parameters. Eur. Food Res. Technol. 2022, 248, 2509–2520. [Google Scholar] [CrossRef]
  9. Berger, L.; Witte, F.; Terjung, N.; Weiss, J.; Gibis, M. Influence of Processing Steps on Structural, Functional, and Quality Properties of Beef Hamburgers. Appl. Sci. 2022, 12, 7377. [Google Scholar] [CrossRef]
  10. Zerabruk, K.; Retta, N.; Muleta, D.; Tefera, A.T. Assessment of microbiological safety and quality of minced meat and meat contact surfaces in selected butcher shops of Addis Ababa, Ethiopia. J. Food Qual. 2019, 2019. [Google Scholar] [CrossRef] [Green Version]
  11. Nortjé, G.; Nel, L.; Jordaan, E.; Naudé, R.; Holzapfel, W.; Grimbeek, R. A microbiological survey of fresh meat in the supermarket trade. Part 2: Beef retail cuts. Meat Sci. 1989, 25, 99–112. [Google Scholar] [CrossRef]
  12. Davey, C.L.; Gilbert, K.V. Temperature-dependent cooking toughness in beef. J. Sci. Food Agric. 1974, 25, 931–938. [Google Scholar]
  13. Ranken, M.D. Handbook of Meat Product Technology; Blackwell Science Oxford: Oxford, UK, 2000; Volume 246. [Google Scholar]
  14. Foegeding, E.A. Gelation in meat batters. In Proceedings of the Reciprocal Meat Conference Proceedings, Laramie, WY, USA, 12–15 June 1988; pp. 44–47. [Google Scholar]
  15. Beneke, B. Technologie verändert die Muskelstruktur: Histologische Identifikation und Beurteilung bei Fleisch und Fleischerzeugnissen. Fleischwirtschaft 2018, 2018, 62–68. [Google Scholar]
  16. Tornberg, E. Effects of heat on meat proteins–Implications on structure and quality of meat products. Meat Sci. 2005, 70, 493–508. [Google Scholar] [CrossRef]
  17. Knipe, C. Types of sausages—Emulsion. In Encyclopedia of Meat Sciences; Jensen, W., Devine, C., Dikemann, M., Eds.; Elsevier: Amsterdam, The Netherlands, 2004; pp. 1126–1220. [Google Scholar]
  18. Raudsepp, P.; Brüggemann, D.A.; Henckel, P.; Vyberg, M.; Groves, K.; Oksbjerg, N.; Therkildsen, M. Performance of conventional histochemical methods relative to a novel immunolabeling technique in assessing degree of degradation in comminuted chicken meat. Food Control 2017, 73, 133–139. [Google Scholar] [CrossRef]
  19. Haack, E.; Haack, O.; Schnäckel, W. Probleme, Ursachen und Lösungen—Grundlagen und Vorgänge bei der Fleischbearbeitung mit Maschinen der Wolftechnologie-1. Teil. Fleischwirtschaft 2003, 83. Available online: https://cloud.hs-anhalt.de/index.php/s/A2drwDnJS2GTrCd (accessed on 28 September 2022).
  20. Haack, E.; Haack, O.; Schnäckel, W. Optimal Fördern und Zerkleinern—Grundlagen und Vorgänge bei der Fleischbearbeitung mit Maschinen der Wolftechnologie-3. Teil. Fleischwirtschaft 2003, 83. Available online: https://cloud.hs-anhalt.de/index.php/s/Z2zbPpieGd283wm (accessed on 28 September 2022).
  21. Tyszkiewicz, I.; Kłossowska, B.M.; Wieczorek, U.; Jakubiec-Puka, A. Mechanical tenderisation of pork meat: Protein and water release due to tissue damage. J. Sci. Food Agric. 1997, 73, 179–185. [Google Scholar] [CrossRef]
  22. BMEL. Leitsätze für Fleisch und Fleischerzeugnisse, Neufassung Vom 25.11.2015. Bundesanzeiger AT 23.12.2015 B4. 2015. Available online: https://www.bmel.de/SharedDocs/Downloads/Ernaehrung/Lebensmittelbuch/LeitsaetzeFleisch.pdf?__blob=publicationFile (accessed on 16 October 2022).
  23. Honikel, K.O.; Hamm, R. Measurement of water-holding capacity and juiciness. In Quality Attributes and Their Measurement in Meat, Poultry and Fish Products; Pearson, A., Dutson, T., Eds.; Springer: Boston, MA, USA, 1994; Volume 8, pp. 125–161. [Google Scholar]
  24. De Huidobro, F.R.; Miguel, E.; Blázquez, B.; Onega, E. A comparison between two methods (Warner–Bratzler and texture profile analysis) for testing either raw meat or cooked meat. Meat Sci. 2005, 69, 527–536. [Google Scholar]
  25. Irmscher, S.B.; Gibis, M.; Herrmann, K.; Kohlus, R.; Weiss, J. Development of a novel homogenizer using the vane pump-grinder technology for the production of meat batter. J. Food Eng. 2016, 169, 10–17. [Google Scholar]
  26. Schiel, L.; Wind, C.; Krueger, S.; Braun, P.G.; Koethe, M. Applicability of analytical methods for determining the composition of edible insects in German Food Control. J. Food Compos. Anal. 2022, 122, 104676. [Google Scholar] [CrossRef]
  27. Grau, R.; Hamm, R. Über das Wasserbindevermögen des Säugetiermuskels. Z. Für Lebensm. Und-Forsch. 1957, 105, 446. [Google Scholar] [CrossRef]
  28. Irmscher, S.B.; Rühl, S.; Herrmann, K.; Gibis, M.; Kohlus, R.; Weiss, J. Determination of process-structure relationship in the manufacturing of meat batter using vane pump-grinder systems. Food Bioprocess Technol. 2015, 8, 1512–1523. [Google Scholar] [CrossRef]
  29. Friedelsheimer, B.; Büchl-Zimmermann, S.; Welsch, U. Schnittpräparation für die Lichtmikroskopie. In Romeis Mikroskopische Technik; Mulisch, M., Welsch, U., Eds.; Springer: Berlin/Heidelberg, Germany, 2015. [Google Scholar]
  30. BVL, Bundesamt für Verbraucherschutz und Lebensmittelsicherheit. Amtliche Sammlung von Untersuchungsverfahren nach § 64 Lebensmittel- und Futtermittelgesetzbuch (LFGB), § 38 Tabakerzeugnisgesetz (TabakerzG), §28b Gentechnikgesetz (GenTG)-Verfahren zur Probennahme und Untersuchung von Lebensmitteln; Beuth Verlag GmbH: Berlin, Germany, 2017. [Google Scholar]
  31. Smetana, S.; Larki, N.A.; Pernutz, C.; Franke, K.; Bindrich, U.; Toepfl, S.; Heinz, V. Structure design of insect-based meat analogs with high-moisture extrusion. J. Food Eng. 2018, 229, 83–85. [Google Scholar] [CrossRef]
  32. Hildebrandt, G.; Jöckel, J. Die Nachweismöglichkeit von wie Brühwurstbrät fein zerkleinertem Fleisch in Modellversuchen. Fleischwirtschaft 1980, 60, 392–403. [Google Scholar]
  33. Irmscher, S.B.; Böjthe, Z.; Herrmann, K.; Gibis, M.; Kohlus, R.; Weiss, J. Influence of filling conditions on product quality and machine parameters in fermented coarse meat emulsions produced by high shear grinding and vacuum filling. J. Food Eng. 2013, 117, 316–325. [Google Scholar] [CrossRef]
  34. Otto-Kuhn, D.; Tichaczek-Dischinger, P. Hackfleisch aus handwerklicher Herstellung oder aus der Fertigpackung—ein qualitativer Vergleich. Fleischwirtschaft 2015, 95, 104–107. [Google Scholar]
  35. Project-Attending Committee; Quakenbrück, Stuttgart. Personal communication, 2019.
  36. Schering, B. Zur aktuellen Bedeutung der Lebensmittel-Histologie—Entwicklung der Fragestellungen, §64 Methoden und Validierung—Teil 1: Bezug auf Fleischerzeugnisse. Fleischwirtschaft 2015, 95, 103–107. [Google Scholar]
  37. Schering, B. Zur aktuellen Bedeutung der Lebensmittel-Histologie—Entwicklung der Fragestellungen, § 64 Methoden und Validierung—Teil 2: Die Entwicklung der Fragestellungen für die Lebensmittel-Histologie. Fleischwirtschaft 2015, 95, 94–98. [Google Scholar]
  38. Beck, K.; Eißner, A.; Rien, K.; Wenisch, S.; Lücker, E. Der Nachweis des Gefrierens bei Hackfleisch im Rahmen der lebensmittel-histologischen Untersuchung; Arbeitstagung der DVG: Garmisch, Germany, 2011. [Google Scholar]
  39. Herrero, A.M.; Carmona, P.; LóPez-LóPez, I.; JiméNez-Colmenero, F. Raman spectroscopic evaluation of meat batter structural changes induced by thermal treatment and salt addition. J. Agric. Food Chem. 2008, 56, 7119–7124. [Google Scholar] [CrossRef]
  40. Souci, S.; Fachmann, W.; Kraut, H. Fleisch. In Die Zusammensetzung der Lebensmittel Nährwert-Tabellen 1989/90; Souci, S., Fachmann, W., Kraut, H., Eds.; Wissenschaftliche Verlags-GmbH: Stuttgart, Germany, 1989. [Google Scholar]
  41. Leseigneur-Meynier, A.; Gandemer, G. Lipid composition of pork muscle in relation to the metabolic type of the fibres. Meat Sci. 1991, 29, 229–241. [Google Scholar] [CrossRef]
  42. Offer, G.; Knight, P.; Jeacocke, R.; Almond, R.; Cousins, T.; Elsey, J.; Parsons, N.; Sharp, A.; Starr, R.; Purslow, P. The structural basis of the water-holding, appearance and toughness of meat and meat products. Food Struct. 1989, 8, 17. [Google Scholar]
  43. Hamm, R. Water-holding capacity of meat. In Meat; Cole, D., Lawrie, R., Eds.; Butterworths: London, UK, 1975; p. 321. [Google Scholar]
  44. Warner, R.D. The eating quality of meat—IV water-holding capacity and juiciness. In Lawrie´ s Meat Science; Elsevier: Amsterdam, The Netherlands, 2017; pp. 419–459. [Google Scholar]
  45. Hughes, J.; Oiseth, S.; Purslow, P.; Warner, R. A structural approach to understanding the interactions between colour, water-holding capacity and tenderness. Meat Sci. 2014, 98, 520–532. [Google Scholar] [CrossRef]
  46. Krickmeier, J. Modellierung der Bedingungen beim Schneiden insbesondere in einer Wolfmaschine mit dem Ziel der Optimierung des Zerkleinerungsprozesses sowie der Erhöhung der Produktqualität. Ph.D. Thesis, Martin-Luther-Universität Halle-Wittenberg, Halle, Germany, 2015. [Google Scholar]
  47. Palka, K.; Wesierska, E. Physics and Chemistry. In Encyclopedia of Meat Sciences, 2nd ed.; Devine, C., Dikeman, M., Eds.; Elsevier: London, UK; Waltham, UK; San Diego, CA, USA, 2014; Volume 1, pp. 404–409. [Google Scholar]
  48. Bejerholm, C.; Tørngren, M.; Aaslyng, M. Cooking of Meat. In Encyclopedia of Meat Sciences, 2nd ed.; Devine, C., Dikeman, M., Eds.; Elsevier: London, UK; Waltham, UK; San Diego, CA, USA, 2014; Volume 1, pp. 370–376. [Google Scholar]
  49. Hamm, R. Die Mikrostruktur des Muskels und ihre Beziehung zum Wasser-bindungsvermögen. Fleischwirtschaft 1963, 43, 298–301. [Google Scholar]
  50. Branscheid, W.; Honikel, K.; Von Lengerken, G.; Troeger, K. Qualität von Fleisch und Fleischwaren–Band 1. 2. edition. Dtsch. Fachverlag GmbH Frankf. Am Main 2007, 157–197. [Google Scholar]
  51. Bertram, H.C.; Kristensen, M.; Andersen, H.J. Functionality of myofibrillar proteins as affected by pH, ionic strength and heat treatment–a low-field NMR study. Meat Sci. 2004, 68, 249–256. [Google Scholar]
  52. Chen, X.; Tume, R.K.; Xu, X.; Zhou, G. Solubilization of myofibrillar proteins in water or low ionic strength media: Classical techniques, basic principles, and novel functionalities. Crit. Rev. Food Sci. Nutr. 2017, 57, 3260–3280. [Google Scholar] [CrossRef]
  53. Huff-Lonergan, E.; Lonergan, S.M. Mechanisms of water-holding capacity of meat: The role of postmortem biochemical and structural changes. Meat Sci. 2005, 71, 194–204. [Google Scholar] [CrossRef]
  54. Shi, L.; Zheng, J.; Liu, S.; Gao, Y.; Shao, J.H. Effect of fatty acid saturation on gel properties of salt-soluble protein in pork. J. Food Sci. 2021, 86, 4037–4044. [Google Scholar]
  55. Honikel, K.O. Minced meats. In Encyclopedia of Meat Sciences; Academic Press: Cambridge, MA, USA, 2014; pp. 422–424. [Google Scholar]
  56. Cardoso, C.M.; Mendes, R.; Nunes, M.L. Instrumental texture and sensory characteristics of cod frankfurter sausages. Int. J. Food Prop. 2009, 12, 625–643. [Google Scholar]
  57. Rahman, M.S.; Al-Waili, H.; Guizani, N.; Kasapis, S. Instrumental-sensory evaluation of texture for fish sausage and its storage stability. Fish. Sci. 2007, 73, 1166–1176. [Google Scholar] [CrossRef]
  58. Bejerholm, C.; Aaslyng, M.D. The influence of cooking technique and core temperature on results of a sensory analysis of pork—Depending on the raw meat quality. Food Qual. Prefer. 2004, 15, 19–30. [Google Scholar] [CrossRef]
  59. Sifre, L.; André, B.; Coton, J.-P. Development of a system to quantify muscle fibre destructuration. Meat Sci. 2009, 81, 515–522. [Google Scholar] [CrossRef]
Figure 1. Flow chart of the finely chopped pork loin and minced pork production as well as photographs of the cutting devices of 1st and 2nd mincing of minced meat and produced minced meat mixtures (100%) with finely chopped pork added (0–100%). MAP means modified atmosphere packaging.
Applsci 12 10590 g001
Figure 2. Amount of non-intact cells (n = 16) (mean ± standard deviation) of raw minced meat with finely chopped meat (FCM) added. The shaded area shows the realistic range of the FCM addition. Different letters indicate significant differences (p < 0.05).
Applsci 12 10590 g002
Figure 3. (ac) Typical section of histological images (magnification 100×; green: muscle, blue: fat, white: not colored; encircled: destroyed cells), (df) confocal laser scanning microscopy (CLSM: magnification 60×, length of bar: 50 µm; green: protein, red: fat) and (gi) scanning electron microscopy (SEM: magnification 250×, length of bar: 100 µm) of raw minced meat with 0, 45, and 100% finely chopped meat added. Histological images do not represent identical samples section as do CLSM and SEM.
Applsci 12 10590 g003
Figure 4. Soluble protein content (white) (n = 9) and pH value (black) (n = 9) of raw minced meat with finely chopped meat added (mean ± standard deviation), respectively. For comparability, amount of non-intact cells is illustrated on top of graph. Different letters indicate significant differences (p < 0.05) for each parameter (pH value in italic).
Applsci 12 10590 g004
Figure 5. Mean ± standard deviation of (a) compression of raw (white) (n = 12) and cooked (black) (n = 27) minced meat with finely chopped meat added and (b) cutting force of cooked minced meatballs (n = 30). For comparability, amount of non-intact cells is illustrated on top of graph. Different letters indicate significant differences (p < 0.05) for each parameter (cooked in italic).
Applsci 12 10590 g005
Figure 6. Boxplots of sensory evaluation of (a) firmness, (b) juiciness, (c) inner structure and (d) inner cohesion (n = 30) of cooked meatballs consisting of minced meat with finely chopped meat added; 0 means firm, dry, fine structure, and loose cohesion, whereas 10 means soft, juicy, coarse inner structure, and strong cohesion. Dotted line marks mean full line marks median, box marks lower and upper quartile, and whiskers mark distance until lower and upper extreme and single data points mark outliers. Different letters close to mean emphasize significant differences (p < 0.05) for each parameter.
Applsci 12 10590 g006
Table 1. Moisture content, drip loss by filter press method and cooking loss (mean ± standard deviation) of minced meat with finely chopped meat added (n = 9).
Finely Chopped Meat Portion (%)Moisture Content (%)Drip Loss (%) (Filter Press Method)Cooking Loss (%)
072.73 a ± 0.9317.05 a ± 1.5028.27 a ± 1.54
1572.66 a ± 0.7517.22 a ± 2.1428.33 a ± 1.24
3072.78 a ± 0.6716.91 a ± 1.9526.82 ab ± 1.03
4573.19 ab ± 1.0017.40 a ± 2.5127.09 ab ± 1.07
6073.37 ab ± 0.6717.07 a ± 2.5327.45 ab ± 1.60
7573.80 ab ± 0.3916.82 a ± 2.3026.66 ab ± 1.29
9074.12 b ± 0.3717.07 a ± 2.9526.57 ab ± 1.26
10074.14 b ± 0.5316.12 a ± 2.2525.70 b ± 1.71
a,b Different letters indicate significant differences (p < 0.05) for each parameter.
Publisher’s Note: MDPI stays neutral with regard to jurisdictional claims in published maps and institutional affiliations.

