Article

Coherent XUV Multispectral Diffraction Imaging in the Microscale

by
Stylianos Petrakis
1,2,
Alexandros Skoulakis
1,
Yannis Orphanos
1,3,
Anastasios Grigoriadis
1,2,
Georgia Andrianaki
1,4,
Dimitrios Louloudakis
1,
Nathanail Kortsalioudakis
5,
Athanasios Tsapras
5,
Costas Balas
5,
Dimitrios Zouridis
6,
Efthymios Pachos
6,
Makis Bakarezos
1,3,
Vasilios Dimitriou
1,3,
Michael Tatarakis
1,7,
Emmanouil P. Benis
1,2,* and
Nektarios A. Papadogiannis
1,3,*
1
Institute of Plasma Physics and Lasers, Hellenic Mediterranean University Research Centre, 74100 Rethymno, Greece
2
Department of Physics, University of Ioannina, 45110 Ioannina, Greece
3
Department of Music Technology and Acoustics, Hellenic Mediterranean University, 74133 Rethymno, Greece
4
School of Production Engineering and Management, Technical University of Crete, 73100 Chania, Greece
5
School of Electrical & Computer Engineering, Technical University of Crete, 73100 Chania, Greece
6
IKNOWHOW (IKH), 340 Kifisias 116 Ave. Neo Psychiko, 15451 Athens, Greece
7
Department of Electronic Engineering, Hellenic Mediterranean University, 73133 Chania, Greece
*
Authors to whom correspondence should be addressed.
Appl. Sci. 2022, 12(20), 10592; https://doi.org/10.3390/app122010592
Submission received: 19 September 2022 / Revised: 12 October 2022 / Accepted: 17 October 2022 / Published: 20 October 2022
(This article belongs to the Section Optics and Lasers)

Abstract

:
The rapid growth of nanotechnology has increased the need for fast nanoscale imaging. X-ray free electron laser (XFEL) facilities currently provide such coherent sources of directional and high-brilliance X-ray radiation. These facilities require large financial investments for development, maintenance, and manpower, and thus, only a few exist worldwide. In this article, we present an automated table-top system for XUV coherent diffraction imaging supporting the capabilities for multispectral microscopy at high repetition rates, based on laser high harmonic generation from gases. This prototype system aims towards the development of an industrial table-top system of ultrafast soft X-ray multi-spectral microscopy imaging for nanostructured materials with enormous potential and a broad range of applications in current nanotechnologies. The coherent XUV radiation is generated in a semi-infinite gas cell via the high harmonic generation of the near-infrared femtosecond laser pulses. The XUV spectral selection is performed by specially designed multilayer XUV mirrors that do not affect the XUV phase front and pulse duration.

1. Introduction

Many modern laboratories are equipped with ultrafast laser systems, which routinely deliver mJ pulses with repetition rates ranging from Hz to MHz. The interaction of strong laser pulses with atomic gas targets can generate coherent extreme ultraviolet (XUV) radiation in the form of a comb of odd harmonics of the laser field’s fundamental frequency [1,2,3]. Currently, this coherent XUV radiation serves as a secondary source for applications related to ultrafast microscopy techniques based on coherent diffraction imaging (CDI) [4,5,6,7]. The necessity for the development of such secondary coherent XUV sources, with high-quality geometrical and spectral characteristics, has been recently emphasized [8]. For high-quality ultrafast CDI in the nanoscale, several conditions should be fulfilled. The most important are: (i) the high coherence of the XUV radiation, (ii) the adequate intensity of the generated harmonics in use, (iii) the preservation of the ultrafast properties and phase front of the XUV pulses, (iv) the selection of appropriate spectral regions, and (v) the ability of the system to operate at high repetition rates.
CDI is a lensless microscopy technique, based on XUV, soft X-rays, or hard X-rays, first experimentally demonstrated in 1999 by Miao and colleagues [9], as an extension of the conventional X-ray crystallography, where the image of a specimen was reconstructed with a spatial resolution of 75 nm. Conventional CDI involves an isolated sample that is simultaneously illuminated over its entire surface with spatial coherence to ensure that the intensity of the diffraction pattern from the sample is correctly captured by a camera, while the phase information is numerically recovered using iterative algorithms [10,11,12,13,14]. Furthermore, a scanning type of CDI method that overcomes the limitation of the isolated sample is ptychography [15,16,17,18,19]. In ptychography, the sample is scanned trough a focused beam of coherent radiation for well-overlapping multiple positions, and the corresponding diffraction patterns are recorded. Although suitable XUV/soft X-ray sources were previously only available in large-scale facilities such as synchrotrons [20] and free electron lasers [21], with the advancement of ultrafast laser technology, XUV sources based on high-order harmonic generation (HHG) allowed for table-top high-spatial-resolution CDI of fixed targets in transmission [22,23,24,25,26,27] and reflective modes [15,16,18], including femtosecond X-ray holography [28]. Indeed, as first demonstrated in the pioneering work of Seaberg et al. [4], imaging of a sample with ≃200 nm resolution was achieved using a single harmonic order at a wavelength of 29 nm. Over the past decade, rapid progress in understanding the dynamics and development of HHG sources [29] has resulted in a consequent increase of resolution at sub-wavelength values [30].
In this article, we present an automated experimental prototype system that adequately meets most of the necessary conditions for ultrafast multispectral CDI. The system utilizes a semi-infinite cell for the XUV high harmonic generation that supports operation in high repetition rates [31]. The phase matching of the generated comb of harmonics can be controlled by the gas in use, the gas pressure, the geometrical characteristics, the intensity and chirp of the laser pulses, as well as the point of the focus with respect to the location of the exit pinhole of the semi-infinite cell. The choice of a semi-infinite cell offers high-stability HHG conditions and, thus, highly reliable operation. The capabilities offered by multispectral imaging in the IR and visible regions of the EM spectrum is well known in the literature, since different details of an object can be viewed at different spectral regions [32,33,34,35]. Our system provides the capability of automated in vacuum selection of certain harmonics, while maintaining their high coherence and pulse duration, for use in CDI. Thus, our system extends the multispectral concept to the XUV region of the EM spectrum.

2. Materials and Methods

2.1. The Experimental Setup

Our XUV CDI experimental setup, designed and developed at the Institute of Plasma Physics and Lasers (IPPL) [36], consists of four stages, depicted with letters A, B, C, and D as presented in Figure 1. The first stage, A, is the semi-infinite static cell filled with the gas target at pressures in the order of tens of mbar. The IR laser pulses have a central wavelength of 807 nm and are delivered by the Ti:Sa laser system (Amplitude Technologies) to the first stage of the setup with an energy of 1 mJ and a minimum pulse duration of 26 fs. The laser beam is focused by an f = 38 cm lens at the neighborhood of the exit of the semi-infinite cell, which ends in a 100 μ m thin copper foil attached to a 1.5” aluminum tube. The foil is drilled by the laser beam, creating an exit pinhole of 50 to 100 μ m in diameter. The intense laser fields interact with the gas atoms, resulting in the generation of an XUV comb of higher-order harmonics that propagates along with the laser beam through the drilled pinhole to the second and third stages of the setup. The location of the laser beam focus in the neighborhood of the drilled pinhole area can be varied, by moving the lens micrometrically along the laser propagation axis. Moreover, the semi-infinite gas cell is equipped with a tube manifold for evacuating and filling it with a variety of gases, or even a mixture of gases if necessary, at accurately measured pressures during the experiment. Thus, the generated XUV radiation can be controlled and optimized with respect to the gas species and pressure, as well as to the location of the laser focus. In addition, the plasma formation inside the semi-infinite gas cell can be imaged by a CCD camera along with the corresponding XUV spectral images described below. This option is a powerful tool towards both the interpretation of the corresponding XUV spectral images characteristics, as well as the optimization of the coherent XUV generation at the predetermined wavelengths.
The second stage, B, is a differentially pumped chamber, which separates the high-pressure first stage from the third and fourth low-pressure stages. The entry aperture is the laser drilled pinhole at the exit of the semi-infinite cell, the small size of which minimizes the gas throughput. The exit aperture has a diameter of 3 mm, which is wide enough to allow the propagation of the XUV radiation, but simultaneously blocks a large part of the more divergent IR laser beam. Stage B is pumped by a 150 L/s turbomolecular pump reaching pressure values of ∼10 4 mbar in gas cell operation conditions.
The third stage, C, is a 70 cm in diameter chamber that is pumped by a 350 L/s turbomolecular pump, thus reaching a background pressure of 1 × 10 6 mbar or of ∼ 10 5 mbar in gas cell operation. The chamber hosts all the necessary optical and optomechanical components for the automated optimization, filtering, and selection of the XUV wavelengths and propagation of the resulting XUV beam to the target area at the fourth stage. First, the mixed XUV and IR beam, upon entering the chamber, is filtered from the IR laser residual beam using a 400 nm-thick Al filter, while at the same time, the XUV radiation spectrum of interest (i.e., 30 nm to 50 nm) suffers only an overall reduction in intensity. The Al filter is mounted on a linear rod equipped with a vacuum-compatible motor that is externally controlled. Thus, the Al filter can be inserted in the XUV beam path at will.
The selection of the wavelengths is performed via two similar pairs of mirrors. Each pair consists of a multilayer flat mirror and a multilayer spherical concave mirror, placed in opposite directions, as shown in Figure 1. The pair of multilayer mirrors reflects only a narrow band (∼2 nm) around a central wavelength, while the spherical mirror, having a radius of curvature (ROC) of 1000 mm, focuses the selected XUV beam onto the target at the fourth stage of the setup. Both sets of multilayer mirrors were specially manufactured from SiC/Mg layers (NTT Advanced Technology Corporation) to deliver the central wavelengths of 32.2 nm and 47.6 nm, respectively, at maximum reflectivity for the geometry in use. The pairs of mirrors are fixed on a movable platform placed on a linear rod equipped with a vacuum-compatible motor, which is externally controlled with sub-millimeter accuracy. Thus, our system offers the option of exchanging at will the pairs of mirrors during the measurements in an automated way, which is one of the essential characteristics of our setup.
The platform is also equipped with a grazing-incidence flat field diffraction grating (Hitachi 001-0639), which can be automatically inserted into the generated XUV beam path. In this operation option, which may or may not include the insertion of the Al filter, the XUV beam is diffracted towards a high-quantum-efficiency 16-bit XUV vacuum CCD camera (Raptor Photonics, Eagle XO) with a sensor having 2048 pixels (27.65 mm) at the grating diffraction axis and 512 pixels (6.90 mm) at the XUV divergence axis (perpendicular to the grading diffraction axis). The grating supports a wavelength dispersion efficiency ranging from 22 nm up to 124 nm, much broader than the corresponding spectral region supported by the XUV CCD camera. Thus, a selected part of the XUV spectrum, determined by the rotation angle of the grating, also automatically controlled, can be monitored by the XUV CCD camera during the experiment and thus perform an on-line optimization. Moreover, the XUV grating and XUV CCD detector allow for a relatively high spectroscopic resolution from ∼80 to ∼100 pixels per 1 nm, on the CCD, for the spectral region of interest. This resolution is a significant experimental tool for optimizing the quality and characteristics of the XUV beam.
The fourth stage, D, is an ISO200 six-way cross attached to and pumped by the third stage. It hosts the target, which is mounted on a variable in the three dimensions XYZ of the base, as well as in the polar rotation angle Θ . Vacuum-compatible steppers for the four degrees of freedom are externally controlled and set with micrometer accuracy. Thus, the position of the target with respect to the laser focal area is accurately controlled. The monochromatic coherent XUV radiation diffracted by the target is recorded at the second vacuum-compatible XUV CCD camera located 9.0 cm after the target at the end of the six-way cross. The XUV CCD camera has identical characteristics as the XUV CCD camera of the third stage, differing only in the sensor size, which is 1024 by 1024 pixels.
The software interface for controlling the initial XUV filtering, the selection of recording the XUV spectrum, the selection of the pair of mirrors for selecting the wavelength, and the XYZ Θ position control of the target are shown in Appendix A in Figure A1. In the same figure, a block diagram of the above multi-axis control system is also presented. The positions of the optomechanical devices can be calibrated independently and stored for future use or self-calibrated during the experiments.

2.2. XUV Optimization Studies

The optimization of the generated XUV radiation is a multiparameter laborious task. These include the laser beam diameter, the laser beam focus position with respect to the exit pinhole of the semi-infinite gas cell, the gas species and pressures in use, the chirp of the laser pulses, and the filtering of the certain XUV spectral area of interest. Below, we present our approach towards finding the optimum conditions for generating intense and coherent XUV radiation by examining the effects of the aforementioned experimental parameters on the generation of the XUV radiation.

2.2.1. Laser Beam Diameter and Focus Position

For the investigations on the laser aperture and focus position, we installed a chevron-type multichannel plate (MCP) detector in front of the spectral imaging XUV CCD camera. The 1” in diameter MCP detector had a 1 mm in width entry slit and was installed on a linear motorized stage, so that the whole spectrum supported by the grating is recorded during one travel of the stage (∼5 min duration) with an adequate spectral resolution Δ λ / λ 0.02 .
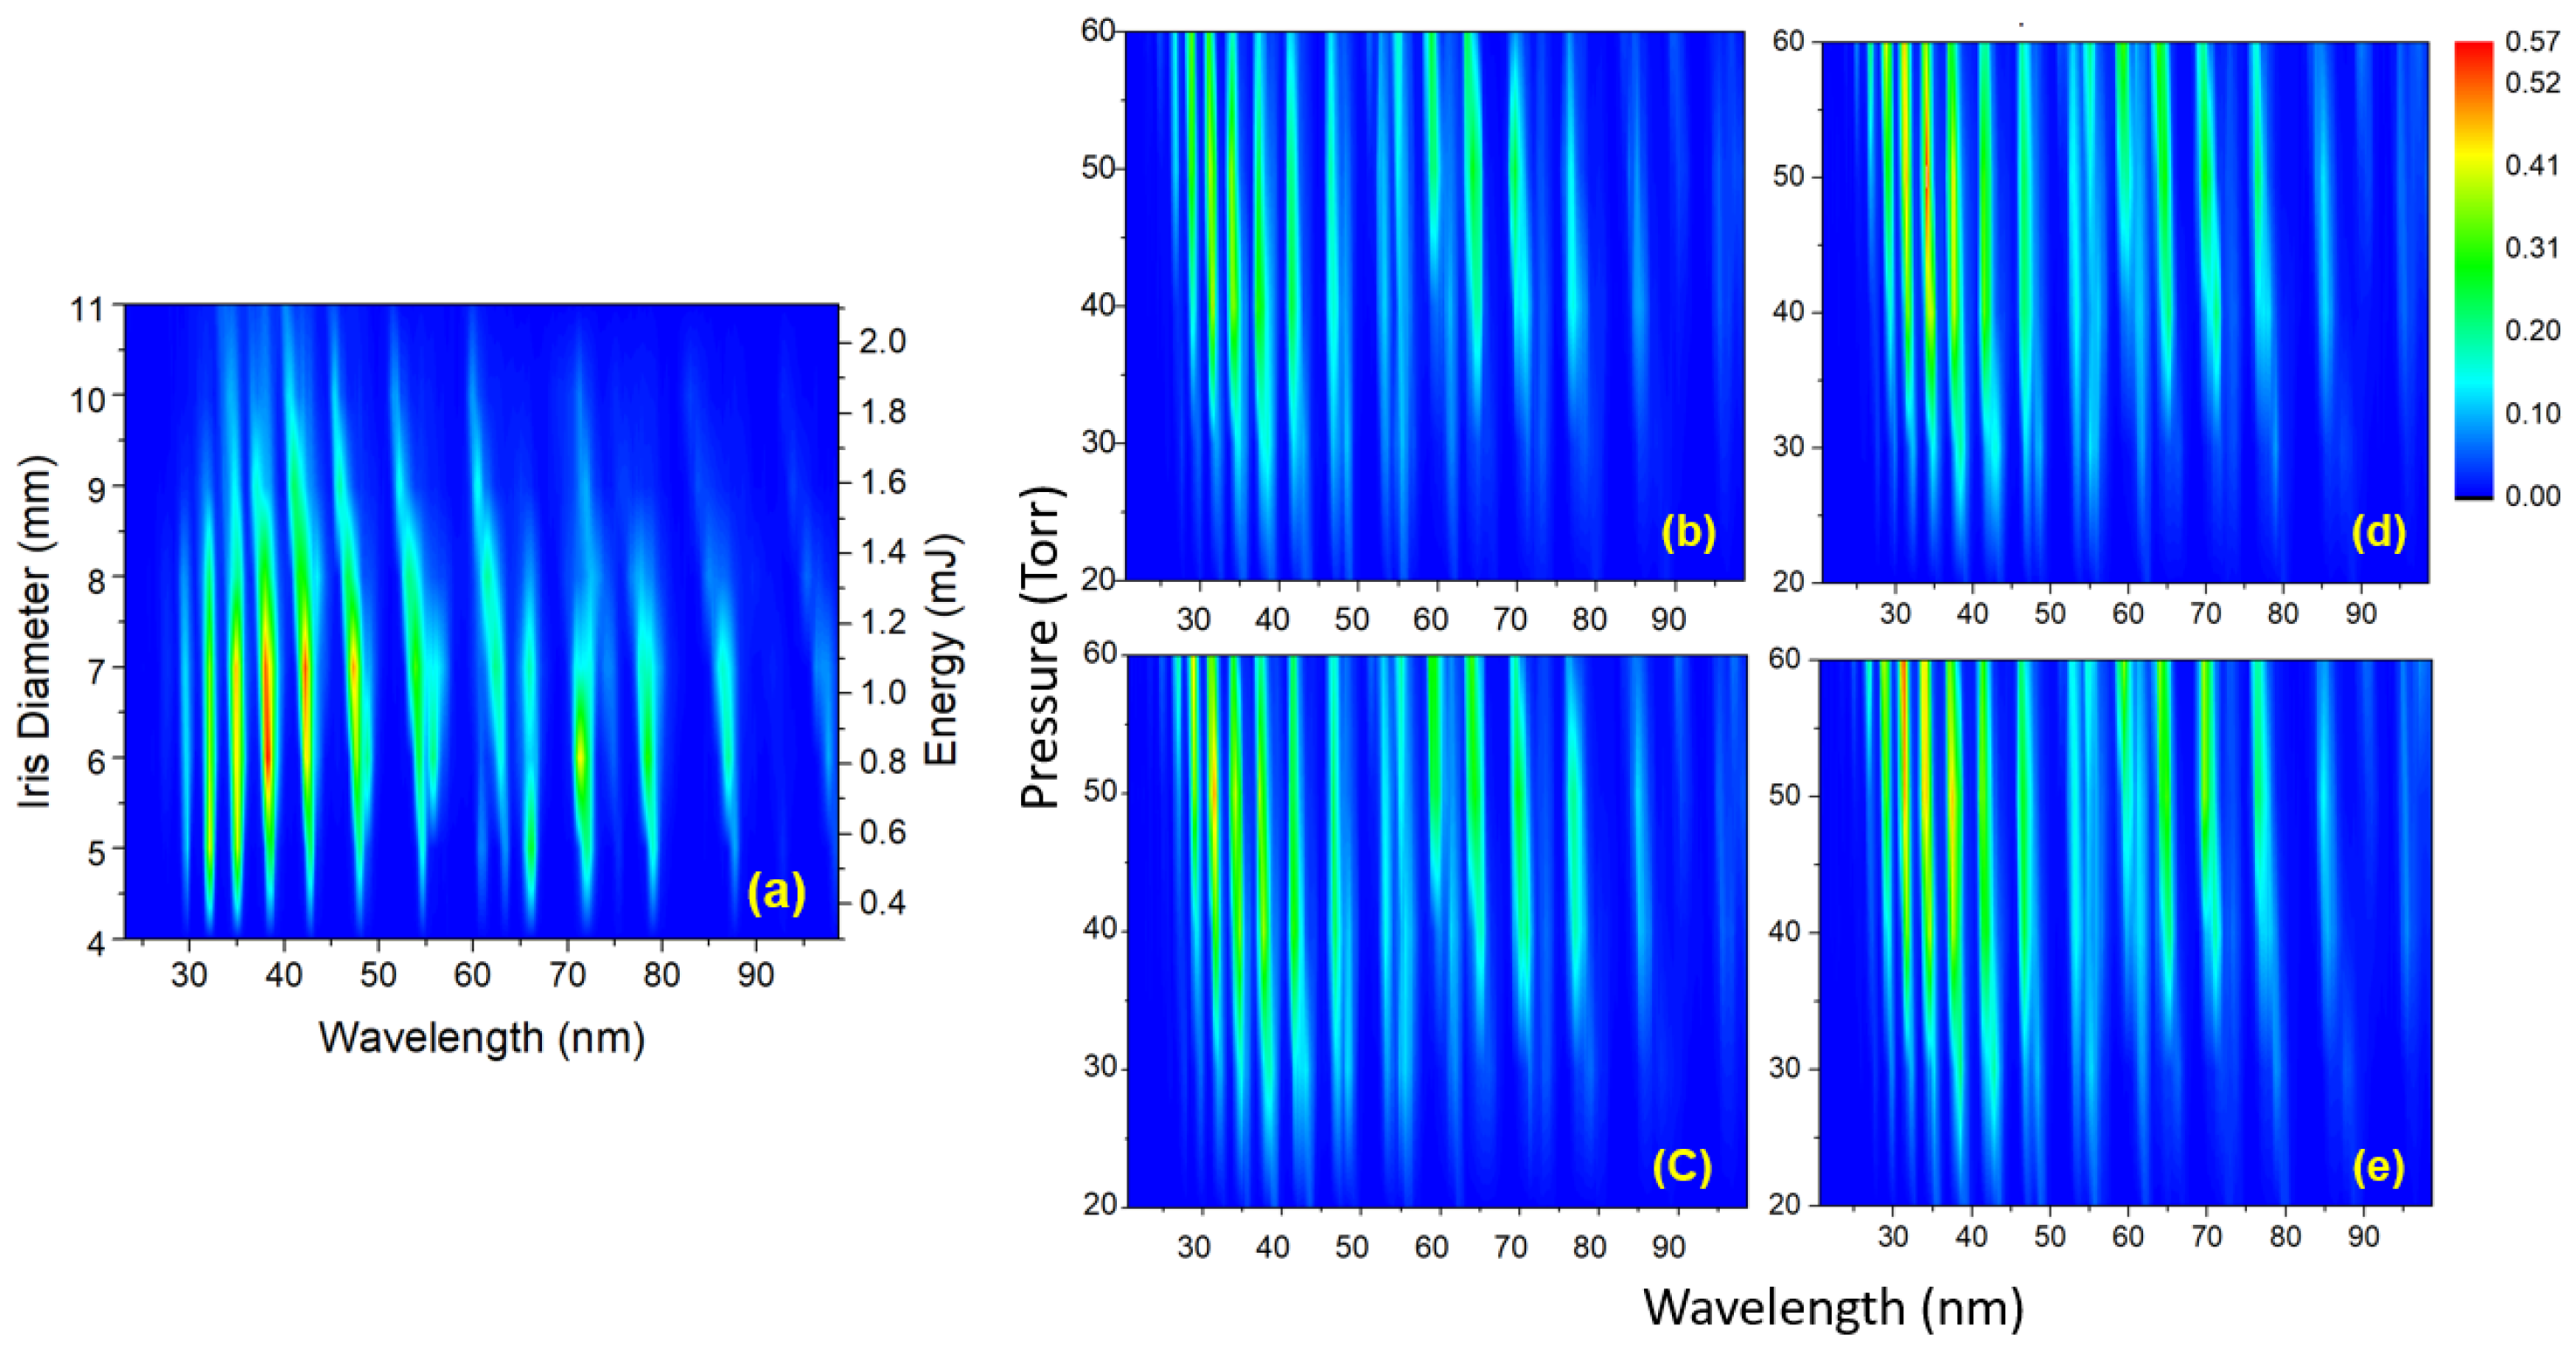
In Figure 2, some indicative results from this part of the study are presented. In Figure 2a, the dependence of the recorded XUV spectrum on the laser beam diameter and corresponding energies is shown. Here, the laser beam was truncated by an iris prior to its focusing, thus affecting the focal area and, therefore, the HHG. It can be clearly seen that an iris diameter of 7 mm provides the most intense harmonics for the spectral region of interest. This is a known effect due to geometrical phase-matching conditions [37]. Thus, we adopted this condition, which corresponds to an energy of 1 mJ, for all of our later studies. Even though these data were obtained for Ar gas at 60 mTorr, similar qualitative behavior was observed for other pressures and gases.
In Figure 2b–e, we present the HHG spectra obtained after varying the laser focus position with respect to the exit pinhole of the semi-infinite gas cell for various Ar gas pressures. For this, the focusing lens was mounted on a linear micrometric stage variable along the laser beam propagation axis. The location of the laser focus in combination with the gas pressure is a quite sensitive combination of parameters, as it substantially affects the phase matching conditions, and thus the efficiency of HHG. It is evident that, by focusing the laser beam after the exit pinhole and for relatively high pressures, an increase of the HHG efficiency was achieved for the spectral region of interest here. Based on our overall detailed study, it was decided that the best location for the laser focus was 1 mm after the pinhole, and this condition was adopted for all of our later studies.

2.2.2. Gases

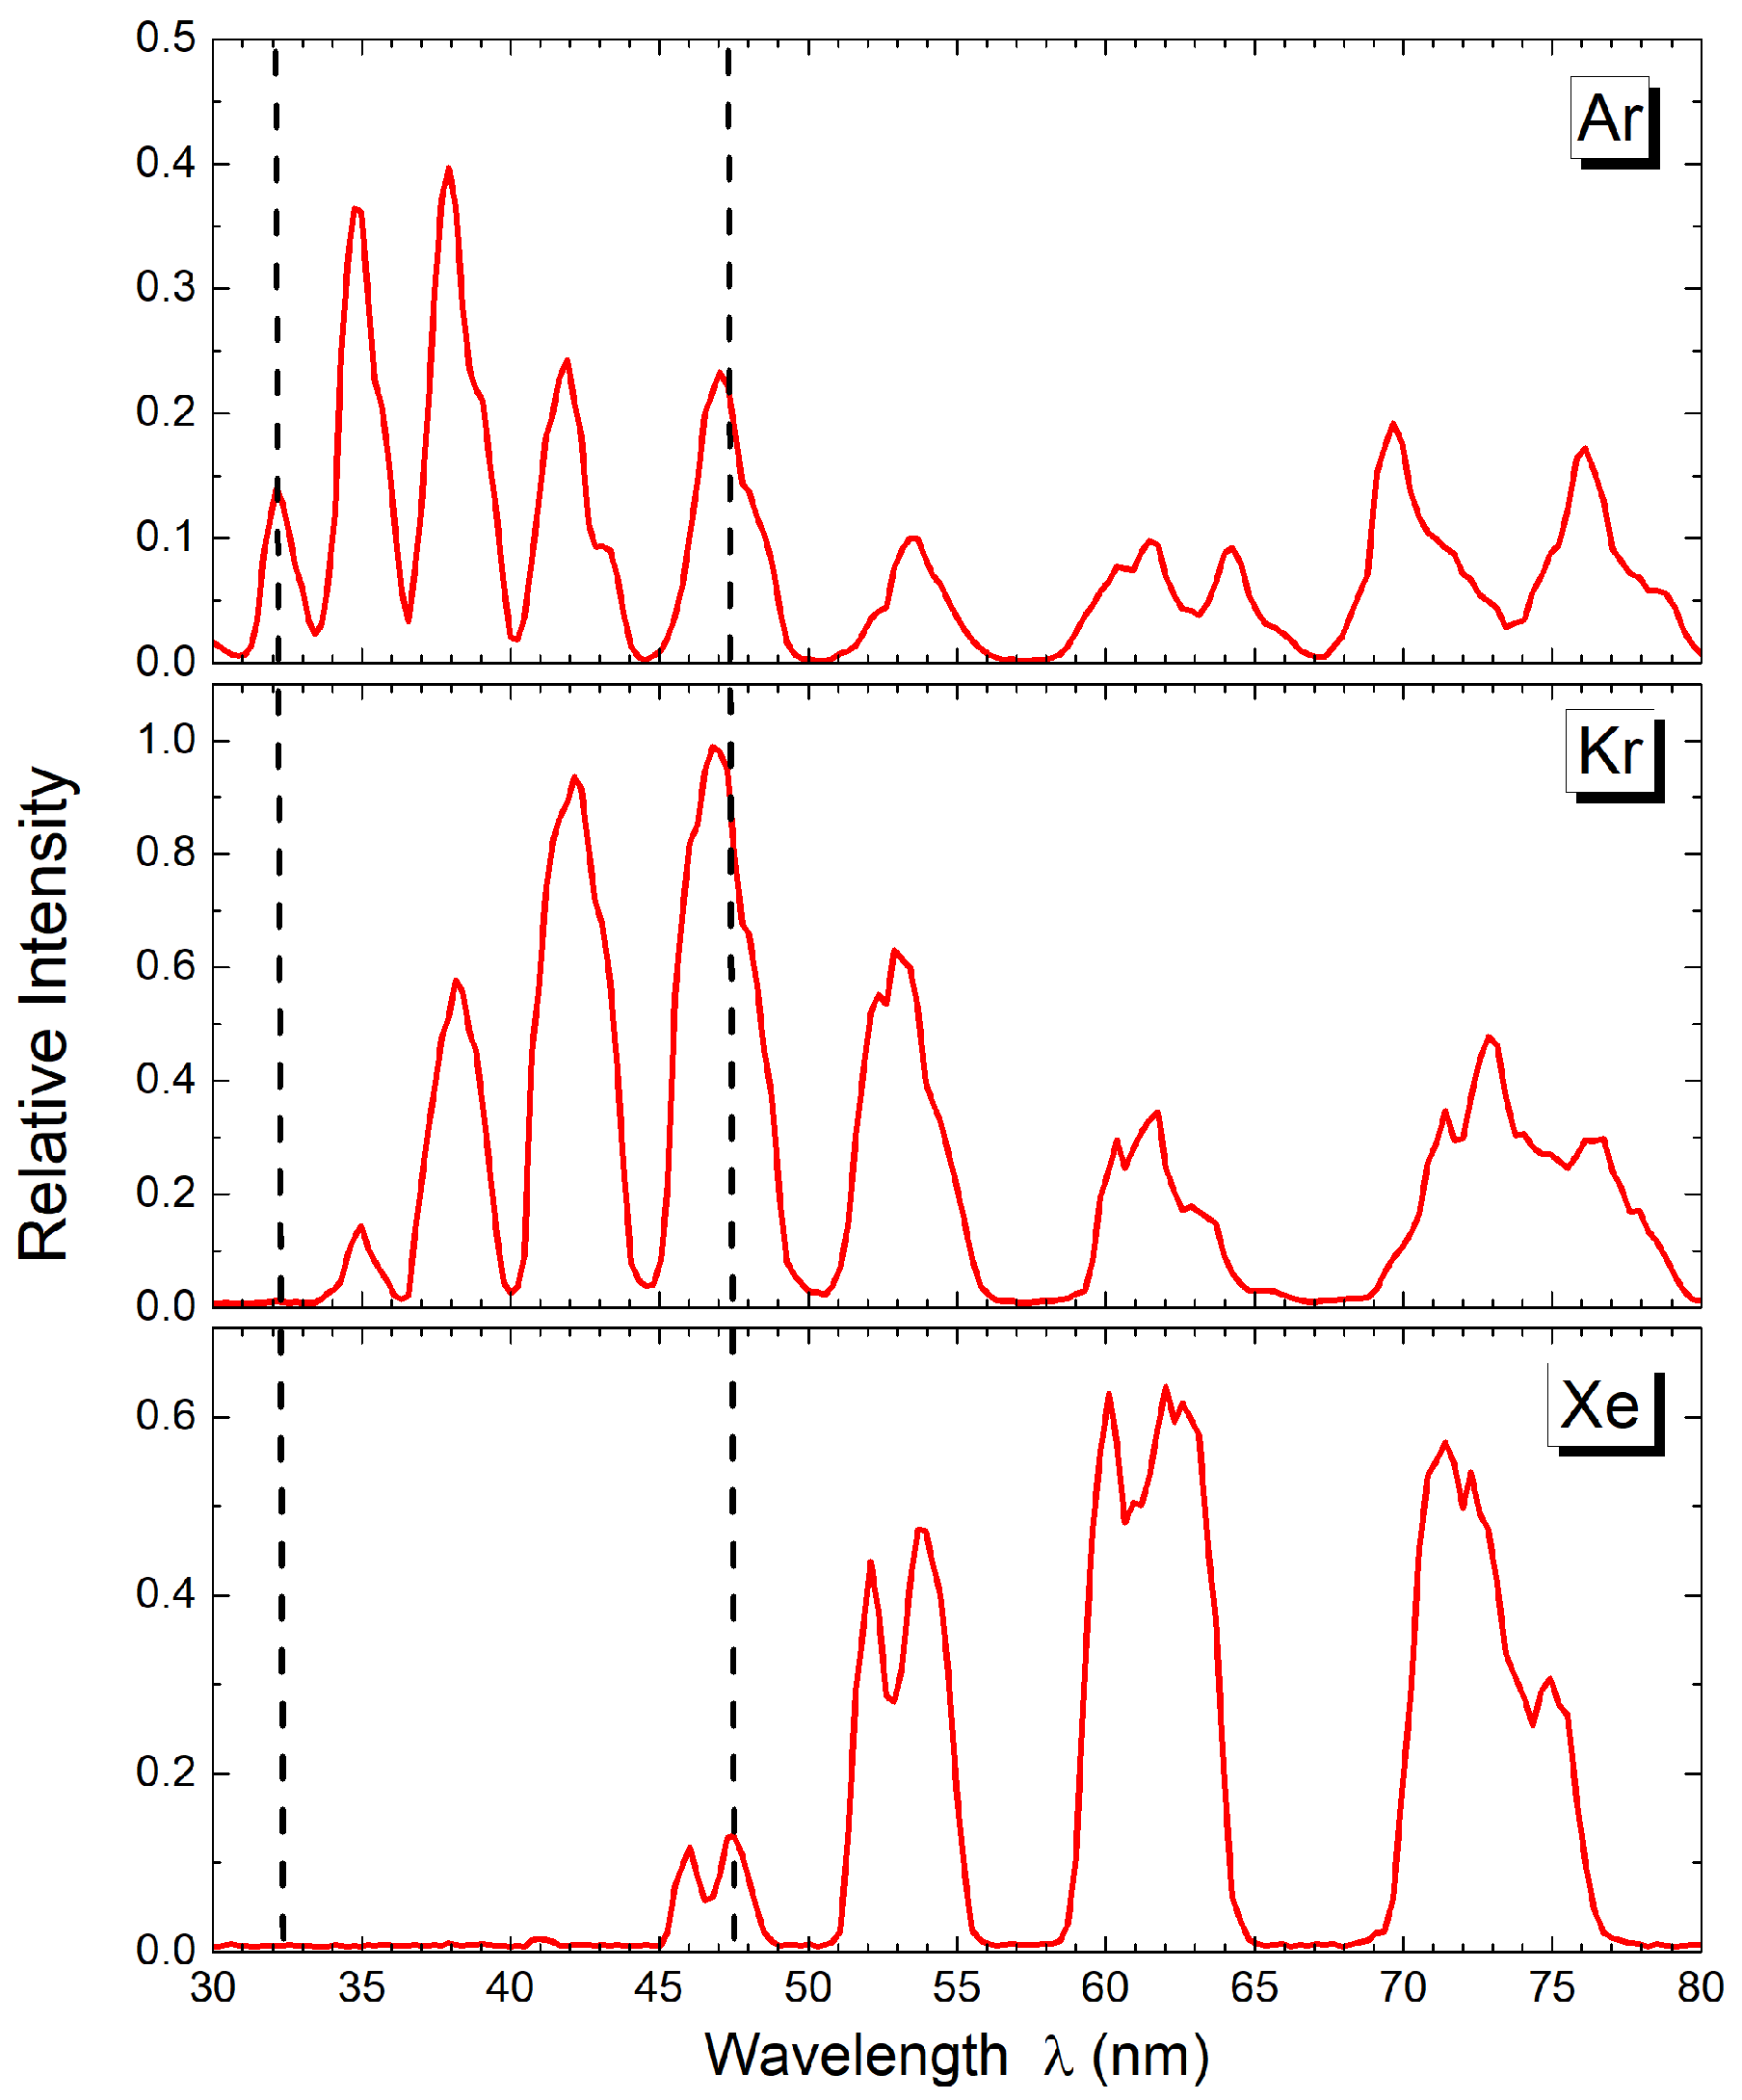
Another crucial parameter in the HHG optimization study is the generating gas in use. Since noble gases are mostly used in such studies, comparative HHG measurements using Ar, Kr, and Xe gases were performed. The HHG spectra were obtained using the setup with the scanning mode MCP detector as in the laser diameter and focusing studies. In Figure 3, the comparative HHG spectra for Ar, Kr, and Xe obtained are presented. An overall higher HHG efficiency was evident for Kr and Xe gases compared to Ar. This is due to their lower ionization potential (15.76 eV, 13.99 eV, and 12.13 eV for Ar, Kr, and Xe, respectively), which, however, affects their spectral cut-off. Specifically, Xe is known to have a maximum cut-off at laser peak intensities close to 8 × 10 13 W/cm2, which corresponds to a cut-off of 43 nm, in accordance with our measurements. For the laser pulse energy of 1 mJ in use, the Ar and Kr cut-offs resulted in 30 and 32 nm, respectively, in accordance with our measurements. From this comparative study, it is clear that for the wavelengths of 47.6 nm and 32.2 nm, the use of Kr and Ar gases, respectively, is preferable.

2.2.3. Chirped Laser Pulses

The control of the temporal rearrangement of the spectral content of the ultrashort laser pulses, namely the chirp of the laser pulses, has been used as a tool for improving the efficiency of the HHG and their characteristics [38,39,40]. Recently, our group showed that by controlling the chirp of intense IR fs laser pulses, the contribution of long and short trajectories in the HHG spectra could be resolved, while the efficiency of their generation, as well as their spectral and divergence characteristics could be accurately controlled [41,42]. Thus, the investigation of the effects of using positive (instantaneous frequency increasing with time) and negative (instantaneous frequency decreasing with time) chirp pulses was included in the HHG optimization study. The chirp value and corresponding pulse duration of the laser pulse was accurately controlled by varying the distance between the compressor’s gratings relative to the position set for delivering FTL laser pulses. Considering only linear chirp, its value was estimated in a shot-to-shot basis via measurements with a femtosecond single-shot-intensity autocorrelator (Amplitude Technologies, Bonsai) located just before the interaction cell.
In Figure 4, a detailed study of the HHG efficiency as a function of the chirp of the laser pulses and for various Ar gas pressures is presented. As reported in [42], the maximum efficiency for HHG takes place for negatively chirped pulses with a duration around 50 fs and relatively high pressures. Thus, for optimizing the HHG generation at a predetermined central wavelength, we also varied the chirp of the laser pulses to low negative values.

2.2.4. Filtering

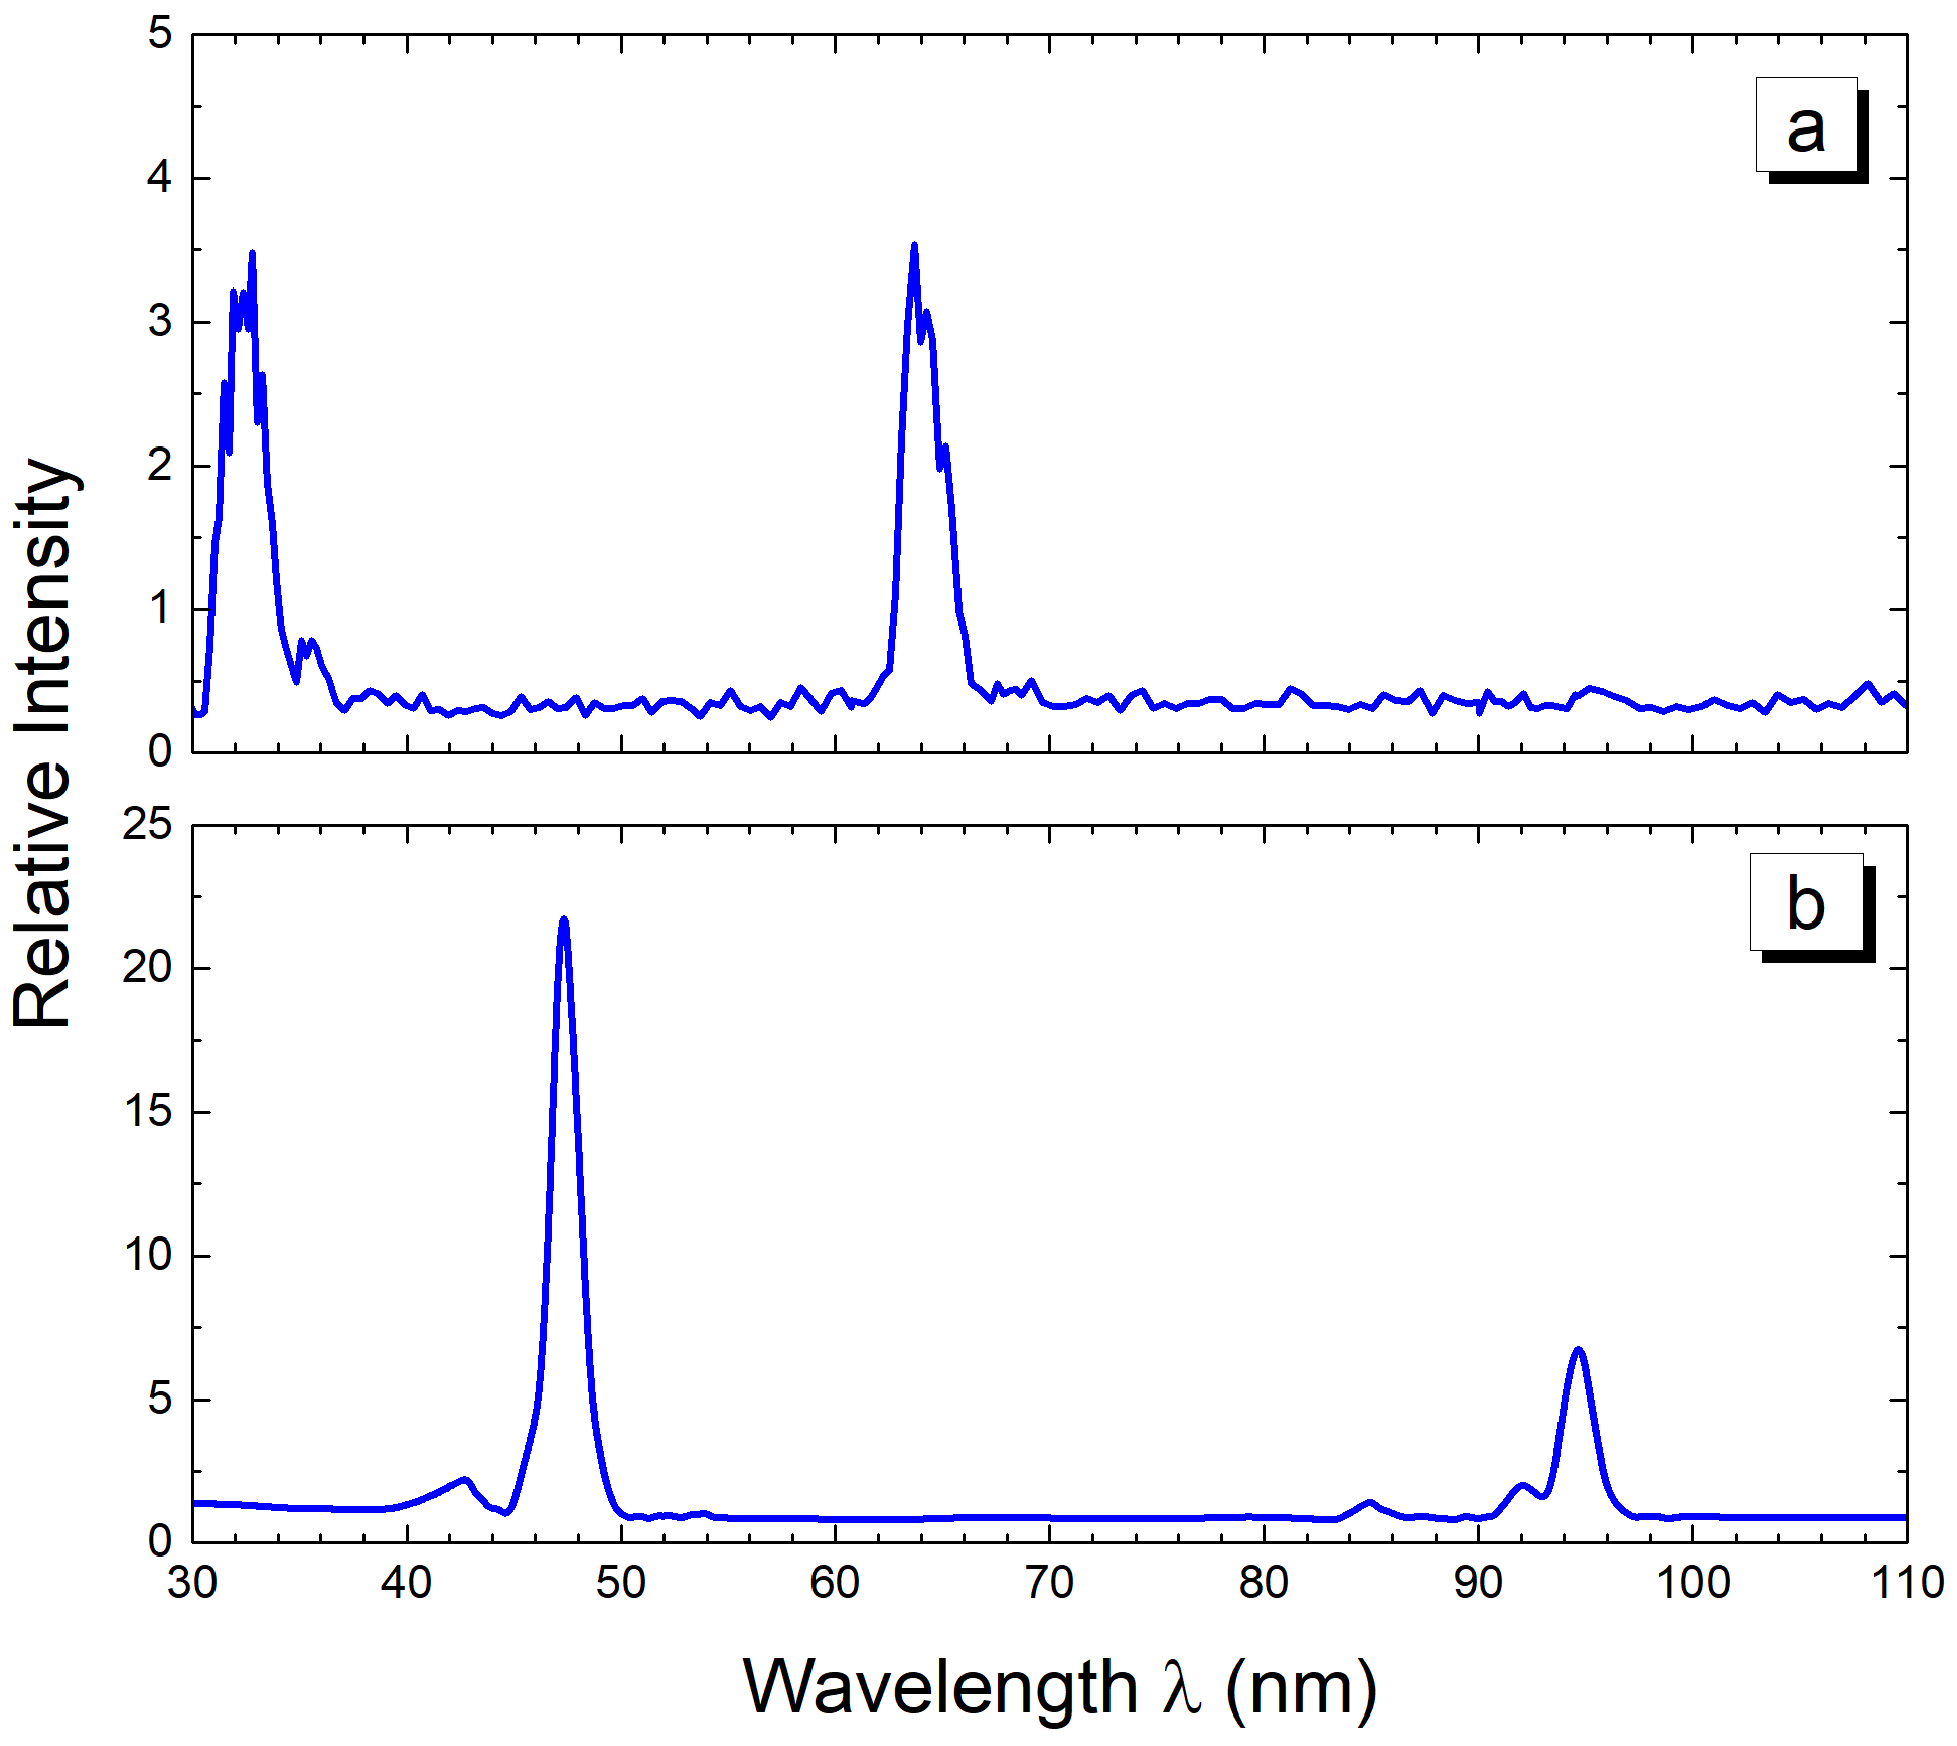
Although the pairs of XUV multilayer mirrors were specially designed for the geometry of our setup and for the wavelengths of 32.2 nm and 47.6 nm, their transmittance was additionally tested in realistic experimental conditions. For this, an optical setup in the chamber of Stage C was developed, so that the generated XUV beam is first filtered by the 400 nm Al foil, then propagates through the pair of multilayer mirrors and, finally, is spectrally analyzed by the flat field grating. The recording of the XUV spectrum was performed via the MCP scanning mode in order to obtain the full spectrum. The results of these measurements for both pairs of multilayer mirrors are presented in Figure 5.
It can be seen that the pair of low-value wavelength mirrors transmits at a central wavelength of 32.2 nm with an FWHM of 2.5 nm, while the pair of high-value wavelength mirrors transmits at a central wavelength of 47.6 nm with an FWHM of 1.5 nm. The appearance of peaks at lower-value wavelengths in both spectra is due to the second order of diffraction, as can be inferred from their twice in magnitude wavelength value. Finally, it should be noted that for 32.2 nm, Ar gas was used, while for 47.6 Kr, gas was used, as resulted from the study on the gas types.

2.2.5. XUV Radiation Coherence

The overall coherence of the generated XUV radiation was initially tested by recording diffraction images resulting from the illumination of a copper mesh with 70 lines per inch and 5 μ m-thick wires. The copper mesh was placed at the entrance of the chamber of Stage C, and the diffraction images were recorded by the XUV CCD camera located at the end of the six-way cross of Stage D. A picture of the copper mesh is shown in Figure 6a, while in Figure 6b,c, the corresponding pictures of the diffraction image and the reconstructed image are shown, respectively. Since the diffraction image was obtained using the full XUV spectrum without any spectral filtering, there is no safe way to accurately calculate the characteristic dimension of the mesh from the reconstructed image. However, considering the optical geometry layout and using an average XUV wavelength of 50 nm, the characteristic dimension of the mesh was calculated close to the value given by the manufacturer.

3. Results

Here, some benchmark results demonstrating the capabilities for CDI of our system are presented. The object used for the CDI studies was a hole drilled by our tightly focused laser beam on a 13 μ m thin aluminum foil. It was selected among a series of objects, imaged by a scanning electron microscope, based on (i) the sharpness of its edges and (ii) its contour details to be less than 1 μ m. In Figure 7a, colorred a SEM image of the object is shown.
The object was illuminated by the XUV beam just before its focus in order to cover as large area as possible of the object. Since the ROC of the spherical multilayer mirror is 1000 mm, this choice was not expected to affect the XUV phase front. Our automated system allowed the acquisition of a series of CDI images by moving the object in the plane perpendicular to the k-vector of the XUV beam. In Figure 7c,e, the CDI images for the wavelengths of 47.6 nm and 32.2 nm, respectively, are shown. These CDI images were selected in order to demonstrate the imaging capabilities of sub-micrometer details. In Figure 7b, the ideal calculated CDI image of the object is shown. Comparing the experimental CDI images for these two wavelengths, it is clearly shown that the smaller the wavelength, the finer the details of interference modulation in the k-space of the CDI image are, as expected.
In Figure 7d,f, the images in real space are shown, for the wavelengths of 47.6 nm and 32.2 nm, respectively, as calculated using the reconstruction algorithm presented in Appendix B. From these images, it is evident that using the shorter wavelength, the reconstructed image has a higher resolution, resolving the details with a higher number of pixels. Moreover, the reconstructed image size of the object is ∼1.5-times larger for the wavelength of 32.2 nm as compared to 47.6 nm, reflecting the inverse ratio of the wavelengths.

4. Discussion

Multispectral imaging in the visible part of the EM spectrum and longer wavelengths up to thermal infrared is a well-established technique. Wavelength filtering is performed using special filters, combined with suitable detectors, which are sensitive to particular wavelengths. The visible part of the EM spectrum is used for imaging of atmospheric pollutants, water, vegetation, soil, and biological tissues. The IR part is used for imaging of forest fires, geological features, clays, mapping terrain, and night studies.
The current advances in nanotechnology require the development of multispectral imaging systems, using wavelengths in the XUV and soft-X-ray region. Therefore, the existing multispectral imaging technology must be extended to such small wavelengths. Towards this, our approach in this work, based on HHG, offers a comb of coherent XUV wavelengths, which can be preferentially filtered in an automated way, without altering their optical spatiotemporal characteristics. We presented an automated system for ultrafast multispectral CDI, demonstrating its capabilities at two different XUV wavelengths, namely 32.2 nm and 47.6 nm. Our results clearly show that the imaging capabilities and the structural details that can be resolved depend on the wavelength in use.
Our table-top multispectral CDI system can support a larger number of XUV wavelengths by adding more pairs of multilayer XUV mirrors. These pairs can be placed in the same platform, automatically set to the different pair positions, thus selecting the desired wavelength without altering the XUV beam path towards the object. The use of a semi-infinite gas cell for the high-harmonic XUV generation, aside from the excellent stability of the HHG conditions that it offers, can support laser systems with MHz repetition rates, which are commercially available, providing laser pulse intensities appropriate for HHG. Such high repetition rates are highly desirable in, for example, 3D tomographic imaging due to the large number of images required.
While in our work, the shortest wavelength in use was 32.2 nm, future prospects of coherent XUV multispectral CDI will be its extension in the soft-X-ray spectral region utilizing appropriate phase-matching conditions [43,44]. Using such small wavelengths will allow assessing unexplored areas of science, such as imaging of chemicals at their absorption edges, combined with fs time-resolved measurements.

Author Contributions

Conceptualization, N.A.P., M.B., C.B. and E.P.; methodology, N.A.P., E.P.B., S.P., A.S., D.Z. and N.K.; data collection, S.P., A.S., A.G., Y.O., G.A., D.L., D.Z. and N.A.P.; software, S.P., A.S., Y.O., D.Z., N.K. and A.T.; validation, N.A.P., E.P.B., M.T., V.D., E.P. and C.B.; resources, N.A.P., M.T., E.P. and C.B.; data curation, S.P., A.S., M.B., E.P.B. and N.A.P.; writing, original draft preparation, E.P.B. and N.A.P.; review and editing, E.P.B., N.A.P., M.B., S.P., M.T., V.D., E.P., N.K. and C.B.; supervision, N.A.P.; project administration, M.B., N.A.P., M.T., C.B., E.P., N.K. and V.D.; funding acquisition, N.A.P., C.B. and E.P. All authors have read and agreed to the published version of the manuscript.

Funding

This research was co-financed by the European Regional Development Fund of the European Union and Greek national funds through the Operational Program Competitiveness, Entrepreneurship and Innovation, under the call RESEARCH—CREATE—INNOVATE (project code: T1EDK-04549, project title: Development of a coherent X-ray multispectral microscopy system).

Institutional Review Board Statement

Not applicable.

Informed Consent Statement

Not applicable.

Data Availability Statement

The data that support the findings of this study are available from the corresponding authors upon reasonable request.

Acknowledgments

We would like to thank Aleka Manousaki at FORTH-IESL for providing us with the SEM images of the object used in the CDI studies.

Conflicts of Interest

The authors declare no conflict of interest.

Appendix A

Figure A1. (Top) The software interface for controlling all the optomechanical components installed inside the vacuum Stages C and D of the setup. (Bottom) Schematic of the multi-axis control electronic block diagram.
Applsci 12 10592 g0a1

Appendix B

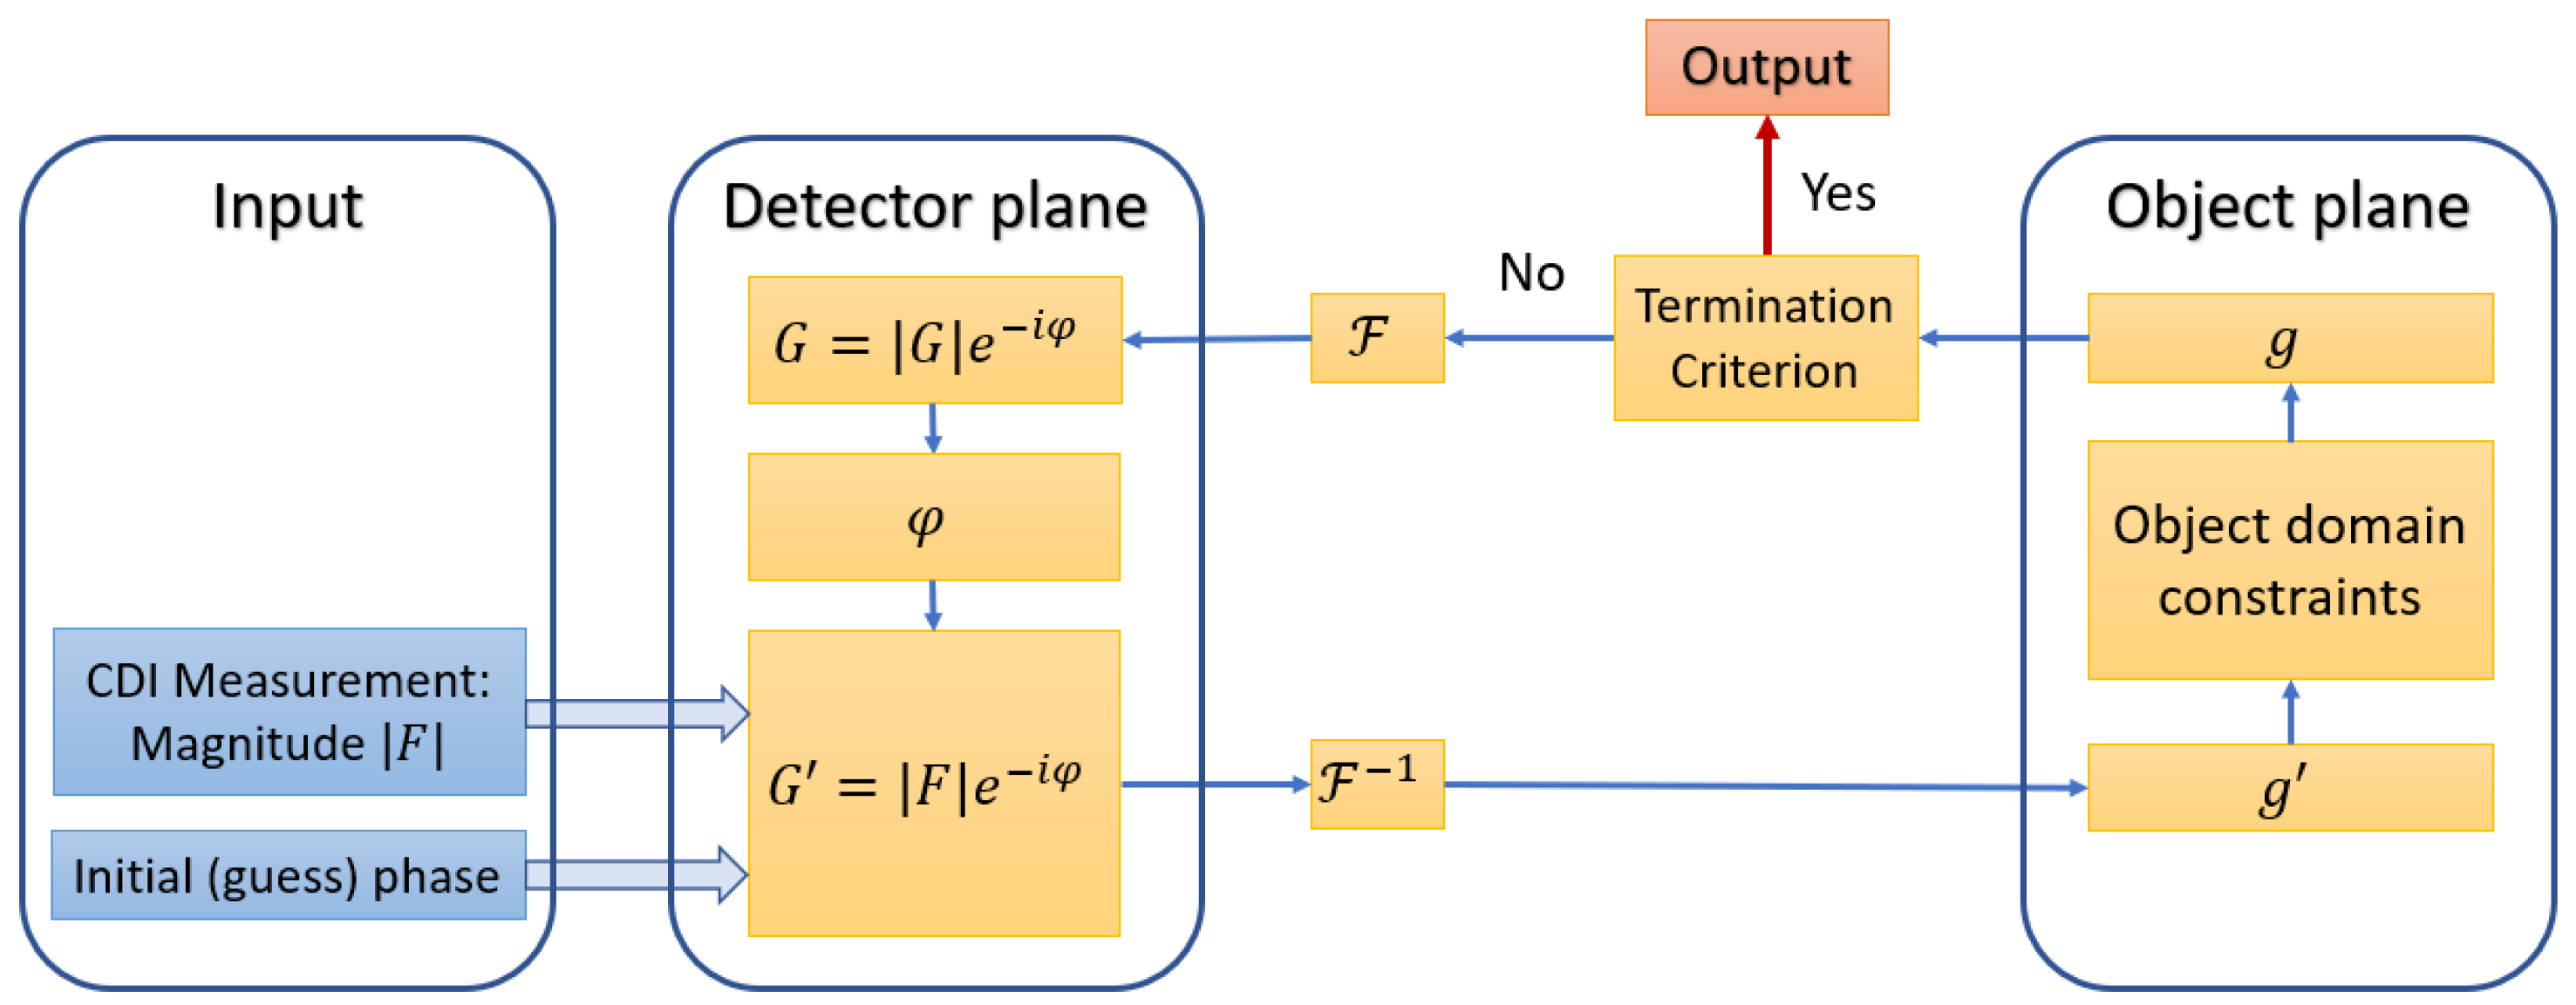
The CDI reconstruction analysis was based on three similar algorithms, each of them refining the CDI details at a different level. All three algorithms follow the work flow diagram presented in Figure A2. Initially, the magnitude | F | is obtained from the experimental CDI picture as the square root of the signal intensity for each pixel. Additionally, a starting guess for the phase of each pixel is given, along with | F | , as an input to the algorithm, thus forming the diffraction function G = | F | e i φ in inverse space at the detector plane. Then, by applying an inverse Fourier transformation, F 1 , the object density distribution function, g , is obtained in real space at the object plane. In the next step, certain geometrical and methodological constraints, which depend on the algorithm in use, are applied, thus resulting in a new object density distribution function, g, at the object plane. The latter is then subject to a Fourier transformation, F , resulting in a new diffraction function, G = | G | e i φ , in inverse space at the detector plane. The retrieved phase, φ , from this function, G, is inserted into the initial diffraction function G = | F | e i φ , which has the experimentally measured magnitude | F | as the input, thus initiating the next iteration step. The calculation is repeated for a predetermined iteration number of steps, which result in the final reconstructed image of the object.
Figure A2. CDI reconstruction algorithm flow diagram.
Applsci 12 10592 g0a2
As a first step, a support area at the object domain, S ( x , y ) , is defined as follows: Initially, a Gaussian filter with a unity amplitude and standard deviation σ is applied to g . Then, by defining a threshold value θ , the value at the ( x , y ) point of the support area S ( x , y ) is set to zero or one for the g filtered values below or above the threshold value of θ , respectively, i.e.,
S ( x , y ) = 1 g ( x , y ) θ 0 g ( x , y ) < θ .
The three similar algorithms used in this study, namely the error reduction (ER), hybrid input–output (HIO), and shrink–wrap (SW), differ by the object domain constraints applied. Specifically, the object domain constraint for ER is [12]
g k + 1 ( x , y ) = g k ( x , y ) ( x , y ) S & g k ( x , y ) 0 0 ( x , y ) S or g k ( x , y ) < 0 ,
while for HIO, it is [12]
g k + 1 ( x , y ) = g k ( x , y ) ( x , y ) S & g k ( x , y ) 0 g k ( x , y ) β g k ( x , y ) ( x , y ) S or g k ( x , y ) < 0 ,
where k is the k-th iteration. The definition of the SW algorithm is identical to HIO, except that, in SW, the support area S is updated after a certain number of iterations. This is performed by applying a Gaussian filter with smaller σ , so that the object support S approaches the shape of the object distribution [13].
The reconstruction process initiates using the SW algorithm with a starting value of σ = 7.5 , reduced to σ = 0.8 during 120,000 iterations, while changing the support S every 20 iterations. The values of θ and β were empirically set to 0.15 and 0.9, respectively, in accordance with the values from the literature [26]. Finally, using the ER algorithm, 200 additional iterations were applied to obtain the final result [45].

References

  1. Corkum, P.B. Plasma perspective on strong field multiphoton ionization. Phys. Rev. Lett. 1993, 71, 1994–1997. [Google Scholar] [CrossRef] [PubMed] [Green Version]
  2. Lewenstein, M.; Balcou, P.; Ivanov, M.Y.; L’Huillier, A.; Corkum, P.B. Theory of high-harmonic generation by low-frequency laser fields. Phys. Rev. A 1994, 49, 2117–2132. [Google Scholar] [CrossRef] [PubMed]
  3. Salières, P.; L’Huillier, A.; Lewenstein, M. Coherence Control of High-Order Harmonics. Phys. Rev. Lett. 1995, 74, 3776–3779. [Google Scholar] [CrossRef] [Green Version]
  4. Sandberg, R.L.; Paul, A.; Raymondson, D.A.; Hädrich, S.; Gaudiosi, D.M.; Holtsnider, J.; Tobey, R.I.; Cohen, O.; Murnane, M.M.; Kapteyn, H.C.; et al. Lensless Diffractive Imaging Using Tabletop Coherent High-Harmonic Soft-X-Ray Beams. Phys. Rev. Lett. 2007, 99, 098103. [Google Scholar] [CrossRef] [Green Version]
  5. Zurch, M.; Rothhardt, J.; Hadrich, S.; Demmler, S.; Krebs, M.; Limpert, J.; Tunnermann, A.; Guggenmos, A.; Kleineberg, U.; Spielmann, C. Real-time and Sub-wavelength Ultrafast Coherent Diffraction Imaging in the Extreme Ultraviolet. Sci. Rep. 2014, 4, 7356. [Google Scholar] [CrossRef] [Green Version]
  6. Miao, J.; Ishikawa, T.; Robinson, I.K.; Murnane, M.M. Beyond crystallography: Diffractive imaging using coherent x-ray light sources. Science 2015, 348, 530–535. [Google Scholar] [CrossRef] [Green Version]
  7. Gardner, D.F.; Tanksalvala, M.; Shanblatt, E.R.; Zhang, X.; Galloway, B.R.; Porter, C.L.; Karl, R., Jr.; Bevis, C.; Adams, D.E.; Kapteyn, H.C.; et al. Subwavelength coherent imaging of periodic samples using a 13.5 nm tabletop high-harmonic light source. Nat. Photonics 2017, 11, 259–263. [Google Scholar] [CrossRef]
  8. Roscam Abbing, S.; Campi, F.; Sajjadian, F.S.; Lin, N.; Smorenburg, P.; Kraus, P.M. Divergence Control of High-Harmonic Generation. Phys. Rev. Appl. 2020, 13, 054029. [Google Scholar] [CrossRef]
  9. Miao, J.; Charalambous, P.; Kirz, J.; Sayre, D. Extending the methodology of X-ray crystallography to allow imaging of micrometre-sized non-crystalline specimens. Nature 1999, 400, 342–344. [Google Scholar] [CrossRef]
  10. Miao, J.; Sayre, D.; Chapman, H. Phase retrieval from the magnitude of the Fourier transforms of nonperiodic objects. J. Opt. Soc. Am. A 1998, 15, 1662–1669. [Google Scholar] [CrossRef]
  11. Fienup, J.R. Reconstruction of an object from the modulus of its Fourier transform. Opt. Lett. 1978, 3, 27–29. [Google Scholar] [CrossRef] [PubMed] [Green Version]
  12. Fienup, J.R. Phase retrieval algorithms: A comparison. Appl. Opt. 1982, 21, 2758–2769. [Google Scholar] [CrossRef] [PubMed] [Green Version]
  13. Marchesini, S.; He, H.; Chapman, H.N.; Hau-Riege, S.P.; Noy, A.; Howells, M.R.; Weierstall, U.; Spence, J.C. X-ray image reconstruction from a diffraction pattern alone. Phys. Rev. B 2003, 68, 140101. [Google Scholar] [CrossRef] [Green Version]
  14. Fienup, J.R. Phase retrieval algorithms: A personal tour. Appl. Opt. 2013, 52, 45–56. [Google Scholar] [CrossRef] [Green Version]
  15. Seaberg, M.D.; Zhang, B.; Gardner, D.F.; Shanblatt, E.R.; Murnane, M.M.; Kapteyn, H.C.; Adams, D.E. Tabletop nanometer extreme ultraviolet imaging in an extended reflection mode using coherent Fresnel ptychography. Optica 2014, 1, 39–44. [Google Scholar] [CrossRef] [Green Version]
  16. Zhang, B.; Gardner, D.F.; Seaberg, M.D.; Shanblatt, E.R.; Kapteyn, H.C.; Murnane, M.M.; Adams, D.E. High contrast 3D imaging of surfaces near the wavelength limit using tabletop EUV ptychography. Ultramicroscopy 2015, 158, 98–104. [Google Scholar] [CrossRef] [Green Version]
  17. Tadesse, G.K.; Eschen, W.; Klas, R.; Tschernajew, M.; Tuitje, F.; Steinert, M.; Zilk, M.; Schuster, V.; Zürch, M.; Pertsch, T.; et al. Wavelength-scale ptychographic coherent diffractive imaging using a high-order harmonic source. Sci. Rep. 2019, 9, 1735. [Google Scholar] [CrossRef] [Green Version]
  18. Tanksalvala, M.; Porter, C.L.; Esashi, Y.; Wang, B.; Jenkins, N.W.; Zhang, Z.; Miley, G.P.; Knobloch, J.L.; McBennett, B.; Horiguchi, N.; et al. Nondestructive, high-resolution, chemically specific 3D nanostructure characterization using phase-sensitive EUV imaging reflectometry. Sci. Adv. 2021, 7, eabd9667. [Google Scholar] [CrossRef]
  19. Loetgering, L.; Witte, S.; Rothhardt, J. Advances in laboratory-scale ptychography using high harmonic sources. Opt. Express 2022, 30, 4133–4164. [Google Scholar] [CrossRef]
  20. Kneip, S.; McGuffey, C.; Martins, J.L.; Martins, S.; Bellei, C.; Chvykov, V.; Dollar, F.; Fonseca, R.; Huntington, C.; Kalintchenko, G.; et al. Bright spatially coherent synchrotron X-rays from a table-top source. Nat. Phys. 2010, 6, 980–983. [Google Scholar] [CrossRef]
  21. Geloni, G.; Saldin, E.; Samoylova, L.; Schneidmiller, E.; Sinn, H.; Tschentscher, T.; Yurkov, M. Coherence properties of the European XFEL. New J. Phys. 2010, 12, 035021. [Google Scholar] [CrossRef]
  22. Sandberg, R.L.; Song, C.; Wachulak, P.W.; Raymondson, D.A.; Paul, A.; Amirbekian, B.; Lee, E.; Sakdinawat, A.E.; La-O-Vorakiat, C.; Marconi, M.C.; et al. High numerical aperture tabletop soft x-ray diffraction microscopy with 70-nm resolution. Proc. Natl. Acad. Sci. USA 2008, 105, 24–27. [Google Scholar] [CrossRef] [PubMed] [Green Version]
  23. Raymondson, D.A.; Sandberg, R.L.; Schlotter, W.F.; Raines, K.S.; La-o Vorakiat, C.; Townsend, E.; Sakdinawat, A.; Paul, A.; Miao, J.; Murnane, M.M.; et al. Tabletop coherent diffractive microscopy with extreme ultraviolet light from high harmonic generation. In Proceedings of the Metrology, Inspection, and Process Control for Microlithography XXIII, SPIE, San Jose, CA, USA, 22–27 February 2009; Volume 7272, pp. 126–133. [Google Scholar] [CrossRef]
  24. Ravasio, A.; Gauthier, D.; Maia, F.; Billon, M.; Caumes, J.; Garzella, D.; Géléoc, M.; Gobert, O.; Hergott, J.F.; Pena, A.; et al. Single-shot diffractive imaging with a table-top femtosecond soft x-ray laser-harmonics source. Phys. Rev. Lett. 2009, 103, 028104. [Google Scholar] [CrossRef] [PubMed]
  25. Dinh, K.B.; Ong, A.X.; Le, H.V.; Henderson, C.A.; Van Vuong, C.; Hannaford, P.; Smith, T.A.; Van Dao, L. Coherent diffractive imaging of single layer microspheres. J. Appl. Phys. 2015, 117, 163102. [Google Scholar] [CrossRef]
  26. Truong, N.X.; Strashnov, I.; Whittaker, E.; Zhong, X.L.; Denecke, M.A. Coherent diffractive imaging of graphite nanoparticles using a tabletop EUV source. Phys. Chem. Chem. Phys. 2017, 19, 29660–29668. [Google Scholar] [CrossRef]
  27. Eschen, W.; Loetgering, L.; Schuster, V.; Klas, R.; Kirsche, A.; Berthold, L.; Steinert, M.; Pertsch, T.; Gross, H.; Krause, M.; et al. Material-specific high-resolution table-top extreme ultraviolet microscopy. Light. Sci. Appl. 2022, 11, 117. [Google Scholar] [CrossRef]
  28. Gauthier, D.; Guizar-Sicairos, M.; Ge, X.; Boutu, W.; Carré, B.; Fienup, J.; Merdji, H. Single-shot femtosecond X-ray holography using extended references. Phys. Rev. Lett. 2010, 105, 093901. [Google Scholar] [CrossRef]
  29. Rothhardt, J.; Tadesse, G.K.; Eschen, W.; Limpert, J. Table-top nanoscale coherent imaging with XUV light. J. Opt. 2018, 20, 113001. [Google Scholar] [CrossRef]
  30. Tadesse, G.K.; Klas, R.; Demmler, S.; Hädrich, S.; Wahyutama, I.; Steinert, M.; Spielmann, C.; Zürch, M.; Pertsch, T.; Tünnermann, A.; et al. High speed and high resolution table-top nanoscale imaging. Opt. Lett. 2016, 41, 5170–5173. [Google Scholar] [CrossRef]
  31. Papadogiannis, N.; Kalpouzos, C.; Goulielmakis, E.; Nersisyan, G.; Charalambidis, D.; Auge, F.; Weihe, F.; Balcou, P. Kilohertz extreme-ultraviolet light source based on femtosecond high-order harmonic generation from noble gases. Appl. Phys. B 2001, 73, 687–692. [Google Scholar] [CrossRef]
  32. Balas, C.; Epitropou, G.; Pappas, C. Multi/Hyper-Spectral Imaging. In Handbook of Biomedical Optics; CRC Press: Boca Raton, FL, USA, 2011. [Google Scholar]
  33. Balas, C.; Epitropou, G.; Tsapras, A.; Hadjinicolaou, N. Hyperspectral Imaging and Spectral Classification for Pigment Identification and Mapping in Paintings by El Greco and his Workshop. In Multimedia Tools and Applications; Springer: Berlin/Heidelberg, Germany, 2018; pp. 1–17. [Google Scholar]
  34. Boldrini, B.; Kessler, W.; Rebner, K.; Kessler, R.W. Hyperspectral Imaging: A Review of Best Practice, Performance and Pitfalls for in-line and on-line Applications. J. Infrared Spectrosc. 2012, 20, 483–508. [Google Scholar] [CrossRef]
  35. Dong, X.; Jakobi, M.; Wang, S.; Köhler, M.H.; Zhang, X.; Koch, A.W. A review of hyperspectral imaging for nanoscale materials research. Appl. Spectrosc. Rev. 2019, 54, 285–305. [Google Scholar] [CrossRef]
  36. Clark, E.L.; Grigoriadis, A.; Petrakis, S.; Tazes, I.; Andrianaki, G.; Skoulakis, A.; Orphanos, Y.; Kaselouris, E.; Fitilis, I.; Chatzakis, J.; et al. High-intensity laser-driven secondary radiation sources using the ZEUS 45 TW laser system at the Institute of Plasma Physics and Lasers of the Hellenic Mediterranean University Research Centre. High Power Laser Sci. Eng. 2021, 9, e53. [Google Scholar] [CrossRef]
  37. Kazamias, S.; Weihe, F.; Douillet, D.; Valentin, C.; Planchon, T.; Sebban, S.; Grillon, G.; Auge, F.; Hulin, D.; Balcou, P. High order harmonic generation optimization with an apertured laser beam. Eur. Phys. J. D 2002, 21, 353–359. [Google Scholar] [CrossRef]
  38. Lee, D.G.; Kim, J.H.; Hong, K.H.; Nam, C.H. Coherent Control of High-Order Harmonics with Chirped Femtosecond Laser Pulses. Phys. Rev. Lett. 2001, 87, 243902. [Google Scholar] [CrossRef] [Green Version]
  39. Kim, J.H.; Nam, C.H. Plasma-induced frequency chirp of intense femtosecond lasers and its role in shaping high-order harmonic spectral lines. Phys. Rev. A 2002, 65, 033801. [Google Scholar] [CrossRef] [Green Version]
  40. Carlström, S.; Preclíková, J.; Lorek, E.; Larsen, E.W.; Heyl, C.M.; Paleček, D.; Zigmantas, D.; Schafer, K.J.; Gaarde, M.B.; Mauritsson, J. Spatially and spectrally resolved quantum path interference with chirped driving pulses. New J. Phys. 2016, 18, 123032. [Google Scholar] [CrossRef]
  41. Petrakis, S.; Bakarezos, M.; Tatarakis, M.; Benis, E.P.; Papadogiannis, N.A. Electron quantum path control in high harmonic generation via chirp variation of strong laser pulses. Sci. Rep. 2021, 11, 23882. [Google Scholar] [CrossRef] [PubMed]
  42. Petrakis, S.; Bakarezos, M.; Tatarakis, M.; Benis, E.P.; Papadogiannis, N.A. Spectral and Divergence Characteristics of Plateau High-Order Harmonics Generated by Femtosecond Chirped Laser Pulses in a Semi-Infinite Gas Cell. Atoms 2022, 10, 53. [Google Scholar] [CrossRef]
  43. Willner, A.; Tavella, F.; Yeung, M.; Dzelzainis, T.; Kamperidis, C.; Bakarezos, M.; Adams, D.; Schulz, M.; Riedel, R.; Hoffmann, M.C.; et al. Coherent Control of High Harmonic Generation via Dual-Gas Multijet Arrays. Phys. Rev. Lett. 2011, 107, 175002. [Google Scholar] [CrossRef] [Green Version]
  44. Willner, A.; Tavella, F.; Yeung, M.; Dzelzainis, T.; Kamperidis, C.; Bakarezos, M.; Adams, D.; Riedel, R.; Schulz, M.; Hoffmann, M.C.; et al. Efficient control of quantum paths via dual-gas high harmonic generation. New J. Phys. 2011, 13, 113001. [Google Scholar] [CrossRef] [Green Version]
  45. Fienup, J.R.; Wackerman, C.C. Phase-retrieval stagnation problems and solutions. J. Opt. Soc. Am. A 1986, 3, 1897–1907. [Google Scholar] [CrossRef]
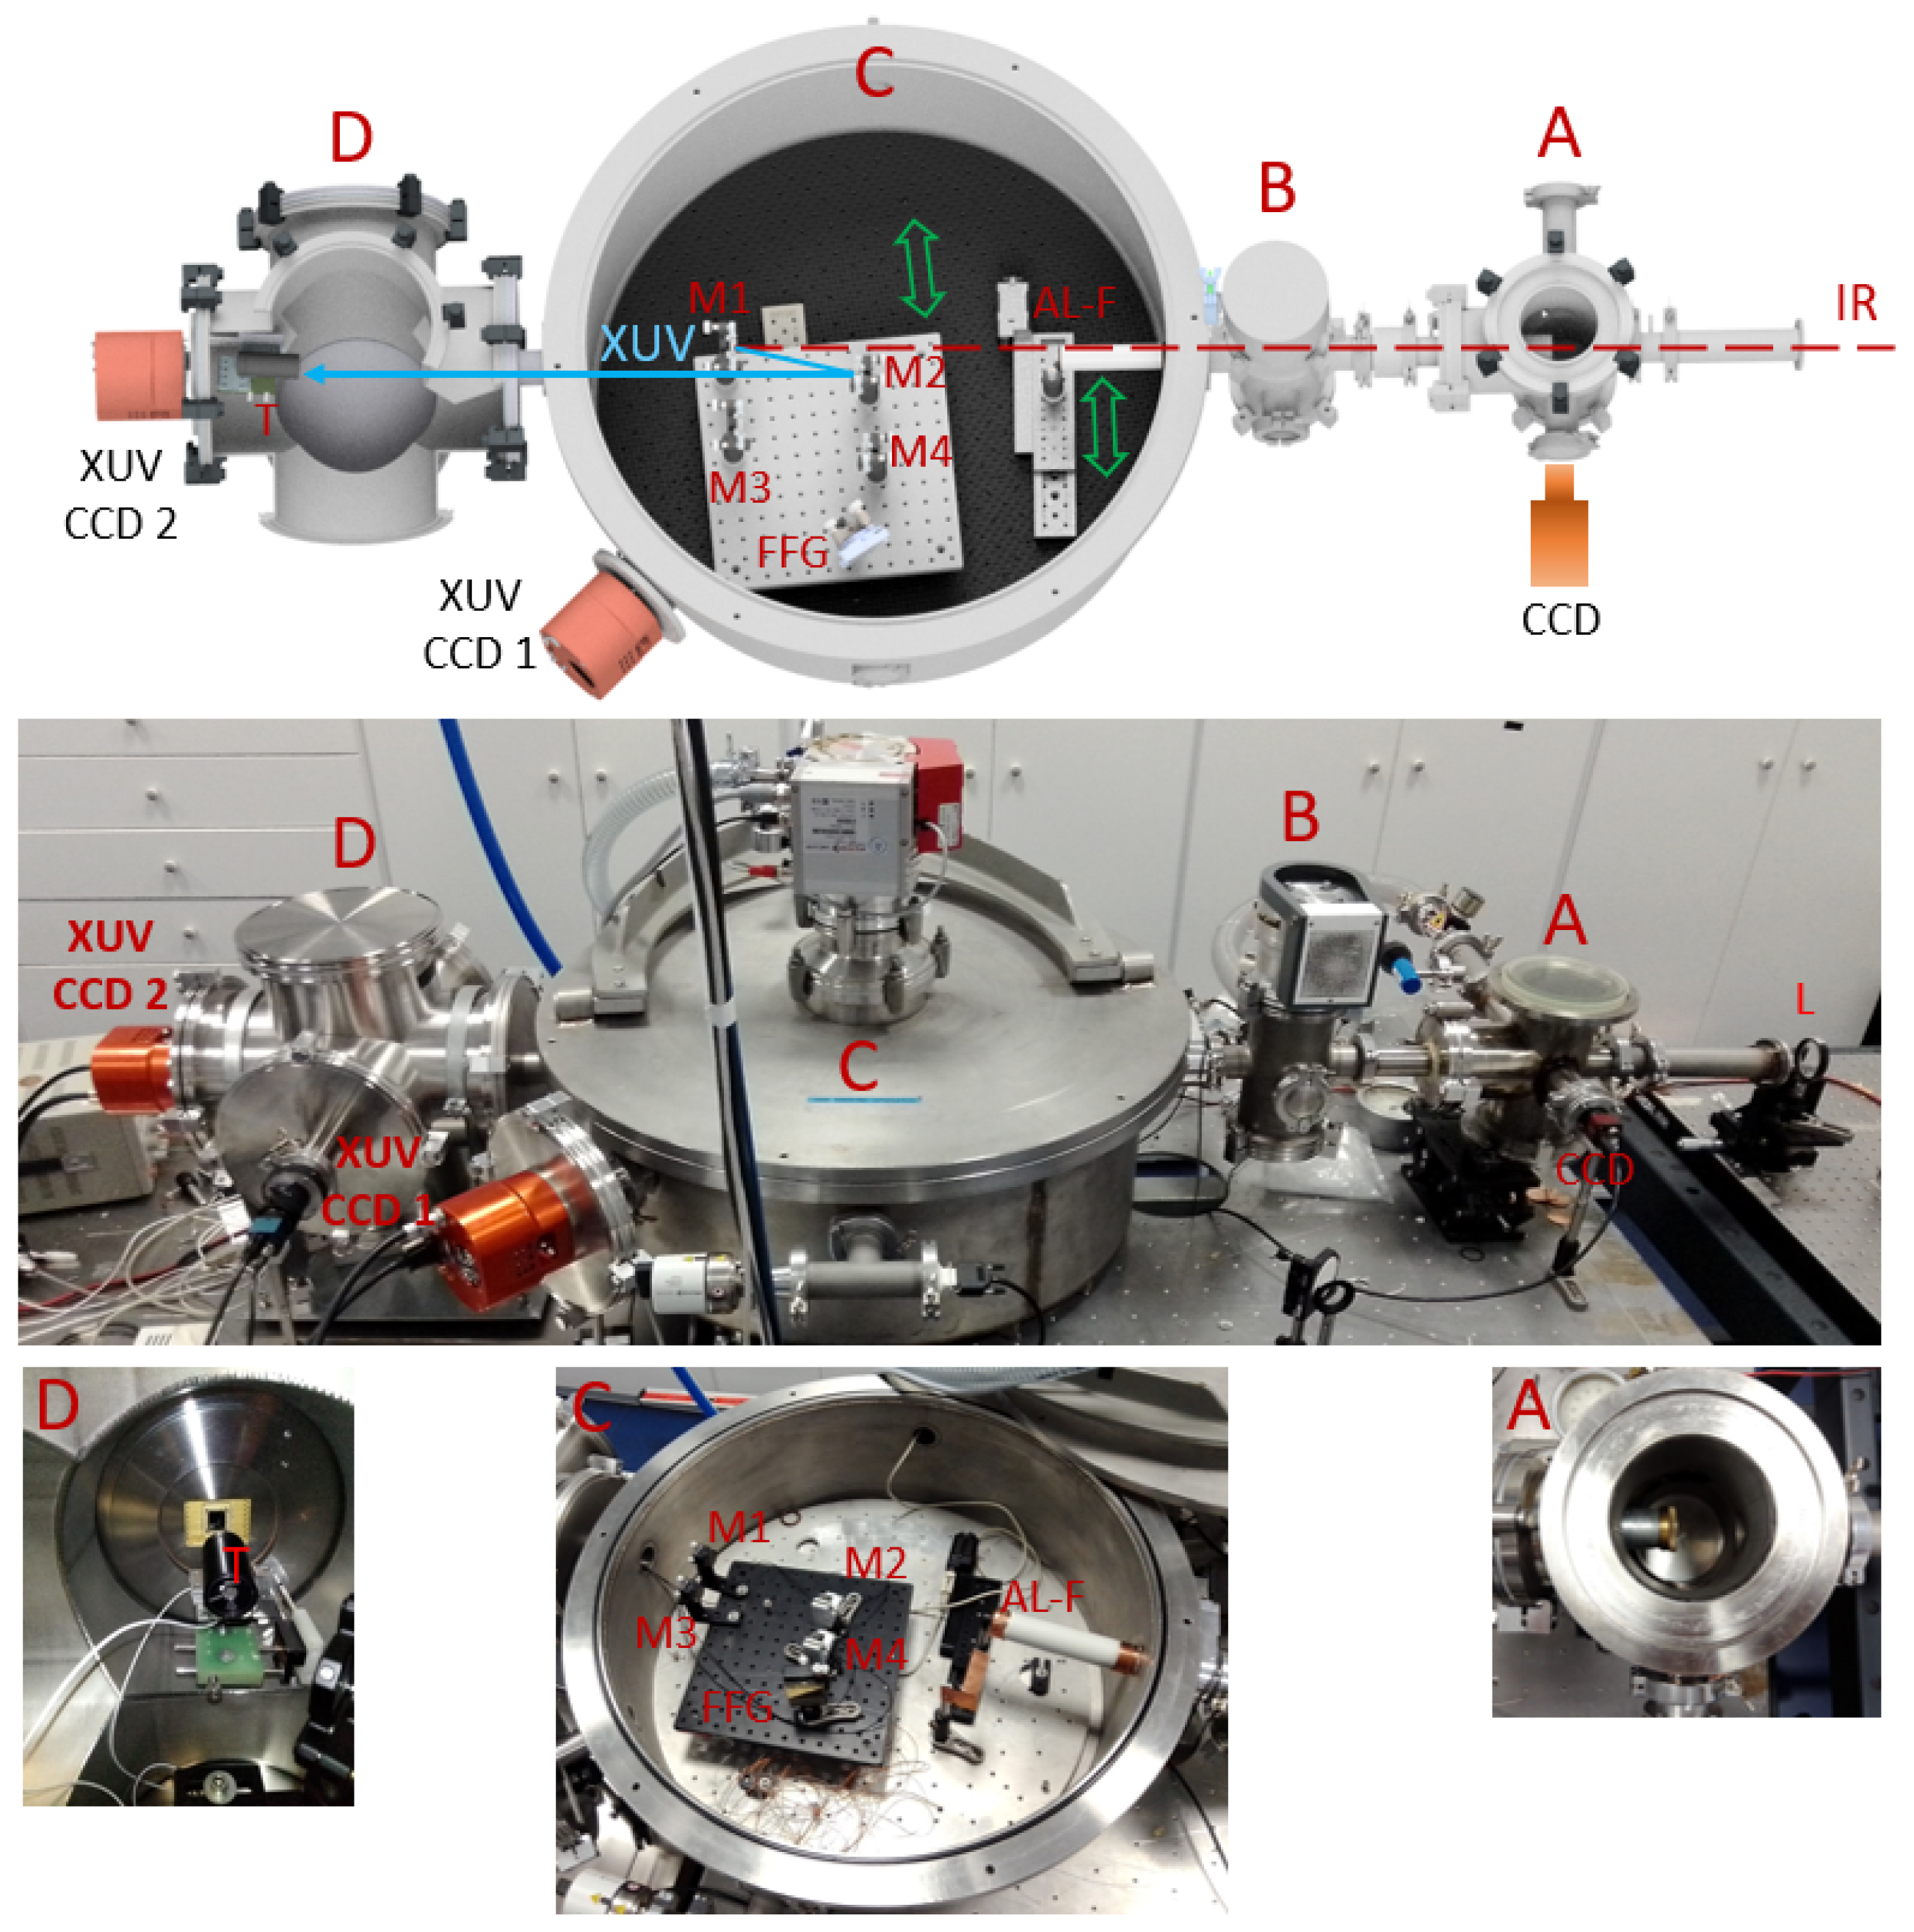
Figure 1. The XUV CDI experimental setup shown in a CAD design (top) and in the IPPL laboratory with zoom pictures for the stages of A, C, and D (middle and bottom). A: The first stage hosting the semi-infinite gas cell. B: The second stage hosting the differentially pumped region. C: The third stage hosting the XUV filtering, diagnostics, and wavelength selection. D: The fourth stage hosting the target and the recording of the CDI result. L: lens. AL-F: aluminum filter. M1, M3: flat multilayer mirrors. M2, M4: spherical concave multilayer mirrors. FFG: flat field grating. T: target.
Applsci 12 10592 g001
Figure 2. Laser beam diameter and laser focus position study. (a) HHG spectra obtained for various laser beam diameters and corresponding energies. (be) Indicative laser focus position study with respect to the exit pinhole of the semi-infinite gas cell: (b) −1 mm, (c) 0 mm, (d) 1 mm, and (e) 2 mm.
Applsci 12 10592 g002
Figure 3. XUV spectra obtained for the Ar, Kr, and Xe HHG gases. All spectra were obtained at pressures of 70 Torr and identical laser focusing conditions. Dashed lines indicate the wavelengths of interest, corresponding to the two pairs of multilayer mirrors’ reflection narrowband regions.
Applsci 12 10592 g003
Figure 4. XUV harmonic spectral images measured for various laser pulse durations and Ar gas pressures. The negative/positive signs of the laser pulse durations correspond to the negative/positive chirp, respectively. The nominal spectral locations of the harmonics order, estimated by ray-tracing calculations, are noted at the bottom of the XUV spectral images.
Applsci 12 10592 g004
Figure 5. Overall transmission spectra of the generated XUV radiation obtained for both pairs of multilayer mirrors. (a) Pair for 32.2 nm. (b) Pair for 47.6 nm. The peaks at ∼65 nm in (a) and ∼95 nm in (b) correspond to the second order of diffraction.
Applsci 12 10592 g005
Figure 6. XUV radiation overall coherence measurements. (a) The 70 lines per inch copper mesh. (b) The diffraction image obtained after illuminating the copper mesh with the full XUV spectrum. (c) Reconstructed image of the copper mesh. Axes in (b,c) are in pixels.
Applsci 12 10592 g006
Figure 7. (a) The object under ultrafast CDI study. (b) The ideal CDI result corresponding to the object shown in (a). (c) CDI result for the object shown in (a) using the central wavelength of 47.6 nm. (d) Reconstruction of the object shown in (a) using the CDI result of (c). (f) CDI result for the object shown in (a) using the central wavelength of 32.2 nm. (f) Reconstruction of the object shown in (a) using the CDI result of (e). The white contour shown in (d,f) corresponds to the shape of the object shown in (a) and was placed to guide the eye. The image size of (bf) is 512 × 512 pixels.
Applsci 12 10592 g007
Publisher’s Note: MDPI stays neutral with regard to jurisdictional claims in published maps and institutional affiliations.