Article

Current State of the Gold Mining Waste from the Ores of the Ursk Deposit (Western Siberia, Russia)

Laboratory of Ecology-Economic Modelling of the Technogenic Systems, Trofimuk Institute of Petroleum Geology and Geophysics SB RAS, 630090 Novosibirsk, Russia
*
Author to whom correspondence should be addressed.
Appl. Sci. 2022, 12(20), 10610; https://doi.org/10.3390/app122010610
Submission received: 14 September 2022 / Revised: 12 October 2022 / Accepted: 17 October 2022 / Published: 20 October 2022
(This article belongs to the Section Earth Sciences)

Abstract

:
The article presents the original results of the investigation of sulfide-bearing mine tailings dumps (Ursk, Western Siberia, Russia), the adjacent territory, and acid mine drainage flows. The novelty of this study is related to integration of geophysical and geochemical data. The geoelectrical structure of the dump and the drainage valley was determined using the electrical resistivity tomography (ERT) method. Magnetic anomalies above the surface of the site were identified using ground magnetic surveys. The orthophotomap and a digital elevation model were obtained on the basis of aerial photography from an unmanned aircraft. The model of thermal imaging allows us to identify a number of temperature anomalies in the upper part of the dump slope and filtration zone in the drainage valley, caused by exothermic reactions. The digital relief model was constructed comprising three zones: (1) oxidation, (2) leaching, and (3) mixing and dilution. The oxidation zone is marked by low electrical resistivity (1–10 Ω·m), low pH values of the drainage waters (pH 3.61), low values of the modulus of the magnetic induction vector, and heating by +5 °C compared to the solid dump material that is not actively exposed to water. The oxidative conditions and low pH values favor the dilution of the Fe2+ compounds in the drainage solutions, which also contain Cu (3000 μg/L), Pb (1200 μg/L), As (1300 μg/L), and Hg (34 μg/L). The zone of the primary geochemical barrier is formed within the first 400 m, where the major proportion of dissolved elements if deposited. The second iron–aluminum sorption geochemical barrier is formed at a distance of 1000 m at the mixing zone with the Ur River. The stable geochemistry of surface waters, formed due to the inflow of drainage waters into the Ur River and further into the reservoir, persists at a distance of up to 7.7 km from the dump.

1. Introduction

Sulfide-containing mine tailings are a potential source of acid mine drainage (AMD) [1,2,3,4] and gas emanations [5,6]. Of particular interest are seasonal variations in the structure and composition of technogenic systems depending on environmental parameters in regions with a continental climate characterized by cold, long winters and short, warm summers. Frozen soils are a complex multiphase system, which, due to the inconstancy of temperature and pressure, are characterized by varying dynamics. At temperatures below 0 °C, there are sudden peaks in the electric potential at the pore water–ice interface, and the rates of some chemical reactions increase [6,7,8]. The most intense geochemical transformations are observed in the layer of seasonal temperature fluctuations, in which chemical leaching is activated, associated with rock cracking under the influence of expanding and freezing pore fluid [9]. Changes in natural conditions primarily concern surface watercourses near dumps. Sulfide-containing waste is oxidized due to oxygen in the air and water; acidic sulfate flows are formed with total dissolved solids up to 10 g/L and high concentrations of a wide range of chemical elements: metals (Cu, Zn, Cd, Pb, Fe, and Be) and metalloids (As, Sb, and Se). In the areas adjacent to sulfide-containing dumps, landscape changes occur: acid erosion of soils, formation of cracks and gouges due to long-term impact of aggressive drainage, “burned out” roots of trees, and destroyed vegetation. Mechanical demolition of tailings along the slope occurs, and a taper is formed, in which water-saturated, dense acidic sands are located. Furthermore, a water stop is formed, due to which flows spread laterally, and, over time, technogenic changes cover more territories. It is also known that mine tailings exercise a thawing effect on the underlying soils and cause the formation of positive temperature anomalies [9], which, in the long term, leads to the degradation of permafrost rocks [10] and creates many problems (for example, the loss of the bearing capacity of engineering structures in areas of high anthropogenic pressure) [11].
This study aims to provide a comprehensive assessment of the current state of the abandoned waste dumps of gold-bearing ore mining and processing (Ursk settlement, Kemerovo region), the drainage valley, and the surface watercourses exposed to technogenic impact.
An integrated approach is very promising for the study of such sites, since geochemical transformations of the mineral composition of waste can significantly affect the physical and chemical properties of soils and bedrock. For example, a set of methods is used to control the dumps of the ongoing production of Zn–Pb ores [12,13]. The results of geophysical surveys, including the electrical resistivity tomography (ERT) and magnetometry, are confirmed by geochemical surveys. The ERT method is widely used to study the hydrogeological dynamics of dumps [13,14,15,16]. Geophysical methods may be employed to trace the flooded areas and directions of water infiltration, as well as areas of pollution around the dump, including minerals redeposited by aeolian processes: authigenic or detrital. Many researchers emphasize the indispensability of geophysical methods for studying the internal structure of waste rock piles and migration of pollutants [17,18,19,20,21,22,23,24].
Ursk dump, located in the village Ursk of the Kemerovo region (54.45° N, 85.4° E) containing barite–pyrite bulk material from the oxidation zone of the Novo-Urskoe pyrite deposit after gold extraction by cyanidation, was formed in the 1930s (Figure 1 and Figure 2). A natural stream flows near its foot, becoming an acidic stream with high concentrations of dissolved metals.
The Novo-Urskoye barite–polymetallic deposit was discovered in 1932 as part of the Urskoye ore field, which unites the Novo-Urskoye, Beloklyuchevskoye, and Samoilovskoye deposits and a number of ore occurrences. Following the discovery, the exploitation of the Novo-Urskoe deposit oxidation zone for gold began. From the surface, it was represented by a typical iron hat with a high content of barite and gold. Oxidized ore bodies were mined up to a depth of 40–50 m. Hypogene ore almost entirely consisted of sulfides: pyrite, sphalerite, chalcopyrite, fahl ore, galena, arsenopyrite, bornite, covellite, and chalcocite, as well as a gangue mineralogy comprising quartz, sericite, barite, calcite, and gypsum. Only the upper oxidized part of the ore bodies was mined, including quartz–barite loose (the most oxidized part of the ore bodies) and quartz–pyrite loose (less oxidized), from which free gold was extracted by cyanidation. Wastes from processing were stored side by side in the floodplain of the stream in two bulk dumps without any protective technical structures or dams. As a result, piles with a height of 10–12 m were formed over time [6]. The quartz–pyrite loose dump has been largely reprocessed in the last decade for the secondary recovery of barite. The second pile originated from the waste of the oxidation zone and remained unchanged ever since. The authors of [26] identified the migration of gold with accumulation in a natural geochemical barrier peat in the drainage valley. The geophysical and geochemical study of the Ursk mine tailings area, which was performed in 2015, made it possible to determine two directions of migration of acid drainage. Surface runoff flows along the natural slope of the valley. In the vertical direction along the natural fault (Figure 1), drainage flows penetrate into ground and underground waters to a depth of more than 20 m [25]. The significance of this investigation is associated to the necessity of the actual information regarding the degree of acid weathering of Ursk mine tailings area and adjacent territory. The aim of this study is to reveal the vertical and lateral zoning of the Ursk mine tailings area in terms of electrophysical characteristics (electrical resistivity, magnetic susceptibility, and temperature) and chemical composition of surface streams: Ur River and Ursk reservoir, which are located 7.7 km from the dumps. The novelty of this investigation is related to implementation of remote sensing and modern nondestructive geophysical and classical hydrochemical methods for complex evaluation of the mine tailings area.

2. Materials and Methods

2.1. Field Work

2.1.1. Vertical Electrical Sounding

Geoelectric sections were built along 13 profiles crossing the dump and the drainage valley (Figure 3) using the method of electrical resistivity tomography (ERT). The step of measurements along the profiles was 5 m, the maximum length of the profiles was 355 m, and the distance between profiles was limited to 50 m. The measurements were carried out using the SKALA-48 K12 multielectrode electrical prospecting station, developed at the Laboratory of Electromagnetic Fields of the Institute of Petroleum Geology and Geophysics of the Siberian Branch of the Russian Academy of Sciences. During measurements, we used the sequence of connecting the electrodes, corresponding to the Schlumberger electrode system. Data processing was carried out using the programs Res2DInv and Res3DInv [27]. To define the altitude of the electrodes, a digital elevation model was used. In the drainage valley, one profile 14.1 m long with a distance of 30 cm between the electrodes was built to obtain a detailed vertical section 3 m deep. In zones with contrasting resistivity anomalies, two pits 1.5 m deep were dug and tested to compare the resistivity and the chemical composition of the substance. The samples were divided into three parts and packed in sealed plastic bags. One part of the sample was used for the determination of chemical composition, and the second was used to extract pore solutions in laboratory conditions. The extraction of water-soluble compounds was performed in the third part of the sample.

2.1.2. Magnetic Survey

The magnetic survey was performed along parallel profiles within the study area. The distance between the profiles was 25 m (Figure 4). Measurements of the modulus of the magnetic induction vector were carried out at a height of 1 m above the Earth’s surface using a Quantummag magnetometer with a recording frequency of 0.2 Hz; thus, the distance between the measurement points along each profile was 0.5–1 m, depending on the operator’s movement speed along the terrain. The variation of the geomagnetic field during the measurements was taken into account using data from the Novosibirsk Klyuchi magnetic observatory (NVS). Data binding to coordinates was carried out using the built-in GPS, due to the high data density along the profile in comparison with the distance between the profiles; during processing, the data were averaged in a scanning window of 25 m in size. The obtained data were interpolated to the measurement area.

2.1.3. Aerial Photography and Digital Elevation Model

To record the morphology of the terrain and build a digital elevation model (DEM) at the work site, a photogrammetric method of aerial photography was used, which was carried out using a Xiaomi Mi Drone UAV. A total of 134 photographs were obtained from a height of 120 m, with longitudinal and transverse overlap of at least 50% and 70%. In this case, the resolution of the photographs was 4000 × 3000 pixels. As DEM georeferencing points, landmarks with known absolute coordinates were used on the ground, determined using GLONASS/GPS satellite navigation. The total time for field work was about 3 h. After the field survey work, the measurement results were processed by the AgysoftMetashape software, during which the camera was automatically calibrated, provided in the software tools (calculation of the focal length, distortion model, etc.), and automatic recognition of digital images was carried out in order to search for common points of the terrain surface caught in the overlap of the longitudinal and transverse route of the UAV. Furthermore, on the basis of the recognized images, the orthomosaic and DEM were calculated using the phototriangulation method, taking into account the previously obtained calibration parameters. The binding of the final DEM was carried out according to the coordinates of several characteristic terrain objects, clearly distinguishable in the photograph, obtained using the Garmin Etrex10 GPS navigator in the absolute accumulation mode. The relative binding of the size of the obtained orthomosaic and DEM is made according to the distances between objects measured with a tape measure. The mean square error of reprojection was 1.07 pixels, and the maximum error was 25.8 pixels. The error in determining the distances from the orthophotomap, DEM, and control points of the marks was less than 20 cm.

2.1.4. Geochemical and Hydrochemical Sampling

Water samples were taken at 28 points: drainage streams (pp. 0–9), Ur River upstream drainage inflow (tt. 10′, 10″), mixing zone (pp. 10′, 10″), river downstream drainage inflow (pp. 11–37), and Ur reservoir (pp. 38, 38_1, 39) (Figure 5). The specific conductivity value was measured at the sampling site using conductivity meter 315i (WTW, Weilheim, Germany). Water samples at each point were taken from a depth of 30 cm into disposable polyethylene bottles of 250 mL, which were prerinsed with the sampled water, for subsequent analysis for chemical composition. Samples were transported to the laboratory and stored at a temperature not higher than +5 °C. GPS coordinates, elevation, and flow rate of the watercourse were recorded on site.

2.2. Laboratory Studies

2.2.1. Analysis of Chemical Elements Concentrations in Liquid Samples

Major cations in solutions were determined using ICP-AES spectrometry (iCap 6500 Duo, Thermo Fischer Scientific, Waltham, MA, USA) with a standard concentric nebulizer. The data acquiescing and processing were carried out by iTEVA software (Thermo Scientific, USA). The linear dynamic range of concentration based on external calibration was 105 (0.001–100 mg∙L−1). Scandium nitrate was added to the solutions for the matrix effect elimination. All measurements were conducted in three replicates (n = 3) for each element. The relative standard deviation did not exceed 13% for all measurements.
An Agilent 8800 ICP-MS instrument (Japan) equipped with MicroMist nebulizer was applied for elemental determination in water samples. High-purity argon (99.95%) was used as the plasma-forming, transporting, and cooling gas. A solution of 7Li, 59Co, 89Y, and 205Tl in 2% nitric acid with a concentration of 1 μg∙L−1 for each determined element was used for the adjustment (Table 1).

2.2.2. Analysis of Anion Concentrations in Water Samples

Concentrations of Cl, HCO3, and SO42− were determined by capillary electrophoresis on a “Kapel-105M” instrument.

3. Results

3.1. Results of ERT Study

The resistivity of the medium in the studied area varies from 1 to 650 Ω·m. A low-resistivity anomaly can be noted in the central part of the site (between the pyrite and barite dumps), as well as at the foot of the dumps from a depth of 1 m (Figure 6a) to 15.5 m (Figure 6c).

3.2. Results of the Micro-ERT Survey

The microtomography profile covers a part of the drainage valley (up to a mark of 7 m) and crosses the creek (mark of 2.5 m). The geoelectric section along the microtomography profile shows an uneven distribution of the electrical resistivity of the medium (Figure 7): from 1 Ωat 1–5 m along the profile to 400 Ωat 7 m and 12 m at a depth of 1.5 m. The low-ohmic anomaly corresponds to the waste material in the left part of the section to the depth of 1.5 m.
On the microtomography profile at 5.1 m and 7.2 m, two pits were dug were dug to the depth of reaching the level of underground flow. The material of the pits is represented by interlayers of light beige sand (to a depth of 20 cm), red clay (10–20 cm layer thickness), black watered peat with remnants of vegetation, and dark-gray medium-grained dense oily sand. When opening the pits, we can clearly smell hydrogen sulfide; the water at the bottom of the pits has a specific electrical conductivity of 400 μS/cm, which corresponds to fresh water.

3.3. Magnetic Survey Results

In the area of pyrite and barite dumps, the anomalies of the magnetic induction vector module vary within 70 nT (Figure 8).
Dumps in the northern part of the site are characterized by increased values of the magnetic induction vector modulus. There is a local positive anomaly in the central part, which partially coincides spatially with the embankment.

3.4. Results of Aerial Survey

The general view of the orthophotomap and the digital elevation model, obtained after processing the aerial survey data, are shown in Figure 9.
The orthophotomap clearly shows differences in the color of the dump surface: a grayish hue in the western part and a brownish hue in the eastern part of the dump, which can also be seen on satellite images (Figure 2 and Figure 3). High-resolution photography (individual stones and plants can be seen) was not used at this scale of the site study, but it allowed us, as described in the methodology, to obtain a high-quality digital elevation model. A fragment of this model is shown in Figure 10.
The data obtained as a result of thermal imaging in May 2021 made it possible to construct a digital model of the surface temperature of the Ursk dump and its foot in the southern part (in the filtration zone) (Figure 11).

3.5. Hydrochemical Composition of Surface Watercourses in the Ursk Drainage System

An underground acidic sulfate solution with a pH value of 3.61 flows out from the dump (Table 2). It is characterized by a high concentration of sulfate ions (4500 mg/L) and specific electrical conductivity (EC) of 16 mS/cm. The major elements are typical macro-elements, i.e., the bedrock-forming components of polymetallic ores: Na, Mg, Al, K, and Ca. In addition, the Ursk drainage shows extremely high concentrations in Fe (970 mg/L) and high concentrations in Mn (19 mg/L) and Zn (14 mg/L) (Table 3).
A distinctive feature of the drainage is the presence of a wide range of chemical elements, including ore-associated metals (Cu, Zn, Cd, Pb, Ba, Ni, Co, and Sb) and elements of the first class of danger (As, Hg, and Be) (Table 3).
At a distance of 200 m from the dump EC drops to 2500 μS/cm (point 3/20), sulfate concentrations decrease more than fourfold, the pH value rises to 4.24, and concentrations of other macrocomponents and trace elements in drainage solution significantly drop (Table 2 and Table 3).
Figure 12 shows a fragment of a digital relief model obtained for the first time using aerial photography on the basis of the results of field work in 2020, which we presented as a model of water transport of chemical compounds from an acid-producing sulfide waste dump. Such studies make it possible to assess on a scale the changes in relief that occur over time in the territory adjacent to the mine tailings.

4. Discussion

The vertical electrical sounding, performed in the Ursk mine tailings area, revealed conductive zones which are connected with watering due to seepage of atmospheric waters and spreading of drainage waters in the relief depression, as well as with mechanical drifting of the solid matter (Figure 6). In addition, it is likely that groundwater recharging the lake to the northeast of the site flows in a north–southeast direction (noted at depths of up to 15.5 m). A conductive zone up to 20 m deep to the southwest of the dumps coincides with a fracture formed due to erosion by drainage water. Infiltration of drainage water into the natural fault zone in the southeastern direction from the dumps was described earlier in the work of [25] and confirmed by us within the framework of this study.
The color of the deposits (light in the northern part and dark in the southern part, Figure 1) is related to the concentration of ferromagnetics in their composition and, consequently, to their increased (in the northern part) and decreased (in the southern part) magnetic susceptibility (Figure 8).
The digital elevation model allows us to trace individual features of the relief, i.e., watercourses and embankments. The main water catchment occurs in the northwestern part of the site with formation of watercourses, merging into the creek in the southern part. The main embankment is subjected to intensive erosion on the southwestern slope, and erosion gullies are formed here. Material from this slope enters the channel of the central watercourse and partially forms a deluvial plume to the south of the embankment, probably preventing the flow of the watercourse that wraps around the embankment from the east, which leads to waterlogging in the southeastern part of the area (Figure 9 and Figure 10).
The resulting model of thermal imaging (Figure 11) illustrates a number of temperature anomalies:
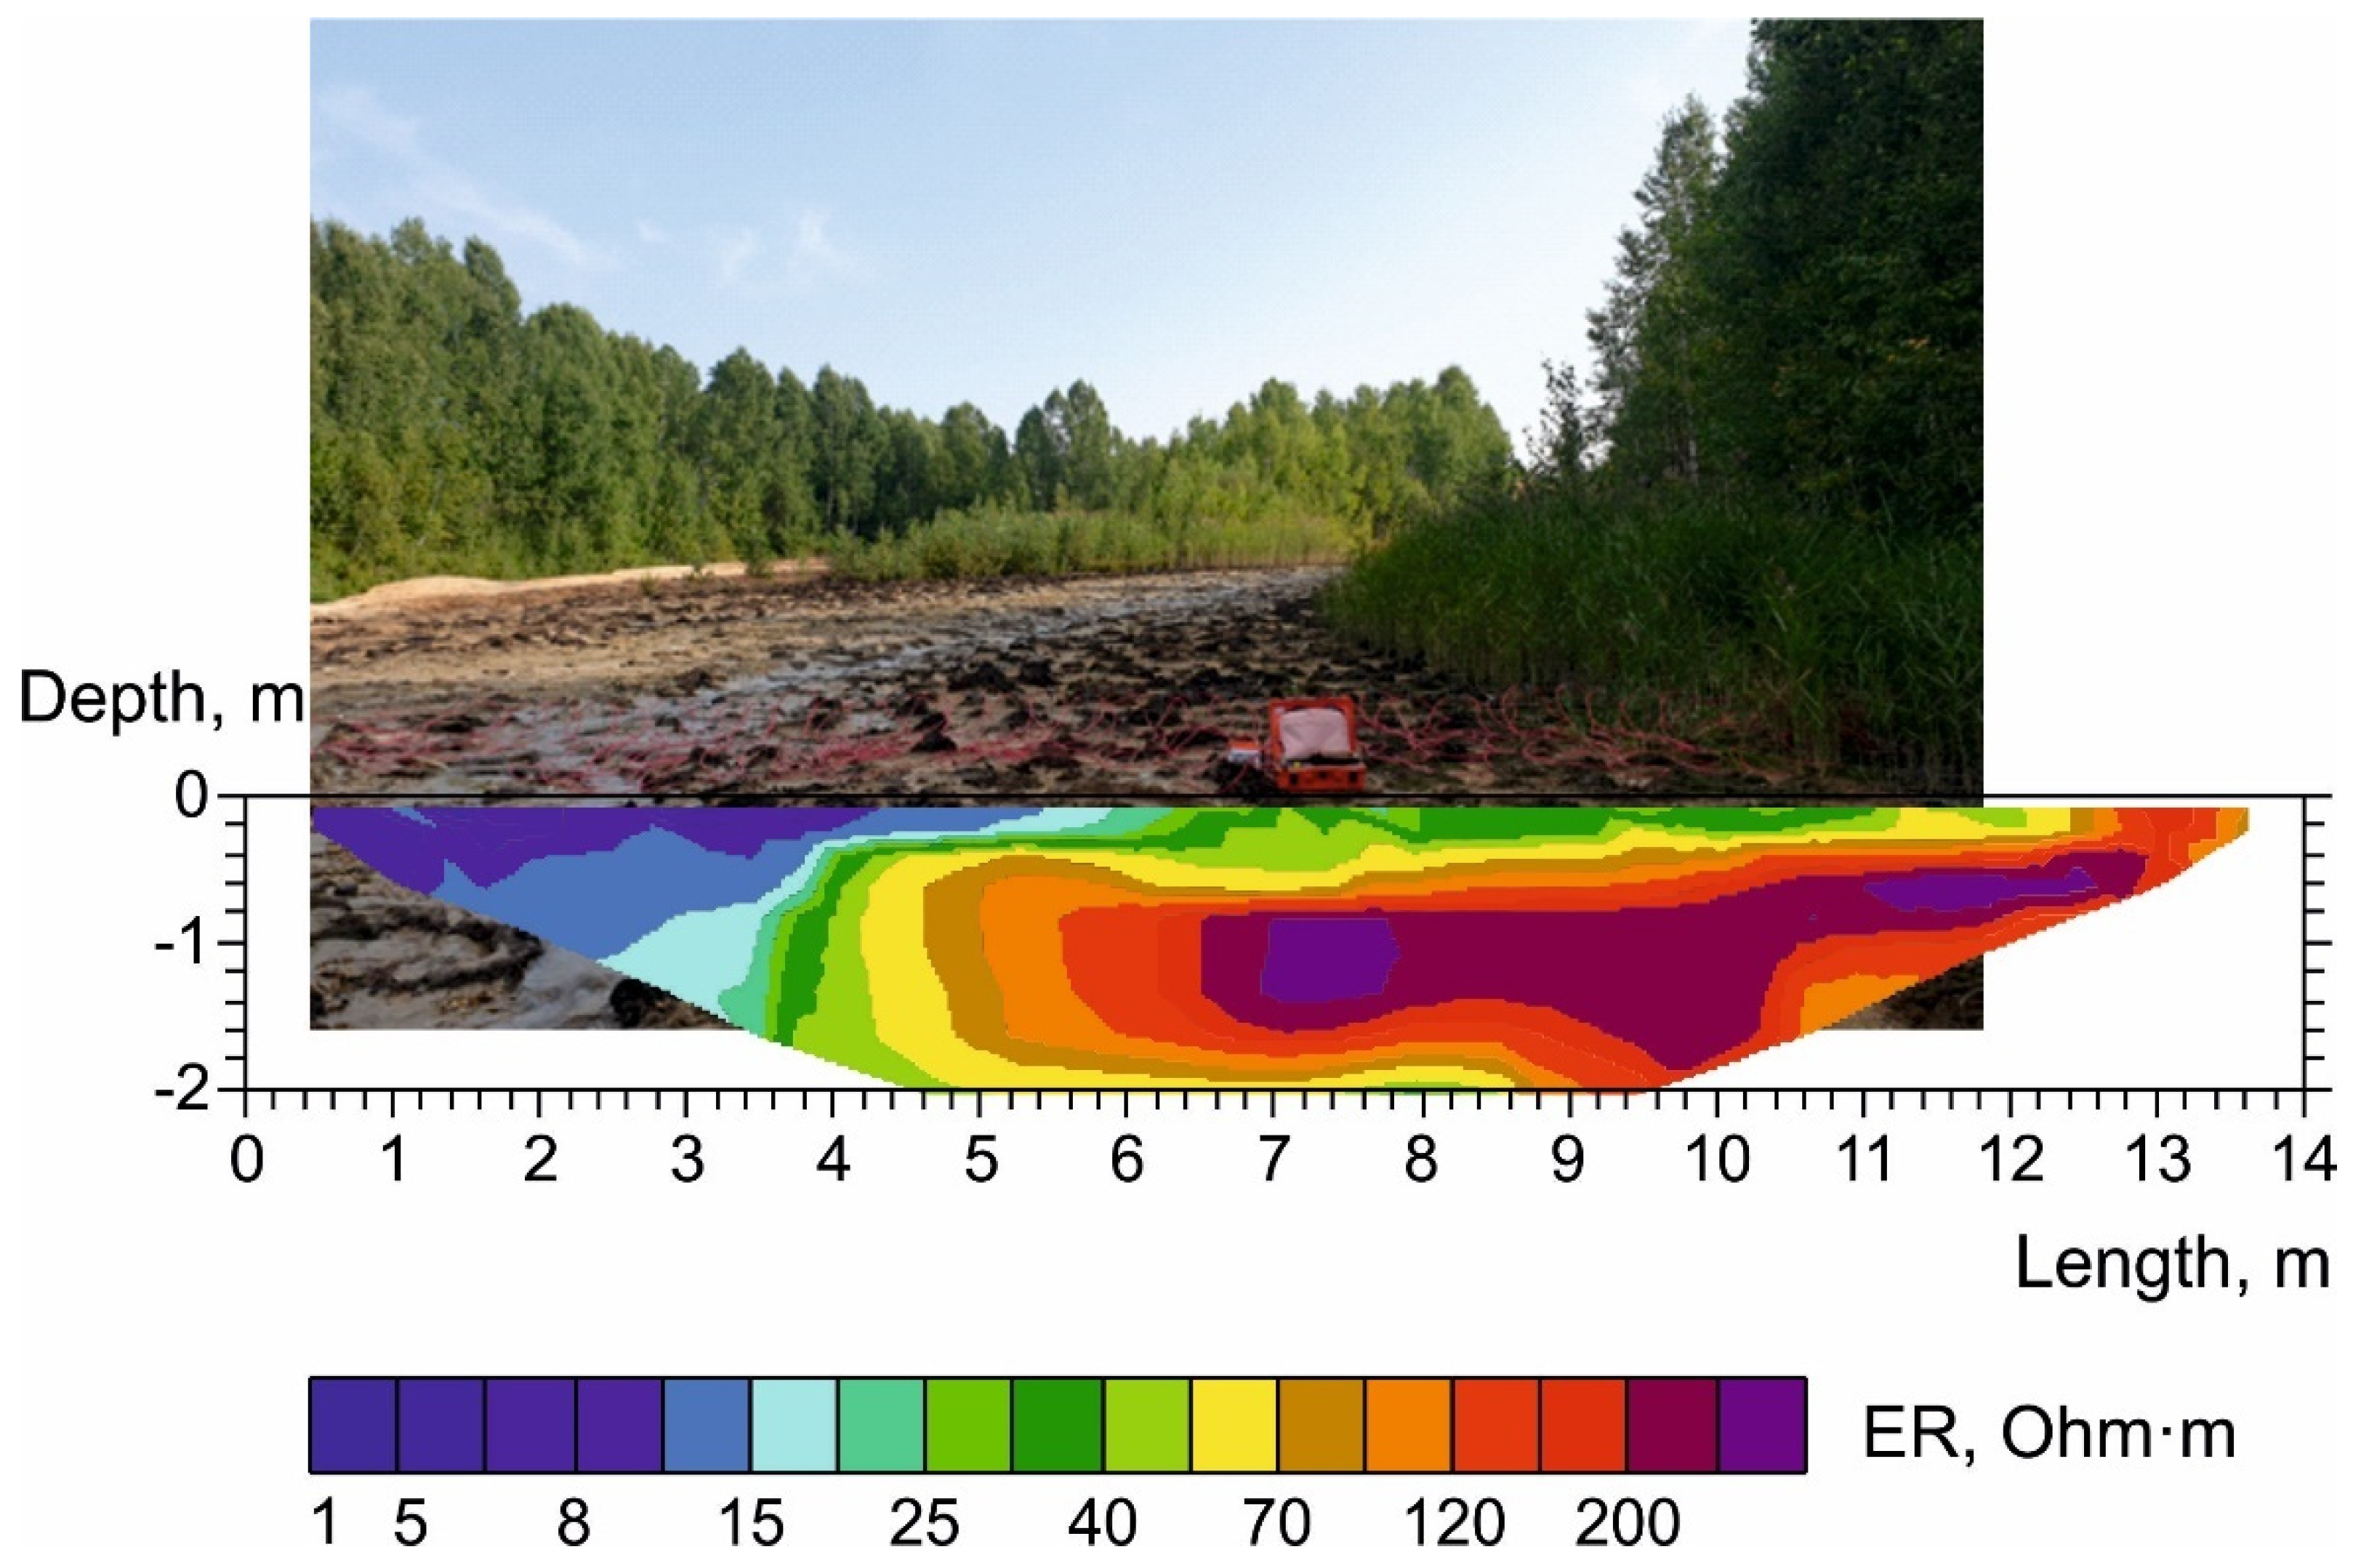
  • Drainage stream at the foot of the dump, with a temperature of about +12 to +13 °C (see small bright areas along the stream, Figure 11).
  • Sun-warmed western slopes of the embankment (+23 to +24 °C).
  • The increased temperature in the upper part of the slope (+20 to +24 °C) relative to the lower (+17 to +22 °C) due to exothermic reactions, because, in the upper part, the scree is “fresh”, whereas, in the lower part, there is material that has crumbled earlier, in which the reactions have already stopped.
  • Warming up in the filtration zone (white areas in Figure 11); the cause of warming up is exothermic reactions in the dump. The same thawing zones (marked with white in Figure 11) correspond to erosive cracks in the dump, along which seasonal flows of rain and melt water spread.
  • Areas of low temperatures in the northern part of the image are mainly associated to shaded areas.
The integration of remote sensing data and geochemical analyses allowed creating a model of chemical compounds water transport. The oxidation of sulfide minerals in the Ursk dumps leads to formation of acidic drainage (zone I, Figure 12). In zone (II) (Figure 12), the acidic drainage stream destroys the root systems of trees, dissolves the mineral complexes of the soil, leaches, and carries out rock-forming elements with the water flow. In zone III (Figure 12), mixing occurs with a natural stream; then, with the Ur River, the first natural geochemical physicochemical barrier is formed first upon contact with soils, a reducing medium is formed at a depth of 100 cm, and a wide range of nonferrous, precious metals, arsenic, antimony, and mercury are concentrated in the soils.
The oxidation zone is marked by low electrical resistivity, low values of the modulus of the magnetic induction vector, and heating by +5 °C compared to the solid matter in dump that is not actively exposed to water. We believe that the water–rock interaction processes are actively taking place in this zone, accompanied by the oxidation of sulfide mineral residues and the dissolution of sulfate compounds with the release of heat.
The high concentrations of Fe in the drainage solution are caused by its leaching from sulfide minerals (pyrite and pyrrhotite) in the supergene zone [31].
2FeS2 + 7O2 + 2H2O → 2FeSO4 + 2H2SO4.
2FeSO4 + 4H2SO4 + 2O2 → 2Fe2(SO4)3 + 4H2O.
CaCO3 + H2SO4 → Ca2+ + SO42− + H2O + CO2.
MgCO3 + H2SO4 → Mg2+ + SO42− + H2O + CO2.
In spite of the oxidative conditions (Eh 0.6 V), the low pH values (3.61) favor the formation of the Fe2+ compounds [32], characterized by high solubility and mobility. The sulfate class of drainage water and Ca–Mg type of mineralization are related to the oxidation of sulfides in the tailings, dissolution of calcite and dolomite, and leaching of the Ca and Mg. The dissolution of chalcopyrite, sphalerite, galena, and arsenopyrite leads to extremely high concentrations of Cu (3000 μg/L), Pb (1200 μg/L), As (1300 μg/L), and Hg (34 μg/L) in the Ursk drainage, significantly exceeding Clark’s and maximum allowable concentrations (Table 3) [29,30]. According to research data from previous years, it has been shown that active gas release occurs in this zone, including gases of biotic origin (C2H6S) due to methylation of sulfide-containing compounds by bacteria Bacillus mycoides. Interestingly, we found a local heating up to +5 °C in this zone under the snow cap during the studies of the dump in February at ambient temperature −20 °C [6].
A sharp decrease in the electrical conductivity of the drainage flow and the concentrations of chemical elements at a distance of 200 m from the dump are primarily attributed to sorption on natural sorbents the drainage stream flows through. For example, sorption of divalent metal ions and arsenic on peat is quite effective [32,33]. However, due to the influx of an acid stream with high dissolved metal content (point 5′/20, Table 2 and Table 3) into the same drainage creek, after 90 m, the concentrations of all macrocomponents increase again to the initial level. Thus, within the first 400 m, a zone of the primary geochemical barrier is formed, on which the major part of chemical elements is deposited at the expense of sorption on soils. However, due to secondary pollution, after 400 m, an acidic stream is formed again. At a distance of 1000 m, at the confluence with the Ur River, dilution occurs, forming the second geochemical barrier due to the change of physical and chemical environmental conditions; pH values rise up to 7.81 and Eh values decrease to 0.3 V. The main features of the waters in the mixing zone are low Fe and Al concentration primarily due to precipitation of the Fe3+ and Al3+ hydroxide complexes Fe(OH)3 (s) and Al2O3(H2O) (s) [34]. The iron–aluminum sorption geochemical barrier is formed in the mixing zone favoring the co-precipitation of other chemical elements on the surface of the hydroxide minerals. The concentration of Cu, Pb, and Co decreases by 3–4 orders, that of Mn, Cd, and Zn decreases by two orders, that of Ni, Be, As, and Sb decreases by one order of magnitude, and that of Hg decreases by 4.5 times in comparison to the concentration in solutions of the drainage valley (Table 2). It is interesting that the concentration of Ba in the mixing zone (73 g/L) is higher than that in the drainage village (67 μg/L). Barium concentration in the river upstream the drainage discharge is equal to 60 μg/L, and it is three times higher than average Clark concentration [28]. We suppose that the Ba water anomaly reflects the regional feature of the surface water streams of this area and is caused by the composition of barite–polymetallic ores in the fault zone in which the river Ur flows. Accordingly, the high concentration of Hg (0.6 μg/L) exceeding the MPC RF level (0.5 μg/L) (Table 3) may reflect the feature of the Ursk ore region.
The concentration of Mn decreases by more than 50% in comparison to the mixing zone (from 0.17 μg/L down to 0.08 μg/L) in the river downstream and at a distance 5–7 km from the tailings dump. Concentrations of Zn, Cu, Cd, Pb, Ni, Co, As, Sb, Be, and Hg are at the same level. It is worth noting that the concentration of Hg in the Ur River downstream drainage is 1.6 µg/L, which is more than three times higher than in the river upstream and MPC RF [30]. It is assumed that the source of mercury contamination of water in the Ur River is the removal of this element with drainage water flows.
Thus, it is shown that abandoned gold mining dumps, formed spontaneously 90 years ago, are still a source of acid, ore metals, and toxic impurities (As and Hg) to this day. Oxidation reactions of sulfide materials are actively taking place, tailings are mechanically removed from the surface of the dump, drainage penetrates to a depth of 15 m, and the destruction of the root system of trees continues. In addition, there is a lateral spread of acid drainage. However, the components of the natural environment (soils and river waters) form natural geochemical barriers on which chemical elements are deposited and acid is neutralized. However, the concentrations of all elements in the reservoir which catch the Ur River waters at the distance of 8 km from the tailings dump are at the same level as in the mixing zone. Therefore, it can be concluded that the stable geochemistry of surface waters, formed due to the inflow of drainage waters into the Ur River and further into the reservoir, persists at a distance of up to 8 km from the dump. It is worth noting that the problem of secondary pollution is well known when, in the first stage, the material of the dumps is mechanically demolished along the relief down into the river network and re-deposited into the bottom sediment, while, in the second stage, when the physicochemical environmental conditions change (pH decrease or Eh increase), the elements are leached from the bottom sediments and re-enter the river water [35].

5. Conclusions

A comprehensive study of the Ursk mine tailings dumps and drainage system was carried out using the methods of electrical resistivity tomography, magnetic, thermal imaging, photogrammetry, and hydrochemical sampling.
Three main zones were identified: oxidation, leaching, and mixing of drainage with the waters of the Ur River.
The oxidation zone (Figure 12) is marked by low electrical resistivity (1–10 Ω·m), low values of the modulus of the magnetic induction vector (−10 nT), and heating by +5 °C compared to the solid matter in dump that is not actively exposed to water. The acid solution (pH 3.61) with high electrical conductivity (16,000 µS/cm) and concentrations of sulfate anion (up to 4500 mg/L), metals, and metalloids of ore association (Fe, Cu, Zn, Cd, Pb, Ba, Ni, Co, Sb, As, Hg, and Be) is formed in this zone. A feature of the Ursk drainage is a high concentration of dissolved Fe (980 mg/L), As (1300 µg/L), Hg (34 µg/L), and Ba (83 µg/L).
The leaching zone (Figure 12) is characterized by negative anomaly of the magnetic induction vector (−20 nT) and low resistivities (5–10 Ω·m). A high-conductivity anomaly in this zone can be found at a depth of 15.5 m, which indicates the penetration of the acid drainage into the deep horizons. The acidic drainage stream destroys the root systems of trees, dissolves the mineral complexes of the soil, leaches, and carries out rock-forming elements (Ca, Mg, K, and Na). The primary geochemical barrier is formed in the middle part of this zone due to sorption of the elements on the soils. The conductivity of the drainage solution drops to 2500 µS/cm, concentrations of SO42− and Fe decrease to 1100 mg/L and 430 mg/L, and those of As, Hg, and Ba decrease to 50, 6, and 67 µg/L, respectively.
The second geochemical barrier Is formed in the mixing zone due to neutralization of acid mine drainage by Ur River waters. The electrical conductivity decreases to 450 µS/cm, the concentration of SO42− decreases to 20 mg/L, and concentrations of Fe, As, Hg, and Ba drop to 0.38 mg/L, 2.3, 1.3, and 73 µg/L, respectively.
The application of the proposed complex of methods at abandoned mine tailings sites will allow assessing thermal pollution, the area subject to acid weathering, and the range of chemical compounds migrating with drainage flows, as well as enable a forecast of the environmental hazards.

Author Contributions

Conceptualization, N.Y., L.T., E.T. and P.O.; methodology, S.V., I.F., K.T. and T.K.; validation, N.Y. and L.T.; formal analysis, S.V.; investigation, N.Y. and L.T.; resources, N.Y.; data curation, N.Y., L.T. and P.O.; writing—original draft preparation, N.Y., L.T. and P.O.; writing—review and editing, N.Y.; visualization, N.Y., L.T. and P.O.; supervision, N.Y.; project administration, N.Y.; funding acquisition, N.Y. All authors have read and agreed to the published version of the manuscript.

Funding

This research was funded by Ministry of Education and Science of Russian Federation, grant number FWZZ-2022-0029. The APC was funded by Russian Foundation for Basic Research, grants number 20-05-00336.

Institutional Review Board Statement

Not applicable.

Informed Consent Statement

Informed consent was obtained from all subjects involved in the study.

Data Availability Statement

Data are available upon request to the corresponding author.

Conflicts of Interest

The authors declare no conflict of interest.

References

  1. Nordstrom, D.K. Effects of microbiological and geochemical interactions in mine drainage. Environ. Asp. Mine Wastes Short Course Ser. 2003, 31, 227–238. [Google Scholar]
  2. Lottermoser, B.G. Sulfidic mine wastes. In Mine Wastes; Springer: Berlin/Heidelberg, Germany, 2010; pp. 43–117. [Google Scholar]
  3. Nordstrom, D.K.; Blowes, D.W.; Ptacek, C.J. Hydrogeochemistry and microbiology of mine drainage: An update. Appl. Geochem. 2015, 57, 3–16. [Google Scholar] [CrossRef]
  4. Murray, J.; Nordstrom, D.K.; Dold, B.; Kirschbaum, A. Seasonal fluctuations and geochemical modeling of acid mine drainage in the semi-arid Puna region: The Pan de Azúcar Pb–Ag–Zn mine, Argentina. J. S. Am. Earth Sci. 2021, 109, 103197. [Google Scholar] [CrossRef]
  5. Bortnikova, S.B.; Yurkevich, N.V.; Abrosimova, N.A.; Devyatova, A.Y.; Edelev, A.V.; Makas, A.L.; Troshkov, M.L. Assessment of emissions of trace elements and sulfur gases from sulfide tailings. J. Geochem. Explor. 2018, 186, 256–269. [Google Scholar] [CrossRef]
  6. Yurkevich, N.; Bortnikova, S.; Abrosimova, N.; Makas, A.; Olenchenko, V.; Yurkevich, N.; Edelev, A.; Saeva, O.; Shevko, A. Sulfur and nitrogen gases in the vapor streams from ore cyanidation wastes at a sharply continental climate, Western Siberia, Russia. Water Air Soil Pollut. 2019, 230, 307. [Google Scholar] [CrossRef]
  7. Davé, N.; Blanchette, M.; Giziewicz, E.; Review and Assessment of the Roles of Ice, in the Water Cover Option, and Permafrost in Controlling the Acid Generation from Sulphide Tailings. MEND Project 1.61.1. 1996. Available online: http://mend-nedem.org/mend-report/roles-of-ice-in-the-water-cover-option-and-permafrost-in-controlling-acid-generation-from-sulphide-tailings/ (accessed on 12 October 2022).
  8. Elberling, B.; Schippers, A.; Sand, W. Bacterial and chemical oxidation of pyritic mine tailings at low temperatures. J. Contam. Hydrol. 2000, 41, 225–238. [Google Scholar] [CrossRef]
  9. Amos, R.T.; Blowes, D.W.; Bailey, B.L.; Sego, D.C.; Smith, L.; Ritchie, A.I.M. Waste-rock hydrogeology and geochemistry. Appl. Geochem. 2015, 57, 140–156. [Google Scholar] [CrossRef]
  10. Elberling, B. Disposal of mine tailings in continuous permafrost areas: Environmental aspects and future control strategies. In Cryosols; Springer: Berlin/Heidelberg, Germany, 2004; pp. 677–698. [Google Scholar]
  11. Dawson, R.F.; Morin, K.A.; Acid Mine Drainage in Permafrost Regions: Issues, Control Strategies and Research Requirements. MEND Project 1.61.2. 1996. Available online: http://mend-nedem.org/mend-report/acid-mine-drainage-in-permafrost-regions-issues-control-strategies-and-research-requirements/ (accessed on 12 October 2022).
  12. Cabala, J.; Zogala, B.; Dubiel, R. Geochemical and Geophysical Study of Historical Zn-Pb Ore Processing Waste Dump Areas (Southern Poland). Pol. J. Environ. Stud. 2008, 17, 693–700. [Google Scholar]
  13. Pierwoła, J.; Szuszkiewicz, M.; Cabala, J.; Jochymczyk, K.; Żogała, B.; Magiera, T. Integrated geophysical and geochemical methods applied for recognition of acid waste drainage (AWD) from Zn-Pb post-flotation tailing pile (Olkusz, southern Poland). Environ. Sci. Pollut. Res. 2020, 27, 16731–16744. [Google Scholar] [CrossRef] [Green Version]
  14. Casagrande, M.F.S.; Moreira, C.A.; Targa, D.A.; Alberti, H.L.C. Integration of geophysical methods in the study of acid drainage in uranium mining waste. Braz. J. Geophys. 2018, 36, 439–450. [Google Scholar] [CrossRef] [Green Version]
  15. Moreira, C.A.; Casagrande MF, S.; de Siqueira Büchi, F.M.; Targa, D.A. Hydrogelogical characterization of a waste rock pile and bedrock affected by acid mine drainage from geophysical survey. SN Appl. Sci. 2020, 2, 1236. [Google Scholar] [CrossRef]
  16. Merritt, P.; Power, C. Assessing the long-term evolution of mine water quality in abandoned underground mine workings using first-flush based models. Sci. Total Environ. 2022, 846, 157390. [Google Scholar] [CrossRef] [PubMed]
  17. Snodgrass, J.J.; Lepper, C.M. Geophysical characterization of mineral waste sites. In Proceedings of the 6th EEGS Symposium on the Application of Geophysics to Engineering and Environmental Problems, San Diego, CA, USA, 18–22 April 1993. [Google Scholar]
  18. Warchulski, R.; Mendecki, M.; Gawęda, A.; Sołtysiak, M.; Gadowski, M. Rainwater-induced migration of potentially toxic elements from a Zn–Pb slag dump in Ruda Śląska in light of mineralogical, geochemical and geophysical investigations. Appl. Geochem. 2019, 109, 104396. [Google Scholar] [CrossRef]
  19. Power, C.; Tsourlos, P.; Ramasamy, M.; Nivorlis, A.; Mkandawire, M. Combined DC resistivity and induced polarization (DC-IP) for mapping the internal composition of a mine waste rock pile in Nova Scotia, Canada. J. Appl. Geophys. 2018, 150, 40–51. [Google Scholar] [CrossRef]
  20. Barago, N.; Covelli, S.; Mauri, M.; Oberti di Valnera, S.; Forte, E. Prediction of Trace Metal Distribution in a Tailings Impoundment Using an Integrated Geophysical and Geochemical Approach (Raibl Mine, Pb-Zn Alpine District, Northern Italy). Int. J. Environ. Res. Public Health 2021, 18, 1157. [Google Scholar] [CrossRef]
  21. Arcila, E.J.A.; Moreira, C.A.; Camarero, P.L.; Casagrande, M.F.S. Identification of flow zones inside and at the base of a uranium mine tailings Dam using geophysics. Mine Water Environ. 2021, 40, 308–319. [Google Scholar] [CrossRef]
  22. Targa, D.A.; Moreira, C.A.; Casagrande, M.F.S. Hydrogeological analysis of sulfide tailings at a uranium mine using geophysical and hydrochemical methods. Mine Water Environ. 2021, 40, 671–689. [Google Scholar] [CrossRef]
  23. Martínez, J.; Mendoza, R.; Rey, J.; Sandoval, S.; Hidalgo, M.C. Characterization of Tailings Dams by Electrical Geophysical Methods (ERT, IP): Federico Mine (La Carolina, Southeastern Spain). Minerals 2021, 11, 145. [Google Scholar] [CrossRef]
  24. Tavakoli, S.; Rasmussen, T.M. Geophysical tools to study the near-surface distribution of the tailings in the Smaltjärnen repository, south-central Sweden; a feasibility study. Acta Geophysica 2022, 70, 141–159. [Google Scholar] [CrossRef]
  25. Olenchenko, V.V.; Kucher, D.O.; Bortnikova, S.B.; Gas’kova, O.L.; Edelev, A.V.; Gora, M.P. Vertical and lateral spreading of highly mineralized acid drainage solutions (Ur dump, Salair): Electrical resistivity tomography and hydrogeochemical data. Russ. Geol. Geophys. 2016, 57, 617–628. [Google Scholar] [CrossRef]
  26. Myagkaya, I.N.; Lazareva, E.V.; Gustaytis, M.A.; Zhmodik, S.M. Gold and silver in a system of sulfide tailings. Part 1: Migration in water flow. J. Geochem. Explor. 2016, 160, 16–30. [Google Scholar] [CrossRef]
  27. Loke, M.H. Res2Dinv and Res3dinv Software Version 3.59; Geoelectrical Imaging 2D&3D: Penang, Malaysia, 2009. [Google Scholar]
  28. Taylor, S.R.; McLennan, S.M. The Continental Crust: Its Composition and Evolution; OSTI: Oak Ridge, TN, USA, 1985. [Google Scholar]
  29. WHO. Guidelines for Drinking Water Quality; World Health Organization: Geneva, Switzerland, 2008. [Google Scholar]
  30. A General List. In General List of Fisheries Norms: Maximum Permissible Concentrations and Approximately Safe Levels of Harmful Substances in Water of Fishery Water Bodies; VNIRO: Moscow, Russia, 1999; p. 304.
  31. Kelly, B.C.; Tuovinen, O.H. Chemistry and Biology of Solid Waste; Springer: Berlin/Heidelberg, Germany, 1988; p. 33. [Google Scholar]
  32. Gogoi, H.; Leiviskä, T.; Heiderscheidt, E.; Postila, H.; Tanskanen, J. The effectiveness of metal and metalloid sorption from mining influenced waters by natural and modified peat. Mine Water Environ. 2018, 37, 734–743. [Google Scholar] [CrossRef]
  33. Yurak, V.; Apakashev, R.; Dushin, A.; Usmanov, A.; Lebzin, M.; Malyshev, A. Testing of natural sorbents for the assessment of heavy metal ions’ adsorption. Appl. Sci. 2021, 11, 3723. [Google Scholar] [CrossRef]
  34. Brookins, D.G. Eh-pH Diagrams for Geochemistry; Springer Science & Business Media: Berlin/Heidelberg, Germany, 2012. [Google Scholar]
  35. Linnik, P.M.; Zubenko, I.B. Role of bottom sediments in the secondary pollution of aquatic environments by heavy-metal compounds. Lakes Reserv. Res. Manag. 2000, 5, 11–21. [Google Scholar] [CrossRef]
Figure 1. Location of the Ursk dump. The dashed lines indicate the natural fault zone according to [25].
Applsci 12 10610 g001
Figure 2. Photos of the Ursk dump, the drainage valley, and the “manmade waterfall”.
Applsci 12 10610 g002
Figure 3. Configuration of ERT profiles.
Applsci 12 10610 g003
Figure 4. Configuration of profiles for magnetic survey.
Applsci 12 10610 g004
Figure 5. Scheme of hydrochemical sampling.
Applsci 12 10610 g005
Figure 6. Maps of the distribution of the electrical resistivity of the medium in the study area at depths of 1 (a), 8.5 (b), 15.5 (c), and 30.5 m (d). The white arrows indicate the surface drainage pathways.
Applsci 12 10610 g006
Figure 7. Geoelectric section along the profile of micro-ERT.
Applsci 12 10610 g007
Figure 8. Anomalies of the magnetic induction vector modulus in the studied area.
Applsci 12 10610 g008
Figure 9. Orthophotoplane and digital elevation model.
Applsci 12 10610 g009
Figure 10. Fragment of the orthophotomap and digital elevation model.
Applsci 12 10610 g010
Figure 11. Digital model of the Ursk dump surface temperature.
Applsci 12 10610 g011
Figure 12. Schematic diagram of the structure of the Ursk drainage system: the distribution of oxidation, leaching, and mixing zones.
Applsci 12 10610 g012
Table 1. Working parameters of ICP-MS-spectrometer.
Power supply, W1550
Detector response, s per ion0.12
The temperature of the spray chamber2.0 ± 0.1°
The speed of peristaltic pump, rpm30
The sample feed rate to the spray chamber, mL∙min−10.2
Argon flow rate, L∙min−115
Table 2. Specific conductivity (EC), pH, and concentrations of sulfate and major cations in samples from surface watercourses in the Ursk dump area.
SampleDistance, mEC, µS/cmpHSO42−, mg/Lµg/L
NaMgAlKCaFe
1/20016,0003.614500241403501.4230970
2/205012003.8214501935200.9410012
3/2020025003.5511002349430.4381420
4/2031039003.62230022902200.67120530
5′/2041039803.48320022902200.67110560
6/2050031303.55210031841501.4140370
7/2060031003.71200032841501.6140360
8/2065031303.68180023841500.54120380
9/2072032603.49250020701600.77120380
10/207804307.62226.8130.060.95460.03
11/209404507.81217.7140.091.06490.05
15/2014003407.81497.7130.221.66790.64
18/2019004607.85406.7130.100.93490.47
21/2025004507.58326.9130.081.0500.30
35/2059004607.45357.6130.011.4530.78
36/2062003708.27296.4110.031.5840.15
38/2065003507.59275.6120.010.65350.10
38-1/2068002507.95205.0120.020.43270.33
39/2077002807.87176.29.40.011.1500.02
min2352523.4175.09.40.010.43270.02
max320160008.345009.7140.221.7860.78
average28118696.09006.9120.061.2620.21
Clark * 6.34.10.052.31540
* Clark is the average concentration in the waters of hydrosphere according to [28].
Table 3. Trace element composition of surface water in the drainage at the foot of the dump, in the drainage valley, and in the river upstream and downstream the drainage inflow.
SampleHeight, mDistance, mmg/Lµg/L
MnZnCuCdPbBaNiCoBeAsSbHg
0/203160191430009.11200832902603.513009.234
2/20320502.50.831901.51505933240.501102.06.0
3/203242005.71.85803.02401462472.1480.106.0
4/2031131017131700182501001001504.5832.06.0
5′/203044101713170018210781001503.8822.06.0
6/20304500149.813001517013901203.2280.106.0
7/202986001411130014140110881204.0190.106.0
8/20294650141114001217024951303.6220.106.0
9/20294750149.2120013140140911303.4242.06.0
15/2025614000.600.048.40.302.1553.92.40.102.50.202.0
18/2028319000.030.013.30.300.19721.50.400.101.30.100.60
21/2028225000.010.013.50.300.35731.30.400.101.60.100.60
23/2026029000.050.012.80.300.74912.30.400.103.90.202.0
27/2025138000.210.013.60.300.85942.00.400.102.90.201.6
31/2024449000.060.013.30.300.68911.70.400.103.30.202.0
32/2024252000.060.013.10.300.75921.80.400.103.20.201.3
33/2024154000.050.013.20.300.42922.00.400.102.90.201.7
35/2027559000.0040.012.00.300.20900.80.400.101.30.100.60
36/2023562000.060.012.90.300.35881.50.400.102.50.202.0
38/2026765000.0020.012.00.300.20631.00.400.102.20.100.60
38-1/2027368000.0010.012.00.300.31481.00.400.101.60.100.60
39/2023677000.020.012.70.300.70461.10.400.103.30.201.8
10/202947800.020.012.00.300.20601.00.400.101.90.100.60
10′/202948200.0030.012.00.300.20601.40.400.102.40.100.60
10″/202668700.150.013.30.302.5542.40.460.104.30.202.2
11/202809400.010.012.00.300.20611.10.400.101.70.100.60
MPC WHO *--0.403.020003.01070070n.d.1210206.0
MPC RF **--0.101.010001.010.00700201000.20105.00.50
* MPC WHO (maximum permissible concentrations of elements in water, World Health Organization) [29]. ** MPC RF (maximum permissible concentrations of elements in water, Russian Federation) [30].
Publisher’s Note: MDPI stays neutral with regard to jurisdictional claims in published maps and institutional affiliations.

