Article

Experimental Study on the Seismic Performance of Shear Walls with Different Coal Gangue Replacement Rates

1
School of Civil Engineering, Liaoning Technical University, Fuxin 123000, China
2
Department of Northeast Company, China Construction Fifth Engineering Division Corp., Ltd., Shenyang 110000, China
3
Department of Civil Engineering, Chongqing University, Chongqing 400044, China
4
Department of Civil and Environmental Engineering, The Hong Kong University of Science and Technology, Clear Water Bay, Kowloon, Hong Kong 999077, China
*
Authors to whom correspondence should be addressed.
Appl. Sci. 2022, 12(20), 10622; https://doi.org/10.3390/app122010622
Submission received: 23 August 2022 / Revised: 13 October 2022 / Accepted: 18 October 2022 / Published: 20 October 2022

Abstract

:
To replace conventional concrete with coal gangue concrete in the construction industry, lateral cyclic loading tests were applied to three shear walls with different coal gangue replacement rates in this study, in which the replacement rate of coal gangue was 0%, 50%, and 100%. The load-displacement hysteretic curves and backbone curves of the shear walls obtained from tests were analyzed to compare the failure process and seismic performance of each shear wall. The results indicate that the stress performance and failure morphology of coal gangue concrete shear walls and conventional concrete shear walls are extremely similar, and the characteristics of the hysteretic and backbone curves are approximately the same. With the increase in the coal gangue replacement rate, the bearing capacity and ductility of the three shear walls gradually decrease, the strength degradation gradually becomes significant, and the energy dissipation capacity becomes worse, but the difference is not obvious, and all of them can meet the requirements of seismic performance. In addition, with the increase in the coal gangue replacement rate, the stiffness degradation gradually slows, so it is feasible to construct a shear wall using coal gangue concrete instead of conventional concrete.

1. Introduction

As a kind of solid waste produced during coal production, coal gangue has caused serious pollution to the surrounding environment. At present, coal gangue has become the largest source of solid waste and has increased year by year [1,2,3]. Currently, coal gangue can be applied to the construction industry to realize industrial production. On the one hand, the utilization of solid waste resources is realized, which is in line with the concept of green and environmental protection. On the other hand, the development direction of construction industrialization is achieved. Testing proves that the construction material processed using coal gangue has the advantages of lightweight, low hygroscopic rate, and meets strength requirements [4].
Compared with conventional concrete, the performance of coal gangue concrete is different, and its practical application in building structures is also restricted. Therefore, only by analyzing the influence of coal gangue as an aggregate on the performance of concrete (such as strength, and bonding properties [5]) through experimental research and looking for improvement methods can the characteristics of coal gangue with high efficiency and low energy consumption be fully utilized. Currently, many studies on coal gangue concrete have been performed by scholars, and corresponding results have been achieved. Chen [6], Zhang et al. [7], and Wang et al. [8] made concrete using coal gangue and tested its basic properties. It was found that it is feasible to replace conventional coarse aggregate with coal gangue [6,7,8]. Zhou et al. [9,10,11] tested the mechanical properties of concrete prepared using coal gangue and proved that it meets mechanical properties requirements. The new thermal insulation concrete prepared by Zhang et al. [12] using coal gangue can still meet the strength requirements under the condition of large thermal conductivity. Wang et al. [13,14] proved that the strength of coal gangue concrete is related to the gradation of coal gangue, and the mechanical properties can be improved by adding steel fiber. Yang et al. [15] found that calcined coal gangue can improve the strength of coal gangue concrete. In addition, Cui et al. [16,17] studied the crack resistance of C30 coal gangue concrete caused by drying shrinkage in different environments and different contents of spontaneous combustion coal gangue as test variables. Liu et al. [18,19] studied the water absorption performance of coal gangue concrete under different times and different coal gangue replacement rates and studied the durability of coal gangue concrete under different pH values.
Nowadays, structural health monitoring has become an important method to ensure the safety of structures [20]. Because the basic properties of coal gangue concrete research are more mature, coal gangue concrete has gradually been applied to structures by scholars. Tan et al. [21] carried out a low-cyclic reciprocal load test on six reinforced coal gangue concrete low shear walls and studied the influence of the shear span-to-depth ratio, concrete strength, and reinforcement ratio on the seismic performance of coal gangue concrete low shear walls. At the same time, the calculation formula of the shear bearing capacity of a coal gangue concrete low shear wall was proposed [21]. Li et al. [22] carried out a finite element simulation of coal gangue concrete-filled steel tubular beam-column joints under reciprocating loads. The results show that the joints have excellent seismic performance and show good ductility and energy dissipation performance [22]. Wu et al. [23] carried out a static test of four reinforced coal gangue concrete beams and found that the stress form and failure process of reinforced coal gangue concrete beams are similar to those of conventional reinforced concrete beams. Furthermore, the constitutive relationship formula of coal gangue concrete was proposed [23]. Li et al. [24] conducted cyclic loading tests on coal gangue concrete columns to study the ductility and energy dissipation capacity of coal gangue concrete columns under different axial compression ratios. Zhou et al. [25,26] tested the bending performance of the spontaneous combustion coal gangue sand light concrete unidirectional composite slab and proved its feasibility as a floor slab. Wang et al. [27] and Bai et al. [28] studied the flexural performance and shear performance of coal gangue concrete beams with a variable coal gangue replacement rate. The results show that the mechanical properties of reinforced concrete beams are less affected by coal gangue concrete, and there is a certain safety factor [27,28]. Zhang et al. [29] made GFRP tube-coal gangue concrete-steel tube hollow columns by replacing conventional concrete with coal gangue concrete and conducted axial compression tests with GFRP tube wall thickness, hollow ratio, steel tube wall thickness, and concrete type as variables. A low-cycle reciprocal load was applied to coal gangue concrete frame columns and frame middle joints by Bai et al. [30,31] to study the seismic performance.
At present, most of the experimental studies on the seismic performance of coal gangue concrete shear walls focus on low shear walls, and few research were conducted on medium-high shear walls. Moreover, the test variables are mainly set with shear span-to-depth ratio, concrete strength and axial compression ratio and so on, without involving coal gangue replacement rate. In addition, the study of seismic performance is limited to some indicators and is not systematic. Based on these, in this paper, the coal gangue replacement rate is used as the research parameter. Through a lateral cyclic loading test of shear walls with coal gangue replacement rates of 0%, 50%, and 100%, the influence of the coal gangue replacement rate on the failure process and seismic performance of shear walls is analyzed, and the feasibility of using coal gangue concrete to replace ordinary concrete to make shear walls is verified. The theoretical basis for the structural design of coal gangue concrete shear walls is provided by the experimental data.

2. Materials and Methods

2.1. Specimen Design

In this experiment, the purpose and content of the test, laboratory equipment conditions, and other factors were comprehensively considered. According to the requirements of transportation, installation, loading, and measurement in the design and production of reinforced concrete shear wall specimens in JGJ/T 101-2015 [32], three coal gangue concrete shear wall specimens were designed. The conventional concrete shear wall was designated RFSW-1, the concrete shear wall number with a 50% coal gangue replacement rate was designated CGSW-2, and the concrete shear wall number with a 100% coal gangue replacement rate was designated CGSW-3. The shear wall height was 1200 mm, the width was 600 mm, the thickness was 120 mm, and the shear span-to-depth ratio was 2. The concrete strength grade of the coal gangue concrete shear wall was C30, and the reinforcement of the shear wall was made of HRB335 rebar. The horizontal and vertical reinforcements of the wall were in line with the structural conditions in JGJ 3–2010 [33]. All specimens had the same overall dimensions and arrangement of reinforcements (refer to Figure 1). The parameters of the specimens are shown in Table 1. The specimen preparation process (refer to Figure 2) included steel bar blanking, binding steel cage, installing steel strain gauges, supporting template, pouring and curing concrete, and installing concrete strain gauges.

2.2. Material Properties Test

2.2.1. Test Materials

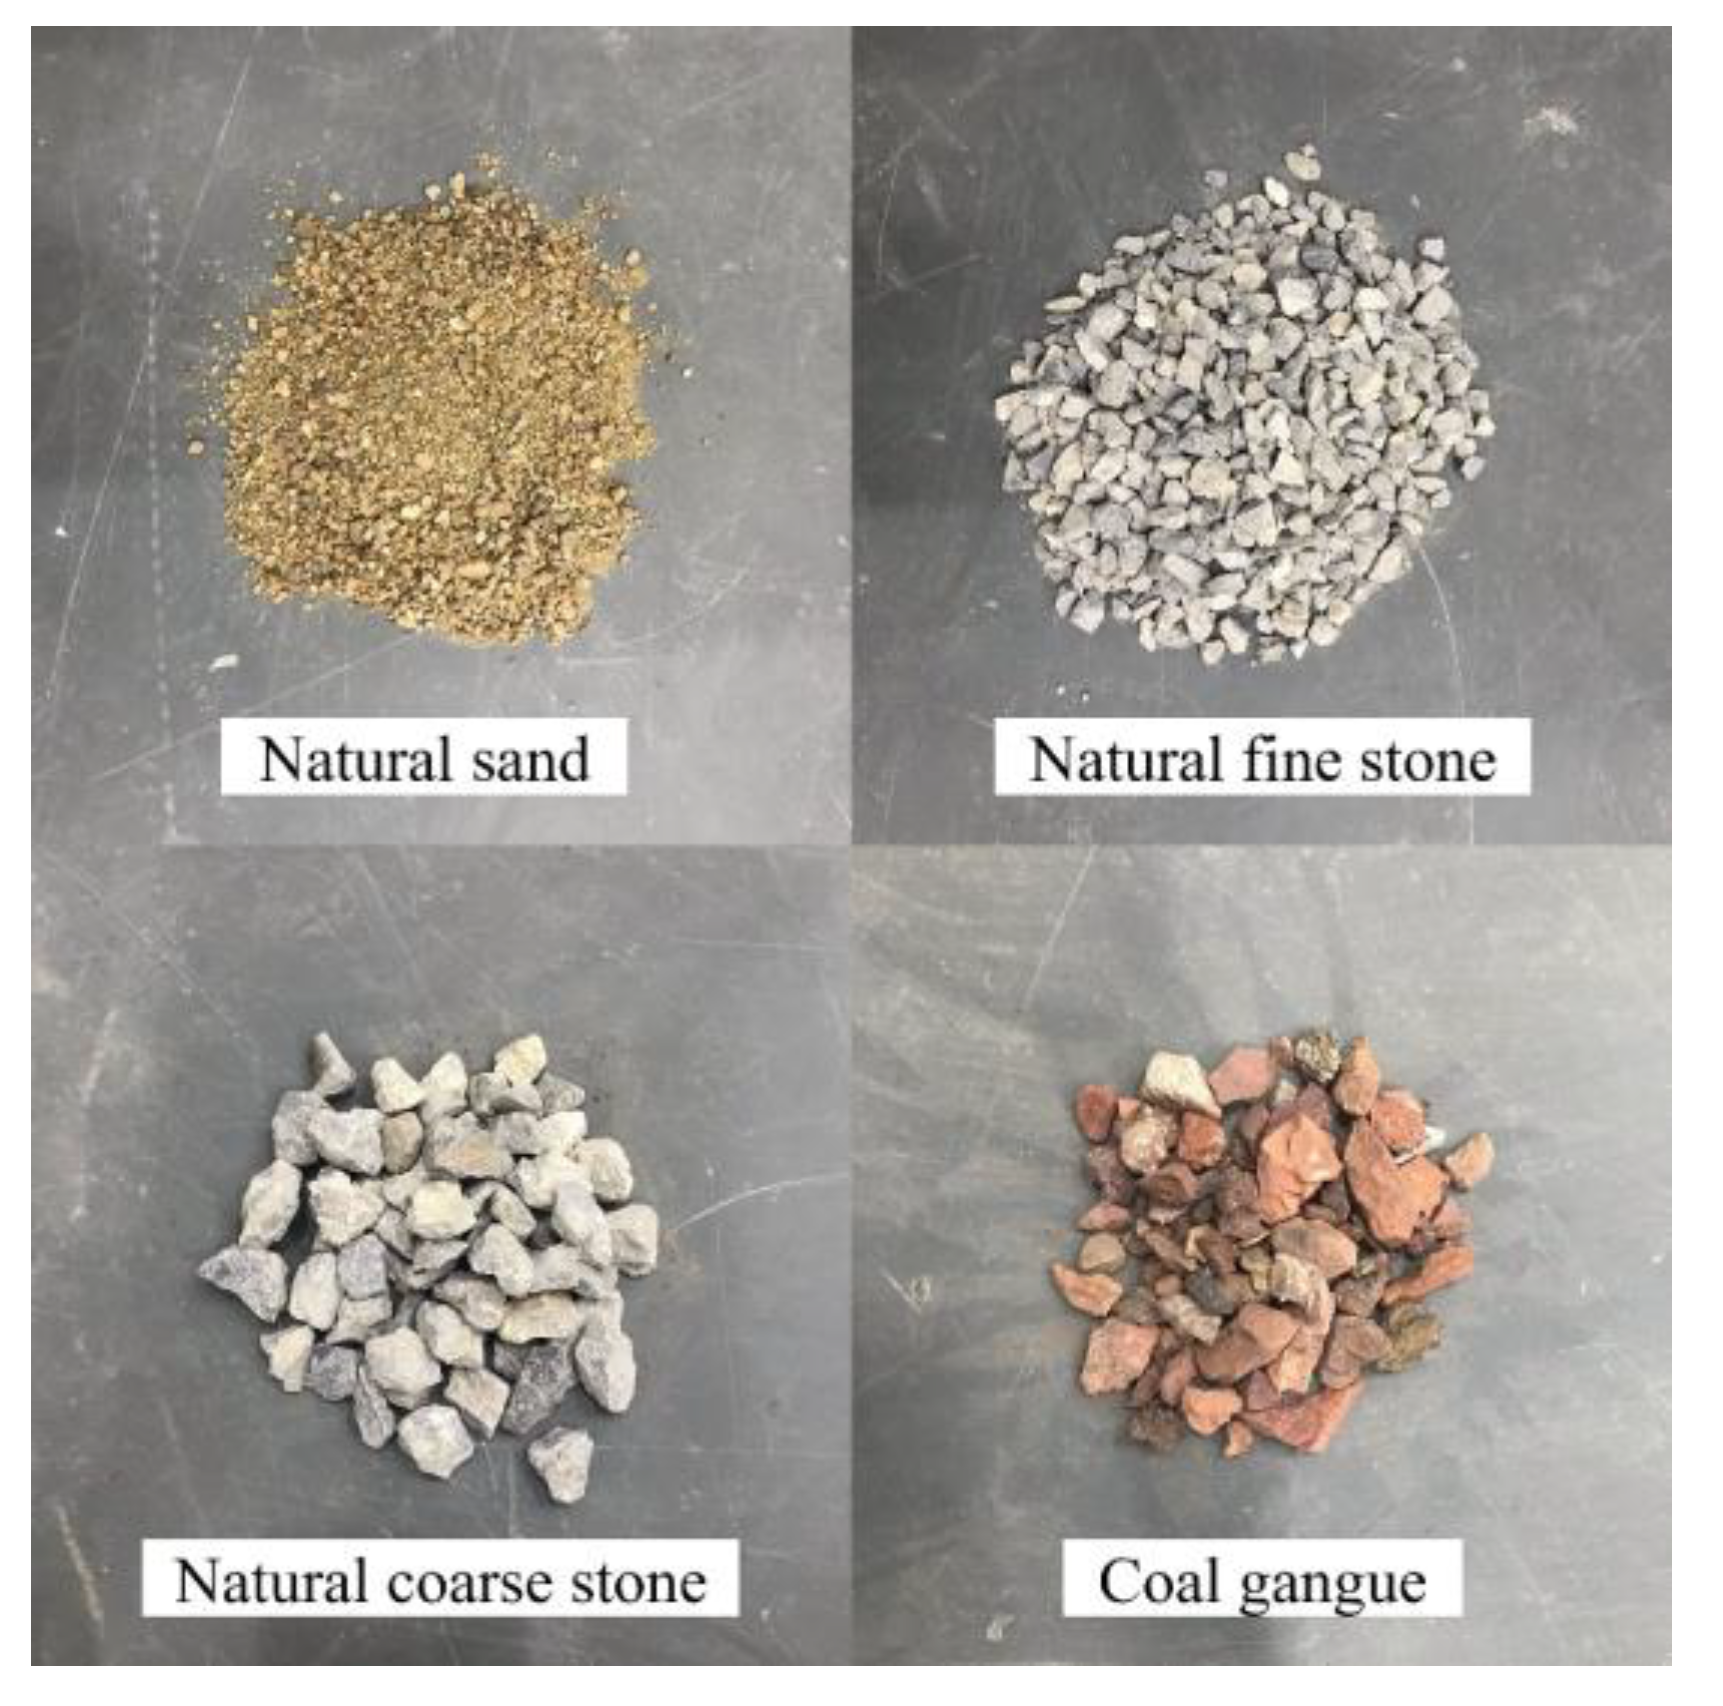
In this study, ordinary Portland cement and grade II fly ash were used as cementitious materials. Polycarboxylate superplasticizer with a water reducing rate up to 20% was used as the water reducing agent. Natural river sand with a fineness modulus of 3.06 was used as the fine aggregate. Natural crushed stone and spontaneous combustion coal gangue with particle sizes of 5–20 mm were used as coarse aggregates. The aggregate used for concrete is shown in Figure 3.

2.2.2. Basic Properties of Coal Gangue

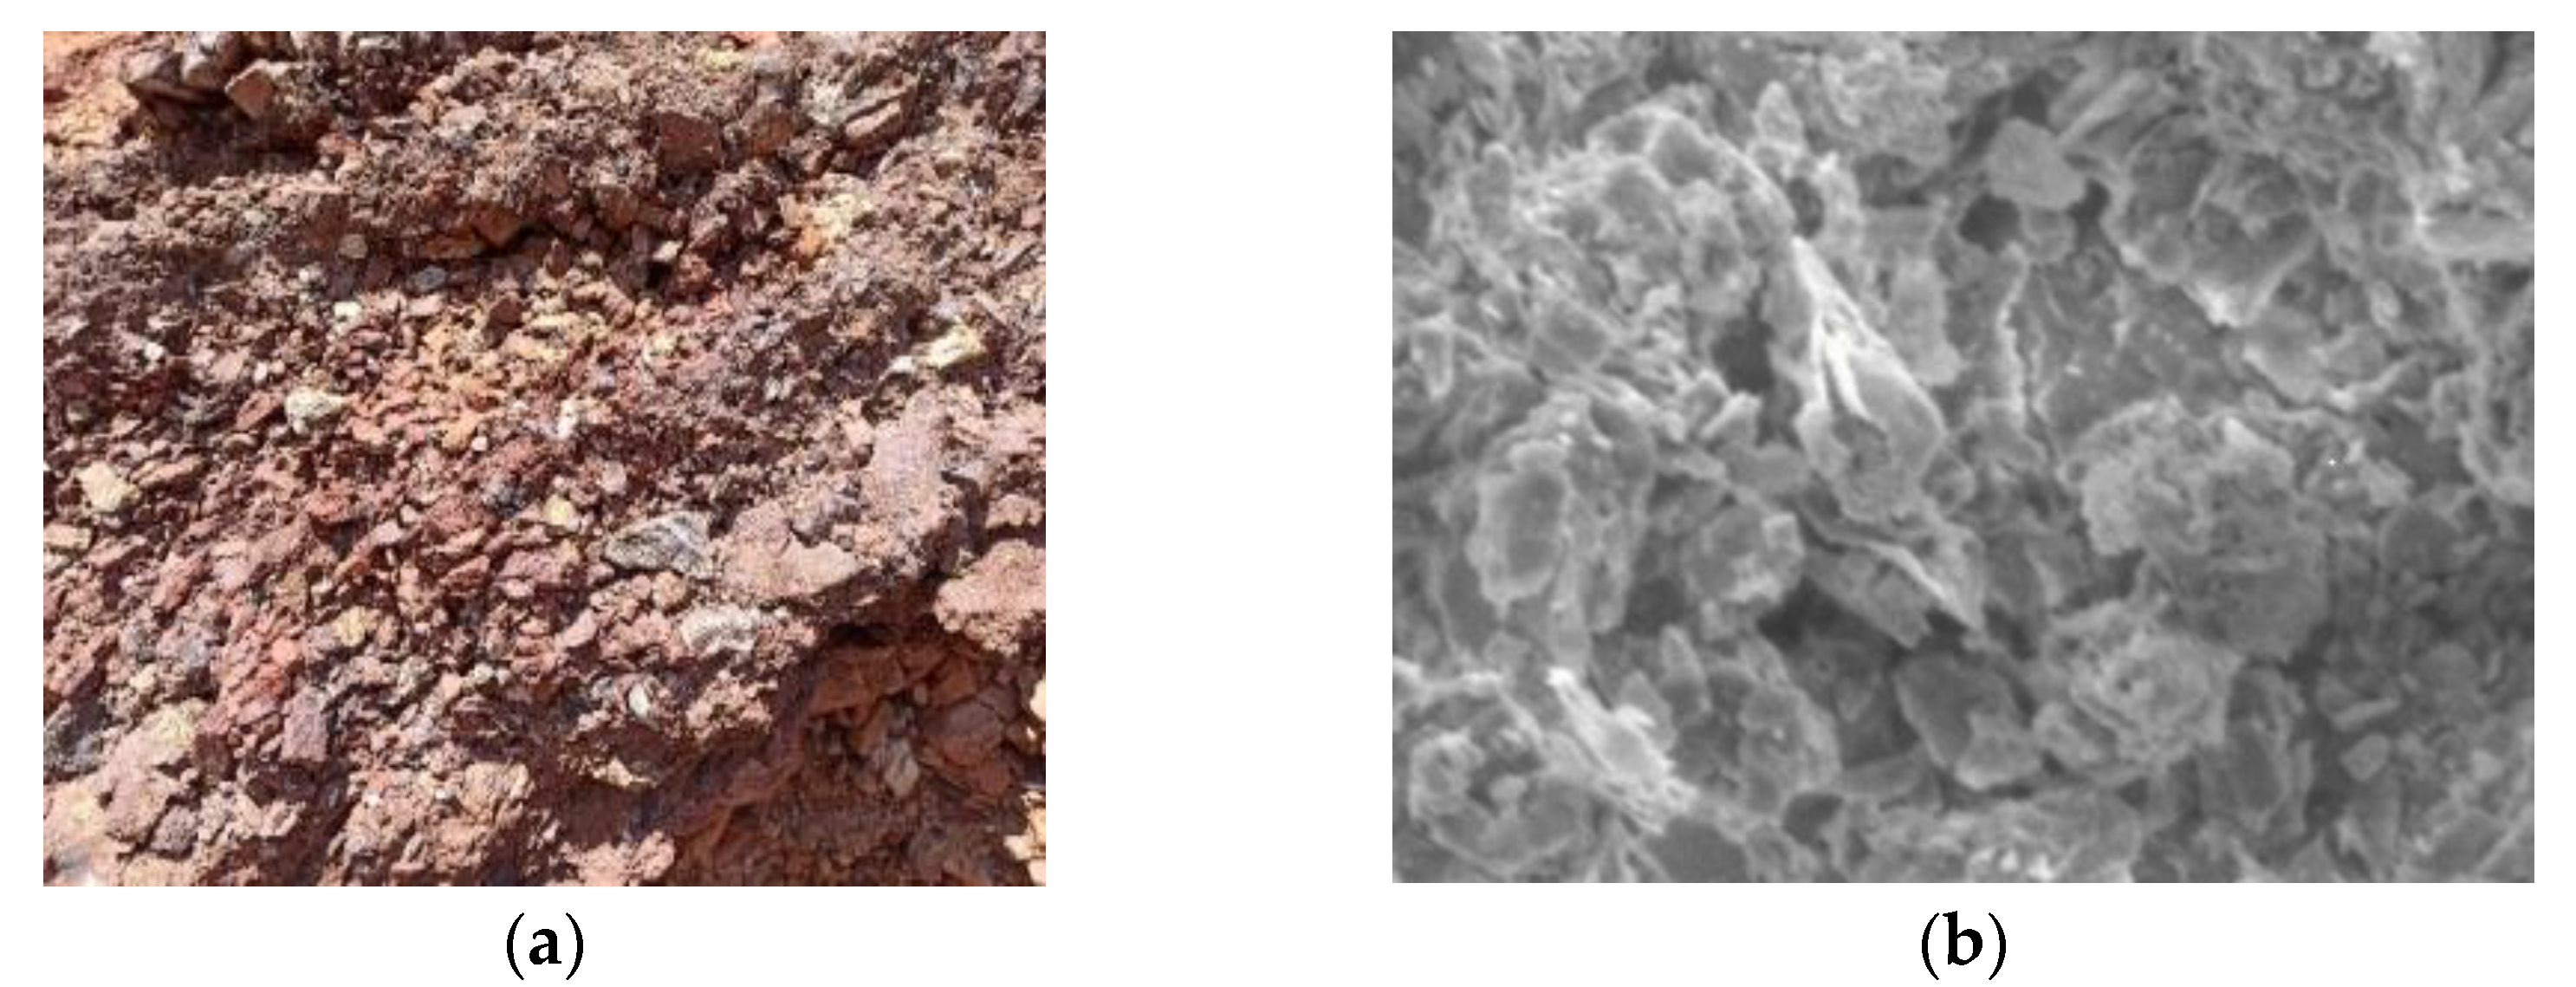
In this paper, the selected spontaneous combustion coal gangue is taken from Fuxin gangue mountain, its appearance and microscopic morphology are shown in Figure 4. The main chemical composition of coal gangue and natural coarse stone are shown in Table 2.
It can be seen from Table 2 that the main chemical composition of spontaneous combustion coal gangue is SiO2 and Al2O3, while the main chemical composition of the natural coarse stone is CaO. The principle is that there are certain differences between the formation of coal gangue and natural coarse stone, as well as the formation of regions. Therefore, there are some differences in the basic properties of coal gangue and natural coarse aggregates.
1.
Strength
Strength is one of the most important properties of concrete. Coal gangue is a discrete material, with a different original composition, the strength of coal gangue will change. However, the total strength of coal gangue is less than the natural coarse aggregate, which has a certain impact on the mechanical properties of concrete.
2.
Water absorption rate
The water absorption rate of spontaneous combustion coal gangue is significantly higher than that of natural coarse aggregate. The main reason is that spontaneous combustion coal gangue has large porosity and many micro-cracks, which can absorb water saturation in a short period of time. The saturation can reach 85% within 1 h and above 95% within 1 day. Due to the large porosity and high water absorption of spontaneous combustion coal gangue, the workability of concrete mixture construction is affected under the condition of direct use on site. Therefore, it was necessary to apply additional water to the coarse aggregate of spontaneous combustion coal gangue at 80% water absorption for prewetting treatment one hour before mixing [34].
3.
Bulk density and apparent density
With the increment of spontaneous combustion coal gangue porosity, density and apparent density of spontaneous combustion coal gangue can be lower than those of the natural coarse aggregate. Moreover, the mechanical action in the crushing process also enhances the possibility of internal microfractures.
4.
Crushing value
The crushing value of spontaneous combustion coal gangue is greater than that of natural coarse aggregate, indicating that the strength of spontaneous combustion coal gangue is lower. This is because spontaneous combustion coal gangue has many microfractures, large porosity, and loose structure. In the meantime, the characteristics of the material itself make it have a high content of needle-like particles in the crushing process. Therefore, the usage of spontaneous combustion coal gangue in concrete with high strength requirements should be restricted.
In summary, the basic performance of spontaneous combustion coal gangue is quite different from that of natural coarse aggregate, but it can still meet the basic requirements of coarse aggregate. Therefore, from the perspective of aggregate technical parameter requirements, spontaneous combustion coal gangue is feasible for preparing concrete below the C40 strength grade [35].

2.2.3. Material Properties Test

The mix proportion and main mechanical properties of coal gangue concrete are shown in Table 3. According to GB/T 50081-2002 [36], cube specimens with dimensions of 100 × 100 × 100 mm and prismatic specimens of 100 × 100 × 300 mm were prepared to test the concrete compressive strength and elastic modulus.
Due to the large water absorption rate of spontaneous combustion coal gangue, as well as to ensure that the moisture in the cement mortar is not absorbed, the size of the water-cement ratio is adjusted to ensure that the concrete strength grade is C30 [27].
According to GB/T 228.1-2010 [37], two types of reinforcements need to be set aside in advance, including three 500 mm steel bars in each group, and their mechanical properties were tested. The mechanical properties of the reinforcement obtained through tensile testing are shown in Table 4.

2.3. Loading Protocol

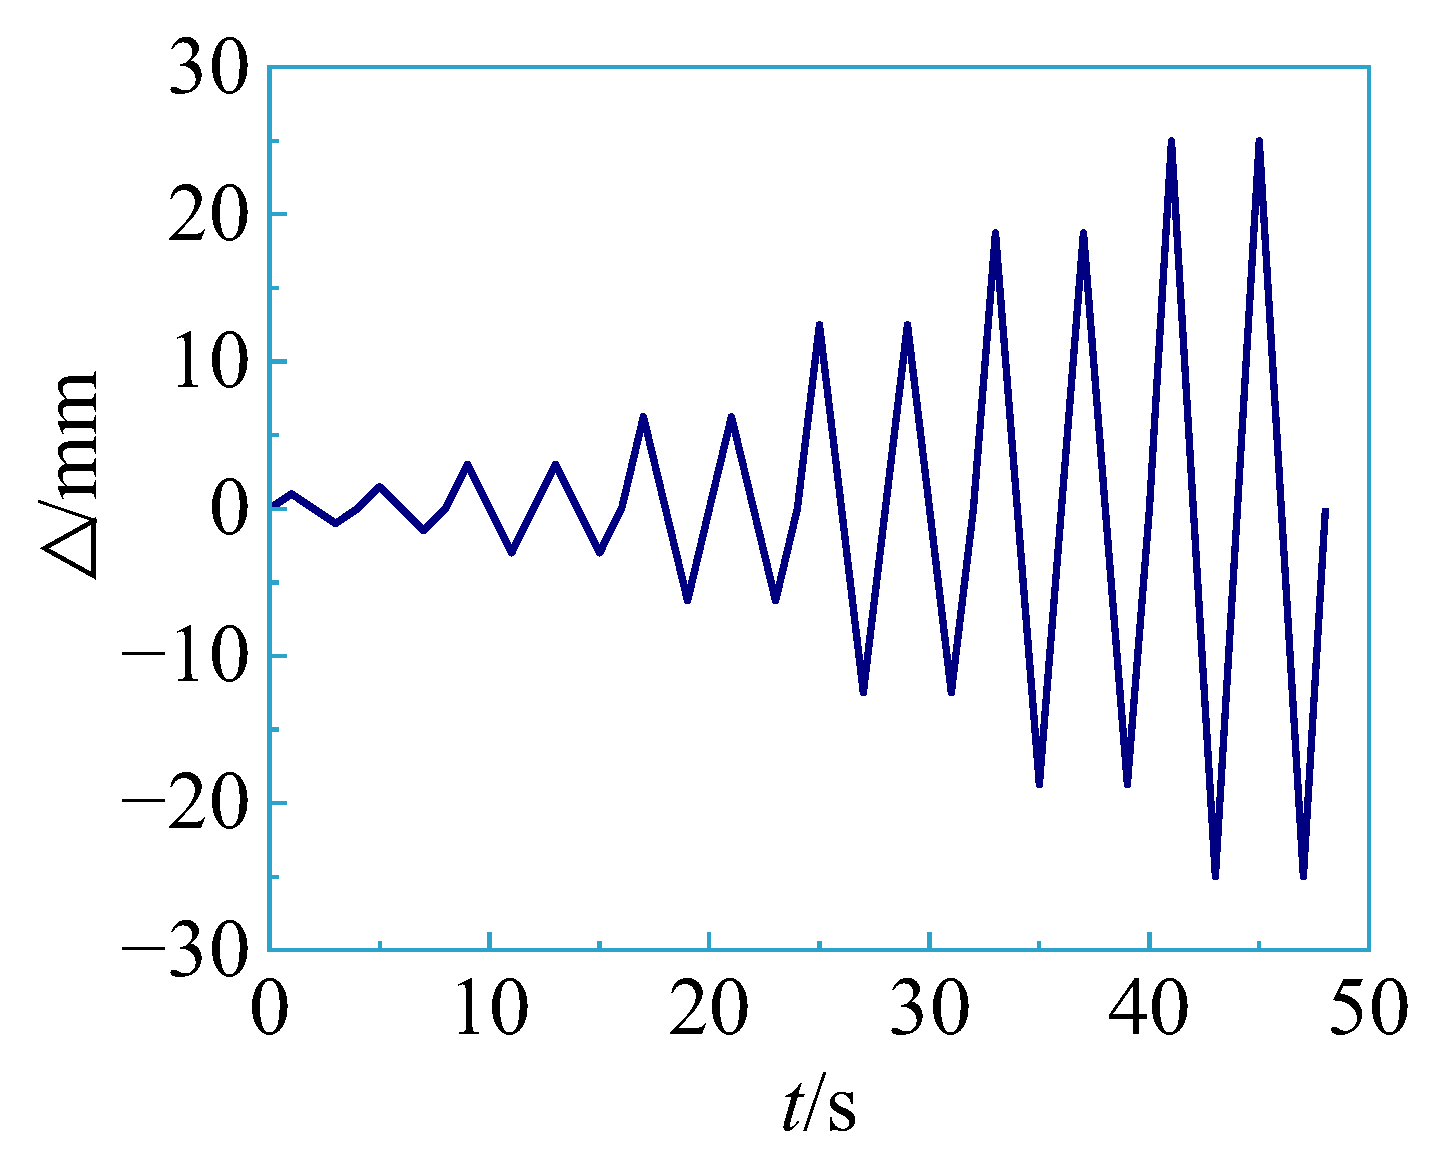
Each specimen was gradually loaded to the required value using a vertical jack, and the load remained constant throughout the test process, in which the axial compression ratio was 0.1. The horizontal jack was controlled by an oil pump to achieve lateral cyclic loading. It was difficult to determine the yield point of the specimen during the test, so displacement control loading was adopted. The drift ratio parameter θ = D/H was defined (where D was the displacement of the top of the specimen, and H was the height of the loading beam half of the specimen to the foundation beam). The test loading protocol was divided into seven levels. The preloading drift ratio θ was 1/1500; when the drift ratio θ < 1/240, the increment of θ was 1/1000; and when the drift ratio θ ≥ 1/240, the increment of θ was 1/240. The test loading protocol diagram is shown in Figure 5, and the specific values of the loading drift ratio are shown in Table 5.

2.4. Test Measurement

The experiment was carried out in the structural laboratory of Liaoning Technical University, and a quasi-static test method was used to simulate seismic action. The vertical load and horizontal displacement were applied through vertical and horizontal jacks during the whole test process, respectively, and the load and displacement were measured by force sensors and displacement meters. To ensure that the vertical load was uniformly transmitted to the entire specimen, a load distribution rigid plate was set. During the horizontal movement of the loading beam, the slip device needed to be set to ensure that the upper equipment could move horizontally with the loading beam. In the loading process, a spherical hinge was used to prevent deviation of the test data due to the tilt of the upper equipment. The foundation beam of the specimen was connected to the self-balancing reaction frame by high-strength bolts and an L-shaped consolidation steel plate to achieve vertical and out-of-plane constraints. The horizontal direction was constrained by a steel plate and high-strength bolt to achieve complete fixation at the bottom of the specimen. To prevent the influence of the slip of the foundation beam on the test results, a base slip displacement meter was placed on the foundation beam. The test setup is shown in Figure 6.
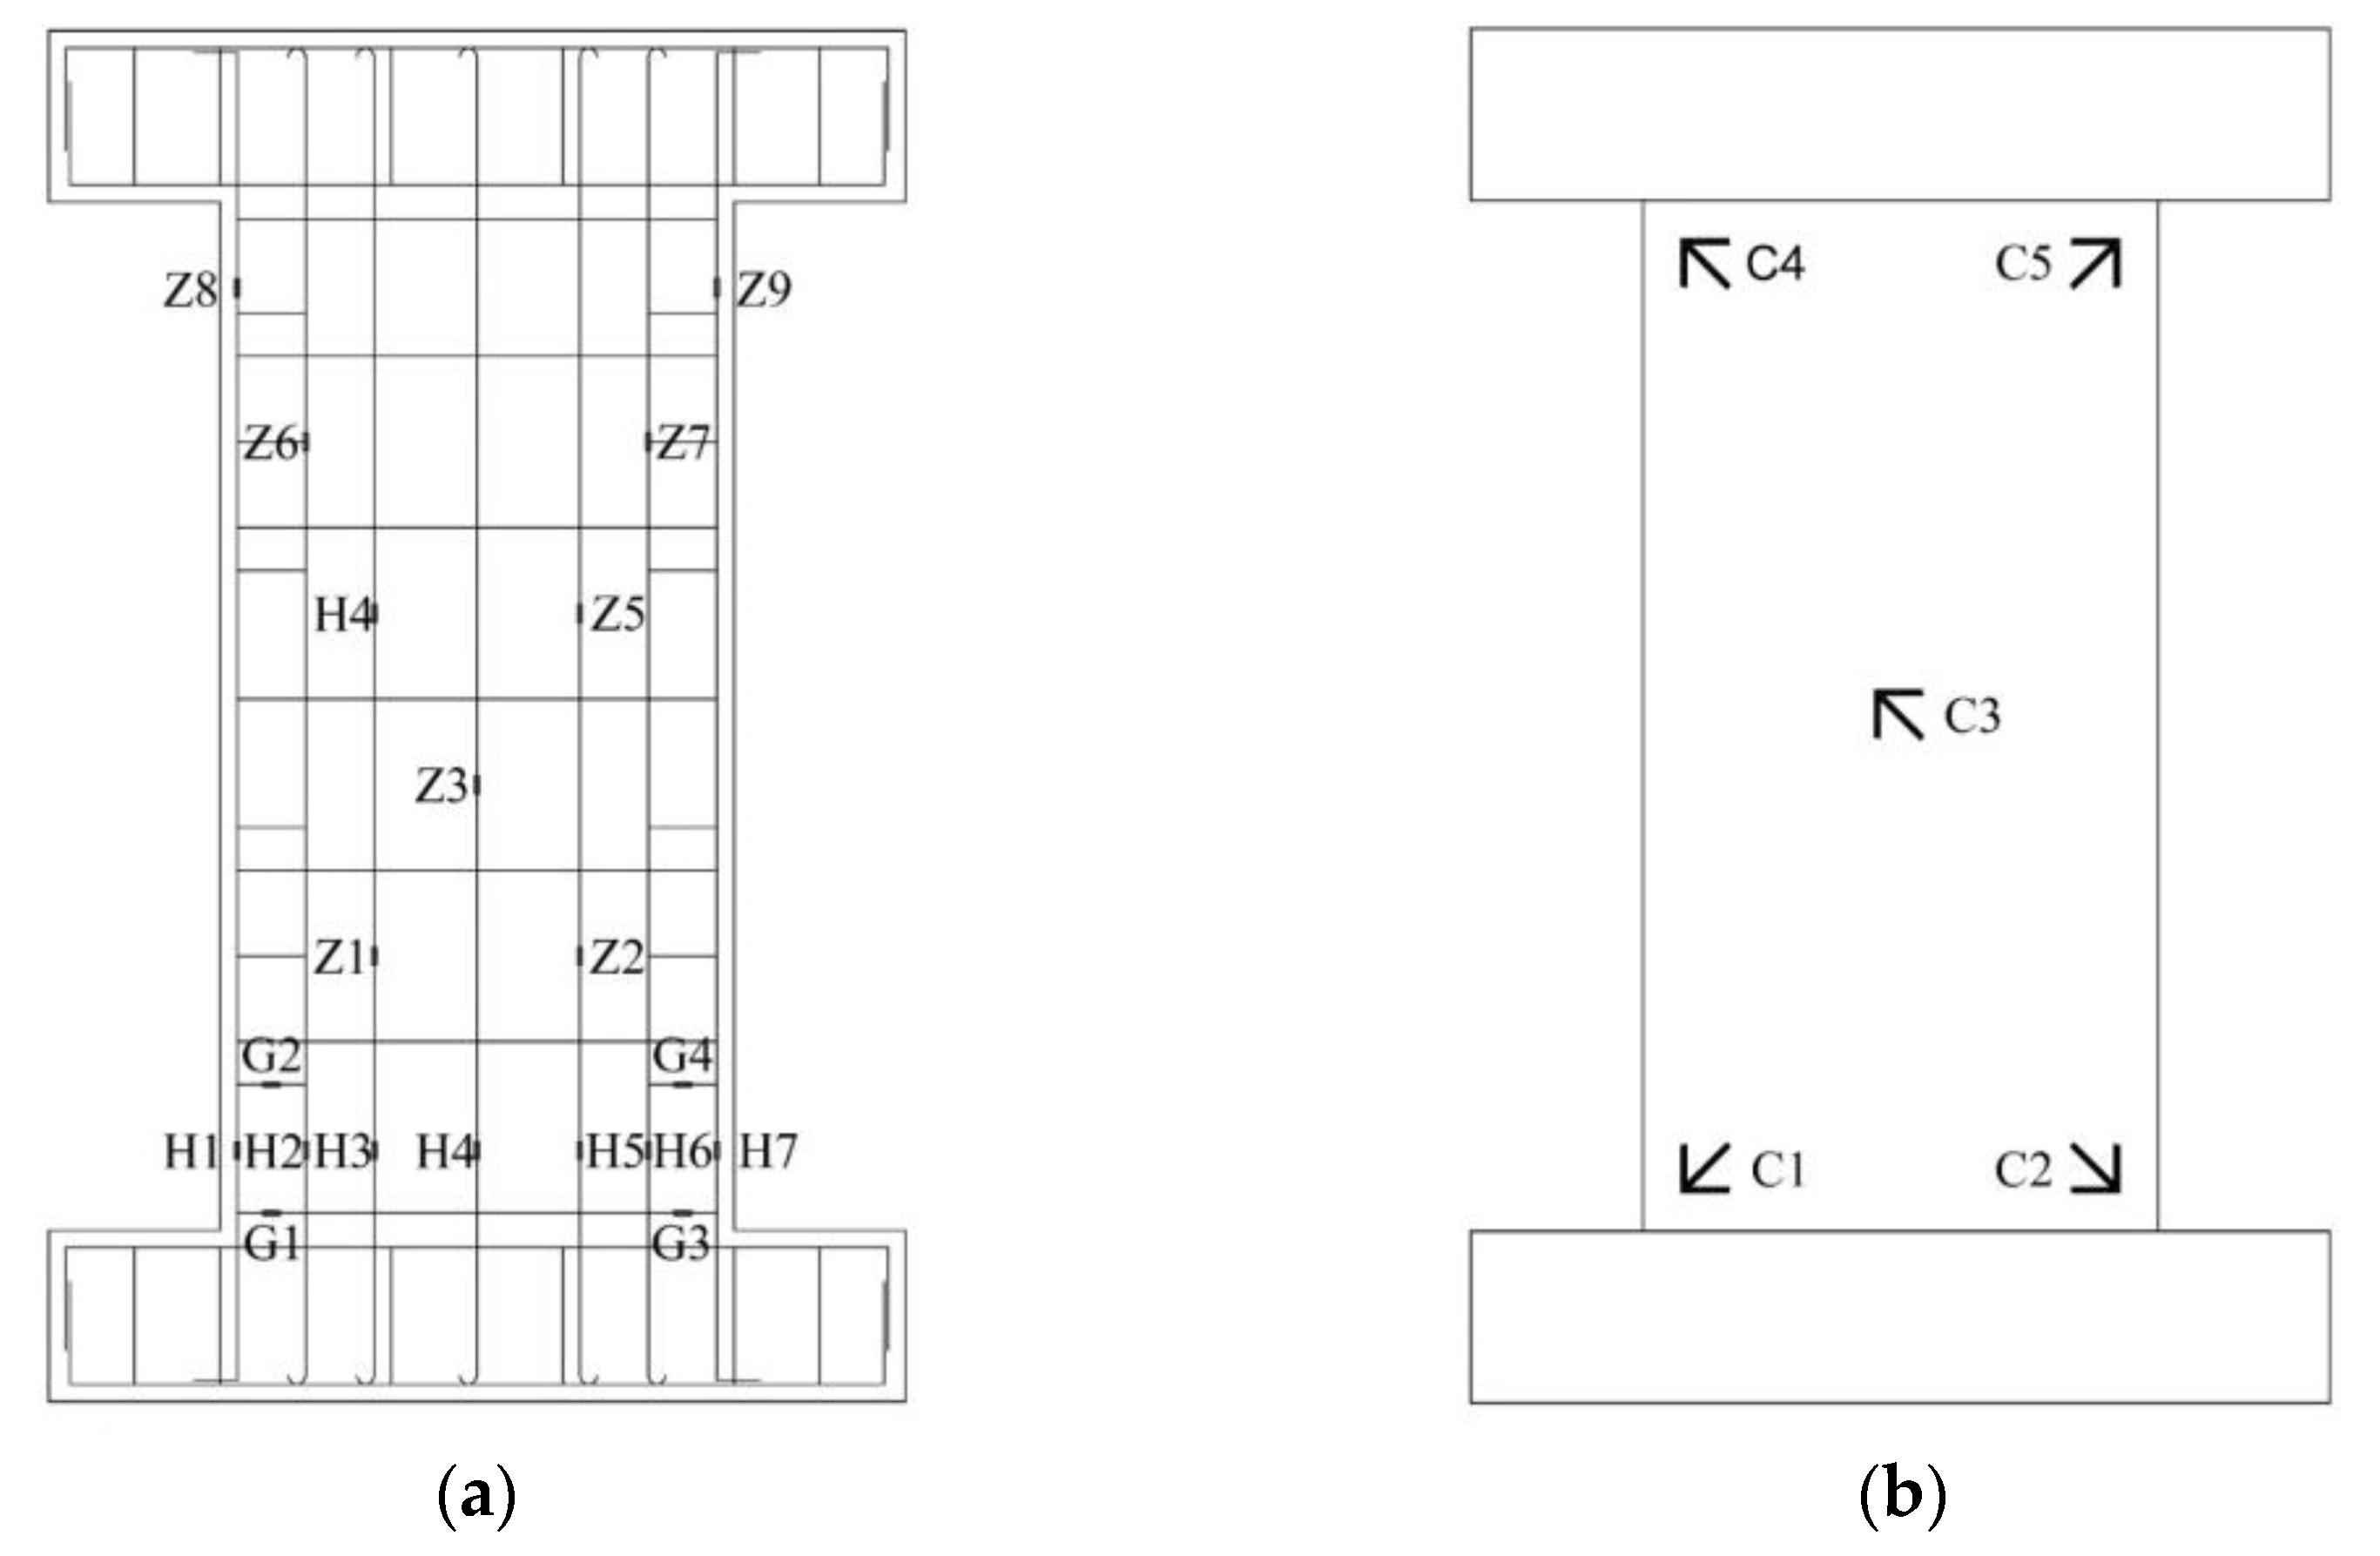
In the test, the reinforcement strain and concrete strain needed to be measured. To better study the stress characteristics of the plastic hinge zone of coal gangue concrete shear walls, reinforcement strain gauges were placed at the stirrups and longitudinal reinforcements at the bottom of each specimen. In addition, reinforcement strain gauges were obliquely arranged on the upper part of the longitudinal reinforcement. For concrete strain gauges, strain flowers were placed around and at the center of the specimen. The specific distribution of the strain gauges is shown in Figure 7, where G1–G4 are the strain gauges at the bottom of the stirrup, and H1–H7 are the strain gauges at the bottom of the longitudinal reinforcement, and Z1–Z9 are the strain gauges at the top of the longitudinal reinforcement.

3. Results and Discussion

3.1. Test Phenomenon

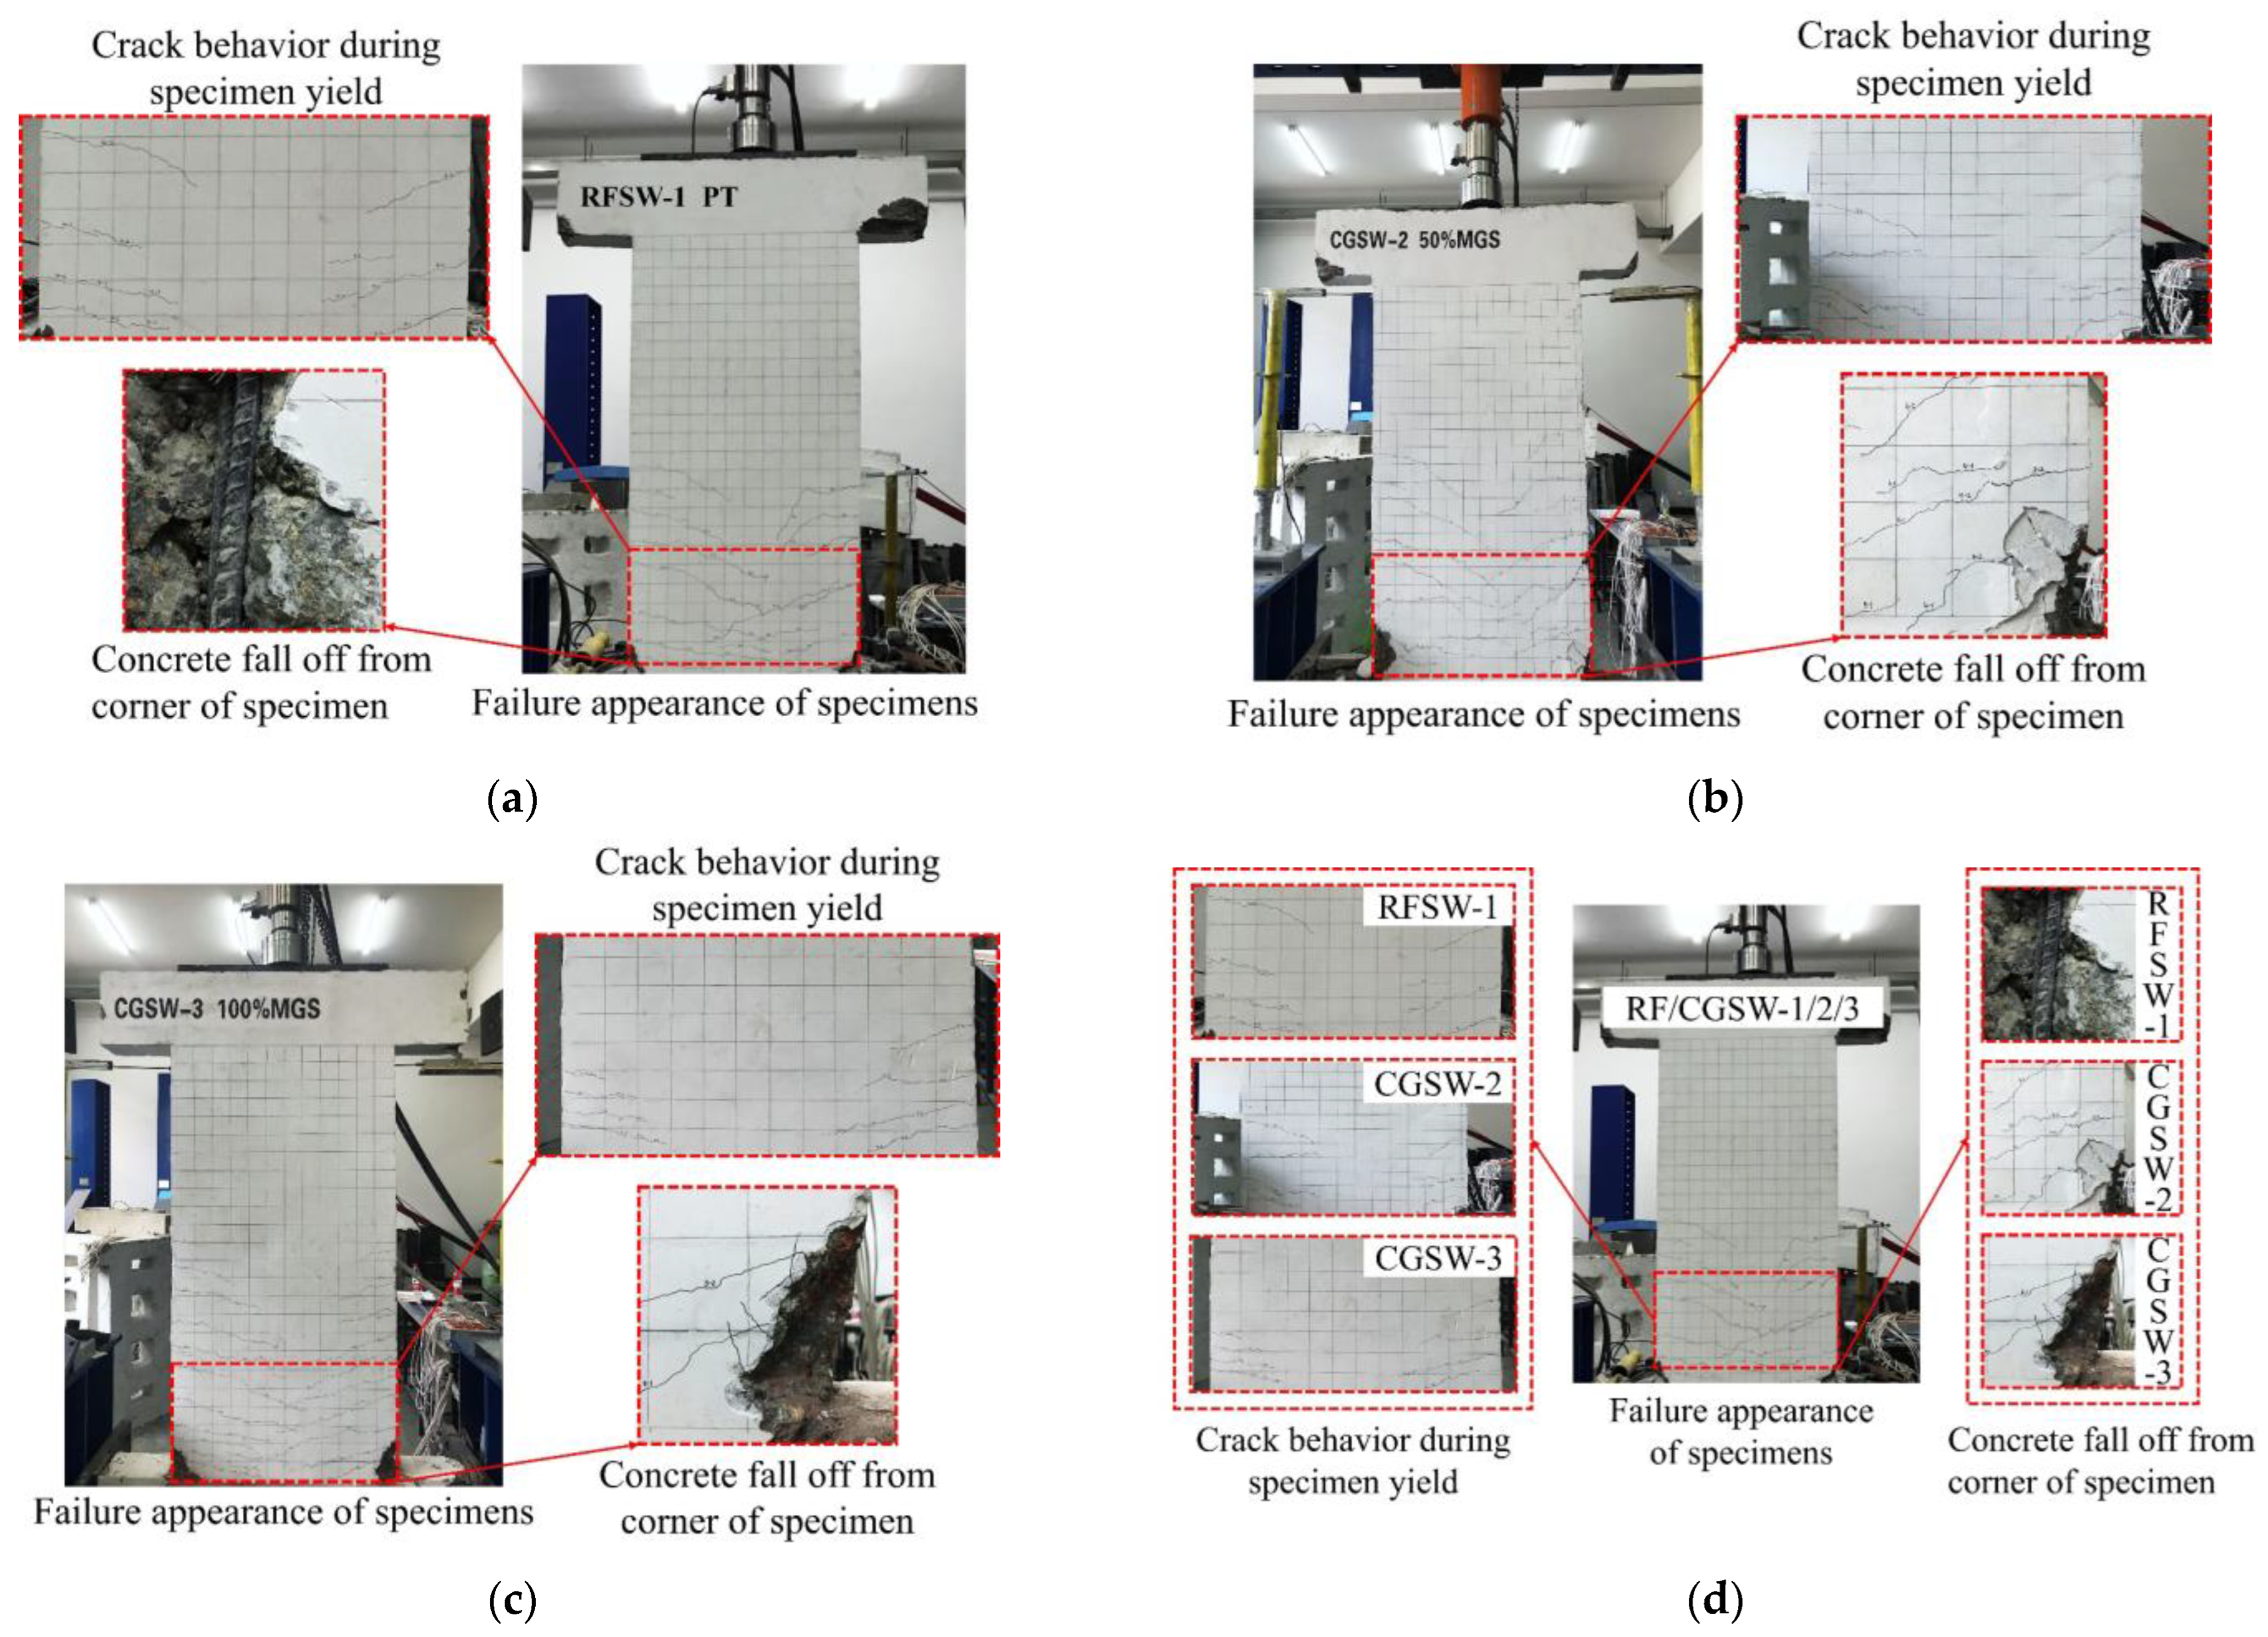
According to the experimental phenomena, stress performance and failure morphology of concrete shear wall specimens CGSW-2 and CGSW-3 mixed with coal gangue were similar to those of conventional concrete shear wall specimen RFSW-1. Horizontal cracks first appeared at the bottom of the specimen. As the horizontal displacement increased, horizontal cracks gradually developed obliquely, and the inclination angle of the diagonal crack increased with crack height. New horizontal cracks appeared continuously along the height of each specimen. With a further increase in horizontal displacement, the crack width became larger and more intensive. At the same time, a vertical crack appeared at the bottom of the hidden column. Finally, a main horizontal crack was formed at the bottom of each specimen. The concrete at the corner of the specimen was crushed from the specimen. At the same time, the longitudinal reinforcements of the specimen could be seen buckling and were exposed, and the bearing capacity of the specimen decreased gradually.
From the failure process and morphology of specimen RFSW-1, the cracks of the whole specimen were dense, uniform, and roughly symmetrical. In addition, the cracks were mainly concentrated at the bottom of the specimen. The height of the concrete falling off from the corner of the specimen wall was 75 mm, and the width was 50 mm. The highest crack was 550 mm from the foundation beam, and most of the cracks were horizontal-oblique development cracks. The specimen was fully damaged and had a typical bending-shear failure mode. Failure morphology of specimen RFSW-1 is shown in Figure 8a.
From the failure process and morphology of specimen CGSW-2, the crack distribution and cracking process of the specimen were not significantly different from those of specimen RFSW-1, but the number of cracks was slightly greater than that of specimen RFSW-1. Concrete falling ranges of the specimen corners on both sides of the specimen were 150 × 75 mm and 75 × 50 mm, respectively. The highest crack was 700 mm from the foundation beam. The specimen was seriously damaged and had a typical bending-shear failure mode. Failure morphology of specimen CGSW-2 is shown in Figure 8b.
From the failure process and morphology of specimen CGSW-3, the crack distribution and cracking process of the whole specimen were slightly different from those of specimens RFSW-1 and CGSW-2, but the number and width of cracks are greater than those of the other two specimens. The falling ranges of concrete on both sides of the specimen were 100 × 75 mm and 125 × 50 mm, respectively. The highest crack was 650 mm from the foundation beam, and the specimen exhibited bending-shear failure. Failure morphology of specimen CGSW-3 is shown in Figure 8c.
It can be seen from the destruction process of the three specimens that the difference between the coal gangue-made shear wall and the ordinary concrete-made shear wall is not obvious. The damaged area for the former is larger, because the coal gangue shear wall is more seriously damaged than the natural coarse aggregate when it is subjected to lateral cyclic loading. As the spontaneous combustion coal gangue forms more flaky blocks in the coal seam, it is easier to form needle flakes when crushed. Therefore, the grain shape of the spontaneous combustion coal gangue is worse than that of natural coarse aggregate. Nevertheless, since the needle-like aggregate will adversely affect the working capacity and strength of concrete, the shear wall made of coal gangue has a larger area of damage than the ordinary concrete shear wall.

3.2. Hysteretic Curve

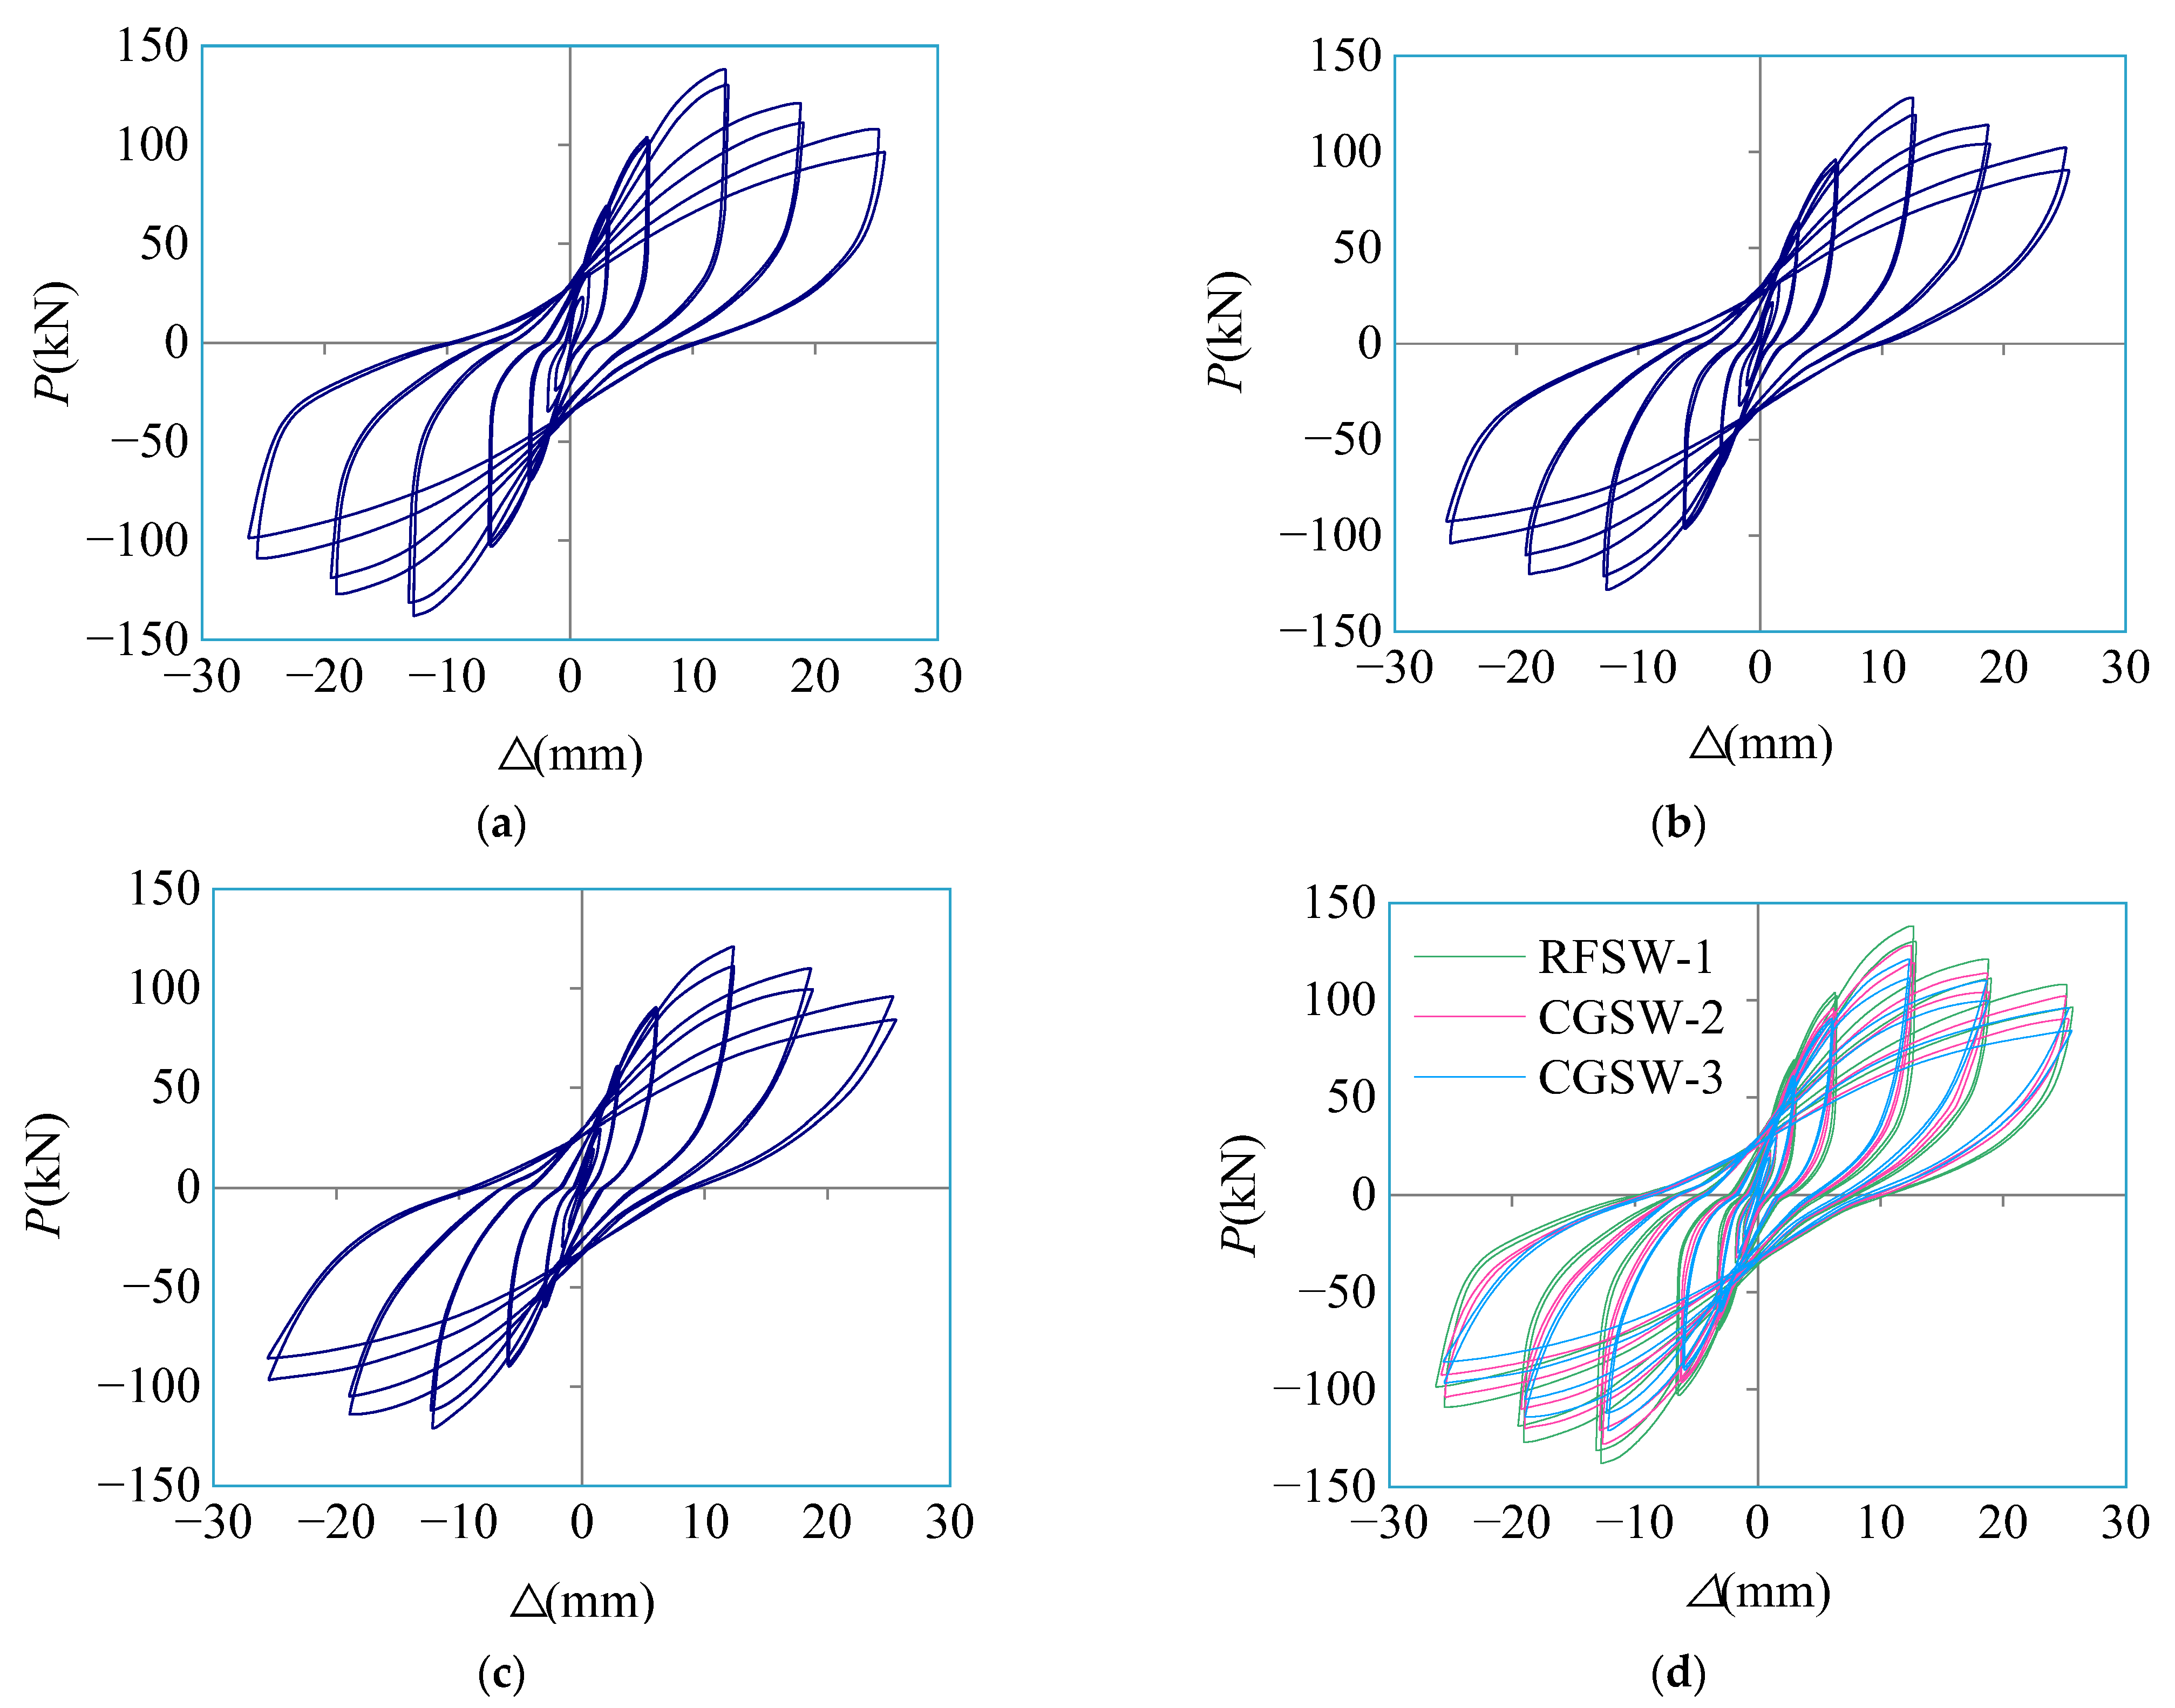
In this paper, a specimen inclined to the left was called a “push” specimen, and the horizontal force and displacement were recorded as positive values. Otherwise, it was called a “pull” specimen, and horizontal force and displacement were recorded as negative. The hysteretic curves of the three specimens obtained from the test are shown in Figure 9.
Figure 9 shows that the hysteretic curves of the specimens with different coal gangue replacement rates are roughly the same. First, the hysteretic curve of each specimen is close to the oblique line before the crack occurs, and the bearing capacity changes linearly with the horizontal displacement. In addition, the area of the hysteretic loop is small, the residual deformation is close to zero, and the energy dissipation capacity of the specimen can be ignored. This is due to the small lateral cyclic loading on the specimen and the elasticity stage of the specimen. With the increase in horizontal displacement, the specimen began to crack. Meanwhile, the shape of the hysteretic curve is slender and narrow, and the relationship between load and displacement is no longer linear. The energy dissipation of the specimen is not obvious. When the specimen reaches the yield state, a bond slip occurs between the steel and concrete, and the hysteretic loop shows a “pinching” phenomenon. In addition, the unrecoverable residual deformation of the specimen occurs, and the energy dissipation of the specimen is obvious. When the specimen reaches the peak state, the hysteretic loop is fuller. Until the load capacity decreased to 0.85 times the peak load, the specimen that reached the limit state was unable to continue the test, the hysteretic curve exhibited large residual deformation, and the specimen showed good energy dissipation capacity.
The hysteretic curves obtained from the test are not completely symmetrical. Because there is residual deformation after forward unloading and the residual deformation needs to be offset when reverse loading, the reverse displacement can increase, and there is a virtual displacement in the test process. In addition, due to the existence of a vertical load in the test process, the slip device at the top of the specimen produces large friction, which will have a certain impact.
Comparing the hysteretic curves of the specimens, as the replacement rate of coal gangue increases gradually, the plumpness of the hysteretic curve decreases, and the residual deformation reduces gradually, indicating that the energy dissipation capacity gradually deteriorates. In addition, the compressive strength and elastic modulus of coal gangue concrete are lower than those of conventional concrete. Therefore, with increasing coal gangue replacement rate, the peak load and the ultimate displacement of the specimen are gradually reduced.

3.3. Backbone Curve

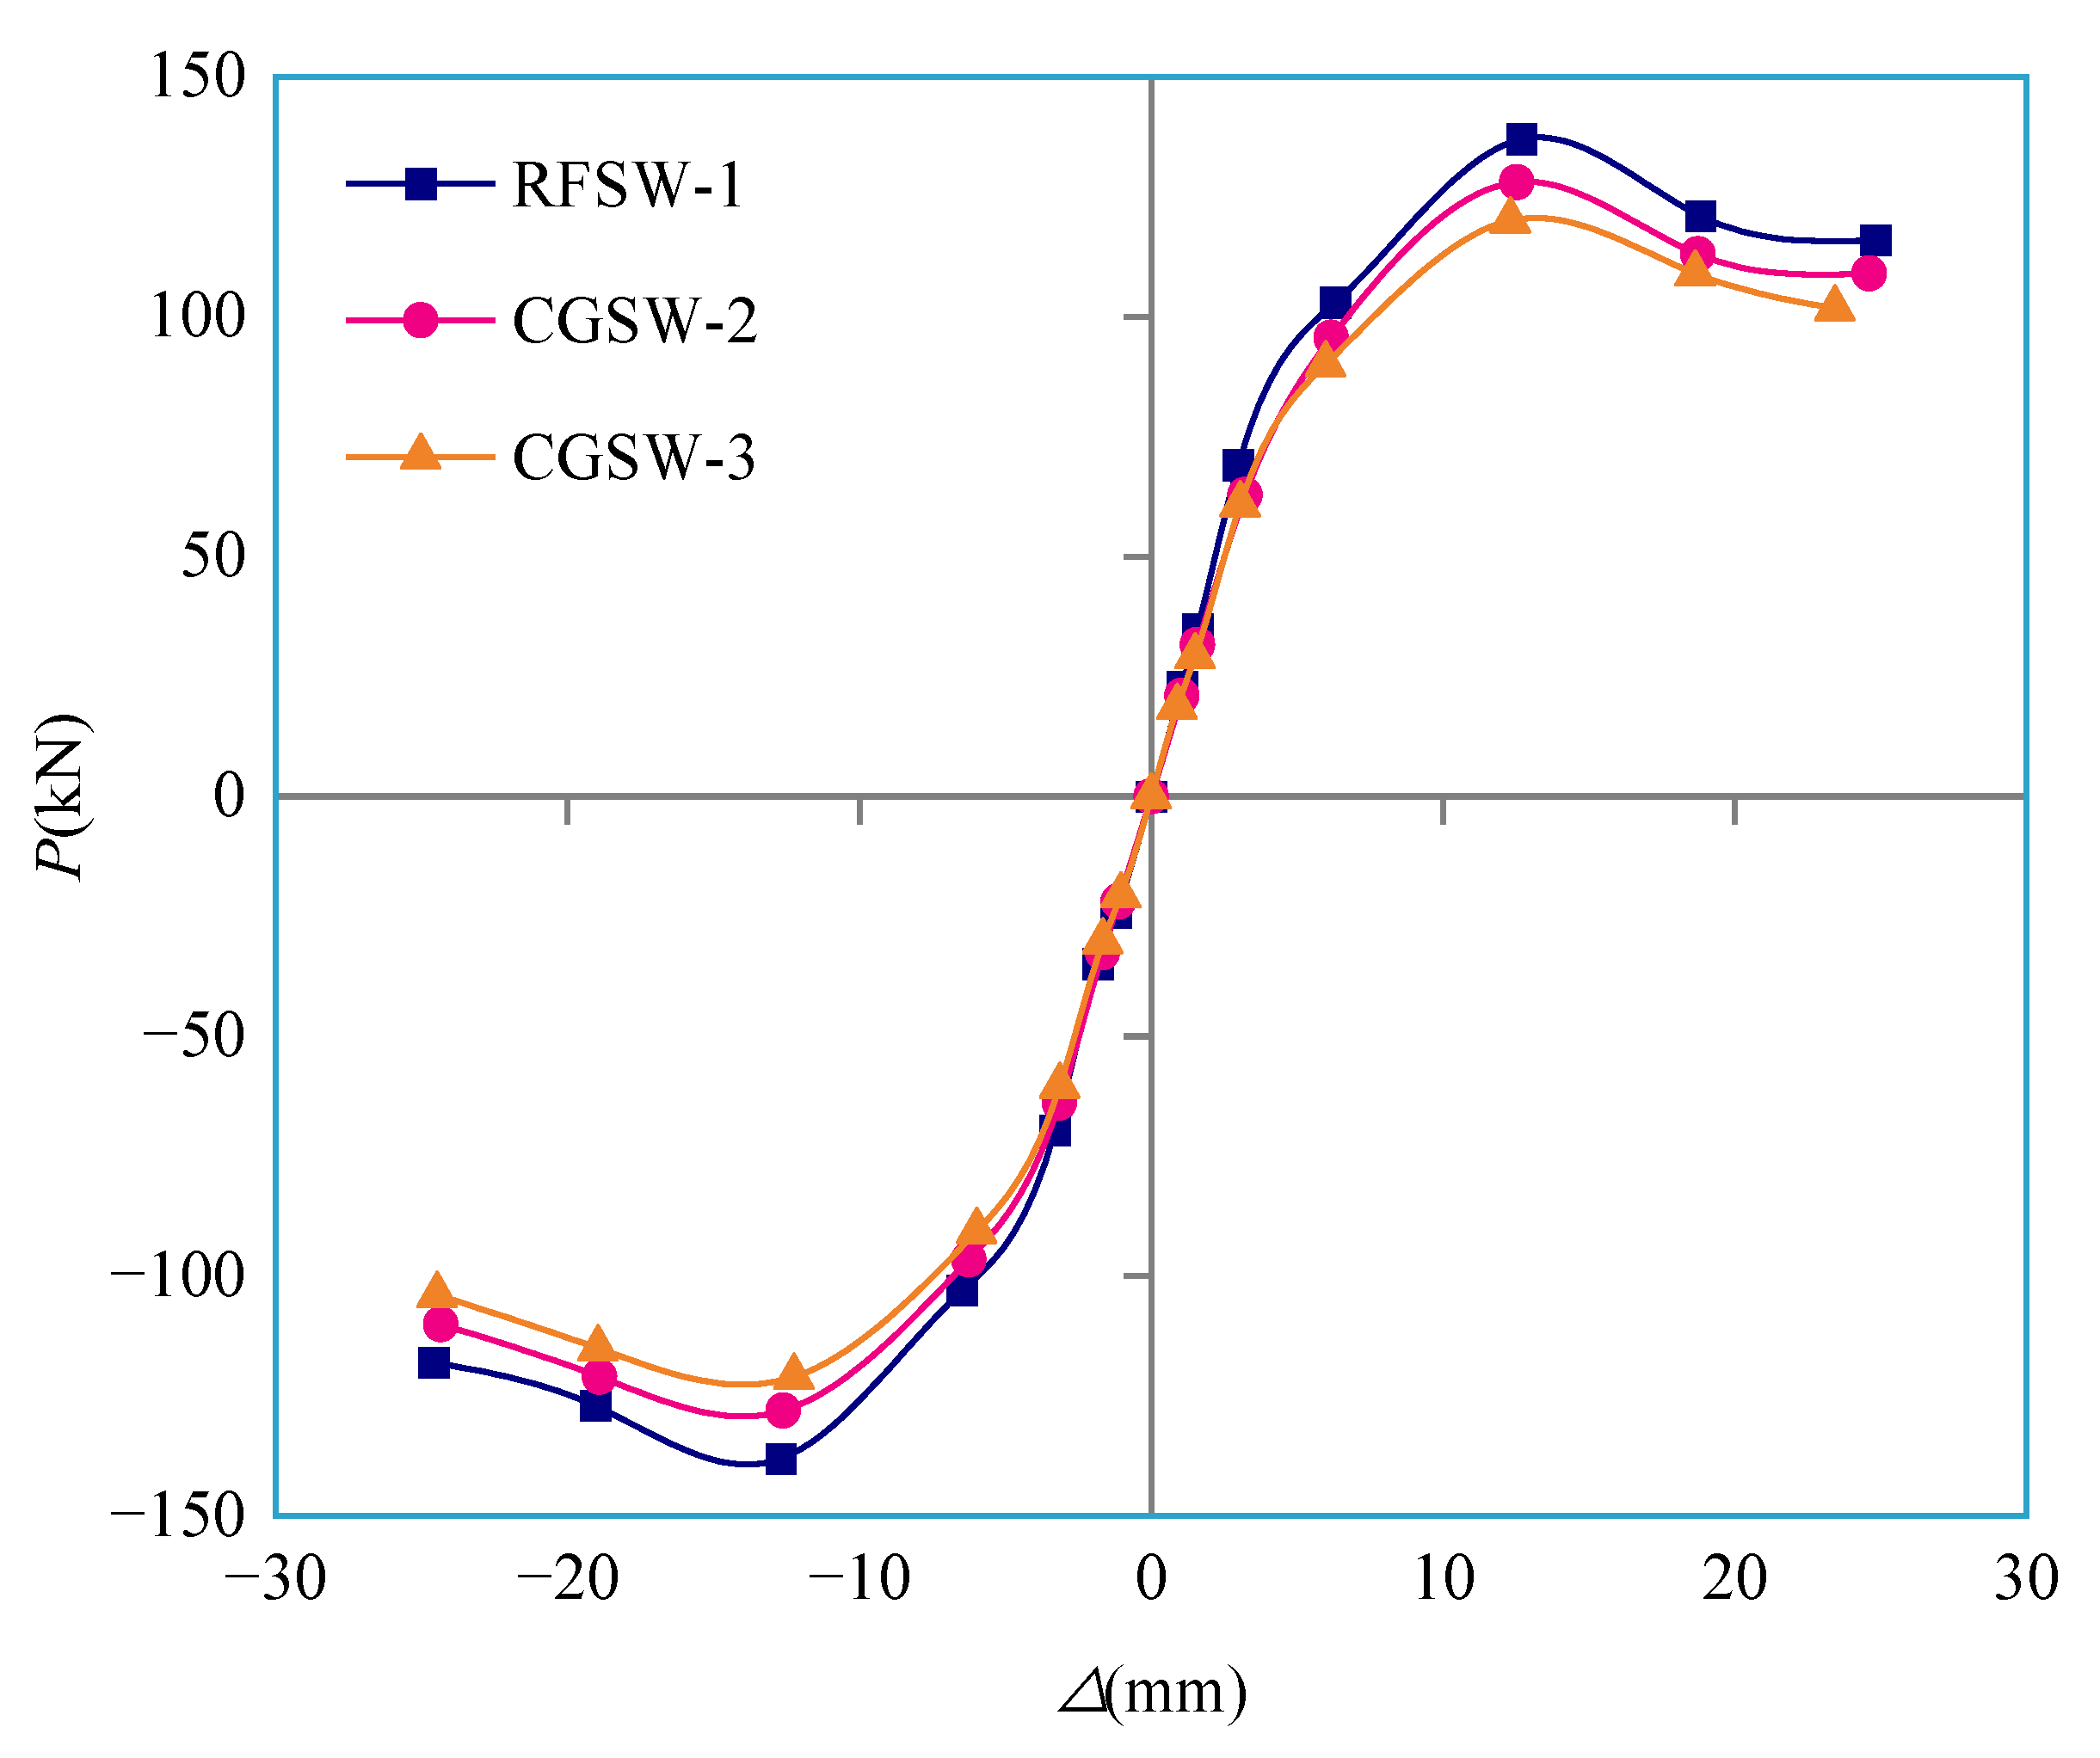
The backbone curve of each specimen can reflect the structural characteristics at different stages, including strength, stiffness, ductility, energy dissipation capacity, and collapse resistance. The backbone curves of the specimens in this test are shown in Figure 10.
Figure 10 shows that the three backbone curves are divided into ascending and descending stages, without abrupt changes in bearing capacity and stiffness, and the curves are smooth, showing the characteristics of typical backbone curves. At the same time, the stiffness and bearing capacity of the specimen change with the state of the specimen. From the initial stage of loading to the cracking point, the backbone curve is approximately straight, and the inclination angle is large, indicating that the stiffness of each specimen is maximum at the beginning, and the bearing capacity also increases, which is in the elastic state. The backbone curve of each specimen flattens gradually after cracking, indicating that the stiffness is gradually degraded, and the bearing capacity continues to increase until the yield point. The bearing capacity of the specimen increases slowly after yielding. After the specimen reaches the peak point, the backbone curve is in the descending stage, and the bearing capacity decreases sharply until the specimen is destroyed.
By comparing the backbone curves of the specimens, the slope of the backbone curve gradually decreases with the increasing coal gangue replacement rate, indicating that the initial stiffness of the specimens gradually decreases. In addition, the larger the replacement rate of coal gangue is, the smaller the bearing capacity and ultimate displacement of the specimen are.

3.4. Load Carrying Capacity

The load values corresponding to the characteristic points of the specimens are shown in Table 6. Because positive and negative bearing capacities are asymmetric, the values in the table are the average values of the positive and negative load values.
In this paper, the geometric mapping method is selected to determine the yield point of the specimen, as shown in Figure 11. The Y point determined by the method of Figure 11 is the yield point. The ultimate point is defined when the horizontal bearing capacity of the descending section of the specimen backbone curve drops to 0.85 times the peak load, or the horizontal bearing capacity does not drop to 0.85 times peak load, but the specimen can no longer withstand the load.
In Figure 11, Point O represents the origin point, Point A represents the peak point, Point Y represents the yield point, and Point B, C and D represent the auxiliary point. Besides, Fm represents the peak load, Fy represents the yield load, Δu represents the ultimate displacement, Δm represents the peak displacement, and Δy represents the yield displacement.
Table 6 shows that with the increase in the coal gangue replacement rate, the load values at the characteristic points of the three specimens decrease. Horizontal ultimate bearing capacity of specimen RFSW-1 is the largest. Compared with specimen RFSW-1, the peak load of specimens CGSW-2 and CGSW-3 decreases by 6.8% and 12.4%, respectively, while the yield load decreases by 5.6% and 8.5%, respectively, indicating that the increase in the coal gangue replacement rate will reduce the horizontal bearing capacity of the concrete shear wall specimens.
This is because the strength of spontaneous combustion coal gangue is between natural coarse aggregate and light aggregate, and the destruction surface of spontaneous combustion coal gangue is generally along its joint surface. So, the joint surface has become the weak link of spontaneous combustion coal gangue. On one hand, the strength of the joint surface is lower than the overall strength. On the other hand, with the increasement of the mortar strength, the aggregate strength will be even lower than the mortar strength. Thus, the concrete strength is controlled by the mortar to the aggregate. Above all, even if the amount of cement is increased, it is not significant to improve the strength. The strength of the concrete not only depends on the distribution of the joints of the spontaneous combustion coal gangue aggregate, but also relates to the strength along the direction of the joint. Therefore, the horizontal bearing capacity of coal gangue concrete shear wall is lower than that of the ordinary concrete shear wall, and with the increase of coal gangue replacement rate, the horizontal bearing capacity gradually decreases.
The yield ratio, defined as the ratio of the yield load to the peak load, can reflect the strength reserve capacity of the structure. A small yield ratio indicates the safety of the specimen, but if the yield ratio is too small, the strength cannot be fully utilized, and the material is wasted. According to Table 6, the larger the replacement rate of coal gangue is, the larger the yield ratio of the specimen is, indicating that the strength reserve capacity becomes worse. However, there is no significant difference in the yield ratio of the specimens, and they are all less than 0.85, indicating that they have good strength reserve capacity.

3.5. Steel Strain

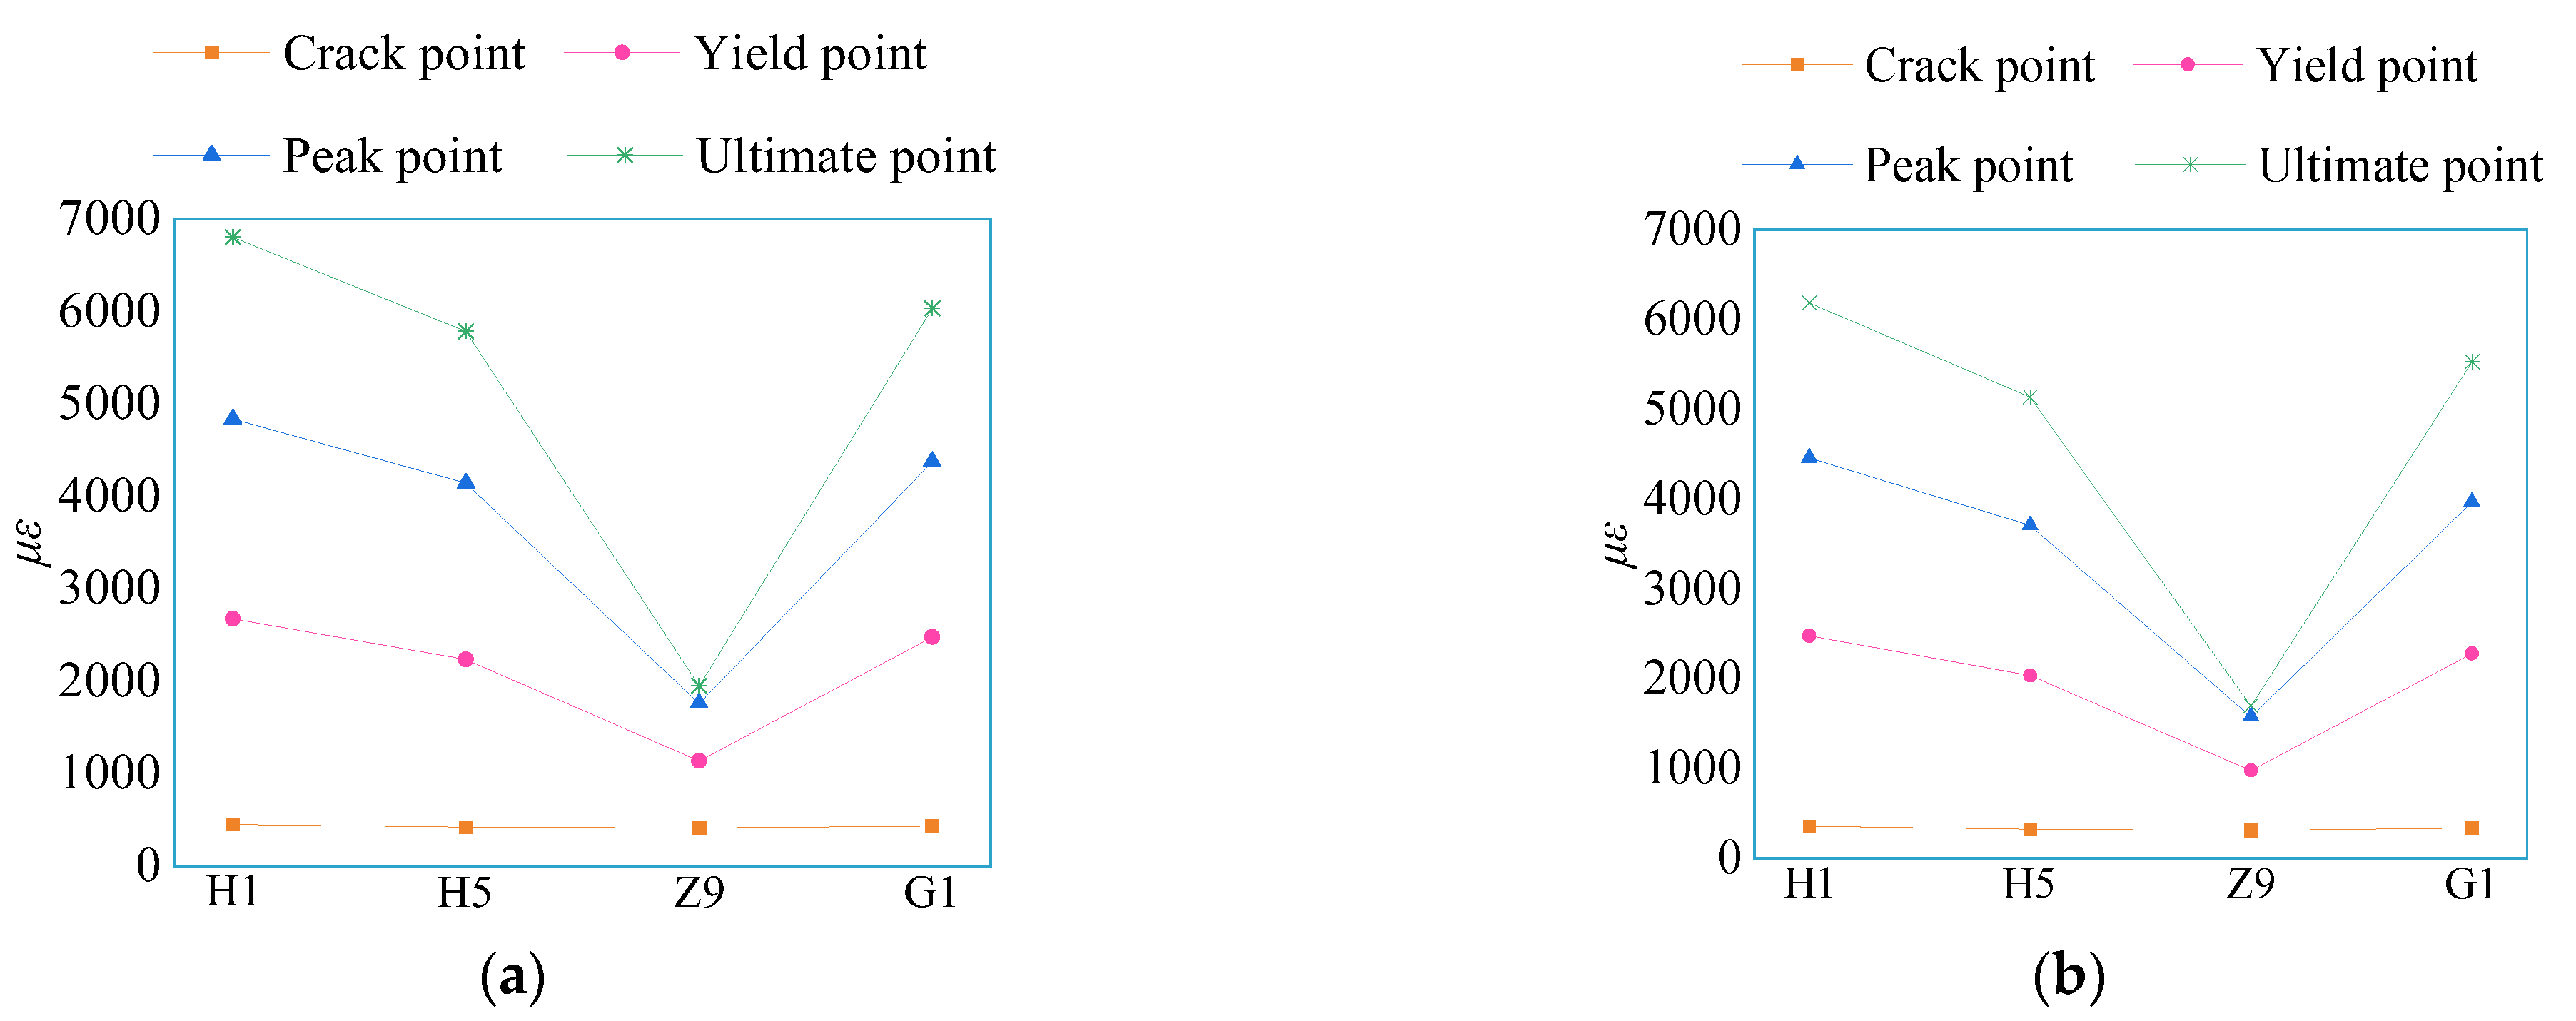
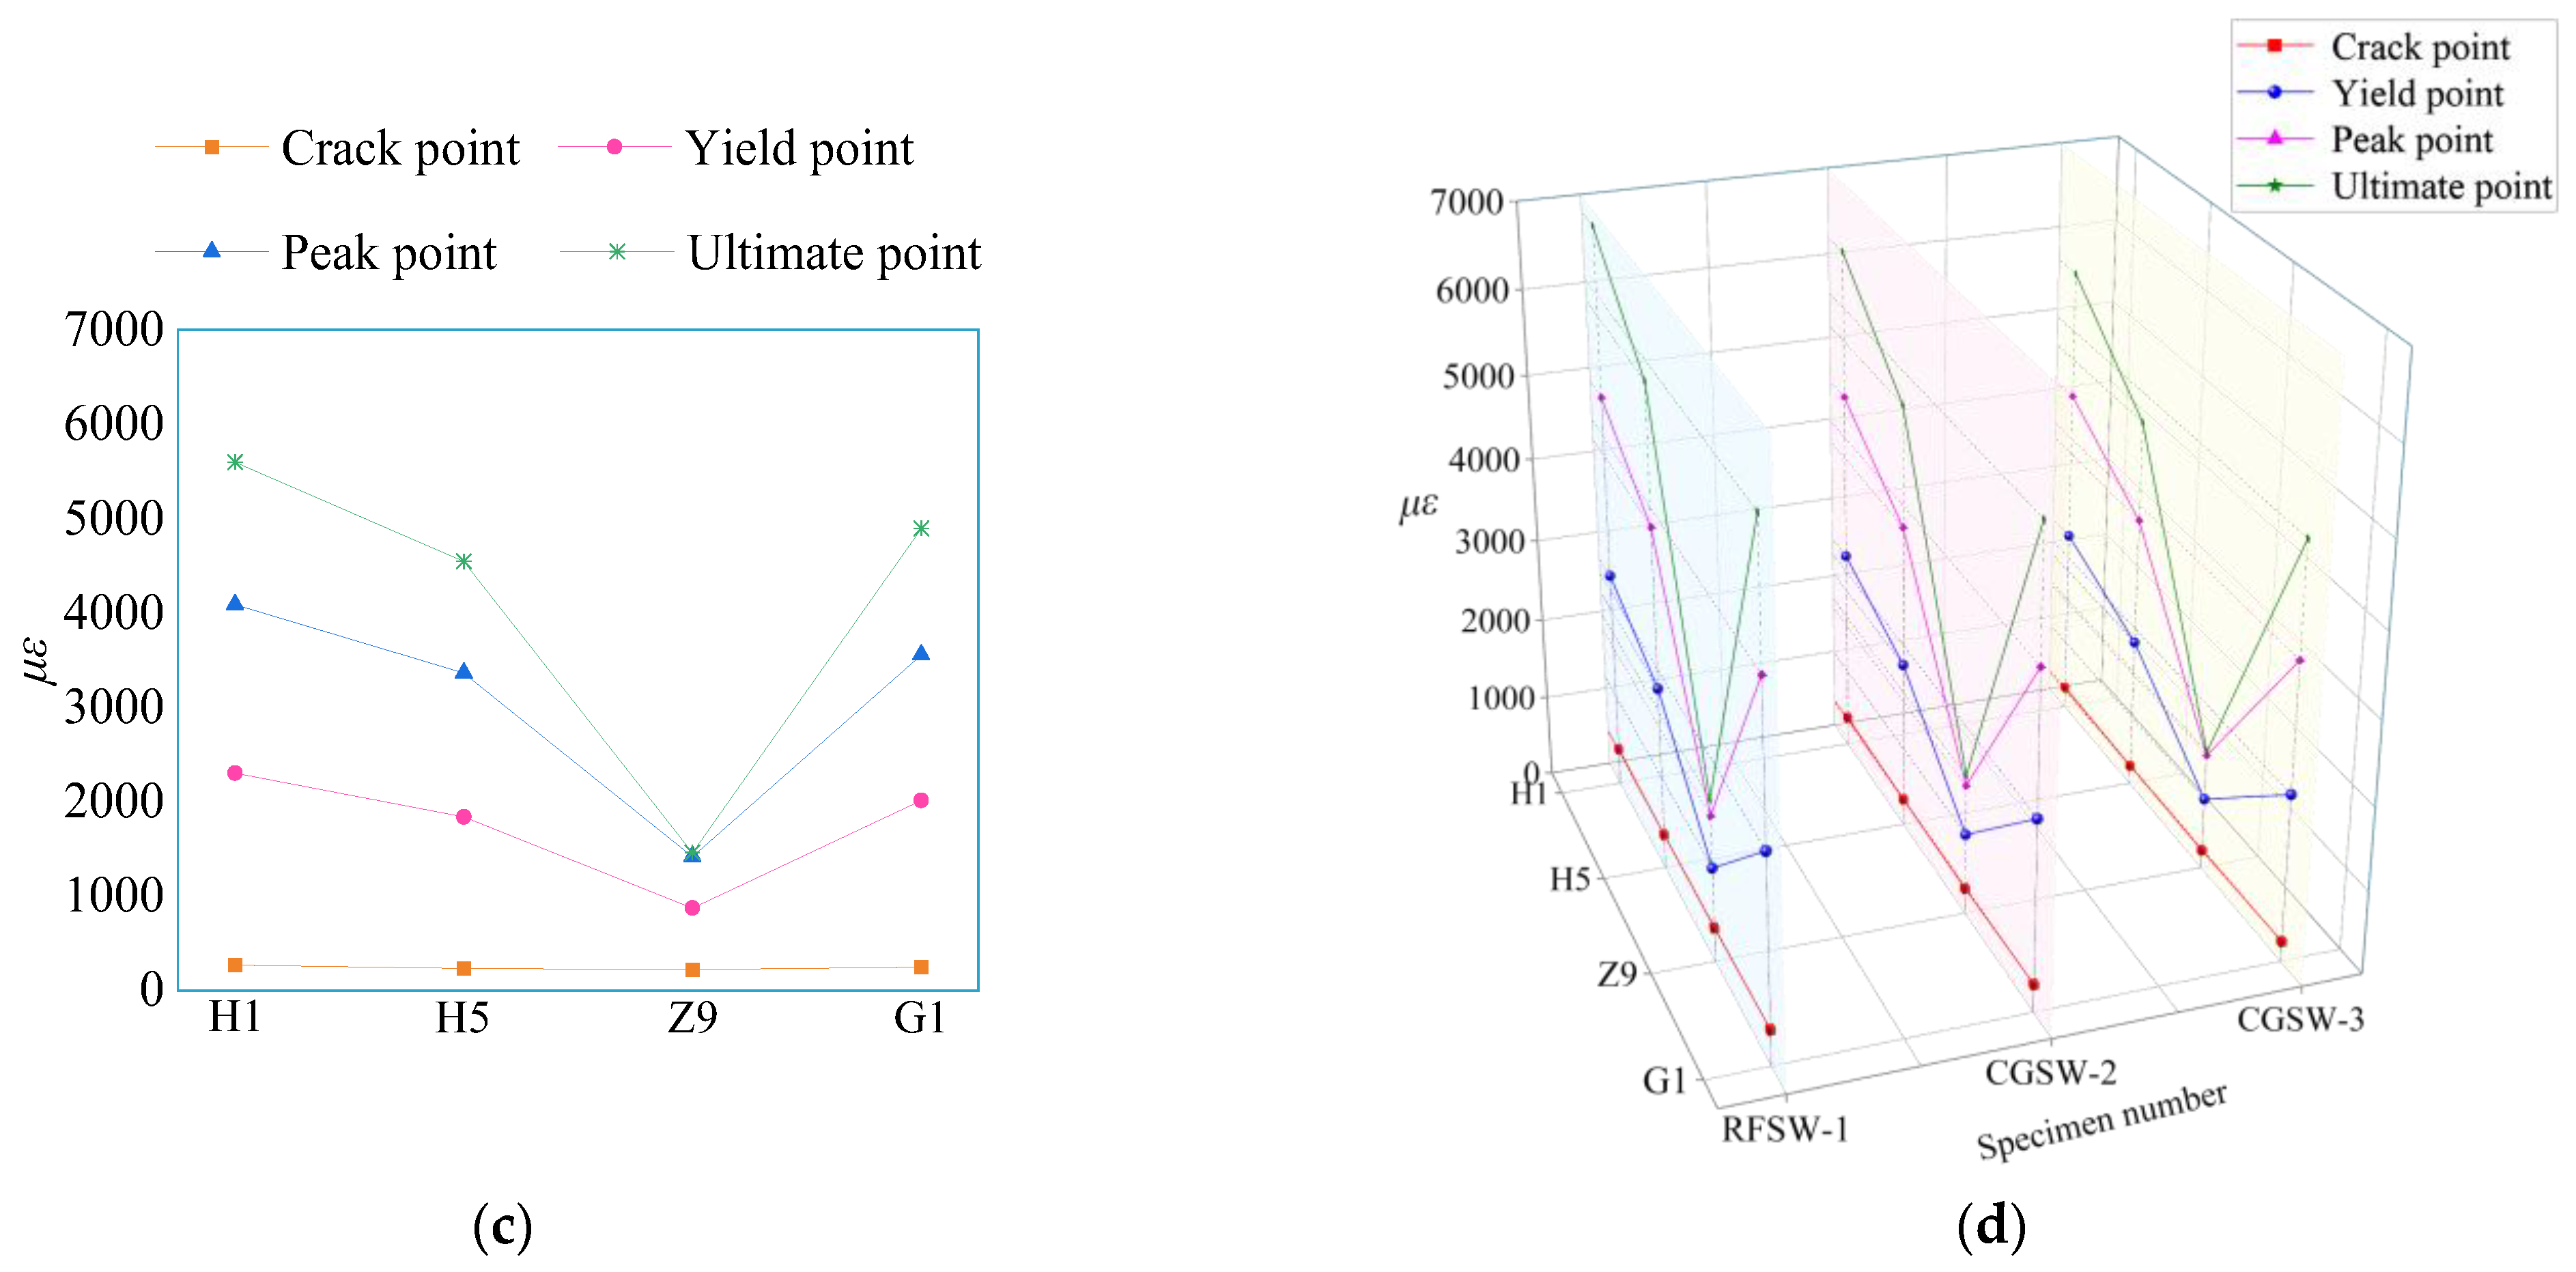
The strain curves of the four measuring points of the specimens at different characteristic points are shown in Figure 12.
Figure 12 shows that the strain values of measuring points H1, H5, Z9, and G1 of the three specimens at the crack point are small, and the difference is not obvious. The reinforcements bear less load under lateral cyclic loading in the early stage of loading. After each specimen reaches the yield point, due to the plastic development of reinforcement, the strain value changes irregularly, so the strain values at different measuring points begin to appear different, and the strain value difference gradually becomes obvious. For instance, according to the strain values of the four selected characteristic positions, the strain value of H1 at the bottom of the reinforcement at the outermost side of the hidden column is the largest. The strain value of G1 at the bottom stirrup of the hidden column and the strain value of H5 at the bottom of the vertical distribution reinforcement at the outermost inner side of the hidden column is in the middle. The strain value of Z9 at the top of the outermost stressed reinforcement of the hidden column is the smallest, and the steel bar does not yield when the specimen reaches the limit state. The above examples show that the bottom of the longitudinal reinforcement of the hidden column first yields under the lateral cyclic loading, followed by the stirrup at the bottom of the hidden column and the bottom of the vertical distribution of the reinforcement of the specimen, while the strain of the reinforcement at the top of the longitudinal reinforcement is small.
In addition, with the change in the coal gangue replacement rate, the strain values of the three specimens are also different. The strain values of the four measuring points at the limit point are negatively correlated with the replacement rate of coal gangue. Compared with RFSW-1, the strain values of measuring point H1 in the ultimate state of specimens CGSW-2 and CGSW-3 decrease by 9.0% and 17.7%, respectively.

3.6. Deformation Capacity

The ductility coefficient can be used to measure the ductility of structures. In this study, the displacement ductility coefficient is selected to reflect the ductility performance of shear walls. The larger the displacement ductility factor is, the better the ductility and seismic behavior of the specimens. It is defined as follows:
μ = Δ u Δ y
where Δu is the ultimate displacement of the specimens and Δy is the yield displacement of the specimens.
The displacement and displacement ductility coefficients corresponding to the characteristic points of the specimens are shown in Table 7.
Table 7 shows that with the increase in the coal gangue replacement rate, the yield displacement of the specimens increases gradually. Compared with specimen RFSW-1, specimens CGSW-2 and CGSW-3 increased by 3.8% and 7.1%, respectively. However, the ultimate displacement gradually decreases with the increase in the coal gangue replacement rate. Compared with specimen RFSW-1, specimens CGSW-2 and CGSW-3 decreased by 0.9% and 3.1%, respectively, indicating that the increase in the coal gangue replacement rate will lead to the deterioration of the ductility of the specimens, but the difference is not obvious.
This is because coal gangue is subjected to tensile circulation under lateral cyclic loading. Since the surface of coal gangue is rougher and the water absorption rate is larger compared to the natural coarse aggregate. Water is sucked in from the cement slurry near the interface before the cement condenses. Thus, the water-ash ratio near the interface is reduced, resulting in higher adhesion strength of cement stone and coal gangue. The tensile strength of the spontaneous combustion gangue concrete depends on the tensile strength of the spontaneous combustion coal gangue aggregate. Moreover, tensile damage is similar to other light aggregate concrete failures, which are prone to damage, running through the coal gangue joint surface of larger particles. Additionally, the tensile strength is lower than that of ordinary concrete, so with the increase of coal gangue replacement rate, the ductility of shear walls becomes worse.
It can be seen from the displacement ductility coefficient that with increasing coal gangue replacement rate, the displacement ductility coefficient gradually decreases, indicating that the ductility of the specimen is negatively correlated with the coal gangue replacement rate. However, the displacement ductility coefficients of the three specimens in this study are between 3.59 and 3.96, and the ductility meets the requirements. It can be seen from the drift ratio that the drift ratio decreases with increasing coal gangue replacement rate, indicating that the coal gangue has a negative impact on the deformation capacity of the specimens. However, the drift ratios of the three specimens in this study are all greater than the elastoplastic maximum displacement angle of 1/120 required in GB 50011-2010 [38], which proves that the elastoplastic deformation ability of the specimens is good and meets the seismic design requirements of building structures.

3.7. Stiffness Degradation

The secant stiffness K of the specimens is the ratio of the peak load to the peak displacement in each cycle. It is defined as follows:
K i = | + F i | + | F i | | + Δ i | + | Δ i |
where Ki is the secant stiffness of the concrete shear wall specimen under cycle i, ±Fi is the peak load of the specimen under cycle i, and ±Δi is the peak displacement of the specimen under cycle i.
The secant stiffness degradation curves of the specimens are shown in Figure 13.
Figure 13 shows that the secant stiffness degradation curves of the three specimens are similar, and the stiffness degradation of the specimens is obvious. The slope of the secant stiffness degradation curve is larger from cracking to yielding, which indicates that the stiffness degradation of the specimen is faster in this stage. However, the slope of the secant stiffness degradation curve decreases gradually from the specimen yield to the ultimate state, indicating that the stiffness degradation of the specimen becomes slow at this stage.
In addition, with the increase in the coal gangue replacement rate, the initial secant stiffness of the three specimens decreases gradually because the elastic modulus of coal gangue concrete is lower than that of conventional concrete. The secant stiffness of the three specimens after reaching the limit state is close, indicating that the coal gangue replacement rate is negatively correlated with the degradation rate of specimen stiffness. That is, the stiffness degradation rate of specimen CGSW-3 is more uniform.
The secant stiffness at the characteristic point of the specimens is shown in Table 8, where βyc, βmy, and βum are stiffness attenuation coefficients. Table 8 shows that the characteristic point secant stiffness of the three specimens decreases with the increasing coal gangue replacement rate. Compared with specimen RFSW-1, the cracking secant stiffness of specimens CGSW-2 and CGSW-3 decreases by 10.6% and 21.0%, respectively, while the ultimate secant stiffness decreases by 10% and 20.6%, respectively. The βyc > βyc > βum of the three specimens show that the stiffness degradation rate of the three specimens changes from fast to slow.

3.8. Strength Degradation

In this study, the strength degradation of the specimen is represented by the ratio of the peak load of each cycle to its maximum load value in the same loading level, called the strength degradation coefficient. It is defined as follows:
λ i = F ij F imax
where Fij is the peak load of the specimen under cycle j in loading level i, and Fimax is the maximum load value of the specimen in loading level i.
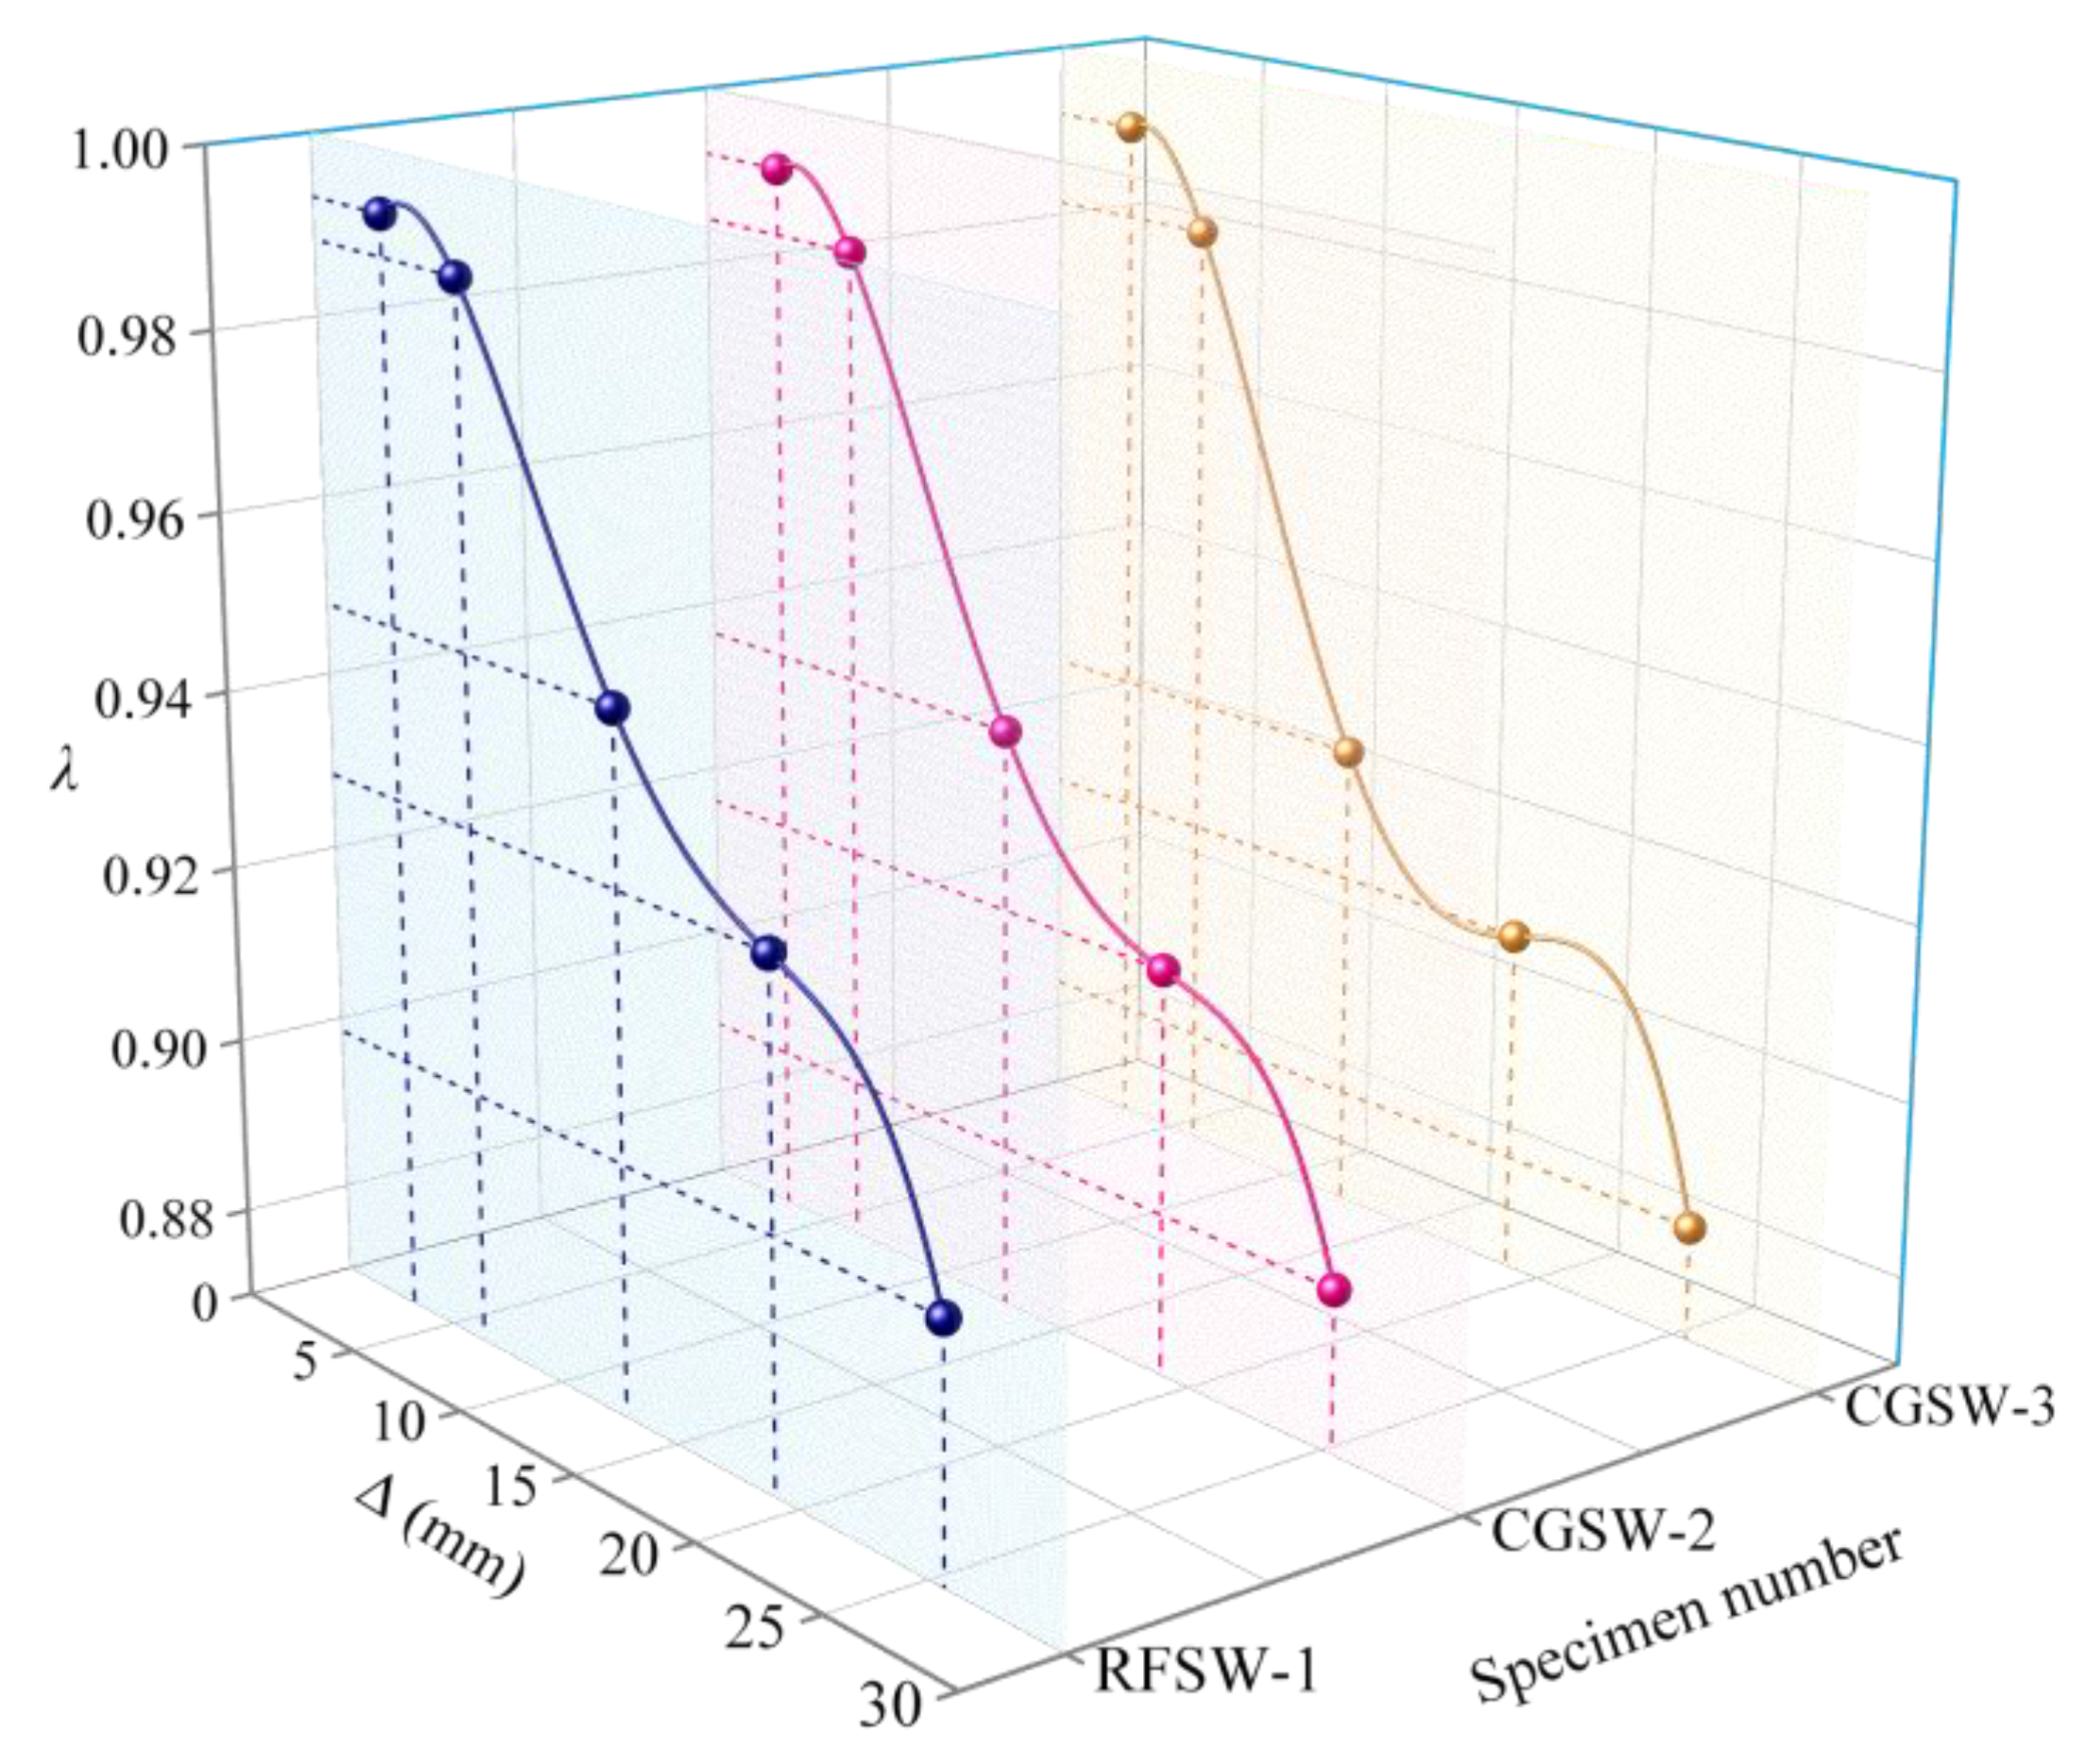
The strength degradation curves of the three specimens are shown in Figure 14.
Figure 14 shows that the bearing capacity of the three specimens degraded during the loading process. Before reaching the yield state, the strength degradation of the specimens is not serious, all above 0.98. After reaching the peak state, the strength degradation of the specimens gradually becomes obvious, and with increasing horizontal displacement, the strength degradation ratio increases.
In addition, Figure 14 shows that the strength degradation of specimens CGSW-2 and CGSW-3 is more obvious than that of specimen RFSW-1, indicating that the increase in the coal gangue replacement rate accelerates the speed of strength degradation and has an adverse impact on the specimens. This is because of the low strength of coal gangue. It is more likely to be damaged or even crushed when subjected to lateral cyclic loading. As the ductility of the gangue concrete shear wall is poor compared with that of ordinary concrete, it is easier to fail suddenly. Moreover, the horizontal bearing capacity will also drop suddenly, so with the increase of the replacement rate of coal gangue, the degradation of the strength of the shear wall is gradually significant, but the impact is not obvious.

3.9. Energy Dissipation Capacity

In this study, the equivalent viscous damping coefficient is used to measure the energy dissipation capacity of the specimen. The larger the equivalent viscous damping coefficient is, the better the energy dissipation capacity of the specimen. It is defined as follows:
ξ = 1 2 π S ABCDA S Δ ODF + S Δ OBE
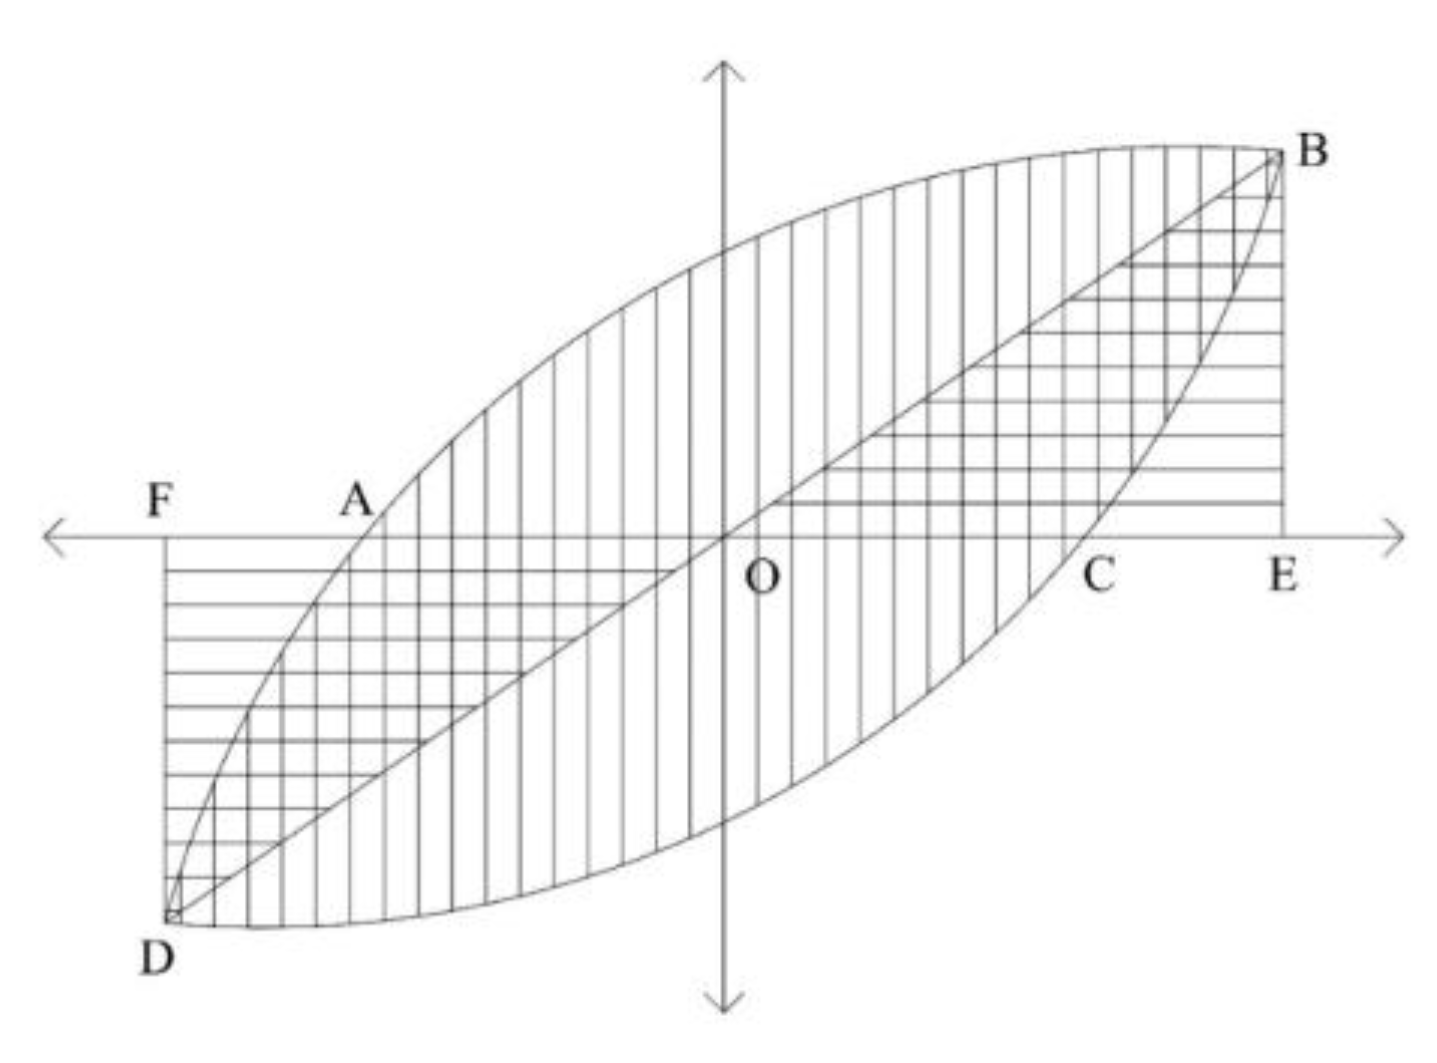
where S∆ODF and S∆OBE are the areas of triangles surrounded by positive and negative maximum horizontal load values and displacement axes of hysteretic loops, respectively, and SABCDA is the area surrounded by the hysteretic loop. The calculation of the equivalent viscous damping coefficient is shown in Figure 15.
In Figure 15, Point O represents the origin point, Point B and D represent the maximum horizontal load point of hysteretic loops, Point A and C represents the point at which the hysteresis curve intersects the x-axis, and Point E and F represents the displacement corresponding to the maximum horizontal load point.
The equivalent viscous damping coefficient of the three specimens is shown in Table 9.
Table 9 shows that the equivalent viscous damping coefficient of the three specimens increases with increasing loading displacement, indicating that the area of the hysteretic loop of the three specimens gradually increases and the energy dissipation capacity gradually improves at the later stage of loading. In addition, the equivalent viscous damping coefficient of specimen RFSW-1 is larger than those of specimens CGSW-2 and CGSW-3, but the difference is not obvious, indicating that the increase in the coal gangue replacement rate will reduce the energy dissipation capacity of the specimen. This is because the horizontal bearing capacity of gangue concrete shear walls is lower than that of ordinary concrete, and the ductility and plastic deformation ability are poor, so the energy consumption capacity is weak. However, specimens CGSW-2 and CGSW-3 still have a strong energy dissipation capacity.
The ratio of the energy dissipation value of the hysteretic loop of the specimen to its elastic energy is called the energy dissipation coefficient E. It is defined as:
E = S ABCDA S Δ ODF + S Δ OBE = 2 π ξ
The energy dissipation coefficients of the specimens are shown in Figure 16. Figure 16 shows that the energy dissipation coefficient of the specimens increases with increasing horizontal displacement. In the early stage of loading, the energy dissipation coefficient increases rapidly, while in the late stage of loading, it increases slowly. Furthermore, the energy dissipation coefficient of the specimen is negatively correlated with the replacement rate of coal gangue.

4. Finite Element Analysis

4.1. Finite Element Model Establishment

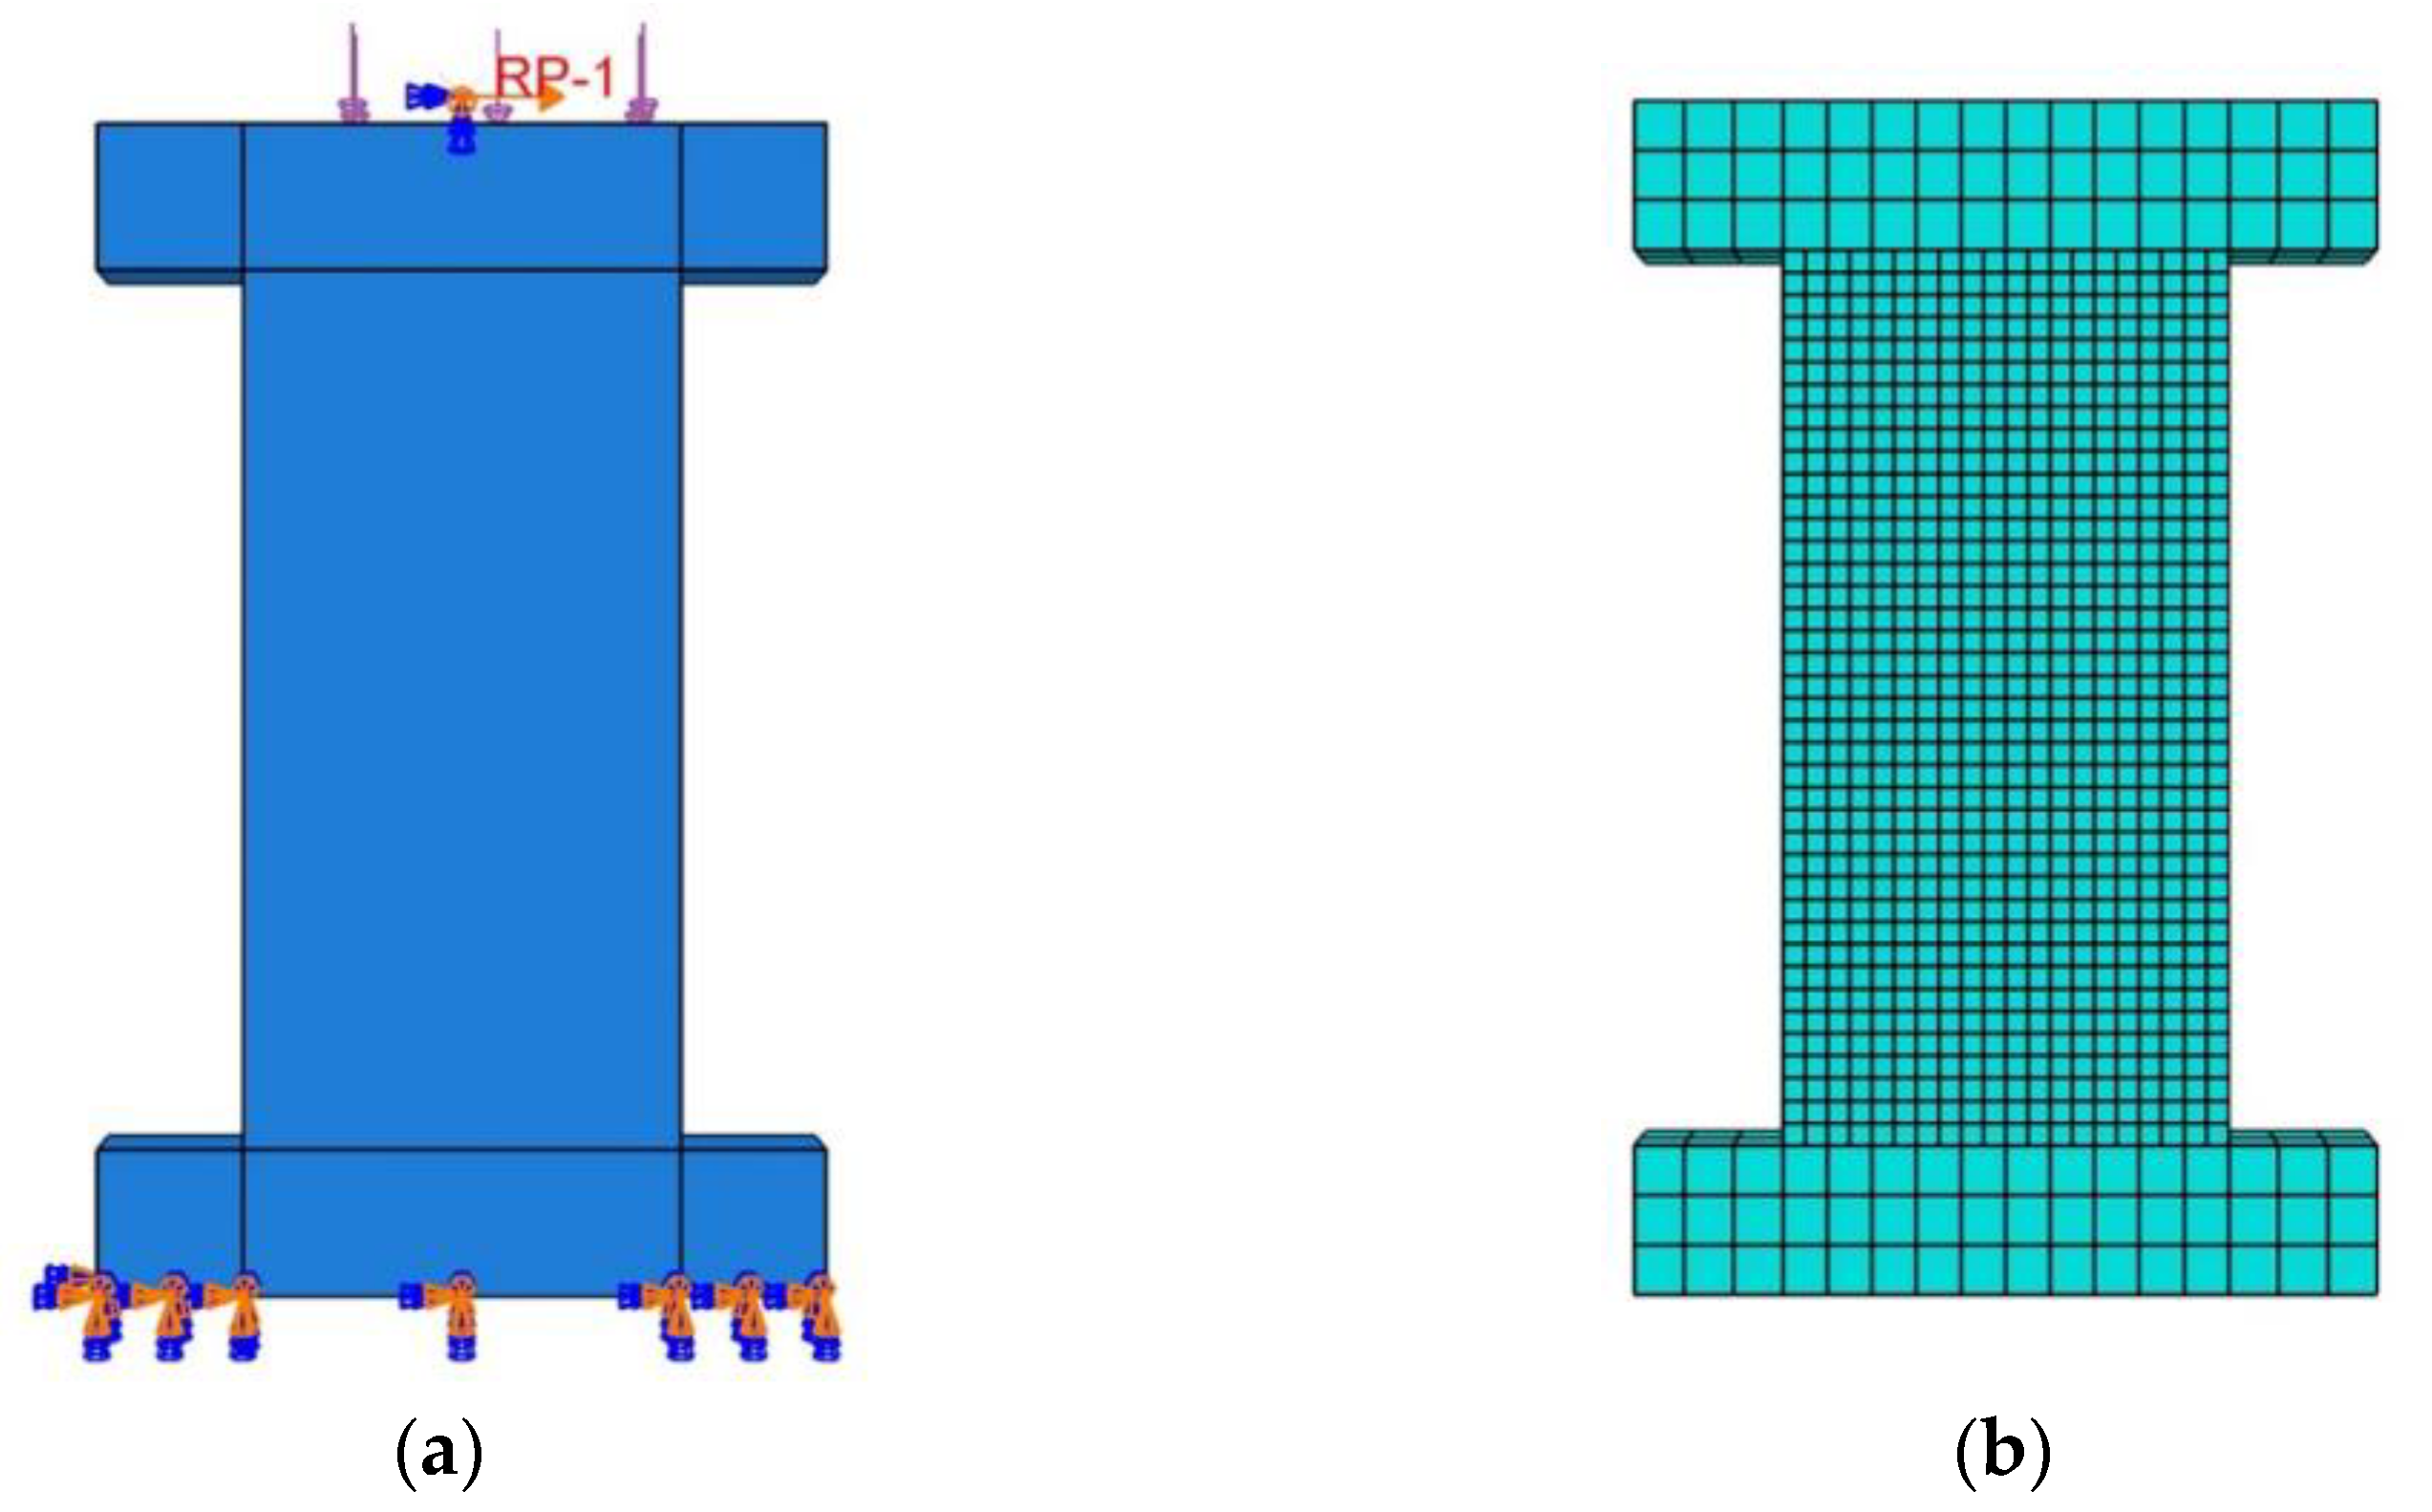
The finite element software ABAQUS was used to conduct a finite element simulation comparative analysis of concrete shear walls with a coal gangue replacement rate of 100%. The geometric dimensions and loading system of the coal gangue concrete shear wall finite element model are consistent with the test. The wall, loading, and foundation beams are simulated by C3D8R unit, while the T3D2 unit simulates the reinforcement parts. The model is fully fixed at the lower boundary. Meanwhile, the degrees of freedom outside the plane at the upper part of the specimen is constrained to avoid the specimen’s extra-plane movement. The constitutive relationship is taken from the test results. The plastic damage model is adopted for the concrete. The finite element model of the specimen is shown in Figure 17.

4.2. Finite Element Model Validation

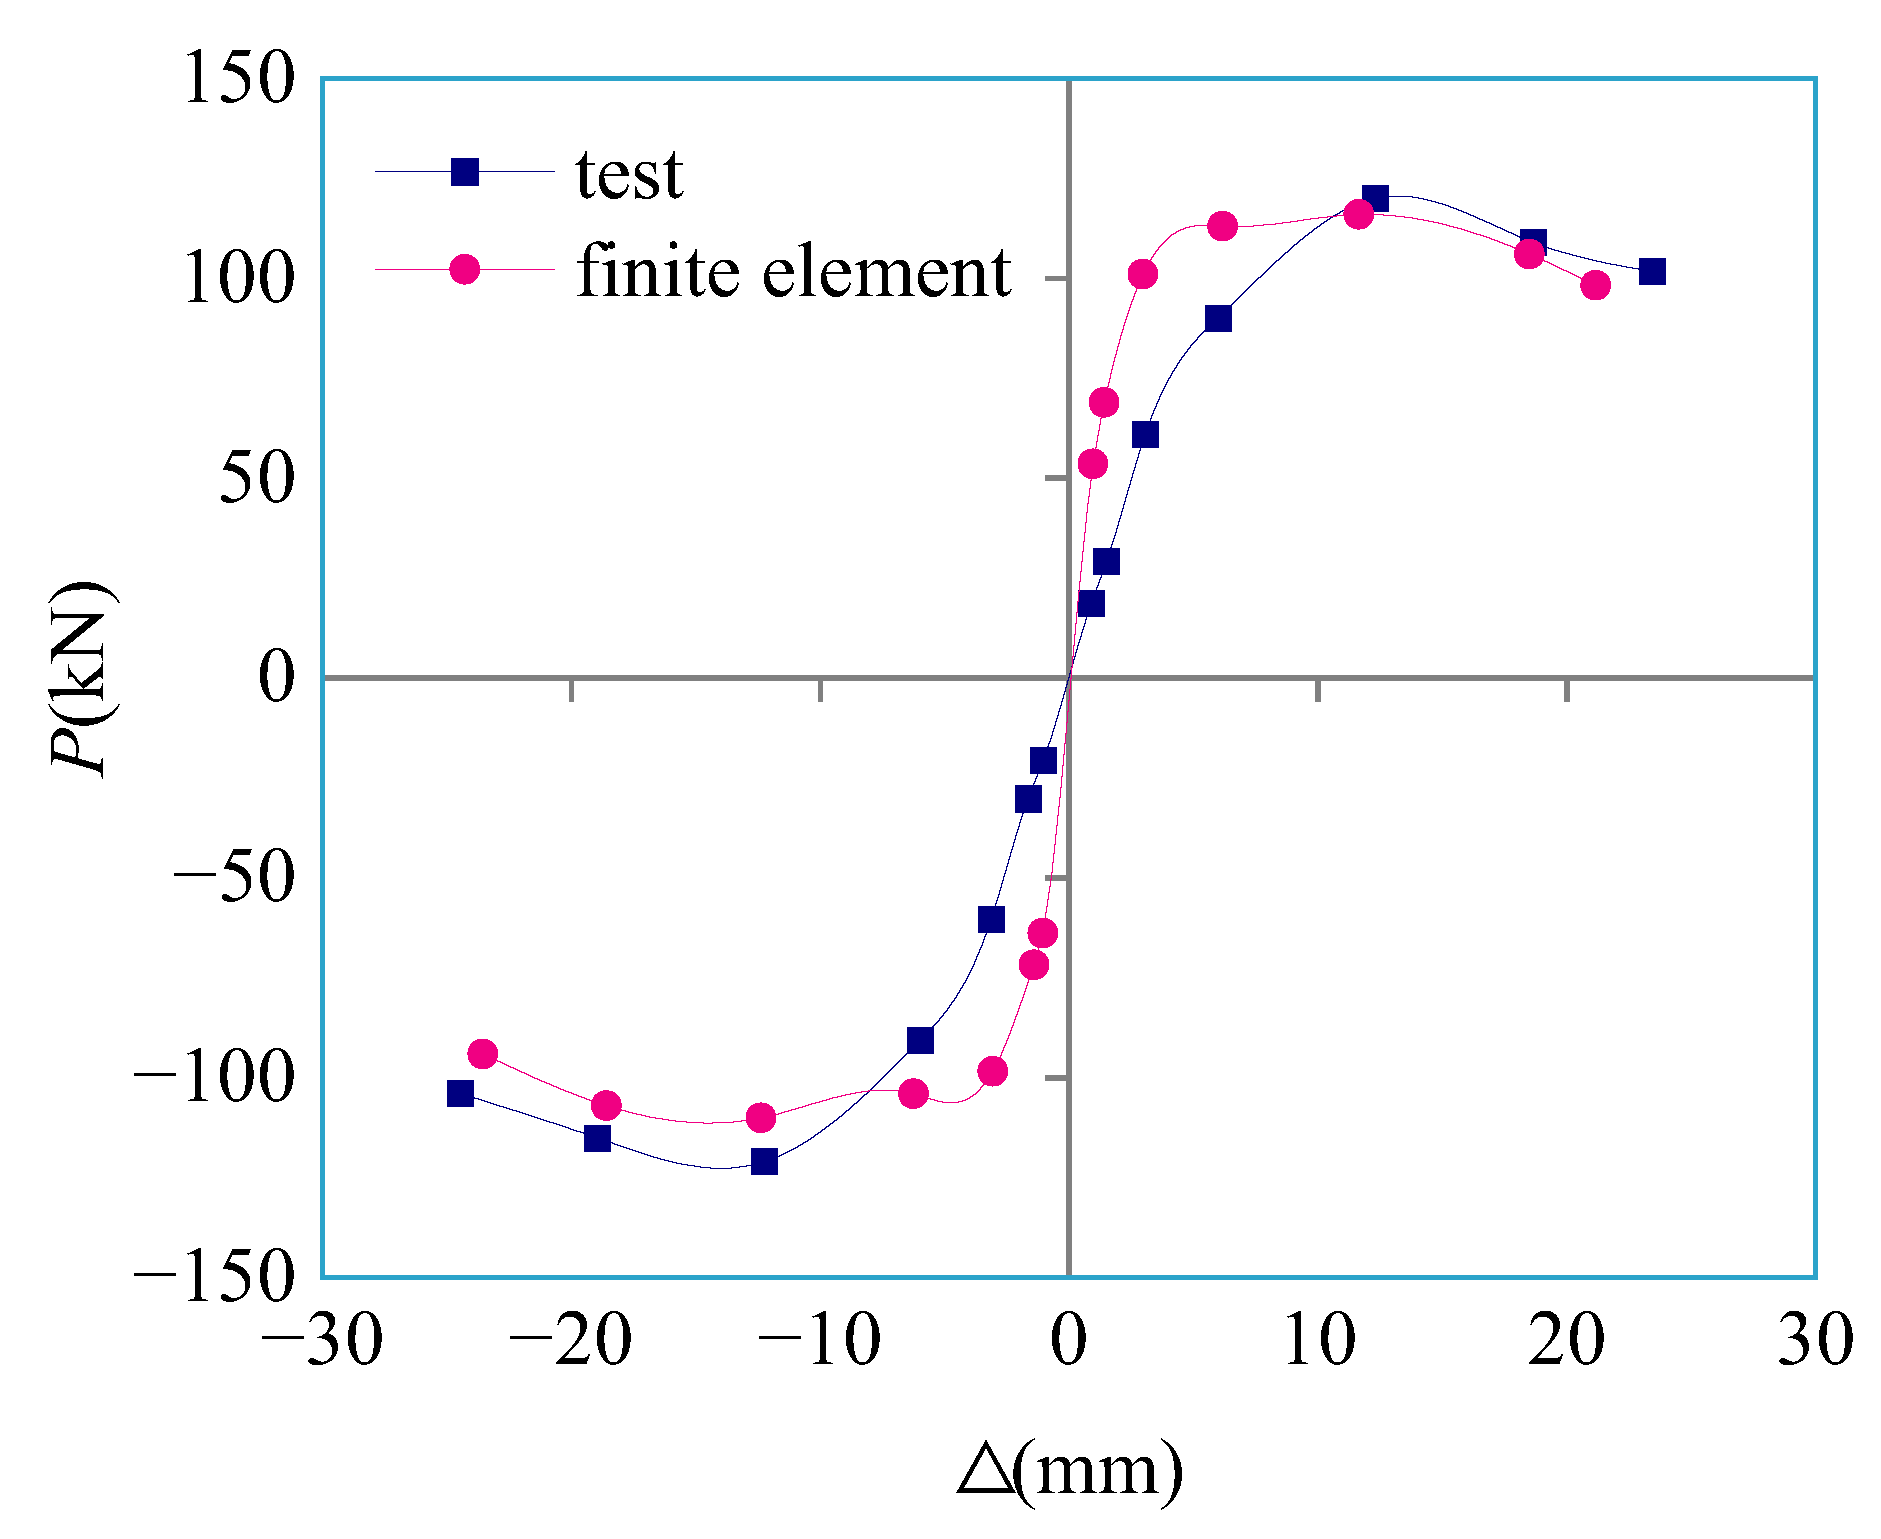
The finite element and test skeleton curves of the specimen are shown in Figure 18, and the comparison between bearing capacity and displacement is shown in Table 10.
It can be seen from Figure 18 that the skeleton curve simulated by the finite element software ABAQUS is consistent with the test, which can well reflect the force performance of the coal gangue concrete shear wall specimens. It can be seen from Table 10 that the bearing capacity and displacement of the characteristic points obtained by the finite element simulation have some errors compared with the test, but the relative error is within 10%. It indicates that the established finite element model has achieved certain rationality and accuracy and could simulate the bearing capacity and deformation capacity of the coal gangue concrete shear wall specimens well.
Compared to the experiment, the error obtained from the finite element simulations may be because the concrete defined in the simulations is an isotropic homogeneous material. In contrast, concrete is a mixture of multiple materials, and its nonlinear inhomogeneity cannot be simulated. In addition, the finite element simulation adopts a separate model, which assumes that the steel reinforcement has good adhesion to the concrete and cannot simulate the slip issue of the specimen in the test.

4.3. Finite Element Model Parameter Analysis

Since only the axial pressure ratio of 0.1 is set in the test. In this section, five models of coal gangue concrete shear walls with axial pressure ratios of 0.1 to 0.5 are set up, numbered CGSWN-1 to CGSWN-5. The skeleton curve simulated by the finite element software ABAQUS on the five models is shown in Figure 19, and the resulting characteristic point load and displacement are shown in Table 11.
It can be seen from Figure 19 that with the increase of the axial pressure ratio, the ultimate displacement of the specimen gradually decreases. In addition, the initial stiffness of the specimen will increase due to the increasement in the axial pressure ratio. It is mainly because the enhancement in axial compression ratio makes the vertical force restraint on the cracking and residual deformation of the specimen significantly enhanced, thus improving the overall stiffness of the specimen.
It can be seen from Table 11 that the yield load and peak load of the specimen increase with the increasement of the axial pressure ratio. It is because the enhancement in the vertical force will increase the compressive stress on the section of the specimen, and offset the tensile stress generated by part of the tensile side, so the load is increased. In addition, due to the increase of the axial pressure ratio, the ductility coefficient of the specimen gradually decreases, indicating that the deformation ability decreases.
Above all, the axial pressure ratio specifically impacts the ductility and seismic performance of the coal gangue concrete shear wall. The axial pressure ratio should be avoided from a high value in the actual project, to ensure that the ductility and seismic performance of the wall are not significantly affected. The horizontal bearing capacity of the gangue concrete shear wall with the axial pressure ratio between 0.2 and 0.3 is high, and the ductility is also guaranteed. Hence, the seismic performance is the best.

5. Conclusions

In this paper, three concrete shear walls with coal gangue replacement rates of 0%, 50%, and 100% were subjected to lateral cyclic loading to observe the crack development in the three specimens under lateral cyclic loading and study the influence of different coal gangue replacement rates on the seismic performance of the specimens. The following conclusions are drawn:
  • The crack development of shear wall specimen RFSW-1 with a coal gangue replacement rate of 0% was dispersed and uniform, and the crack width was small. The shear wall specimens CGSW-2 and CGSW-3 with coal gangue replacement rates of 50% and 100%, respectively, had denser crack development and larger crack widths.
  • The stress performance and failure morphology of the three specimens were very similar, and the characteristics of the hysteretic and backbone curves were roughly the same. The failure modes of the three specimens were all typical bending-shear failure.
  • By comparing the bearing capacity, deformation capacity, strength degradation, stiffness degradation, and energy dissipation capacity of the specimens, the bearing capacity, deformation capacity, strength degradation, and energy dissipation capacity of the specimens were negatively correlated with the replacement rate of coal gangue, but the difference was small. However, the stiffness degradation of the specimen is positively correlated with the replacement rate of coal gangue.
  • Although the shear wall specimens CGSW-2 and CGSW-3 with coal gangue replacement rates of 50% and 100%, respectively, were worse than the shear wall specimen RFSW-1 with a coal gangue replacement rate of 0% in bearing capacity and deformation capacity, the difference is not obvious, and the requirements of seismic performance can be met. Through finite element simulation, it can also be seen that coal gangue concrete shear walls have the best seismic performance at the axial pressure ratio between 0.2 and 0.3. In addition, shear walls made using coal gangue can reduce the weight of the wall, save cost and reduce waste. Therefore, it is feasible to make shear walls using coal gangue concrete instead of conventional concrete.

6. Prospect

In this paper, the seismic performance of the gangue concrete shear wall with different replacement rates has been studied and specific results have been achieved. However, due to the limited test conditions and time constraints, the current research still needs to be improved. For the next step of the project to proceed smoothly, the author believes that the future research direction and ideas can be carried out from the following three points:
  • The number of specimens can be increased, and the appropriate range of replacement can be determined by changing the coal gangue replacement rate.
  • The different design parameters can be tested and studied, such as shear span-to-depth ratio, concrete strength grade, etc. Through the comparison of different design parameters, the seismic performance of the gangue concrete shear wall is further understood.
  • The seismic performance of more structures, such as gangue concrete beams, plates, columns, nodes and frames can be studied. The research results can be applied to different building structures by comprehensively evaluating different gangue concrete structures.

Author Contributions

Conceptualization, S.W.; methodology, S.W.; software, S.W.; validation, S.W.; formal analysis, S.W.; investigation, S.W.; resources, S.W.; data curation, S.W.; writing—original draft preparation, S.W.; writing—review and editing, H.L., Y.F. and Y.W.; visualization, S.W.; supervision, J.B., T.K.T.T. and C.Y.L.; project administration, H.L., Y.Q. and L.W.; funding acquisition, H.L. All authors have read and agreed to the published version of the manuscript.

Funding

The work described in this paper was supported by the Service Local Project of the Liaoning Provincial Education Department Project: Development of Coal Gangue Insulating Concrete and Industrialization of Energy-saving Construction of Village Houses (Project No. LJ2020FWL003). This work was also supported by the Key R&D Program Project of Liaoning Province: Demonstration of Resource Utilization Project of Coal Gangue in Energy-saving Construction of Village Houses (Project No. 2018230008).

Institutional Review Board Statement

Not applicable.

Informed Consent Statement

Not applicable.

Data Availability Statement

The datasets generated during and/or analyzed during the current work are restricted by provisions of the funding source but are available from the corresponding author on reasonable request.

Acknowledgments

We especially thank the Structure Laboratory of the Department of Civil Engineering at the Liaoning Technical University for its indispensable support during the experiment.

Conflicts of Interest

The authors declare that they have no conflict of interest.

Nomenclature

The list contains the nomenclature employed in the current study.
Latin Letters
KSecant stiffness
EEnergy dissipation coefficient
Greek Letters
θDrift ratio
μDisplacement ductility coefficient
ΔDisplacement
βStiffness attenuation coefficients
λStrength degradation coefficient
ξEquivalent viscous damping coefficient

References

  1. Yao, Z.T.; Ji, X.S.; Sarker, P.K.; Tang, J.H.; Ge, L.Q.; Xia, M.S.; Xi, Y.Q. A comprehensive review on the applications of coal fly ash. Earth Sci. Rev. 2015, 141, 105–121. [Google Scholar] [CrossRef] [Green Version]
  2. Huang, G.; Ji, Y.; Li, J.; Hou, Z.; Dong, Z. Improving strength of calcinated coal gangue geopolymer mortars via increasing calcium content. Constr. Build. Mater. 2018, 166, 760–768. [Google Scholar] [CrossRef]
  3. Jabłońska, B.; Kityk, A.V.; Busch, M.; Huber, P. The structural and surface properties of natural and modified coal gangue. J. Environ. Manag. 2017, 190, 80–90. [Google Scholar] [CrossRef] [PubMed]
  4. Zhu, S.; Qu, Y.; Yao, Z.; Wu, L.L.; Luo, H.J.; Tong, G.P. Experimental study on ball milling and briquetting of coal gangue and lignite. J. Mater. Metall. 2021, 20, 251–255. [Google Scholar] [CrossRef]
  5. Hua, J.M.; Yang, Z.T.; Xue, X.Y.; Huang, L.P.; Wang, N.; Chen, Z.S. Bond properties of bimetallic steel bar in seawater sea-sand concrete at different ages. Constr. Build. Mater. 2022, 323, 126539. [Google Scholar] [CrossRef]
  6. Chen, B.P. Feasibility of applying coal gangue to the aggregate. J. Huaqiao Univ. (Nat. Sci.) 1994, 15, 181–184. [Google Scholar] [CrossRef]
  7. Zhang, J.X.; Chen, W.L.; Yang, R.J. Experimental study on basic properties of coal gangue aggregate. J. Build. Mater. 2010, 13, 739–743. [Google Scholar] [CrossRef]
  8. Wang, C.L.; Ni, W.; Zhang, S.Q.; Wang, S.; Gai, G.S.; Wang, W.K. Preparation and properties of autoclaved aerated concrete using coal gangue and iron ore tailings. Constr. Build. Mater. 2016, 104, 109–115. [Google Scholar] [CrossRef]
  9. Zhou, M.; Li, G.N.; Zhang, Q.; Cui, H.B. Study on application of spontaneous combustion coal gangue aggregate in ready-mixed concrete. J. Build. Mater. 2015, 5, 830–835. [Google Scholar] [CrossRef]
  10. Zhou, M.; Li, G.W.; Dou, Y.W.; Li, S.W. Failure characteristics and strength analysis of spontaneous combustion gangue aggregate concrete under uniaxial compression. Silic. Bull. 2018, 37, 3528–3532. [Google Scholar] [CrossRef]
  11. Zhou, M.; Dou, Y.W.; Zhang, Y.Z.; Zhang, Y.Q.; Zhang, B.Q. Effects of the variety and content of coal gangue coarse aggregate on the mechanical properties of concrete. Constr. Build. Mater. 2019, 220, 386–395. [Google Scholar] [CrossRef]
  12. Zhang, Y.; Ma, G.; Liu, Y.; Li, Z. Mix design for thermal insulation concrete using waste coal gangue as aggregate. Mater. Res. Innov. 2015, 19, S5-878–S5-884. [Google Scholar] [CrossRef]
  13. Wang, Z.S.; Zhao, N. Influence of coal gangue aggregate grading on strength properties of concrete. Wuhan Univ. J. Nat. Sci. 2015, 20, 66–72. [Google Scholar] [CrossRef]
  14. Wang, Z.S.; Zhao, N. Properties of steel fiber reinforced coal gangue coarse aggregate concrete. Wuhan Univ. J. Nat. Sci. 2014, 19, 262–268. [Google Scholar] [CrossRef]
  15. Yang, Q.B.; Lü, M.X.; Luo, Y.B. Effects of surface-activated coal gangue aggregates on properties of cement-based materials. J. Wuhan Univ. Technol. (Mater. Sci. Ed.) 2013, 28, 1118–1121. [Google Scholar] [CrossRef]
  16. Cui, Z.L.; Li, J. Effect of coarse aggregate with different water absorption on strength and drying shrinkage of concrete. Silic. Bull. 2016, 35, 2396–2399. [Google Scholar] [CrossRef]
  17. Cui, Z.L.; Hao, J.L.; Chen, L.; Lan, Y. Experimental study on strength and drying shrinkage crack of spontaneous combustion gangue concrete. Non-Met. Mines 2015, 38, 76–78. [Google Scholar] [CrossRef]
  18. Liu, S.; Liu, H.Q.; Xing, S. Prediction of water transport and distribution of the gangue concrete. Silic. Bull. 2018, 37, 786–791. [Google Scholar] [CrossRef]
  19. Liu, S.; Liu, H.Q. Experimental study on durability of the coal gauge concrete under acidic environment. Non-Met. Mines 2018, 41, 85–87. [Google Scholar]
  20. He, Y.Y.; Zhang, L.K.; Chen, Z.S.; Li, C.Y. A framework of structural damage detection for civil structures using a combined multi-scale convolutional neural network and echo state network. Eng. Comput 2022, 1–19. [Google Scholar] [CrossRef]
  21. Tan, X.M.; Guo, M.H.; Wang, F.M. Seismic performance of reinforced coal gangue concrete low shear wall. J. South. China Univ. Technol. (Nat. Sci.) 1999, 27, 67–73. [Google Scholar] [CrossRef]
  22. Li, G.C.; Jiang, J.; Jiang, Q.F.; Li, S.J. Nonlinear FEM analysis on seismic performance of beam to gangue concrete filled steel tubular column joints under reversed low cyclic loads. J. Shenyang Jianzhu Univ. (Nat. Sci.) 2011, 27, 260–265. [Google Scholar]
  23. Wu, B.H.; Wang, J.; Wang, J.F. Experimental study of reinforced coal gangue concrete beams under static loading. J. Anhui Inst. Archit. Ind. (Nat. Sci.) 2012, 20, 60–65. [Google Scholar]
  24. Li, Y.J.; Xing, Y.; Han, J.J. Experimental research on mechanical behavior of coal gangue aggregate concrete pillar in different axial compression ratio. Ind. Constr. 2016, 46, 90–94. [Google Scholar] [CrossRef]
  25. Zhou, M.; Zhang, Y.Q.; Yang, S.Y.; Zhang, B.Q.; Zhang, K. Flexural behavior of unidirectional laminated plate of spontaneous combustion gangue sand light concrete. J. Build. Mater. 2021, 24, 1066–1072. [Google Scholar] [CrossRef]
  26. Zhou, M.; Zhang, Y.Q.; Yang, S.Y.; Zhang, C.; Zhang, B.Q.; Zhang, K. Study on flexural behavior of spontaneous combustion gangue sand light concrete composite slab. J. Build. Mater. 2021, 1, 1–10. [Google Scholar] [CrossRef]
  27. Wang, Q.H.; Li, Z.; Zhou, M.; Zhang, Y.Z. Effects of spontaneous-combustion coal gangue aggregate (SCGA) replacement ratio on flexural behavior of SCGA concrete beams. J. Build. Struct. 2020, 41, 64–74. [Google Scholar] [CrossRef]
  28. Bai, G.L.; Zhu, C.; Wang, J.W.; Li, X.X.; Liu, H.; Lu, G.K. Experimental study on shear behavior of coal gangue concrete beams. J. Build. Struct. 2020, 41, 49–55. [Google Scholar] [CrossRef]
  29. Zhang, N.; Zheng, C.Y.; Zhao, Z.W.; Yang, B. Axial compression of glass fiber tube-gangue concrete-steel tubular hollow columns. Adv. Mater. Sci. Eng. 2021, 2021, 9930337. [Google Scholar] [CrossRef]
  30. Bai, G.L.; Yan, F.; Liu, H.Q. Experimental study on the seismic performance of coal gangue concrete frame columns. IOP Conf. Ser. Earth Environ. Sci. 2021, 768, 012076. [Google Scholar] [CrossRef]
  31. Bai, G.; Gu, Y.; Liu, H. Experimental study on seismic behavior of gangue concrete frame middle joints with different gangue aggregate replacement rates. J. Phys. Conf. Ser. 2021, 1904, 012003. [Google Scholar] [CrossRef]
  32. JGJ/T 101-2015; Specification for Seismic Test of Buildings. China Architecture and Building Press: Beijing, China, 2015.
  33. JGJ 3-2010; Technical Specification for Concrete Structures of Tall Building. China Architecture and Building Press: Beijing, China, 2010.
  34. Zhou, M.; Pu, B.C.; Xu, M.; Tian, B.Y.; Zhong, Q. Effect of additional water and prewet time on the performance of spontaneous combustion gangue sand lightweight concrete. Silic. Bull. 2013, 32, 2421–2426. [Google Scholar] [CrossRef]
  35. Li, S.W.; Zhou, M.; Zhang, L.M. Properties of Spontaneous Combustion Coal Gangue Coarse Aggregate and Its Influence on Concrete. J. Build. Mater. 2020, 23, 334–340+380. [Google Scholar] [CrossRef]
  36. GB/T 50081-2002; Standard for Test Method of Mechanical Properties on Ordinary Concrete. China Architecture and Building Press: Beijing, China, 2002.
  37. GB/T 228.1-2010; Metallic Materials-Tensile Testing-Part 1: Method of Test at Room Temperature. China Architecture and Building Press: Beijing, China, 2010.
  38. GB 50011-2010; Code for Seismic Design of Buildings. China Architecture and Building Press: Beijing, China, 2010.
Figure 1. Dimensions and arrangement of specimen reinforcements.
Applsci 12 10622 g001
Figure 2. The specimen preparation process.
Applsci 12 10622 g002
Figure 3. Concrete aggregate.
Applsci 12 10622 g003
Figure 4. Appearance and microstructure of coal gangue (a) Macrostructure (b) Microstructure.
Applsci 12 10622 g004
Figure 5. Test loading protocol diagram.
Applsci 12 10622 g005
Figure 6. Test setup (a) Schematic diagram (b) Practice diagram.
Applsci 12 10622 g006
Figure 7. Strain gauge layout (a) Reinforcement strain gauges (b) Concrete strain gauges.
Applsci 12 10622 g007
Figure 8. Failure morphology of the specimens (a) RFSW-1 (b) CGSW-2 (c) CGSW-3 (d) Comparison.
Applsci 12 10622 g008
Figure 9. Hysteretic curves of the specimens (a) RFSW-1 (b) CGSW-2 (c) CGSW-3 (d) Comparison.
Applsci 12 10622 g009
Figure 10. Backbone curves of the specimens.
Applsci 12 10622 g010
Figure 11. Geometric mapping method.
Applsci 12 10622 g011
Figure 12. Strain curves of the specimens (a) RFSW-1 (b) CGSW-2 (c) CGSW-3 (d) Comparison.
Applsci 12 10622 g012aApplsci 12 10622 g012b
Figure 13. Secant stiffness degradation curves of the specimens.
Applsci 12 10622 g013
Figure 14. Strength degradation curves of the specimens.
Applsci 12 10622 g014
Figure 15. Calculation of the equivalent viscous damping coefficient.
Applsci 12 10622 g015
Figure 16. Energy dissipation coefficients of the specimens.
Applsci 12 10622 g016
Figure 17. Finite element model (a) Loads and boundary conditions (b) Meshing.
Applsci 12 10622 g017
Figure 18. Backbone curves of the test and finite element.
Applsci 12 10622 g018
Figure 19. The skeleton curve of the specimen under different axial pressure ratios.
Applsci 12 10622 g019
Table 1. Parameters of the specimens.
Specimen
Number
Specimen Size
(mm)
Coal Gangue
Replacement Rate
Coal Gangue
Concrete Strength Grade
Axial
Compression Ratio
RFSW-11200 × 600 × 1200%C300.1
CGSW-21200 × 600 × 12050%C300.1
CGSW-31200 × 600 × 120100%C300.1
Table 2. Chemical composition of coal gangue and natural coarse stone.
Chemical CompositionSiO2Al2O3Fe2O3MgOCaOK2ONa2O
Coal gangue (%)59.3425.284.662.000.202.531.15
Natural coarse stone (%)4.051.600.770.6760.440.280.11
Table 3. Mix proportion and main mechanical properties of the coal gangue concrete.
Specimen
Number
Mix Proportion (kg/m3)Mechanical Properties
CementWaterFly AshWater
Reducing
Agent
Natural
Sand
Natural
Stone
Coal GangueCompressive Strength
(N/mm2)
Elastic
Modulus
(×104 N/mm2)
RFSW-1262.50150.0070.004.11753.001040.0038.423.18
CGSW-2348.00178.0087.007.91860.00395.00395.0035.543.11
CGSW-3376.00171.2594.007.05769.00710.0033.863.05
Table 4. Mechanical properties of the reinforcement.
Rebar
Specifications
Diameter
(mm)
Elongation
(%)
Yield
Strength
(N/mm2)
Ultimate
Strength
(N/mm2)
Elastic Modulus
(×105 N/mm2)
HRB3356165086652.1
HRB33512144656582.0
Table 5. Lateral cyclic loading protocol.
Loading StepDisplacement Amplitude (mm)Cycle NumberDrift Ratio
1±1.0011/1500
2±1.5011/1000
3±3.0021/500
4±6.2521/240
5±12.5021/120
6±18.7521/80
7±25.0021/60
Table 6. Characteristic point bearing capacity of the specimens.
Specimen
Number
Characteristic Point Bearing Capacity (kN)Yield Ratio
Crack LoadYield LoadPeak LoadUltimate Load
RFSW-168.980102.091137.961117.2670.74
CGSW-266.05296.394128.525109.2460.75
CGSW-362.71693.427120.905102.7690.77
Table 7. Characteristic point displacement and ductility coefficient of the specimens.
Specimen
Number
Characteristic Point Displacement (mm)Ductility
Coefficient
Drift
Ratio
Crack
Displacement
Yield
Displacement
Peak
Displacement
Ultimate
Displacement
RFSW-12.676.2412.7824.713.961/52
CGSW-22.826.4812.6724.483.781/53
CGSW-32.986.6812.4723.953.591/54
Table 8. Characteristic point secant stiffness of the specimens.
Specimen
Number
Characteristic Point Secant Stiffnessβycβycβum
Crack StiffnessYield StiffnessPeak StiffnessUltimate Stiffness
RFSW-122.8415.7610.785.400.690.680.53
CGSW-220.4214.5710.144.860.710.70.48
CGSW-318.0513.999.704.290.780.690.44
Table 9. Equivalent viscous damping coefficient ξ of the specimens.
RFSW-1CGSW-2CGSW-3
Loading DisplacementξLoading DisplacementξLoading Displacementξ
1.000.1591.000.1161.000.079
1.500.1761.500.1411.500.111
3.000.1823.000.1473.000.114
0.1890.1550.120
6.250.1906.250.1736.250.161
0.1940.1770.167
12.500.19512.500.18412.500.173
0.1930.1870.177
18.750.20018.750.18818.750.178
0.1960.1890.181
25.000.20725.000.19225.000.187
0.2030.1950.190
Table 10. Characteristic point bearing capacity and displacement of the test and finite element.
Data TypeCharacteristic Point Bearing Capacity
(kN)
Characteristic Point Displacement (mm)
Yield
Load
Peak
Load
Peak
Displacement
Ultimate
Displacement
test93.427120.90512.4723.95
finite element101.837113.09912.1322.36
Error (%)9.006.462.736.64
Table 11. The characteristic point parameters of the specimen under different axial pressure ratios.
Specimen
Number
Axial Pressure RatioCharacteristic Point Bearing Capacity
(kN)
Characteristic Point Displacement
(mm)
Ductility
Coefficient
Yield
Load
Peak
Load
Yield
Displacement
Ultimate
Displacement
CGSWN-10.1101.837113.0993.7622.365.95
CGSWN-20.2123.724137.0543.7221.805.86
CGSWN-30.3137.069152.5863.6921.385.79
CGSWN-40.4152.381163.8103.6319.545.38
CGSWN-50.5165.397170.1593.6119.115.29
Publisher’s Note: MDPI stays neutral with regard to jurisdictional claims in published maps and institutional affiliations.