Abstract
To study the fatigue performance of a composite girder with corrugated steel web (CSW) and steel tube (ST) truss, based on an engineering object, a test and finite element (FE) analysis were carried out. The fatigue failure mode and the sensitivities of the hot spot stress to the geometric parameters of the composite girder above were studied. The position with the maximum hot spot stress and the fatigue crack position were discussed and determined. Furthermore, a fatigue life evaluation method was discussed. It was found that linear extrapolation was applicable to finding the hot spot stress. The fatigue performance evolution comprised three stages, including initiation, expansion, and failure of the fatigue crack. The fatigue crack initiation stage accounted for about 95.6% of its fatigue life, and the fatigue crack was opening type I. The maximum hot spot stress emerged at the endpoint of the inclined web of CSW (point S). The main reason for the behavior was that the inclined web had a small out-of-plane flexural stiffness but had to bear an out-of-plane bending moment. Moreover, for the same section of the CSW, the hot spot stress on the molding side was less than that on the non-molding side. The hot spot stress exhibited negative correlations with the chord diameter, chord thickness, and bend radius, meanwhile, it had the highest sensitivity to the chord diameter. The existing S-N curves were not suitable to evaluate the fatigue life of the composite girder with CSW and ST truss. Since the intersecting weld between the CSW and the chord was located in longitudinal welded joints, the hot spot stress method suggested adopting the basic fatigue strength of 100 MPa, corresponding to 2,000,000 load cycles. Meanwhile, an empirical calculation model of the S-N curve for the composite girder with CSW and ST truss was created.
1. Introduction
Composite bridges composed of concrete and steel are mostly steel girder-concrete slab composite bridges [1], steel web (member)-prestressed concrete (PC) composite bridges [2], and ST truss composite bridges [3], as shown in Figure 1. At present, the steel girder-concrete slab composite bridges and steel web (member)-PC composite bridges are mainly used in medium and short span lengths, since buckling failure of webs or premature cracking of concrete deck affecting the durability of the bridges may occur [1,2,3]. ST truss composite bridges have been introduced and widely adopted to overcome the aforementioned shortcomings of the two other types of composite bridges, not only addressing the deck and web cracking problems but also improving the load bearing capacity and durability of bridges [4]. However, investigations revealed that the stress existing in the joints of ST truss composite bridges is complex, leading to severe stress concentration problems [5,6,7,8]. In addition, the stress generated by live loads at the joints account for a large proportion of the whole stress in the structures [9], giving rise to the fact that the fatigue cracks appear in the ST truss composite joints of existing bridges, which seriously affects the durability of the bridge structures. To comprehensively improve and optimize the fatigue performance of ST composite truss girders, while retaining their favorable properties by replacing the truss web members in composite girders with CSW, a kind of improved composite girder has been put forward. The new structure above is referred to as the composite girder with CSW and ST truss [10] and has been widely adopted over the last decade [11], as shown in Figure 1d.
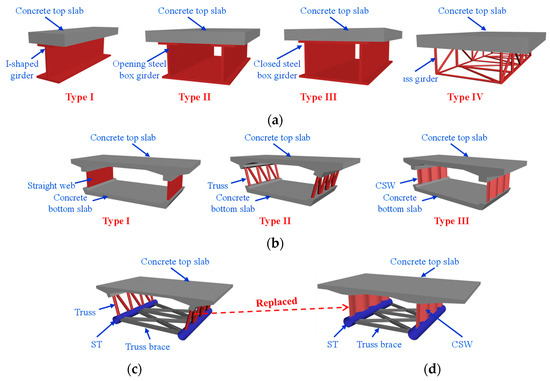
Figure 1.
Types of composite girders: (a) steel girder-concrete slab girders; (b) steel web-PC girders; (c) truss girders; and (d) composite girders with CSW and ST truss.
As for the studies on the fatigue performance of the composite girders with CSW, to obtain the fatigue performance of web-flange weld of corrugated web girders, model tests and theoretical analysis have been conducted. The influence of web corrugation geometry and flange on web-flange weld toe stress was acquired; meanwhile, the calculation method for the fatigue performance of web-flange weld of corrugated web girders was also put forward [12,13]. By carrying out the fatigue performance test, the fatigue life of steel bridge I-girders with trapezoidal web corrugations was acquired. Moreover, combining the test results and the stipulation given in AASHTO specification [14], the Category B’ was suitable to be used in designing the fatigue life of the girders above [15]. To study the fatigue performance of the welds between the steel plate and the CSW, model tests and FE analysis have been carried out. By combining the results obtained from model tests and FE analysis, the fatigue performance of the welds between the steel plate and the CSW with different types was acquired. Meanwhile, the calculation method for the fatigue life has been put forward [16,17,18]. The research results above mainly focused on the welds between the steel plate and the CSW of composite girders, and whether the research results above are suitable to evaluate the fatigue performance of the welds between the steel tube and the CSW should be discussed in detail.
There were many studies on the mechanical properties of composite girders with CSW [19,20], however, existing studies on composite girders with CSW and ST truss were very limited. Based on the engineering case, model tests have been conducted to study the flexural performance of the composite girders with CSW and ST truss, and the calculation method for the flexural bearing capacity of the composite girders above under positive and negative bending moments has been put forward [11,21]. To analyze the shear lag effects, both model tests and FE analysis were carried out, and the calculation method for the shear lag effects of the composite girders above have been put forward [22]. By combining the results obtained from the test and FE analysis, the influence of the geometric parameters on the torsional behavior of the composite girders has been studied [23]. Taking the Maluanshan Park Viaduct in Guangdong Province, China as an object, the fatigue performance test has been conducted on the composite girders with corrugated steel web and concrete-filled steel tubular (CSW-CFST) truss chords, but its chord was filled with concrete, and the evaluation method on the composite girders with CSW-CFST truss chords was not established [24]. As a result, there exists a relatively mature static theory for the composite girders with CSW and ST truss. However, the dearth of research on the fatigue performance of the composite girders with CSW and ST truss hinders practical engineering applications, and there are no fatigue performance evaluation methods for composite girders with CSW and ST truss available in the existing design specifications. The current state of knowledge not only does not allow for evaluation of the existing fatigue failure risks of the composite girders with CSW and ST truss but also fails to provide reasonable fatigue design methods, which slows technological advancements in the composite girders with CSW and ST truss. In conclusion, a systematic study on the hot spot stress distribution, fatigue failure mode, and fatigue life of the composite girders with CSW and ST truss will not only help in establishing a theoretical foundation for evaluating the fatigue performance, but can also provide a basis for the evaluation of the residual fatigue life of the existing composite girders with CSW and ST truss, which will offer guidance for the fatigue design of the type of bridges to be built in future.
2. Fatigue Performance Test Design
2.1. Test Model Design
According to the existing research on composite girders with CSW, the hot spot stress of the composite girders with CSW and ST truss was mainly affected by the geometry of the CSW, including bending angle θb, bend radius Rb, and thickness Tb, as well as that of the chord, including chord diameter Dc and chord thickness Tc. The geometric parameters are shown in Figure 2. The schematic of the molding process is shown in Figure 2b. Figure 2c depicts a planar view of the intersecting area of the CSW and the chord within a single corrugation wavelength. To facilitate discussions, the intersecting area was divided into two sides, i.e., the left- and right-hand side with respect to the direction of the chord axis. Meanwhile, the endpoint of the inclined web of CSW is defined as point S.
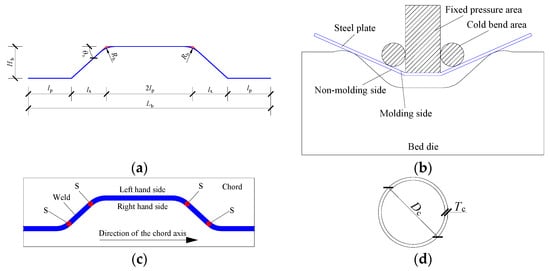
Figure 2.
Parameters and craft of CSW: (a) parameters; (b) schematic of molding process; (c) schematic of intersecting welds; and (d) schematic of chord.
The test model used in the study adopted a 1:5 scale in consideration of the test objectives and feasibility of conducting the test. The geometric similarity theory was used to determine the specimen dimensions. A detail drawing of the test model is shown in Figure 3. The length of the test model was 9000 mm (calculated span: 8760 mm). The depth of the test model was 560 mm, and its width was 1700 mm. The cross-sections of the chord were Ø146 mm × 6 mm. The thickness and bending angle of the CSW were 4 mm and 31°, and the corrugation wavelength and height were 320 mm and 44 mm, respectively. The concrete top slab was 100 mm thick and it was reinforced with the rebar with a diameter of 12 mm. The detailed dimensions of the other components are shown in Figure 3b and Table 1. The degrees of freedom in the X and Z directions of one end of the test model were constrained, and only the degree of freedom in the Z direction of the other end of the test model was constrained.
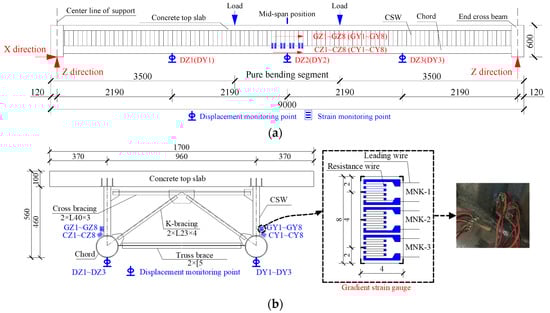
Figure 3.
Test model (unit: mm): (a) vertical plan; and (b) sectional plan.

Table 1.
Summary of geometric parameters of the test model.
The concrete top slab was connected to the CSW using studs, and T-shaped joints were used to connect the chord and the CSW by penetration welding. The CSW, chord, and end cross beam were connected by perforation and reinforcement penetration on the CSW at the end cross beam and by the studs welded on the steel tubes. The CSW was manufactured using the same processing technology as that adopted in actual construction projects. In addition, since the intersecting weld was a spatial curve, the CSW was cut and molded by a numerical control (NC) machine to guarantee the applicability of the results obtained from the model test. Moreover, automatic NC welding equipment was applied for welding. Grade Q345 steel was used for the steel structural elements, such as the chord, truss brace, and K-bracing. Grade C50 commercially available concrete was adopted in the concrete top slab. By the carrying out the material tests, the mechanical properties of steel and concrete could be determined.
2.2. Loading Rig
The loading rig is shown in Figure 4. An MTS actuator with a capacity of 500 kN was used to apply vertical cyclic loads to the test model, and a distributing girder was used to spread the load symmetrically to two points, so as to apply pure bending in a 2000 mm long section near the mid-span position. The loading method not only ensured that the stress state of all components of the test model was close to the stress state of actual bridges but made loading application easy.
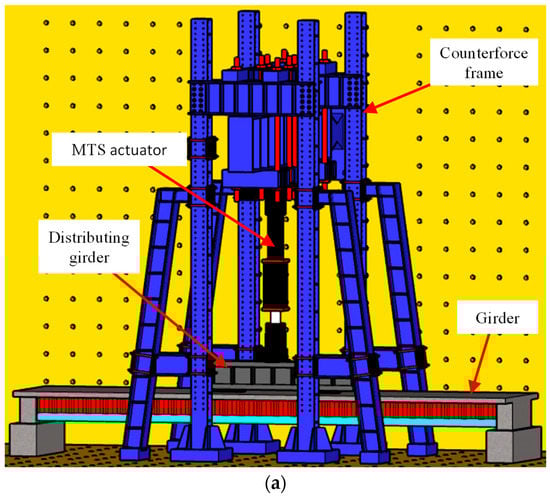
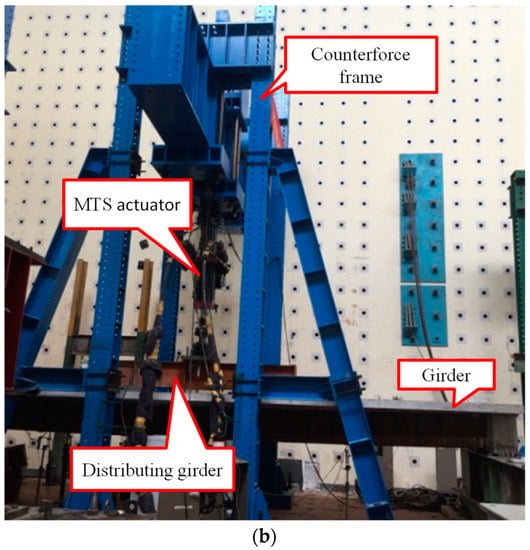
Figure 4.
Loading rig for fatigue performance test: (a) sketch of loading rig; and (b) photograph of loading rig.
Integral FE analysis was conducted on the actual bridge to determine the fatigue load in the fatigue performance test by the software of MIDAS/CIVIL. All structural components in the integral model were simulated by beam elements. Rigid connections were used to simulate the connections between the CSW and the concrete top slab, chord and truss brace, chord and K bracing, etc. The general elastic connection was used to simulate the supports. There were a total of 1666 elements and 1101 joints in the integral FE model. The existing test results [11] were used to verify the correctness of the integral FE model. As shown in Table 2, the maximum deviation was 8.5%, indicating that the integral FE model could accurately reflect the overall stress states of the structure.
Table 2.
Verification of integral FE model (unit: MPa).
Combining the validated integral FE model and the fatigue load model given in the literature [24], the maximum stress range of 33.59 MPa was predicted at the welding region between the CSW and the chord under the action of live load located at the mid-span position. The welds between the CSW and the chord were viewed as the research object, so the fatigue stress range used in the fatigue performance test could be determined according to the damage equivalence principle and stress equivalence principle. Meanwhile, in consideration of the multi-lane effect and reduced scale, as shown in Equation (1), where ΔσE2 and Δσ2 represent the equivalent stress range corresponding to the condition that the number of loading cycles was 2,000,000 cycles and the stress range, respectively. γ represents the damage equivalence coefficient, and it was determined according to the literature [25]. Δφ represents the amplification coefficient, and it was determined according to the literature [25]. Combining Equation (1) and the result obtained from the integral FE model, it was proved that the equivalent stress range corresponding to the condition that the number of loading cycles was 2,000,000 cycles was 67.18 MPa. Moreover, combining the boundary, geometric parameters, and the FE model shown in Section 4, it was proved that when the equivalent fatigue load amplitude was about 300 kN, the fatigue stress range near the welds between the CSW and the chord was 67.22 MPa, and it was very close to 67.18 MPa. Thus, the equivalent fatigue load amplitude under 2,000,000 load cycles was determined as 300 kN.
Considering the nonlinear load-frequency relationship of the MTS actuator, the minimum value of the fatigue load needs more than 3% of the allowable peak load of the actuator. Hence, the maximum and minimum value of the fatigue load applied on the test model were taken as 350 kN and 50 kN, respectively. The loading frequency was taken as 3 Hz. Static tests should be carried out before and during cyclic loading to acquire the relationships between stiffness, mechanical properties of the test model, and the number of loading cycles. The maximum static load level applied at pauses between cyclic loading was the peak load of the fatigue load, namely 350 kN. The static load was divided into seven levels, and the cyclic loading test can only be conducted after all strain and displacement monitoring points show linear variation within the fatigue load range. Cyclic testing was suspended after every 400,000 load cycles, and static tests were carried out at seven load levels with a speed of 5 kN/s. After the initiation of fatigue cracks, cyclic testing was stopped for static testing depending on the actual developing speed of the fatigue crack.
2.3. Arrangement of Monitoring Points
The stress at the weld toe was not suitable to be directly viewed as the hot spot stress, because the intersecting weld is an irregular spatial curve, and the initial internal imperfections will affect the stress. At present, the hot spot stress is defined in two ways, i.e., as the maximum principal stress [25], or by extrapolating structural stress, which is parallel to the weld [26]. According to the ultimate bearing capacity test of a composite girder with CSW and ST truss [11], longitudinal tensile stress failure occurs at the intersecting weld, and the cracking path is perpendicular to the direction of tensile stress. Hence, it was deemed appropriate to use the second method to define the hot spot stress for the composite girders with CSW and ST truss. According to the stipulation for the interpolation interval of hot spot stress [26], gradient strain gauges adopted in the test (Figure 3) were customized with a substrate of a size of 4 mm × 8 mm. Three unidirectional strain gauges whose space and resistance were 2 mm and 120 Ω, respectively, were arranged on the substrate.
Considering the fatigue characteristics of the composite girders above, the gradient strain gauges were arranged at the intersecting weld in the pure bending section of the model, which was close to both sides. As the mid-span section is a stress-carrying characteristic section of this composite girder, strain monitoring points were arranged within two corrugation wavelengths off the mid-span section. Specifically, they were placed at point S within the range of monitoring wavelength, as shown in Figure 3. The strain monitoring points were denoted as MNK-F, where M represented the component of the composite girders, and the CSW and the chord were denoted as G and C, respectively. N stood for both sides of the CSW or chord, and the left- and right-hand side were denoted as Z and Y, respectively. K was the serial number (1–8) of the gradient strain gauge along the axis of the girder, and F was the serial number (1–3) of the unidirectional strain gauge arranged on the substrate, where the unidirectional strain gauge closest to the weld was numbered as 1. Eight strain measurement sections were arranged on the test model. To obtain the changing rule of the stiffness of the composite girder with the increase of the loading cycles, displacement meters were placed on the chord at L/4, L/2, and 3 L/4 sections, as shown in Figure 3. The displacement monitoring points were denoted as Dm-n, where D represented the displacement monitoring point, m stood for both sides of the chord, and the left- and right-hand side were denoted as Z and Y, respectively. n was the serial number (1–3) of the sections along the axis of the girder. The displacement monitoring points arranged on the chords were denoted as DZ1–DZ3 and DY1–DY3, respectively.
2.4. Detection of Initial Imperfections
It was experimentally demonstrated that the phased array is capable of nondestructive detection and analysis of initial imperfections, such as microcracks, incomplete fusion, and slag inclusion, inside the welds in steel structures. Meanwhile, the initial defects with a size of 0.05 mm × 0.05 mm could be detected by the phased array [27]. Therefore, the phased array was applied in the study to perform nondestructive testing of the intersecting welds of the test model following the relevant requirements [28]. As shown in Figure 5, there were no typical initial imperfections found in the intersecting welds. Thus, the potential impact of initial imperfections on the fatigue performance test results did not require consideration and enhanced the representativeness of test results.
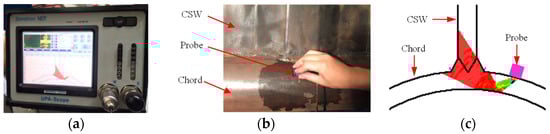
Figure 5.
Phased array detection: (a) phased array; (b) detection photo; and (c) detection result.
3. Analysis on Test Results
3.1. Analysis of Hot Spot Stress Distribution
Figure 6a illustrates the change of stress gradient at the maximum stress monitoring point (CZ3) observed in the test at the peak load of 350 kN, where the abscissa represents the distance that the unidirectional strain gauge arranged on the substrate was from the weld toe. According to Figure 6a, the stress gradient in the weld zone was essentially constant. The hot spot stress acquired by the linear extrapolation was slightly more (0.3%) than that by the quadratic extrapolation. Hence, linear extrapolation was considered to acquire the hot spot stress of the composite girders with CSW and ST truss based on the structural safety and facilitate to monitoring. σr represents the hot spot stress. To obtain the hot spot stress, by combining the stress at the positions which were 4 mm and 6 mm away from the intersecting welding, the stress at the position which was zero mm away from the intersecting welding could be acquired by linear extrapolation, namely the hot spot stress.
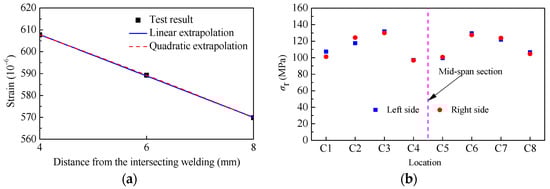
Figure 6.
Analysis on hot spot stress: (a) extrapolation methods; and (b) distribution rule.
Figure 6b illustrates the distribution rule of the hot spot stress which was obtained using linear extrapolation at the intersecting weld along the axis of the girder. It is implied that the hot spot stress exhibited essentially symmetric distribution in the axis of the girder with respect to the mid-span position, with the hot spot stress distribution at the left hand side of the chord practically equal to that at the right hand side (the maximum deviation of 6.1%), it can be concluded that the results obtained through the fatigue performance test can reflect the hot spot stress distribution and fatigue failure state of real bridges.
3.2. Analysis of Fatigue Performance Evolution
The load-strain relationship at CZ3 and load-displacement relationship at DZ2 up to the peak static load before the commencement of the cyclic fatigue testing are shown in Figure 7a,b, respectively. It was implied that before the cyclic fatigue test started, both strain and displacement of the composite girder showed linear increments with the increase in load, demonstrating that up to the peak load, the composite girder was in an elastic stage, and therefore met the precondition for the fatigue performance test. The changing rule of the strain and displacement at key monitoring points under peak static loading with the increasing fatigue loading cycles is shown in Figure 7c,d, respectively. Figure 8 displayed the time histories of dynamic strain in the intersection zone, and how it changed under the peak static loading with the increasing fatigue loading cycles. The developing process of the fatigue crack is shown in Figure 9a.
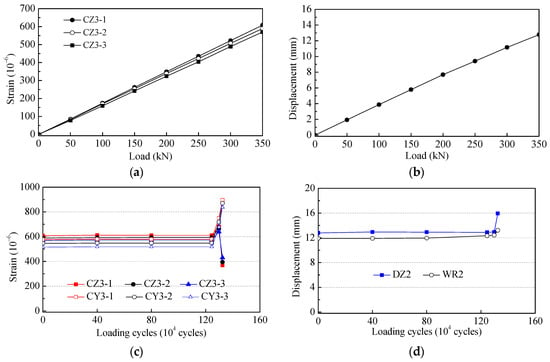
Figure 7.
Analysis off results under static load: (a) load-strain curves, (b) load-displacement curves, (c) loading cycles—strain curves, and (d) loading cycles—displacement curves.
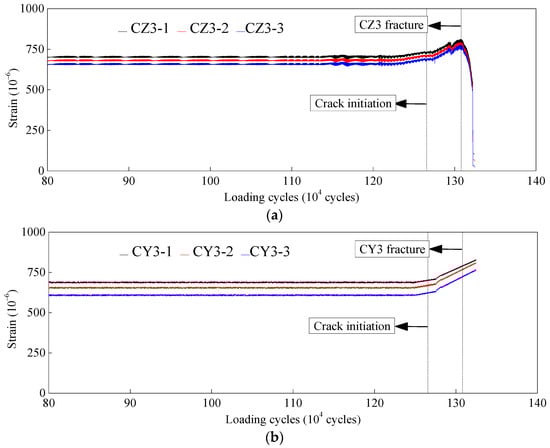
Figure 8.
Time histories of dynamic strain: (a) CZ3; and (b) CY3.
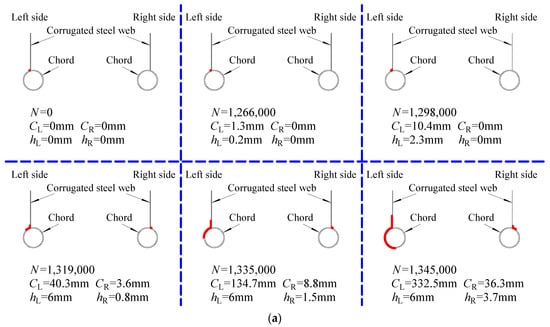
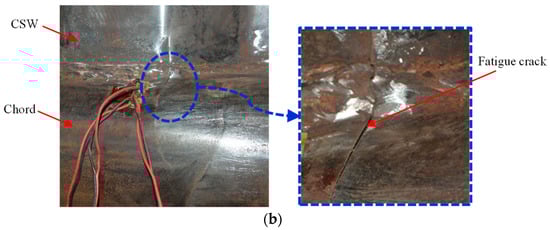
Figure 9.
Developing process of fatigue crack: (a) developing process; (b) fatigue crack.
As shown in Figure 7, Figure 8 and Figure 9, the evolution of fatigue performance of the test model could generally be divided into three phases, including initiation, propagation, and failure of the fatigue crack. The corresponding number of loading cycles was 0–1,266,000, 1,266,000–1,298,000, and 1,298,000–1,324,000, respectively. The fatigue crack initiated in the intersecting welds between the CSW and the chord, and with the increase of the number of loading cycles, the fatigue crack would develop along the three-dimensional direction of the chord and the CSW.
In the fatigue crack initiation phase, the relationships between the fatigue loading cycles and strain and displacement, and dynamic strain time histories were all essentially horizontal lines, i.e., neither strain nor displacement changed substantially with the increasing fatigue loading cycles, indicating that the test model did not experience fatigue cracking and its stiffness was unchanged in the fatigue crack initiation phase. When the fatigue loading cycles reached about 1,266,000, the strain at CZ3 and CY3 began experiencing clear changes with the increasing fatigue loading cycles, but the displacement at the mid-span position changed only slightly. By also considering the phased array detection results, it implied that a fatigue crack initiated near CZ3, and had a length, width, and depth of 1.3 mm, 0.2 mm, and 0.1 mm, respectively. After the number of fatigue loading cycles reached about 1,277,000, the strain changed markedly. At that time, the fatigue crack propagated inside the weld along the chord surface, and its length increased to 2.4 mm.
When the number of fatigue loading cycles reached about 1,298,000, a sudden drop appeared in the time histories at CZ3. However, the corresponding time histories measured at CY3 continued rising, indicating that after the fatigue crack was initiated, the stress redistribution occurred near the cracked section. In conjunction with the phased array detection results, it implied that the fatigue crack at CZ3 had already propagated to the CSW by spanning the weld, running through the chord thickness, and increasing its length at an accelerated rate. By the comparative analysis on relationships between the loading cycles and displacement, it was illustrated that the stiffness in the mid-span position of the test model developed a clear declining trend. When the loading cycles reached about 1,324,000, the bottom surface of the chord had already been propagated by the fatigue crack, the stiffness was severely reduced, and the flexural bearing capacity was essentially lost. Thus, the fatigue performance test was stopped at that time.
By analyzing the entire evolution of the fatigue performance of the composite girder, it can be observed that the initiation phase accounted for 95.6% of the whole loading cycles, i.e., most of the fatigue life. After the fatigue crack appeared, the mechanical properties of the composite girder deteriorated at a high rate, i.e., brittle failure was apparent. Hence, it was appropriate to define the loading cycles at the time of fatigue crack initiation (1,266,000) as the fatigue life.
3.3. Analysis of Fatigue Failure Mode
Figure 9b illustrates the failure mode of the composite girders with CSW and ST truss under the fatigue load, and it implied that during the fatigue performance test, the fatigue failure mainly occurred near the intersection of the point S near the pure bending segment, penetrated through the chord thickness and the intersecting weld. In this way, a uniform and smooth fatigue fracture surface was formed. Furthermore, as shown in Figure 9b, the propagation path of the fatigue crack and the direction of the hot spot stress were perpendicular to the axis of the girder and the fracture surface of the fatigue crack, indicating that the fatigue crack was opening type I. Furthermore, the observed fatigue failure mode was similar to the typical fatigue failure mode of I-shaped beams, demonstrating that when the CSW was used to replace a flat steel plate web, the stress flow direction did not change, and the longitudinal tensile stress still played a dominant role.
4. FE Analysis
4.1. FE Model
An FE model of the test specimen was established by the software of ABAQUS. The concrete top slab was simulated with solid elements numbered by C3D8R, the chord, CSW, and cross bracing and truss brace were all simulated with shell elements numbered by S4R. The rebar was simulated with TRUSS elements, and the rebar was connected with the concrete top slab by the “Embedded” command. Relative slippage among the rebar, the concrete top slab, and the CSW were ignored. The concrete top slab connected with the rebar and the CSW by the “Tie” command. To ensure the accuracy of FE model, the constitutive relationship of the concrete and the steel used in composite girders with CSW and ST truss should be determined. With reference to the literature [11], the constitutive model of the concrete could adopt the pattern shown in Equation (2), where fcd and εc represent the compressive strength and the ultimate strain of the concrete. Equation (3) could be used to simulate the constitutive model of the steel including the chord, rebar, and other steel components, where Es, εs, and fs represent the elasticity modulus, yield stress, and yield strain, respectively. The parameters above were determined according to the test carried out in the materials.
The hot spot stress distribution and stress concentration in steel structures have been demonstrated through physical testing and FE analyses to be relatively sensitive to the weld shape and structural detail geometry [29]. Thus, welds must be simulated in detail in order to ensure calculation accuracy. In the study, the size of the intersecting weld of the composite girder was simulated in accordance with the requirements [30], because the intersecting spatial curved surface of the intersecting weld was shaped using the high-precision NC cutting technology, and the two were welded using a fully automatic welding technique meeting the API requirements. As the material performance of a weld is usually superior to that of the parent metal, its strength was conservatively assumed to be the same as that of parent metal. It was ensured that the intersecting position between the CSW and the weld shared a joint with that between the weld and the surface of chord during mesh generation in the intersection zone between the CSW and the chord, in an effort to prevent the stress changes not caused by the stress-carrying or geometric mutation of the FE analysis model itself. Furthermore, the mesh along the pure bending segment, which was the focus of attention, was refined in order to improve the calculation accuracy. The fatigue performance test was consulted to determine the constraint conditions of the FE model. In the test model, a non-sliding hinged support was adopted at one end of the end crossbeam, while a sliding hinged support was used at the other end. A vertical load, symmetric with respect to the mid-span position, was applied to the concrete top slab. The mesh and constraint conditions of the FE model are shown in Figure 10a.
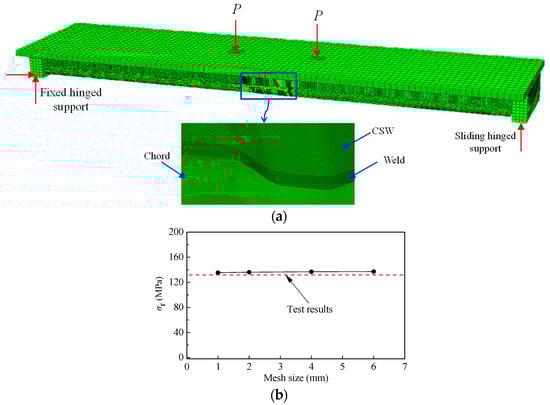
Figure 10.
FE model: (a) FE mesh; and (b) mesh size convergence.
The size of the FE mesh will influence the accuracy [31], thus, analysis on the mesh convergence of FE model should be conducted. In the study, the FE model with mesh sizes from 1 mm to 6 mm in the intersection zone were analyzed by considering the extrapolation method of hot spot stress, size of gradient strain gauges. Figure 10b illustrated the hot spot stress at CZ3 under the peak load, and it implied that with the reduction in mesh size, the FE analysis result gradually approached the test value. The FE analysis accuracy with the mesh size of 1 mm was improved by only 0.17% than that with the mesh size of 2 mm. Therefore, considering accuracy and efficiency, the mesh size of FE model in the pure bending segment was taken as 2 mm. Considering the calculating efficiency and the thickness of the steel plate (4 mm), the mesh size with a dimension of 2 mm was adopted in the vicinity of the hot spot of the FE model, and in other regions, the mesh size could be enlarged.
4.2. Validation of FE Model
The comparison of the results obtained from the test and the FE analysis are shown in Figure 11, and it implied that within the peak load range, the results from the fatigue performance test were essentially consistent with those obtained from the FE analysis, and the vertical displacement increased practically linearly with the increasing load. When the load peaked, the displacement value reached the maximum. At that time, the deviation between the test and FE analysis did not exceed 9.0%. As shown in Figure 11b, the hot spot stress distribution obtained from the FE analysis was basically consistent with the test results under the peak load. The hot spot stress obtained from the test was slightly less than that obtained from the FE analysis, but the deviation was less than 7.4%, confirming the reliability of the FE model that truly reflected the mechanical property and structural stiffness of the composite girders with CSW and ST truss.
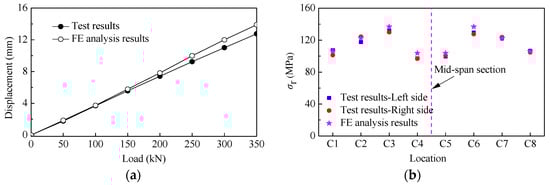
Figure 11.
Comparison on test and FE analysis: (a) structural stiffness; and (b) hot spot stress.
4.3. Analysis of Deflections and Deformation Mechanisms
As shown in Figure 12, the maximum hot spot stress on both sides of the intersecting welds occurred near point S. The hot spot stress in the inclined web was markedly larger than that in the straight web, and the hot spot stress on both sides were basically equal at the middle of the inclined web (intersection between the inclined web and the top edge of the chord). When the composite girders were subjected to a bending moment, the intersecting welds developed axial stress.
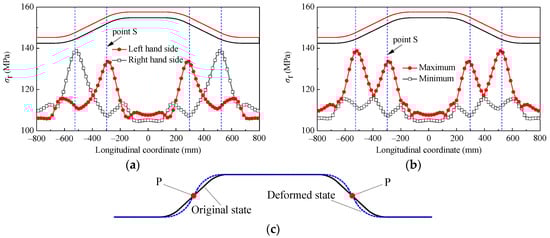
Figure 12.
Deformation mechanisms: (a) stress distribution; (b) stress envelope; and (c) schematic of CSW deformations.
The deformation of the CSW at this time is shown in Figure 12c. According to Figure 12c, the deformation of the straight segment of the CSW was essentially parallel to its own plane under the external load, thus the hot spot stress in the straight web area was practically equal. The stress flow from the straight web segment to the inclined web area was affected by the axial stress that the inclined web segment had to bear and the out-of-plane bending moment due to the existence of the inclined web. To meet the coordinated deformation and plane assumption, the deformation of the inclined web, with the central position (point P in Figure 12c) as the axisymmetric center, was gradually increased from point P in the direction of the straight web. When transitioning from the inclined web to the arc segment, the angle between the tangents of different arc segments and the straight web gradually decreased until it was parallel to the straight web segment. In the process, the out-of-plane bending moment and deformation of the inclined web were gradually reduced, which was the reason why the maximum hot spot stress and fatigue cracks were distributed near point S.
Furthermore, within a single corrugation wavelength, the maximum hot spot stress on both sides of the intersecting welds did not occur at point S of the same section, as shown in Figure 12b. This was mainly because the CSW was cold-formed (Figure 2b). Therefore, for the arc transition segment, there was a discontinuity in the curve radii (Rb) between the molding side and the non-molding side of the CSW, and the difference was Tb. To satisfy the deformation continuity and planar assumption, and combine the deformation mode of the arc transition segment (Figure 12c), the deformation of the non-molding side of the CSW was greater than that of the molding side, which was the essential reason why the maximum hot spot stress on both sides of the intersecting welds occurred at point S on the non-molding side.
5. Hot Spot Stress Sensitivity Analysis
5.1. Determination of Influencing Parameters
FE parametric analysis was conducted for different geometric parameters using the single variable method, so as to study the sensitivity of hot spot stress to the geometric parameters above. To minimize the size effect caused by scale, the full-scale real bridge parameters were used in the reference model for the parametric analysis. To highlight the key points of the analysis, the maximum value of the hot spot stress envelope within a single corrugation wavelength near the mid-span section of the pure bending segment was focused on.
5.2. Discussion of Sensitivity Analysis Results
The sensitivity of the hot spot stress distribution to the geometric parameters, including the chord (Dc and Tc) and the CSW (Tb, Rb, and θb), was analyzed in Figure 13a–e. The results showed that the hot spot stress distributions obtained by changing a single geometric parameter were essentially similar to each other, implying that the geometric parameters had no influence on the distribution rule of the hot spot stress. The maximum hot spot stress occurred near point S of the CSW, the location of which was slightly influenced by the change in geometric parameters. In addition, Figure 13a showed that as Dc increased, the wave crest at point S of the CSW became less sharp.
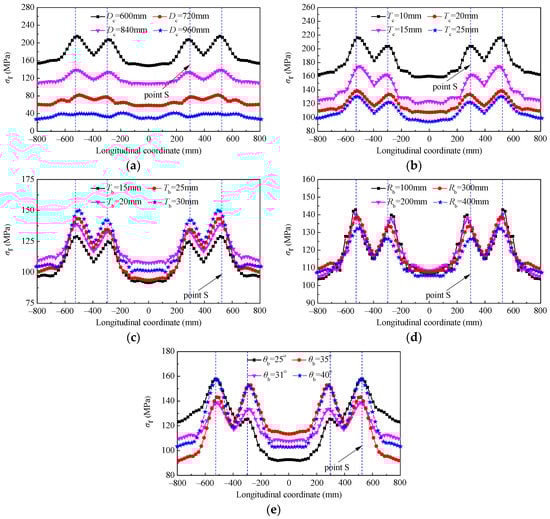
Figure 13.
Sensitivity of hot spot stress distribution to parameters: (a) Dc; (b) Tc; (c) Tb; (d) Rb; and (e) θb.
The sensitivity of the hot spot stress at point S to the geometric parameters including the chord (Dc and Tc) and the CSW (Tb, Rb, and θb) was analyzed in Figure 14a–e. It was observed that the hot spot stress was negatively correlated with Dc, Tc, and Rb, and positively correlated with Tb, while it had a more complex relationship with θb. The hot spot stress of the composite girders exhibited the strongest sensitivity to Dc, followed by Tc.
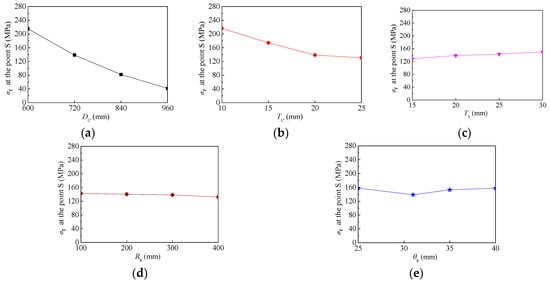
Figure 14.
Sensitivity of hot spot stress at point S to parameters: (a) Dc; (b) Tc; (c) Tb; (d) Rb; and (e) θb.
Larger Dc, on the one hand, changed the position of the neutral axis, and it was gradually close to the chord surface. On the other hand, it reduced the ratio of the projection length of the inclined web in the chord section to the circumference length of the entire section, gradually approaching a flat steel plate and the chord, thereby reducing the out-of-plane bending moment borne by the inclined web, which was also the essential reason for the negative correlation of the hot spot stress with Dc. The wave crest at point S of the CSW became less sharp with the increase in Dc, and the hot spot stress distribution was gradually uniform along the length of the CSW.
Parameters Tc and Tb separately affected the radial stiffness of the chord and the axial stiffness of the intersecting welds. The axial stiffness of the intersecting welds is usually larger than the radial stiffness of the chord. As Tc increased, the radial stiffness of the chord increased, and the difference from the axial stiffness of the intersecting welds was reduced, thus the hot spot stress in the composite girders was negatively correlated with Tc. However, the axial stiffness of the intersecting welds increased with the increase in Tb, further amplifying the difference from the axial stiffness of the intersecting welds, thus the hot spot stress of the composite girders with CSW and ST truss was positively correlated with Tb. Moreover, the calculation methods of the radial stiffness of the chord and the axial stiffness of the intersecting welds were analyzed by Equations (4) and (5). Where Ic and Ib denote the radial stiffness of the chord and the axial stiffness of the intersecting welds, respectively, Ec and Eb are the modulus of elasticity of the chord and the CSW, respectively, and Lb denotes the length of the intersecting welds. The results showed that when only Tc or Tb was varied, Equations (4) and (5) were both power functions, with the exponent of three and one, respectively, thus the sensitivity of the radial stiffness of the chord to Tc was stronger than that of the axial stiffness of the intersecting welds to Tb. This was the main reason why the sensitivity of the hot spot stress to Tc was stronger than that to Tb.
An increase in Rb further alleviated the sharp angle generated during bending of CSWs and ensured the smooth stress transition between the straight web and the inclined web, thus, increasing Rb reduced the hot spot stress.
Increasing θb enhanced the out-of-plane flexural stiffness of the inclined web and reduced the influence of the out-of-plane bending moment on the hot spot stress, but it also increased the axial stiffness of the intersecting welds, thus increasing the hot spot stress. As a result, the influence of θb on the hot spot stress of the composite girders with CSW and ST truss was the combined effect of the out-of-plane flexural stiffness of the inclined web and the axial stiffness of the intersecting welds, which produced the complex relationship between the hot spot stress and θb.
6. Fatigue Life Evaluation Method
Using the parameters of the test model, Figure 15 has compared the theoretical fatigue life obtained from the evaluation method for the fatigue performance in AASHTO, CIDECT, and API with the test results, where Δσh represents the hot spot stress range. It was found that the deviation between the theoretical fatigue life obtained from the evaluation method for the fatigue performance in AASHTO, CIDECT, and API and the test results reached 21.0%, which illustrated that the evaluation method for the fatigue performance in AASHTO, CIDECT, and API was not suitable for the evaluation of the fatigue performance of the composite girder with CSW and ST truss.
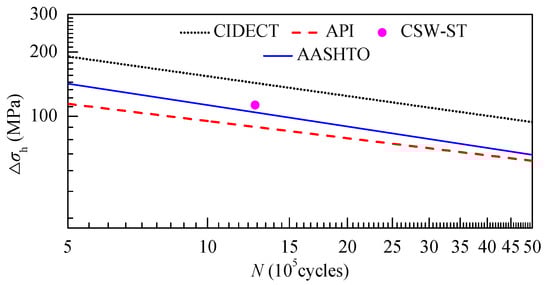
Figure 15.
Comparison of the existing S-N curves.
The following basic computational model for the fatigue design S-N curve based on the hot spot stress range of the composite girders with CSW and ST truss was formulated according to the literature [32]:
where N represents the fatigue life, m is the slope of the fatigue design S-N curve, and C0 represents the constant of the fatigue design S-N curve, which is determined as follows:
The fatigue failure of the composite girders resulted from the fluctuating tensile stress range, and fatigue cracking was found at the intersecting welds (Figure 9). The fatigue details of the composite girders with CSW and ST truss were shown in Figure 16, and it could be seen from Figure 16 that the welded joint of the composite girders with CSW and ST truss was composed of the welds between the CSW and the chord, and the construction details of the welds was the full penetration weld. Thus, it belonged to the T-shaped fully penetrable welded joint. Meanwhile, under the action of the load, the welded joint of the composite girders with CSW and ST truss played a vital role in transferring the load, namely that the welded joint of the composite girders with CSW and ST truss needed to bear the load. Therefore, according to the literature [32], the strength grade of the fatigue details of the composite girders with CSW and ST truss could be classified into D type weld joint. Based on the relevant regulations [32], the slope m of the fatigue design S-N curve of the composite girders with CSW and ST truss was taken as 3. Considering the fact that the fatigue failure belonged to the brittle failure, the S-N curve used to evaluate the fatigue performance of the composite girder with CSW and ST truss, which should have a certain security surplus. Therefore, by referring to the literature [33], a cut-off limit for the fatigue design was not adopted, and the slope m of the fatigue design S-N curve was still taken as 3 after 10,000,000 cycles of fatigue loading.
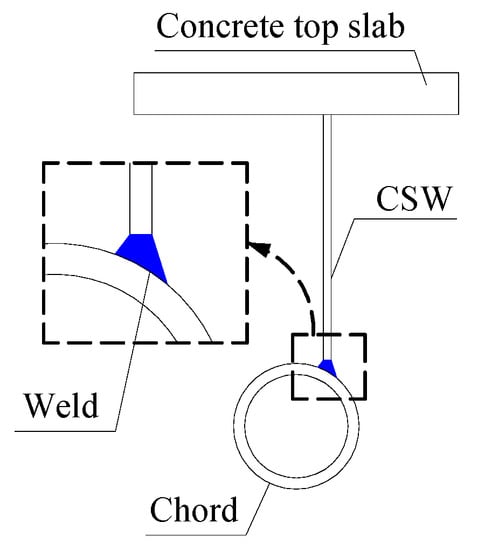
Figure 16.
Fatigue details.
Only the structural stress concentration in the intersecting welds was considered, and the influence of the shape of the intersecting welds on the hot spot stress was ignored. Therefore, according to the relevant provisions for the fatigue design S-N curve [32], the basic fatigue strength Δσ0 after 2,000,000 cycles of loading could be determined based on the basic fatigue strength of the T-shaped fully penetrable welded joint. As per the requirements [10], the intersecting welds of the composite girders with CSW and ST truss belonged to the T-shaped fully penetrable welded joint and should meet the stipulation of full penetration groove butt welding. Meanwhile, the weld toe should be ground after welding. Hence, the basic fatigue strength of the intersecting welds was taken as 100 MPa.
According to the literature [10], Tb should be between 9 mm and 40 mm. Therefore, from the perspective of the margin of safety, combined with the literature [32], the wall thickness correction coefficients of the composite girders were assumed to be 0.889 and 1.000, respectively, when Tb was no more than 25 mm. Furthermore, the fatigue failure of the composite girders with CSW and ST truss is usually caused by tensile stress, i.e., the stress ratio is usually positive. Hence, the basic fatigue strength of the composite girders with CSW and ST truss was not subjected to stress ratio correction. The fatigue design S-N curves could be obtained by further combining Equations (6) and (7), as shown in Figure 17.
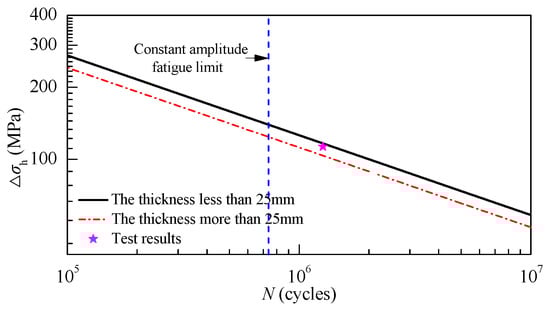
Figure 17.
Fatigue design S-N curve.
The applicability of the obtained fatigue design S-N curves was analyzed using the results of the test. Using the parameters of the test model, the theoretical fatigue life was determined as 1,390,000 cycles, i.e., close to the value of 1,266,000 cycles obtained in the test, with the difference of 9.8%, which suggests that an empirical calculation model of the S-N curve for the composite girder with CSW and ST truss was created, and compared with the test result obtained in this paper, it was proved that the empirical calculation model of the S-N curve has certain applicability. Under the premise that there was no fatigue design S-N curve given in the specification, the empirical calculation model of the S-N curve could be used as a reference for designing the composite girder with CSW and ST truss. Meanwhile, to improve the representation and applicability, more fatigue performance tests on the composite girder with CSW and ST truss should be conducted to carry out further verifications and validations of the empirical calculation model of the S-N curve put forward in the paper.
7. Conclusions
The fatigue performance of the composite girder with CSW and ST truss was revealed by carrying out a test and FE analysis. The fatigue failure mode and the sensitivities of the hot spot stress to the geometric parameters of the composite girder above were studied. Furthermore, a fatigue life evaluation method was discussed. It could be concluded that: (a) linear extrapolation is suitable to determine the hot spot stress of the composite girders with CSW and ST truss. The fatigue performance evolution comprised three stages, i.e., initiation, expansion, and failure of the fatigue crack, with corresponding numbers of fatigue loading cycles of 0–1,266,000, 1,266,000–1,298,000, and 1,298,000–1,324,000, respectively. The fatigue crack initiation stage in the test accounted for about 95.6% of the fatigue life. The fatigue cracks were opening type I; (b) both the maximum hot spot stress and fatigue cracks of the composite girders with CSW and ST truss occurred in point S, which happened mainly because the inclined web of the CSW had a small out-of-plane bending stiffness but had to withstand an out-of-plane bending moment; (c) the hot spot stress in the composite girders with CSW and ST truss exhibited negative correlations with Dc, Tc, and Rb, a positive correlation with Tb, and a more complex relationship with θb. It was most sensitive to Dc, followed by Tc; (d) based on the hot spot stress method and the fact that intersecting welds were a type of T-shaped fully penetrable welded joint, the basic fatigue strength of 100 MPa after 2,000,000 cycles of cyclic loading was recommended to establish the S-N curve of the joint. An empirical calculation model of the S-N curve for the composite girder with CSW and ST truss was created, and to improve the representation and applicability, more fatigue performance tests on the composite girder with CSW and ST truss should be conducted to carry out further verifications and validations of the empirical calculation model of the S-N curve put forward by this paper in the future; (e) due to the reason that the software of MIDAS/CIVIL was exactly suitable to conduct linear analysis, the results of the integral FE analysis on the composite girders with CSW and ST truss by the software of MIDAS/CIVIL were not very consistent with the test results. Thus, the simulation method based on the linear analysis of the composite girders with CSW and ST truss should be studied in further.
Author Contributions
H.H. and Q.W. conducted the experiments and FE analysis; H.H. and K.C. processed the data; K.C., S.N. and Q.W. contributed related tools; and H.H. drafted the paper. All authors have read and agreed to the published version of the manuscript.
Funding
This research was funded by the National Key Research and Development Program of China (No. 2017YFE0130300), National Natural Science Foundation of China (No. 52078137), and Natural Science Foundation of Fujian Province (No. 2019J06009).
Data Availability Statement
The tests were conducted at the Fujian Provincial Key Laboratory on Multi-Disaster Prevention and Mitigation in Civil Engineering at Fuzhou University. The support provided by the laboratory staff is gratefully acknowledged.
Acknowledgments
This research was supported by the National Key Research and Development Program of China (No. 2017YFE0130300), National Natural Science Foundation of China (No. 52078137), and Natural Science Foundation of Fujian Province (No. 2019J06009). The tests were conducted at Fujian Provincial Key Laboratory on Multi-Disaster Prevention and Mitigation in Civil Engineering at Fuzhou University.
Conflicts of Interest
There is no conflict of interest for the authors.
References
- Martínez-Muñoz, D.; Martí, J.V.; Yepes, V. Steel-concrete composite bridges: Design, life cycle assessment, maintenance, and decision-making. Adv. Civ. Eng. 2020, 2020, 8823370. [Google Scholar] [CrossRef]
- Nie, J.G.; Zhu, Y.J.; Tao, M.X.; Guo, C.R.; Li, Y.X. Optimized prestressed continuous composite girder bridges with CSWs. J. Bridge Eng. 2017, 22, 04016121. [Google Scholar] [CrossRef]
- Huang, Y.F.; Briseghella, B.; Zordan, T.; Wu, Q.X.; Chen, B.C. Shaking table tests for the evaluation of the seismic performance of an innovative lightweight bridge with CFST composite truss girder and lattice pier. Eng. Struct. 2014, 75, 73–86. [Google Scholar] [CrossRef]
- Huang, W.J.; Fenu, L.; Chen, B.C.; Briseghella, B. Experimental study on joint resistance and failure modes of concrete filled steel tubular (CFST) truss girders. J. Constr. Steel Res. 2018, 141, 241–250. [Google Scholar] [CrossRef]
- Wei, X.; Wen, Z.Y.; Xiao, L.; Wu, C.T. Review of fatigue assessment approaches for tubular joints in CFST trusses. Int. J. Fatigue 2018, 113, 43–53. [Google Scholar] [CrossRef]
- Xu, F.; Chen, J.; Jin, W.L. Experimental investigation of SCF distribution for thin-walled concrete-filled CHS joints under axial tension loading. Thin-Walled Struct. 2015, 93, 149–157. [Google Scholar] [CrossRef]
- Tong, L.W.; Chen, K.P.; Xu, G.W.; Zhao, X.L. Formulae for hot spot stress concentration factors of concrete-filled CHS T joints based on experiments and FE analysis. Thin-Walled Struct. 2019, 136, 113–128. [Google Scholar] [CrossRef]
- Wang, K.; Tong, L.W.; Zhu, J.; Zhao, X.L.; Mashiri, F.R. Fatigue behavior of welded T-Joints with a CHS brace and CFCHS chord under axial loading in the brace. J. Bridge Eng. 2014, 18, 142–152. [Google Scholar] [CrossRef]
- Chen, B.C.; Wang, T.L. Overview of concrete filled steel tube arch bridges in China. J. Pract. Period. Struct. Des. Constr. 2009, 14, 70–80. [Google Scholar] [CrossRef]
- Chen, Y.Y.; Dong, J.C.; Xu, T.H. Composite box girder with CSWs and trusses—A new type of bridge structure. Eng. Struct. 2018, 166, 354–362. [Google Scholar] [CrossRef]
- Chen, Y.Y.; Dong, J.C.; Tong, Z.J.; Jiang, R.J.; Yue, Y. Flexural behavior of composite box girders with CSWs and trusses. Eng. Struct. 2020, 209, 110275. [Google Scholar] [CrossRef]
- Anami, K.; Sause, R.; Abbas, H.H. Fatigue of web-flange weld of corrugated web girders: 1. Influence of web corrugation geometry and flange on web-flange weld toe stress. Int. J. Fatigue 2005, 27, 373–381. [Google Scholar] [CrossRef]
- Anami, K.; Sause, R. Fatigue of web-flange weld of corrugated web girders: 2. Analytical evaluation of fatigue strength of corrugation web-flange. Int. J. Fatigue 2005, 27, 383–393. [Google Scholar] [CrossRef]
- AASHTO. AASHTO LRFD Bridge Design Specifications, 3rd ed.; AASHTO: Washington, DC, USA, 2004. [Google Scholar]
- Sause, R.; Abbas, H.H.; Driver, R.G.; Anami, K.; Fisher, J.W. Fatigue life of girders with trapezoidal corrugated webs. J. Struct. Eng. 2006, 132, 1070–1078. [Google Scholar] [CrossRef]
- Wang, Z.Y.; Tan, L.F.; Wang, Q.Y. Fatigue strength evaluation of welded structural details in corrugated steel web girders. Int. J. Steel Struct. 2013, 13, 707–721. [Google Scholar] [CrossRef]
- Wang, Z.Y.; Wang, Q.Y. Fatigue assessment of welds joining corrugated steel webs to flange plates. Eng. Struct. 2014, 73, 1–12. [Google Scholar] [CrossRef]
- Wang, Z.Y.; Wang, Q.Y.; Liu, Y.J.; Sun, M. Fatigue behaviour of welded joints assembled by longitudinal corrugated plates. J. Cent. South Univ. 2015, 22, 2752–2760. [Google Scholar] [CrossRef]
- Jiang, R.J.; Kwong, F.T.; Xiao, Y.F. Prestressed concrete girder bridges with corrugated steel webs: Review. J. Struct. Eng. 2015, 141, 83–91. [Google Scholar] [CrossRef]
- Ding, Y.; Jiang, K.B.; Liu, Y.W. Nonlinear analysis for PC box-girder with corrugated steel webs under pure torsion. Thin-Walled Struct. 2012, 51, 167–173. [Google Scholar] [CrossRef]
- Dong, J.C.; Chen, Y.Y.; Wu, Q.X.; Hu, A.X.; Jiang, R.J.; Wang, C.W.; Tong, Z.J.; Song, H.; Xu, T.H. Research on flexural behavior of composite box continuous girder with corrugated steel webs and trusses. Adv. Struct. Eng. 2021, 24, 3580–3593. [Google Scholar] [CrossRef]
- Chen, Y.Y.; Dong, J.C.; Xu, T.H.; Xiao, Y.F.; Jiang, R.J.; Nie, X.M. The shear-lag effect of composite box girder bridges with CSWs and trusses. Eng. Struct. 2019, 181, 617–628. [Google Scholar] [CrossRef]
- Huang, H.H.; Chen, K.M.; Wu, Q.X.; Shozo, N. Calculation method for the torsional bearing capacity of composite girders with CSW-CFST truss chords. Eng. Struct. 2022, 269, 114830. [Google Scholar] [CrossRef]
- Huang, H.H.; Chen, K.M.; Wu, Q.X.; Shozo, N. Fatigue performance test and numerical analysis of composite girders with CSW-CFST truss chords. Appl. Sci. 2022, 12, 5459. [Google Scholar] [CrossRef]
- DNV-RP-C203; Fatigue Design of Offshore Steel Structures. DNV: Oslo, Norway, 2005.
- CIDECT. Part 8: Design Guide for Circular and Rectangular Hollow Section Joints under Fatigue Loading; TÜV-Verlag GmbH: Köln, Germany; Berlin, Germany, 2001. [Google Scholar]
- Chen, K.M.; Huang, H.H.; Wu, Q.X.; Nakamura, S.; Chen, B.C. Experimental and finite element analysis research on the fatigue performance of CHS K-joints. Eng. Struct. 2019, 197, 109365. [Google Scholar] [CrossRef]
- Qian, X.D.; Swaddiwudhipong, S.; Nguyen, C.T.; Petchdemaneengam, Y.; Marshall, P.; Ou, Z. Overload effect on the fatigue crack propagation in large-scale tubular joints. Fatigue Fract. Eng. Mater. Struct. 2013, 36, 427–438. [Google Scholar] [CrossRef]
- Zheng, J.; Nakamura, S.; Okumatsu, T.; Nishikawa, T. Formulation of stress concentration factors for concrete-filled steel tubular (CFST) K-joints under three loading conditions without shear forces. Eng. Struct. 2019, 190, 90–100. [Google Scholar] [CrossRef]
- API. Recommended Practice for Planning, Designing, and Constructing Fixed Offshore Platforms Working Stress Design; API: Washington, DC, USA, 2002. [Google Scholar]
- Zheng, J.; Nakamura, S.; Ge, Y.; Chen, K.M. Extended formulation of stress concentration factors for CFST T-joints. J. Bridge Eng. 2020, 25, 06019006. [Google Scholar] [CrossRef]
- JSSC. Fatigue Design Recommendations for Steel Structures; JSSC: Tokyo, Japan, 2012. [Google Scholar]
- Keating, P.; Fisher, J. Review of Fatigue Tests and Design Criteria on Welded Details. NCHRP Report. 1986. Available online: http://preserve.lehigh.edu/engr-civil-environmental-fritz-lab-reports (accessed on 16 September 2022).


Publisher’s Note: MDPI stays neutral with regard to jurisdictional claims in published maps and institutional affiliations. |
© 2022 by the authors. Licensee MDPI, Basel, Switzerland. This article is an open access article distributed under the terms and conditions of the Creative Commons Attribution (CC BY) license (https://creativecommons.org/licenses/by/4.0/).