Article

Study on Correction Method of Internal Joint Operation Curve Based on Unsteady Flow

School of Automotive Studies, Tongji University, Shanghai 201804, China
*
Author to whom correspondence should be addressed.
Appl. Sci. 2022, 12(23), 11943; https://doi.org/10.3390/app122311943
Submission received: 9 November 2022 / Revised: 18 November 2022 / Accepted: 21 November 2022 / Published: 23 November 2022
(This article belongs to the Special Issue Advances in Intelligent Vehicle Control Systems)

Abstract

:
The turbocharger, a key component in a vehicle’s powertrain, results in insufficient accuracy if it does not fully consider the unsteady flow effects of the intake and exhaust systems. Based on the difference between the turbocharger’s actual operating performance with unsteady flow and the corresponding steady flow performance, unsteady flow correction concepts and correction methods for the compressor and turbine were put forward, and the correction of the internal joint operation curve was investigated. The results show that when unsteady correction coefficients were added to both ends of the turbocharger and the optimized structure was used at both ends, the original turbocharger’s surge margin was reduced by 4.6% to 11.8%, and that of the optimized turbocharger was reduced by 15.2% to 21.9% in the medium–low-speed range. Meanwhile, the unsteady flow energy utilization coefficient of the optimized turbocharger was more than 14.5% higher than that of the original turbocharger in the medium–low speed range, and the energy utilization advantage was obvious. It indicated that the optimized turbocharger was working earlier, and the engine’s medium–low-speed admission performance has been obviously improved. Therefore, compared with the steady curve, the corrected unsteady curve was closer to the actual engine performance.

1. Introduction

With a growing global population and economic scale, the atmospheric concentration of carbon dioxide bringing the problem of global climate change has already been recognized as an indisputable fact [1,2]. Vehicle emissions occupy an important proportion of the total amount of greenhouse gas emissions [3,4]. Meanwhile, there are many studies on the issue of vehicle energy management [5,6]. As an important system of vehicle design and energy conservation, the study of the powertrain is essential [7,8].
The performance of turbochargers, the key component of the powertrain, can be directly affected by the operating characteristics of the engine, and the operation of the turbocharger can in turn affect the performance of the engine’s intake and exhaust systems. Therefore, it is necessary to study both the turbocharger and the engine in order to improve the engine’s performance [9,10]. In the study of engines and turbochargers, there are three matches between the two that need to be considered. These three matches are the matching of the compressor and the turbine of the turbocharger to the engine, respectively, and the internal matching between the compressor and the turbine [11]. The internal matching is critical to the actual operating performance of the turbocharger and the performance of the match between the turbocharger and the engine [12].
The compressor and the turbine are the two key components of a turbocharger. The role of the compressor is to compress air into high-pressure gas and send it into the engine inlet pipe, which has a great impact on the performance of the match between the turbocharger and the engine. There are many studies in which the design of the compressor is focused on the volute, impeller, and blade [13,14]. Niu Z.T. carried out an optimization study of volute geometry to weaken and suppress the rotating stall [15]. Xu Y.D. developed a parametric method for designing the hub, casing, and blades of the compressor impeller [16]. Suriyanarayanan V. proposed an optimal arrangement for a random tip gap and random stagger angle in the case of a whole annulus rotor [17].
In the engine intake process, the inlet pipe is influenced by the cylinder suction when the flow rate increases and the pressure decreases, while the compressor outlet is also influenced by the engine intake fluctuations because it is connected to the engine inlet pipe, making the compressor outlet flow rate and pressure change periodically with the engine operating process [18]. This means that the outlet region of the compressor is at a periodic unsteady flow boundary. Galindo, J. investigated the effect of compressor outlet pipe length and volume on the amplitude and frequency of the compressor outlet pulsation using both experimental and simulation methods under surge conditions and concluded that the surge oscillation in the impeller region of the compressor affects the fluctuation of the pressure and flow rate in the downstream pipe of the compressor [19]. Cao, D.M. performed an unsteady flow analysis of the pressurized airplane before rotating stall conditions to find rotating stall precursors [20]. Silvia, M. analyzed the performance of a compressor under unsteady flow and found that the compressor’s unsteady flow energy deviated from the corresponding steady state and that the position of the surge line was influenced by the unsteady flow condition [21].
The performance of the turbine also directly affects the operating performance of the turbocharger, which in turn indirectly affects the output efficiency of the engine [22,23]. Salameh, G. deduced the radial turbine mass flow rate performance diagram by proposing a new partial empirical model [24]. Ketata, A. developed a gasoline engine flow pulse frequency model and comparatively studied the in-phase and out-phase admission modes [25].
Turbocharger turbines are affected by the pulse exhaust of the engine, and both inlet pressure and temperature vary periodically [26,27]. In the pulsed exhaust environment, where the turbine operates under off-design conditions most of the time, it becomes necessary to study and evaluate turbine performance using unsteady flow methods. Serrano J.R. developed an experimentally validated model and analyzed the non-linear acoustic predictive capability of the model [28]. Roberto M. evaluated the effects of amplitude, frequency, and temporal gradient on energy dissipation by studying the parametric mass flow pulse characteristics [29]. Wang Z.H. proposed a method to effectively change the turbine nozzle opening according to the different pulse inlet pressures [30].
A review of relevant works concludes that the actual operation of the turbocharger is an unsteady flow at the compressor and turbine. The difference in performance between unsteady flow and corresponding steady flow is significant. Meanwhile, the design and performance studies of compressors and turbines are mostly independent of each other, which is different from the real conditions of turbochargers. In the present study, an unsteady flow correction method based on the joint internal operating curves of the turbocharger is proposed. The correction of the corresponding steady flow performance of the turbocharger using corresponding unsteady flow characteristic coefficients is based on the internal joint operating curve of the compressor and turbine, making the curve of the turbocharger closer to the actual operating performance. There are two turbocharger types with the correction: one is the original turbocharger with an 11-blade single-entry turbine structure, and the other is the optimized turbocharger with a 1 mm inlet diameter reduction compressor structure and a 9-blade twin-entry turbine. The compressor and turbine correction concepts and calculation methods used in this study can provide some reference for future research and the optimization of turbocharger design. Figure 1 shows the framework structure of this paper.

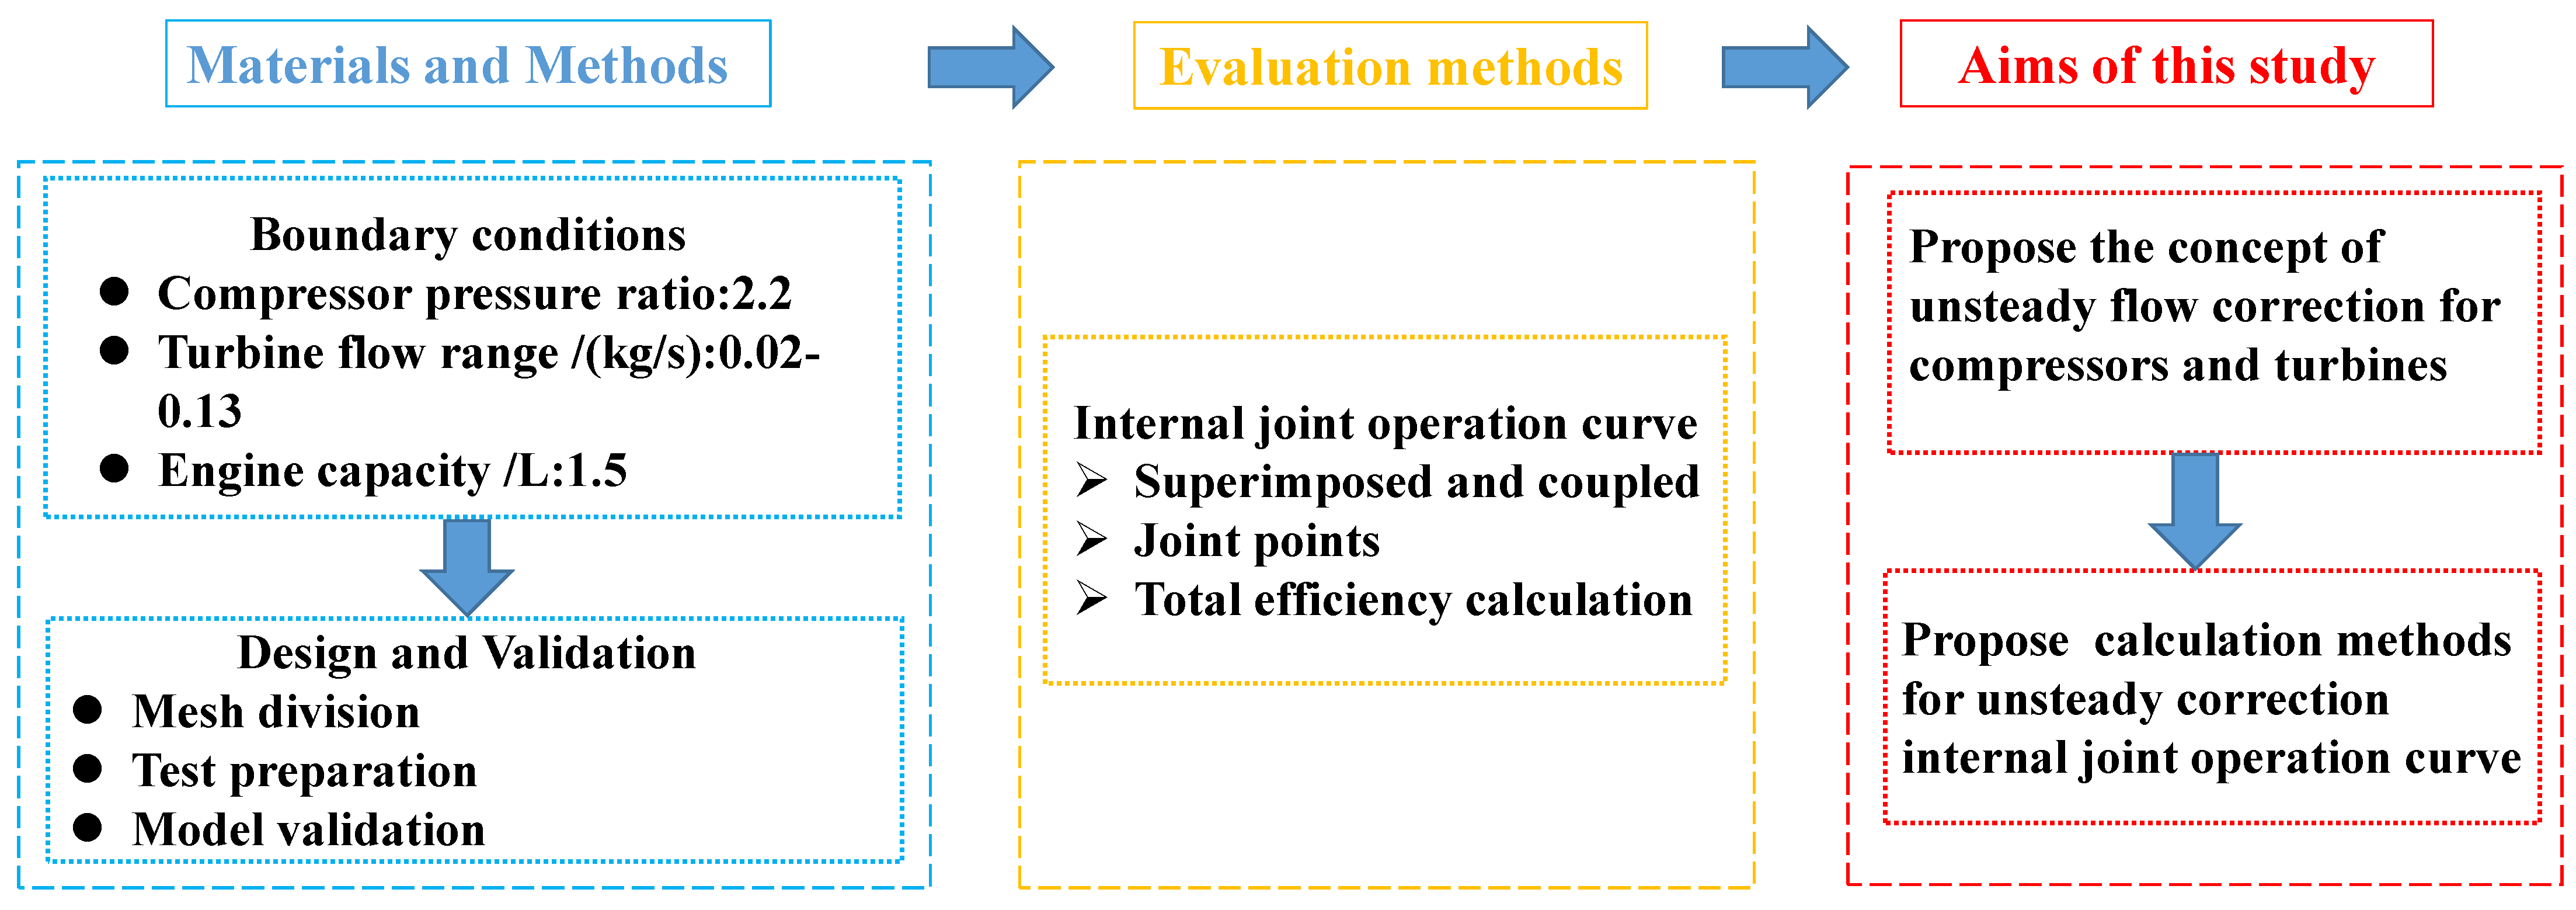
2. Materials and Methods

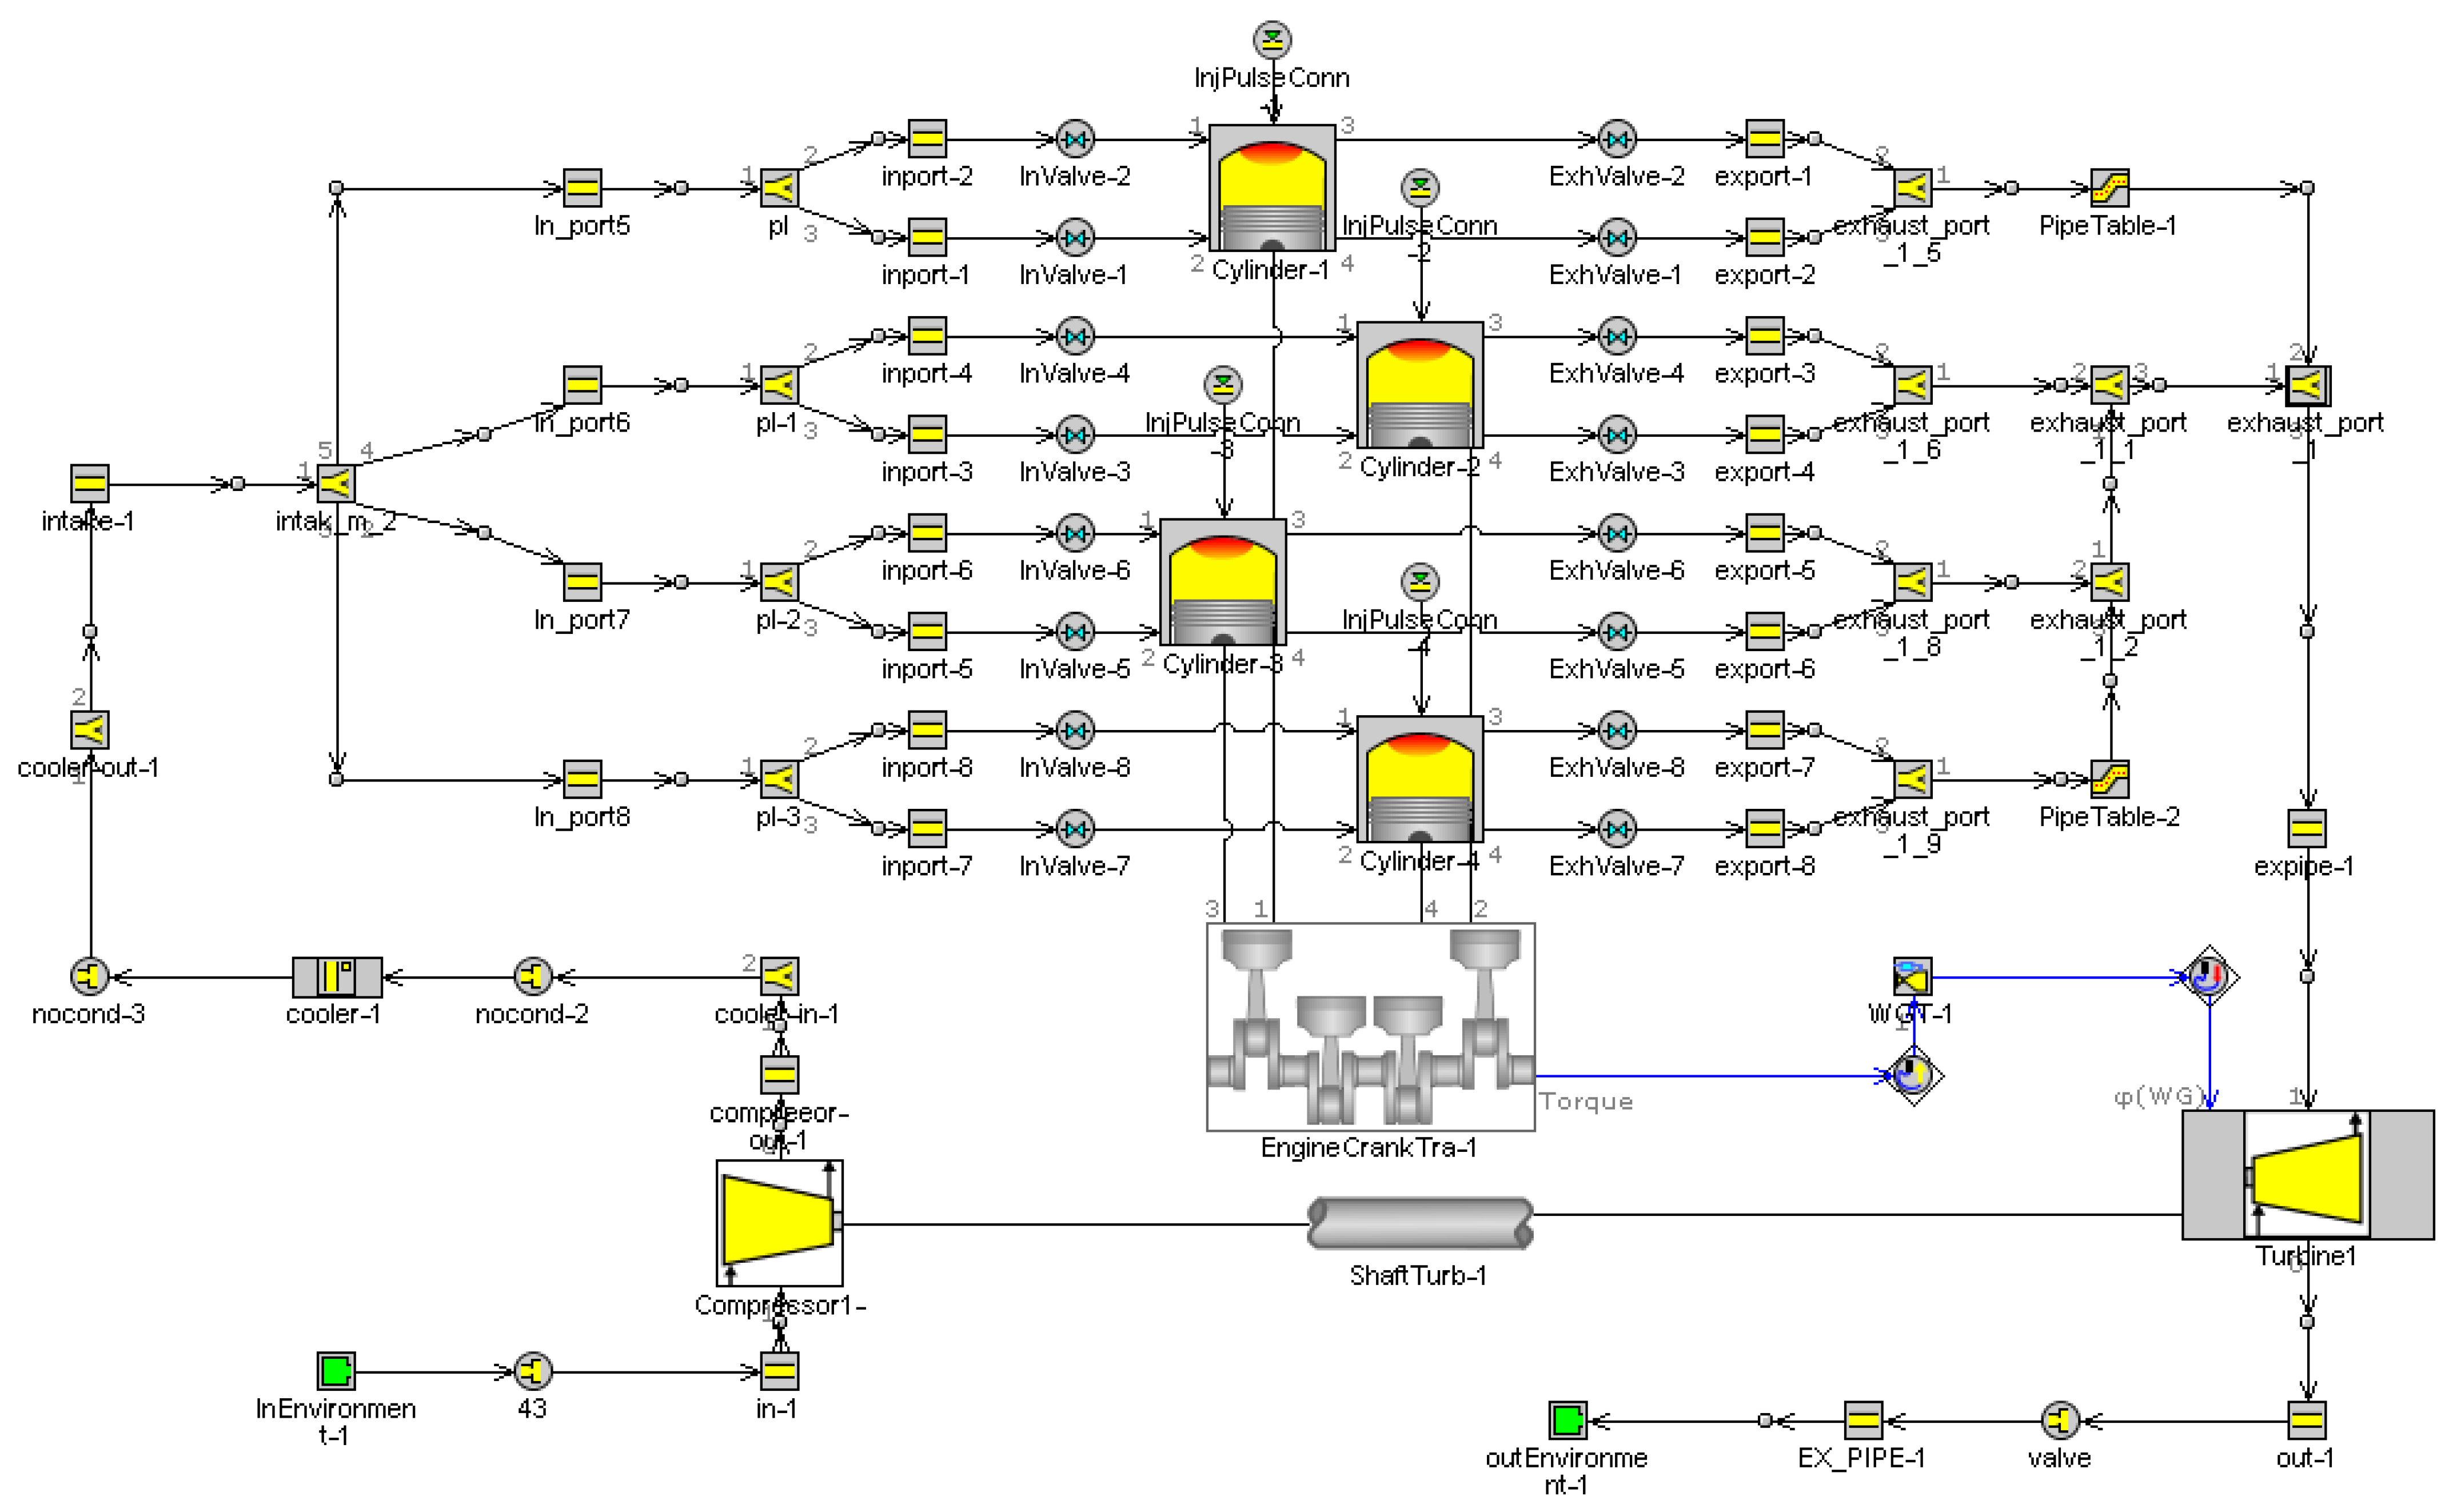
2.1. Research Methodology and Research Objects

A turbocharger was used as the research object. Table 1 lists its parameters. Figure 2 shows the three-dimensional (3D) structure.
Figure 3 shows the constructed one-dimensional (1D) model using GT-Power. The basic assumptions [31] are as follows:
  • the admission and the mixed gas are considered as ideal gases, affected by temperature and gas composition.
  • the working fluid is in a uniform state, the inlet and outlet kinetic energy are negligible, and the inlet gas and the residual exhaust gas are completely mixed instantaneously.
  • during the heat release process, the working fluid in the system is heated externally according to the established heat release law.

2.2. Mathematical Model

In this study, the simulation platform is ANSYS software (version 17.0, ANSYS Corporation, Canonsburg, PA, USA), which is widely used in various fields such as aviation, aerospace, electronics, automotive, and civil engineering. Among them, the mesh processing is an ANSYS ICEM CFD module, and the model setup and solution is an ANSYS CFX module. The ANSYS ICEM CFD module can quickly process 3D models, divide structured or unstructured meshes, and adopt the integrated automatic optimization of mesh quality and automatic mesh encryption technical routes. The computer information is shown in Table 2.
The mathematical model in the turbocharger performance simulation uses the Reynolds averaged Navier–Stokes equations, and the turbulence model uses the SST two-equation model. The SST model has good applicability when dealing with impeller mechanics [32] and is closest to the experimental values [33], capturing the complete airflow separation process at the suction surface of the blades [34].

2.3. Design and Validation of the Model

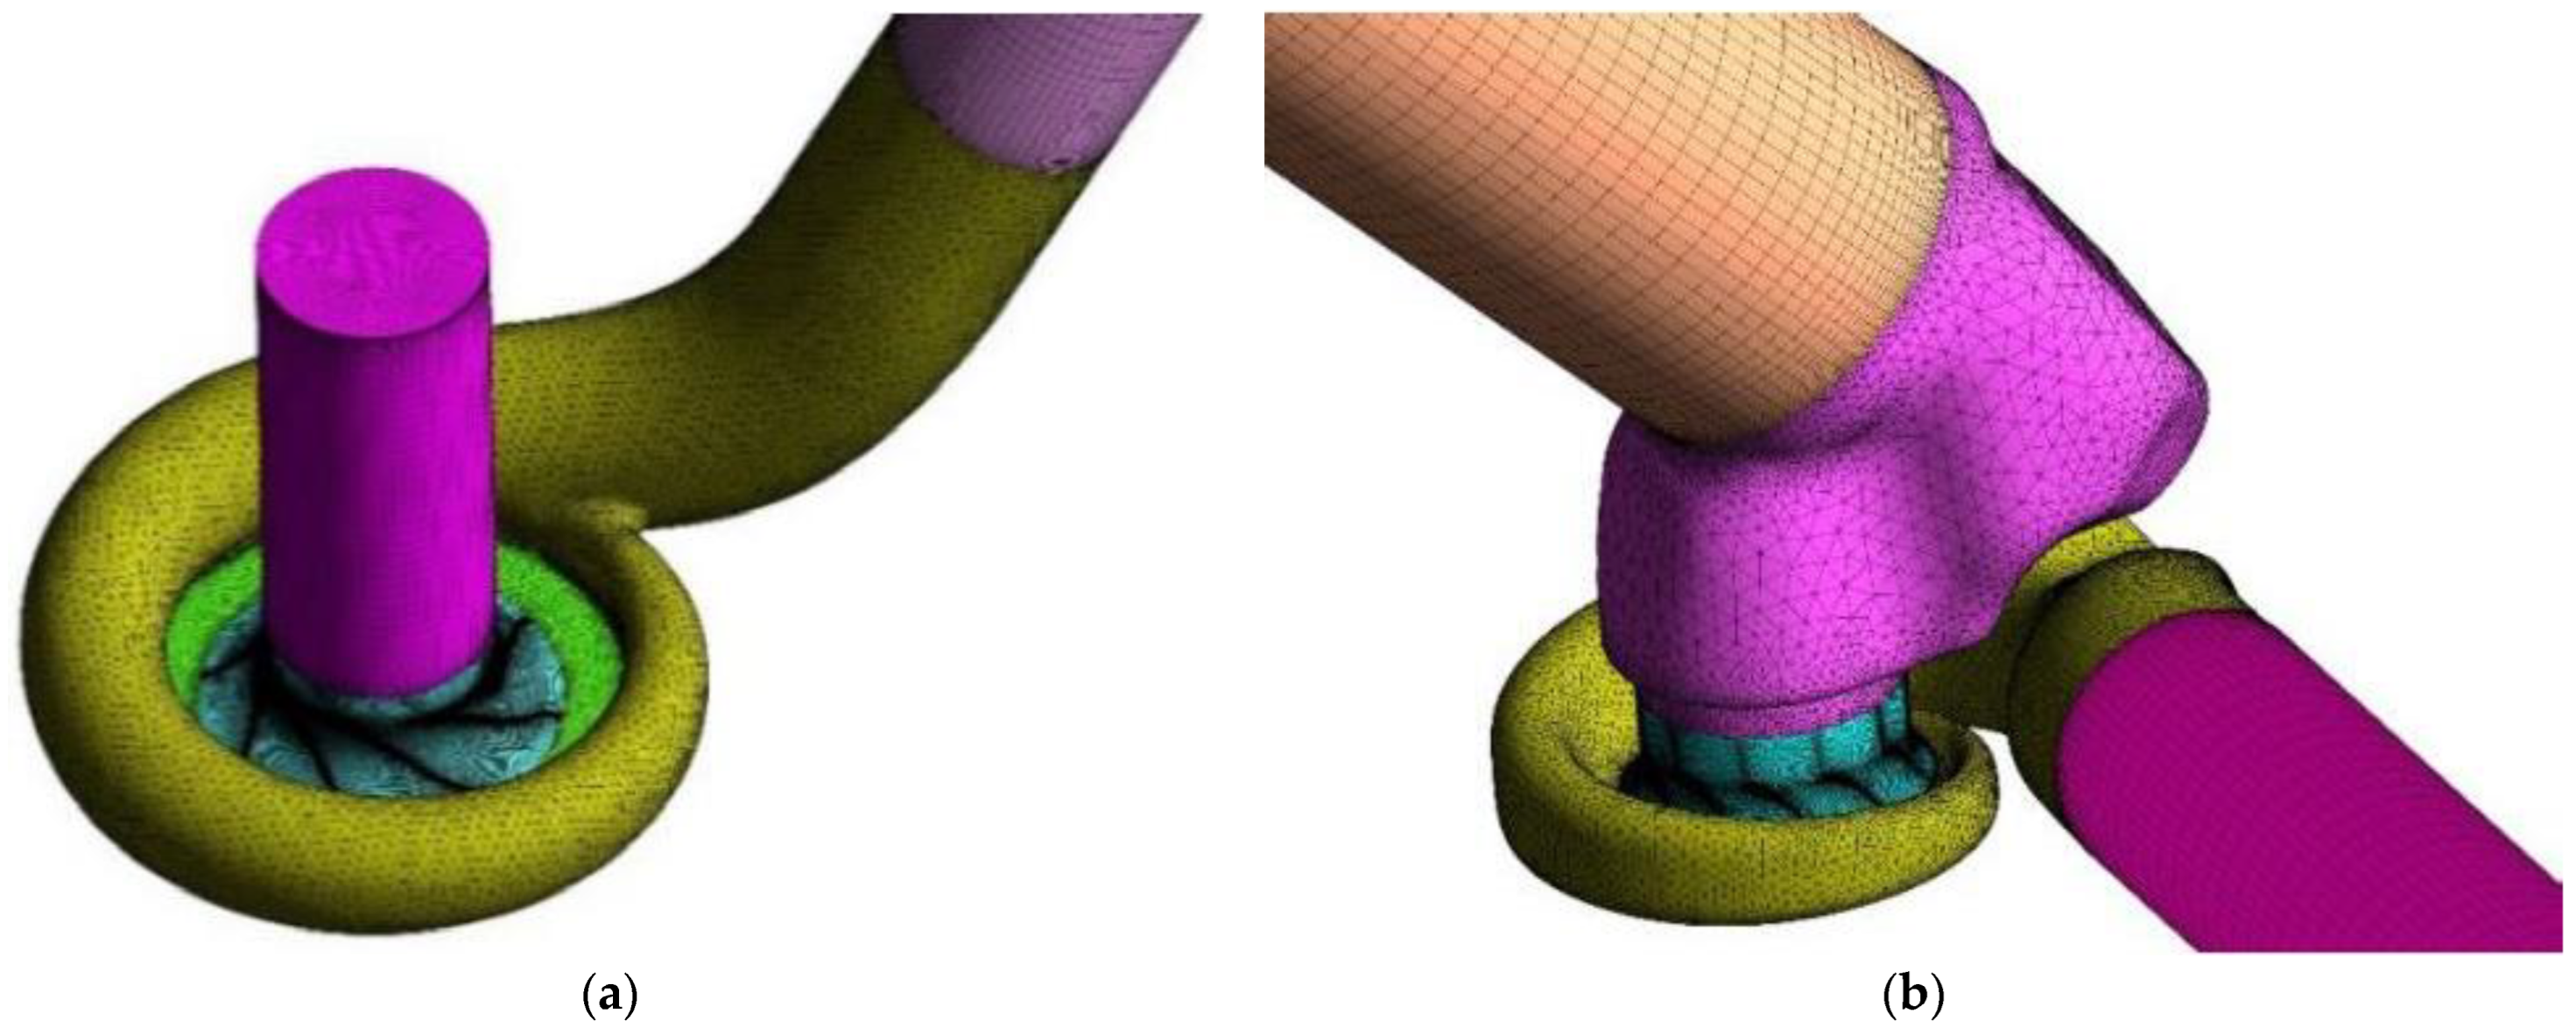
2.3.1. Mesh Division

A diagram of the meshed geometry is shown in Figure 4. The compressor model consists of six parts, which are the inlet duct, impeller rotation domain, wheel back clearance, diffuser, separate compressor volute, and outlet transition. Among each fluid domain of the compressor, the structural mesh is used for the inlet duct, the outlet transition, and the impeller rotation domain, and the other parts use the unstructured mesh. Table 3 shows the number of elements for the compressor in each domain.
The turbine model consists of six parts, which are the inlet duct, separate turbine volute, impeller rotation domain, wheel back clearance, outlet transition, and outlet duct. Among each fluid domain of the turbine, the structured mesh is used for the inlet duct, the outlet duct, and the impeller rotation domain, and the other parts use the unstructured mesh. Table 4 shows the number of elements for the turbine in each domain.
In a turbocharger model, the higher the number of elements, the better the computational accuracy. However, the larger the number of elements, the more computational resources are required, and a balance between simulation accuracy and computational speed is needed. Therefore, it is necessary to verify the independence of the number of elements in the turbocharger model. The results show that when the mesh number of the compressor reaches 3,358,000, the performance curve of the compressor is gently distributed and has met the simulation requirements, as shown in Figure 5a. When the turbine grid number reaches 3,867,000, the performance curve of the turbine is basically level, and the grid number has met the simulation requirements, as shown in Figure 5b.

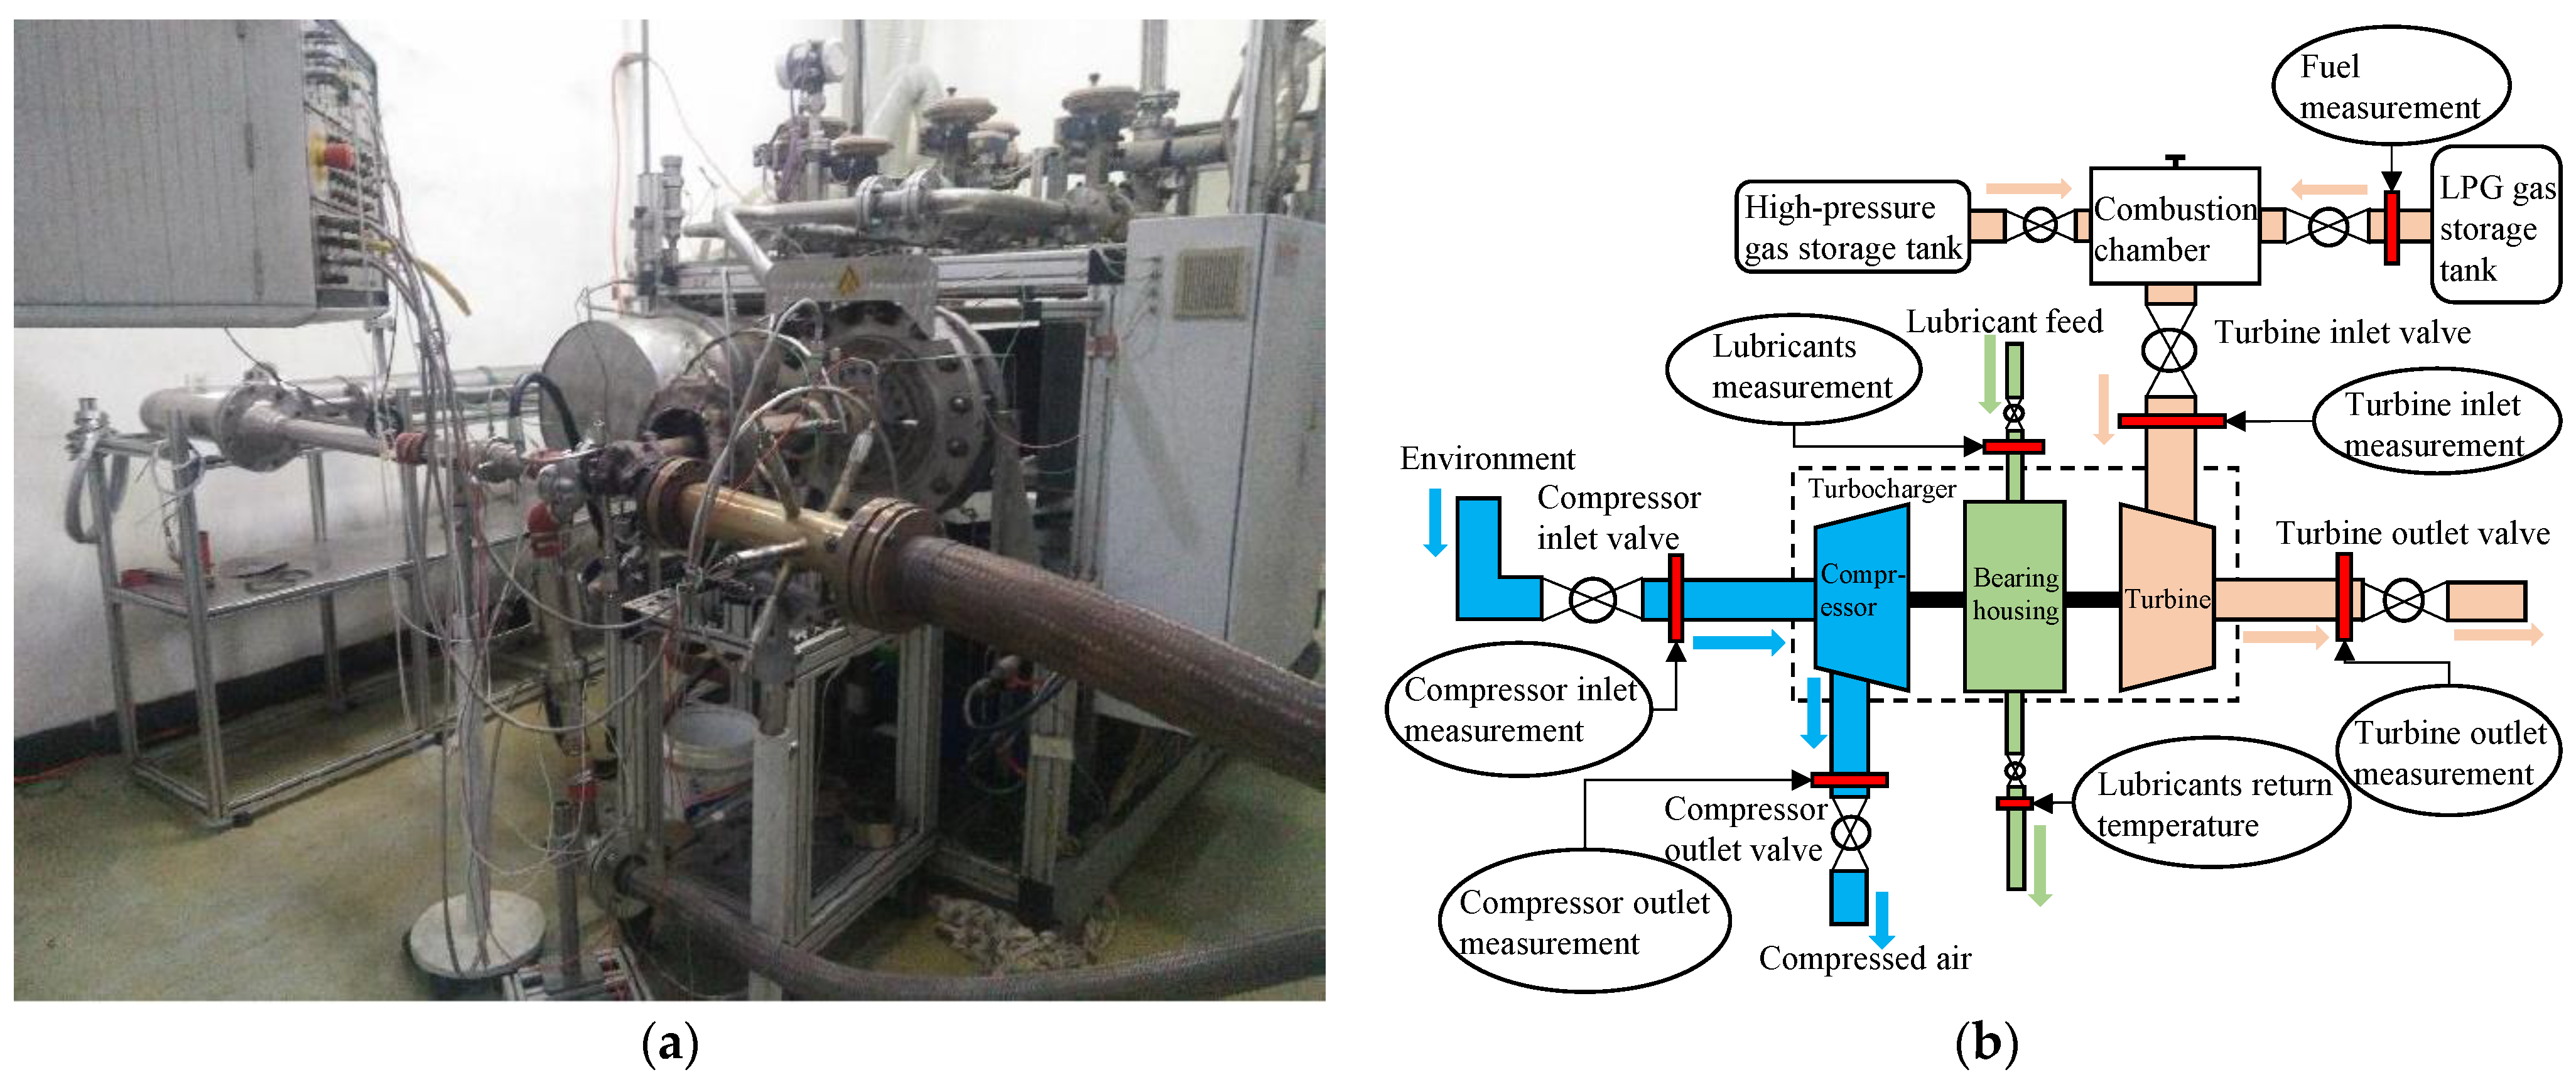
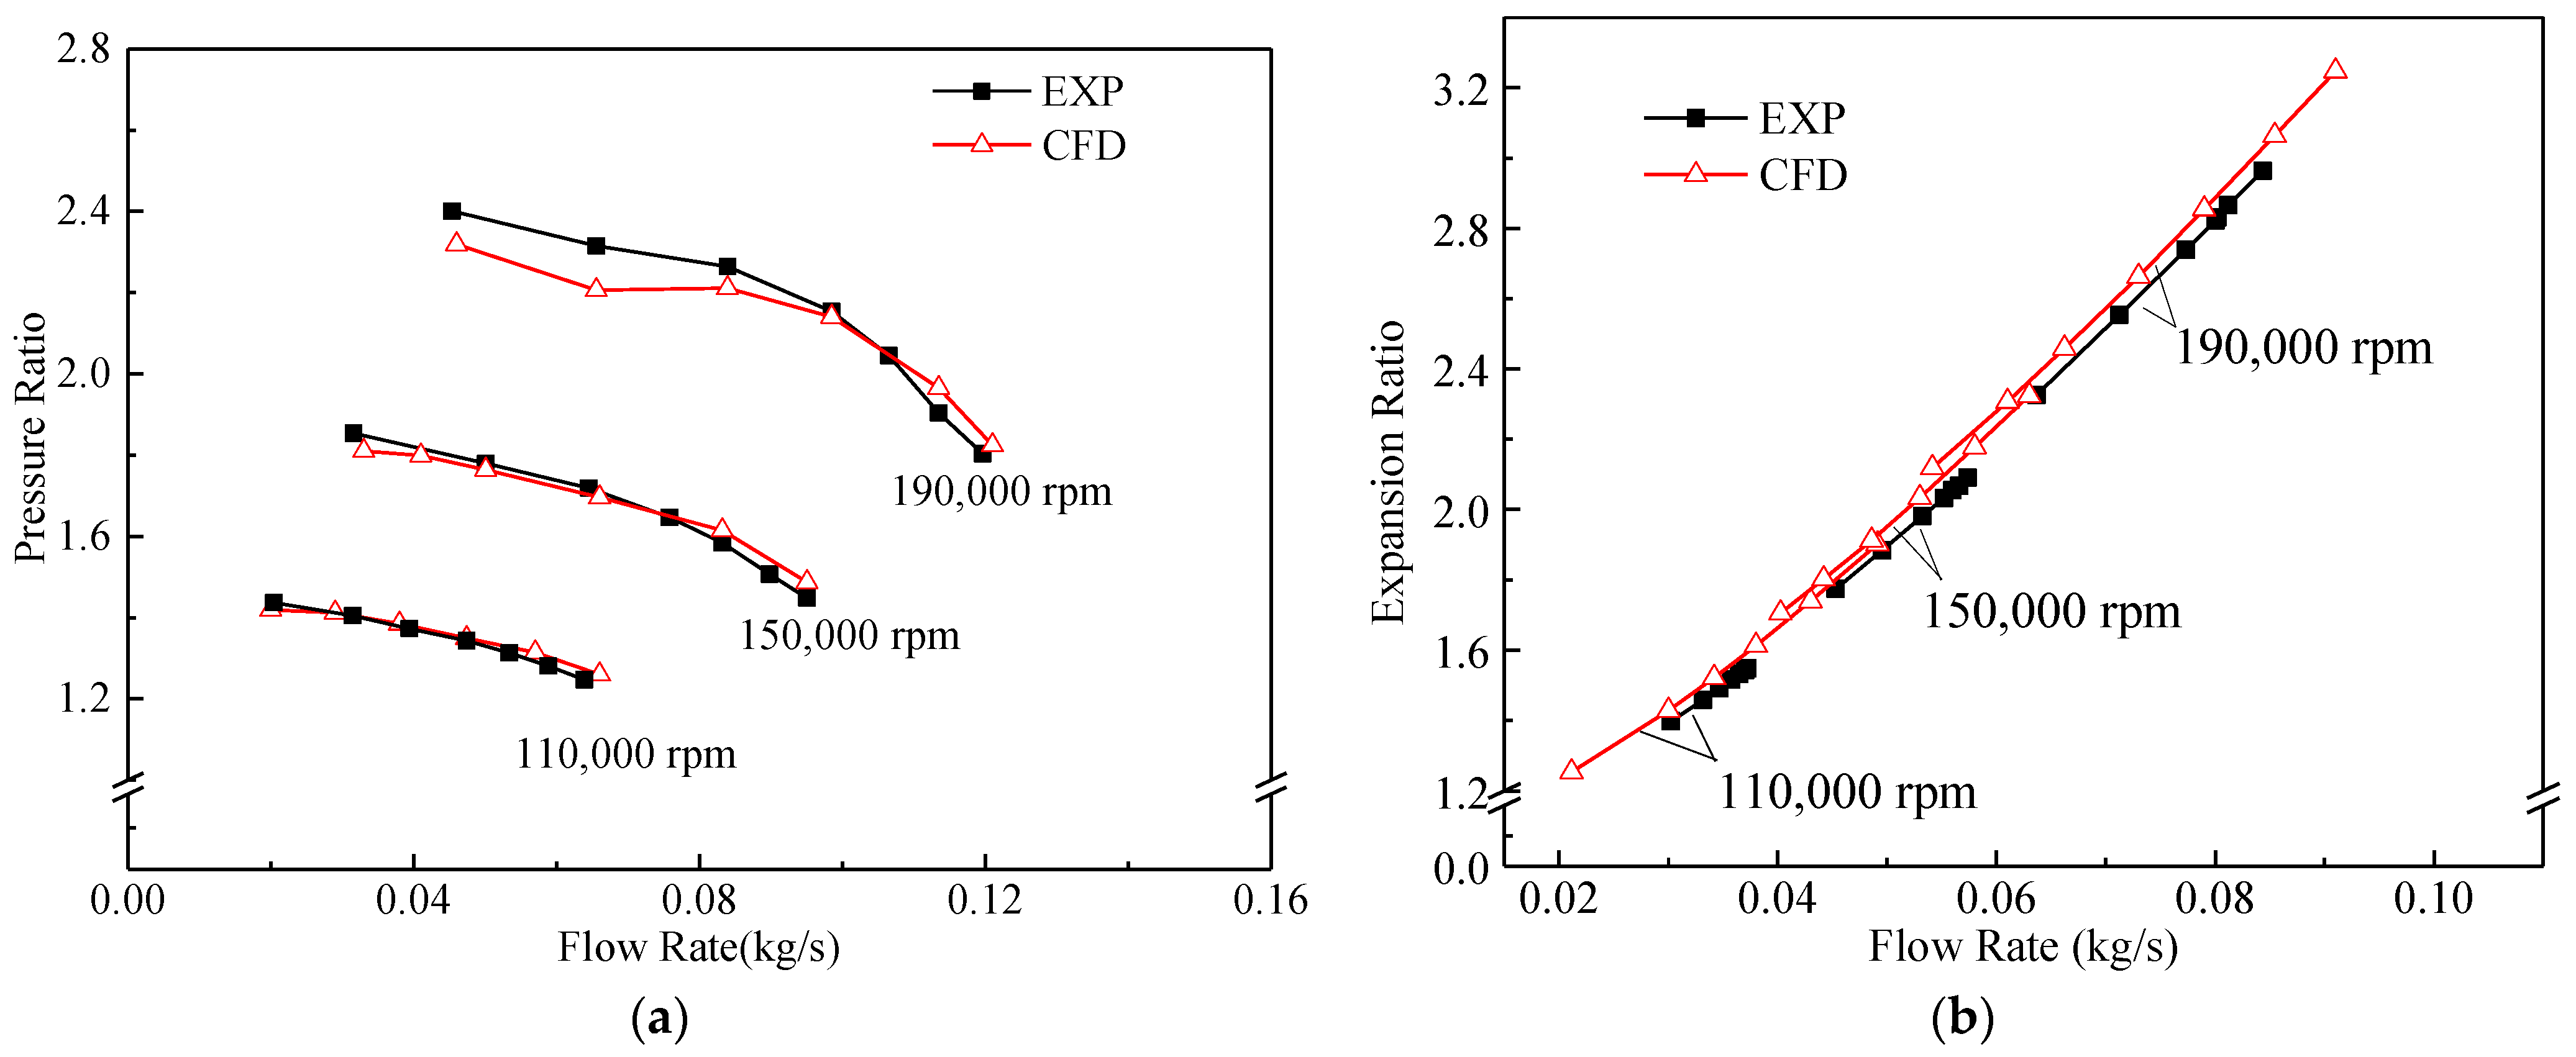
2.3.2. Test Preparation and Validation

The turbocharger performance tests were conducted on a Kratzer turbocharger test bench, as shown in Figure 6a. Figure 6b shows a schematic diagram of the arrangement.
The turbocharger test validation was conducted on the Kratzer test bench. Three speeds of 110,000 rpm, 150,000 rpm, and 190,000 rpm were selected to represent the low, medium, and high speed ranges of the turbocharger operation conditions, respectively. In this study, the validation method has been published in previous papers [35,36].
Figure 7a shows the comparison between the experiment and simulation of the pressure ratio of the original compressor. Overall, there are small errors in the pressure ratio results, and the maximum error occurs at 190,000 rpm, which is 4.71%. The overall error value of the compressor is within the acceptable range. Figure 7b shows the comparison between the experiment and the simulation of the swallowing capacity of the original turbine. The maximum error occurs at 150,000 rpm, which is 2.62%. The overall error value of the turbine is within the acceptable range. Therefore, the compressor and turbine models were able to carry out the next step of this study.

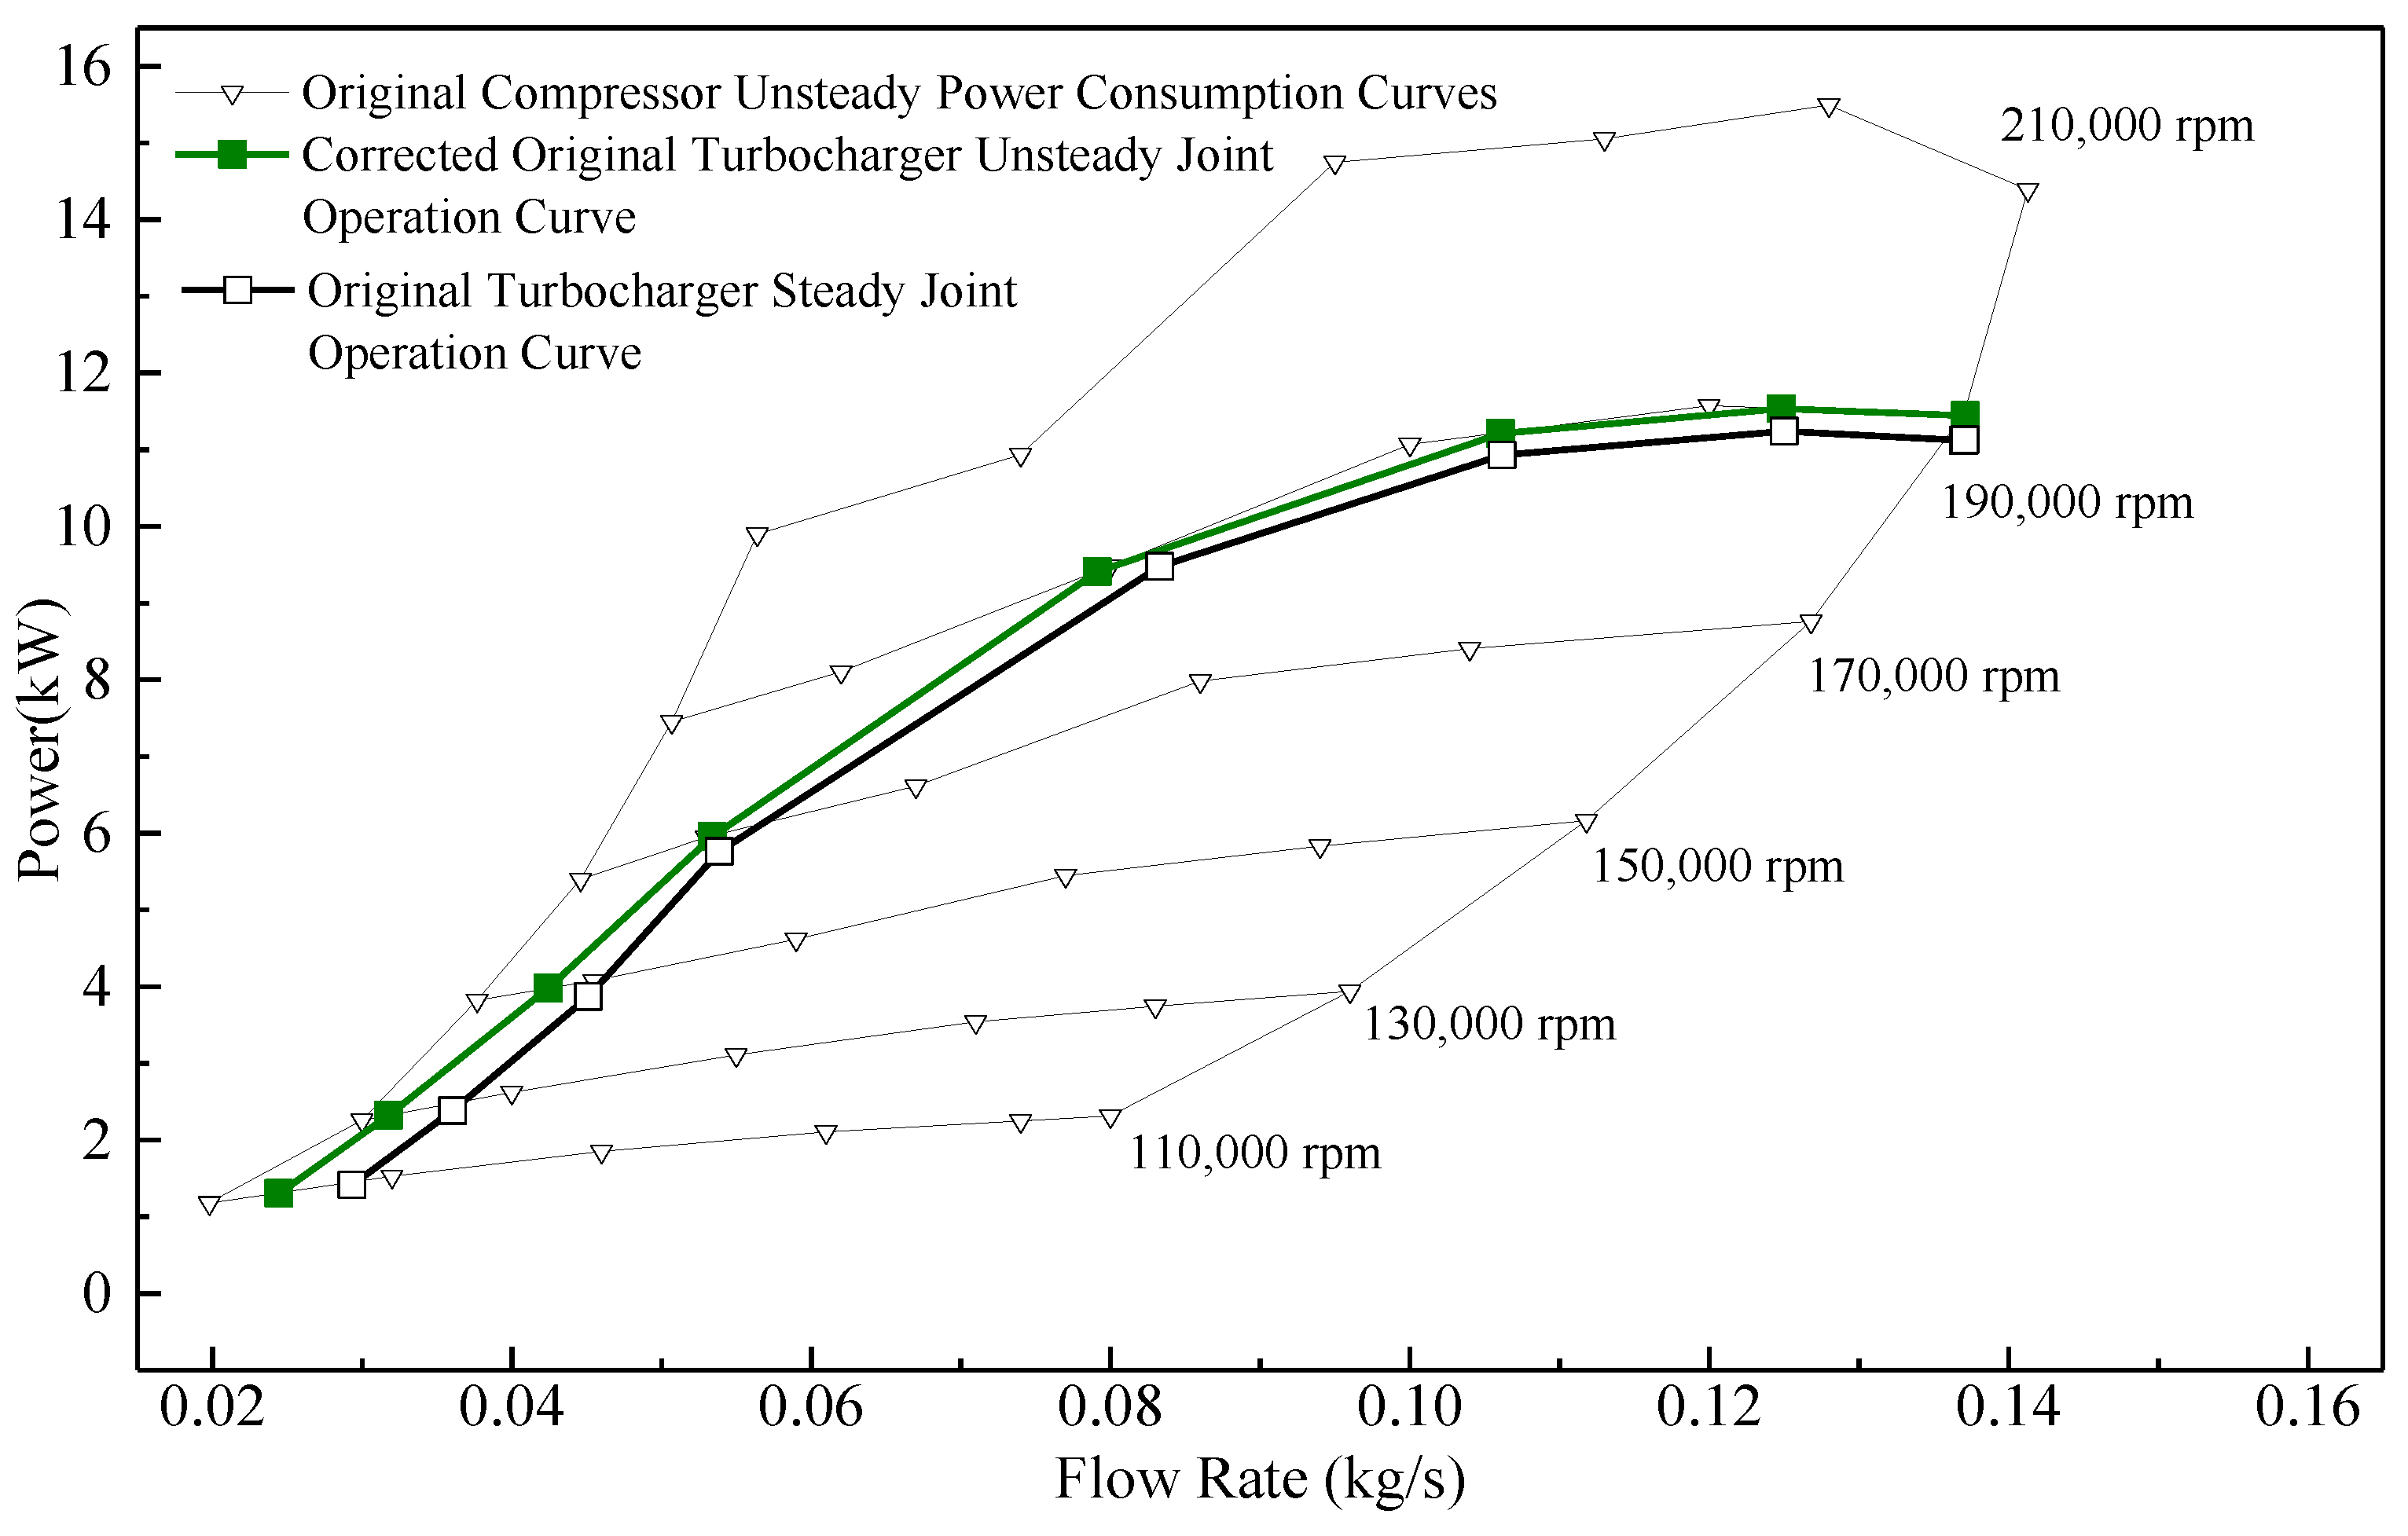
2.3.3. Internal Joint Operation Curve Analysis

There are three matches between the engine and turbocharger that need to be considered. These three matches are the matching of the compressor and turbine of the turbocharger to the engine, respectively, and the internal matching between the compressor and the turbine. The internal balance of the turbocharger must meet speed balance, flow rate balance, and power balance [37].
In a speed line, the compressor power consumption curve and the turbine effective power curve were superimposed and coupled, and the horizontal coordinates of both are the compressor flow rate, and the obtained power balance point, as shown in Figure 8. The power balance point is the joint operating point of the turbocharger at that speed. In this study, the coupling method has been published in previous papers [38].
Based on the principle that the maximum operating speed of the turbocharger was 190,000r/min, different bypass valve openings of the turbine were set. At each opening, there was a power balance point between the effective power curve of the turbine and the power consumption curve of the compressor at 190,000 r/min, which was the joint point at the bypass valve opening, as shown in Figure 9a. The joint operating points in Figure 9a were connected in sequence to form the turbocharger’s complete internal joint operating curve when the turbine bypass valve was open, as shown in Figure 9b. The curve reflects the performance of the match between the engine and the turbocharger, which is closer to the actual engine performance.

3. Results

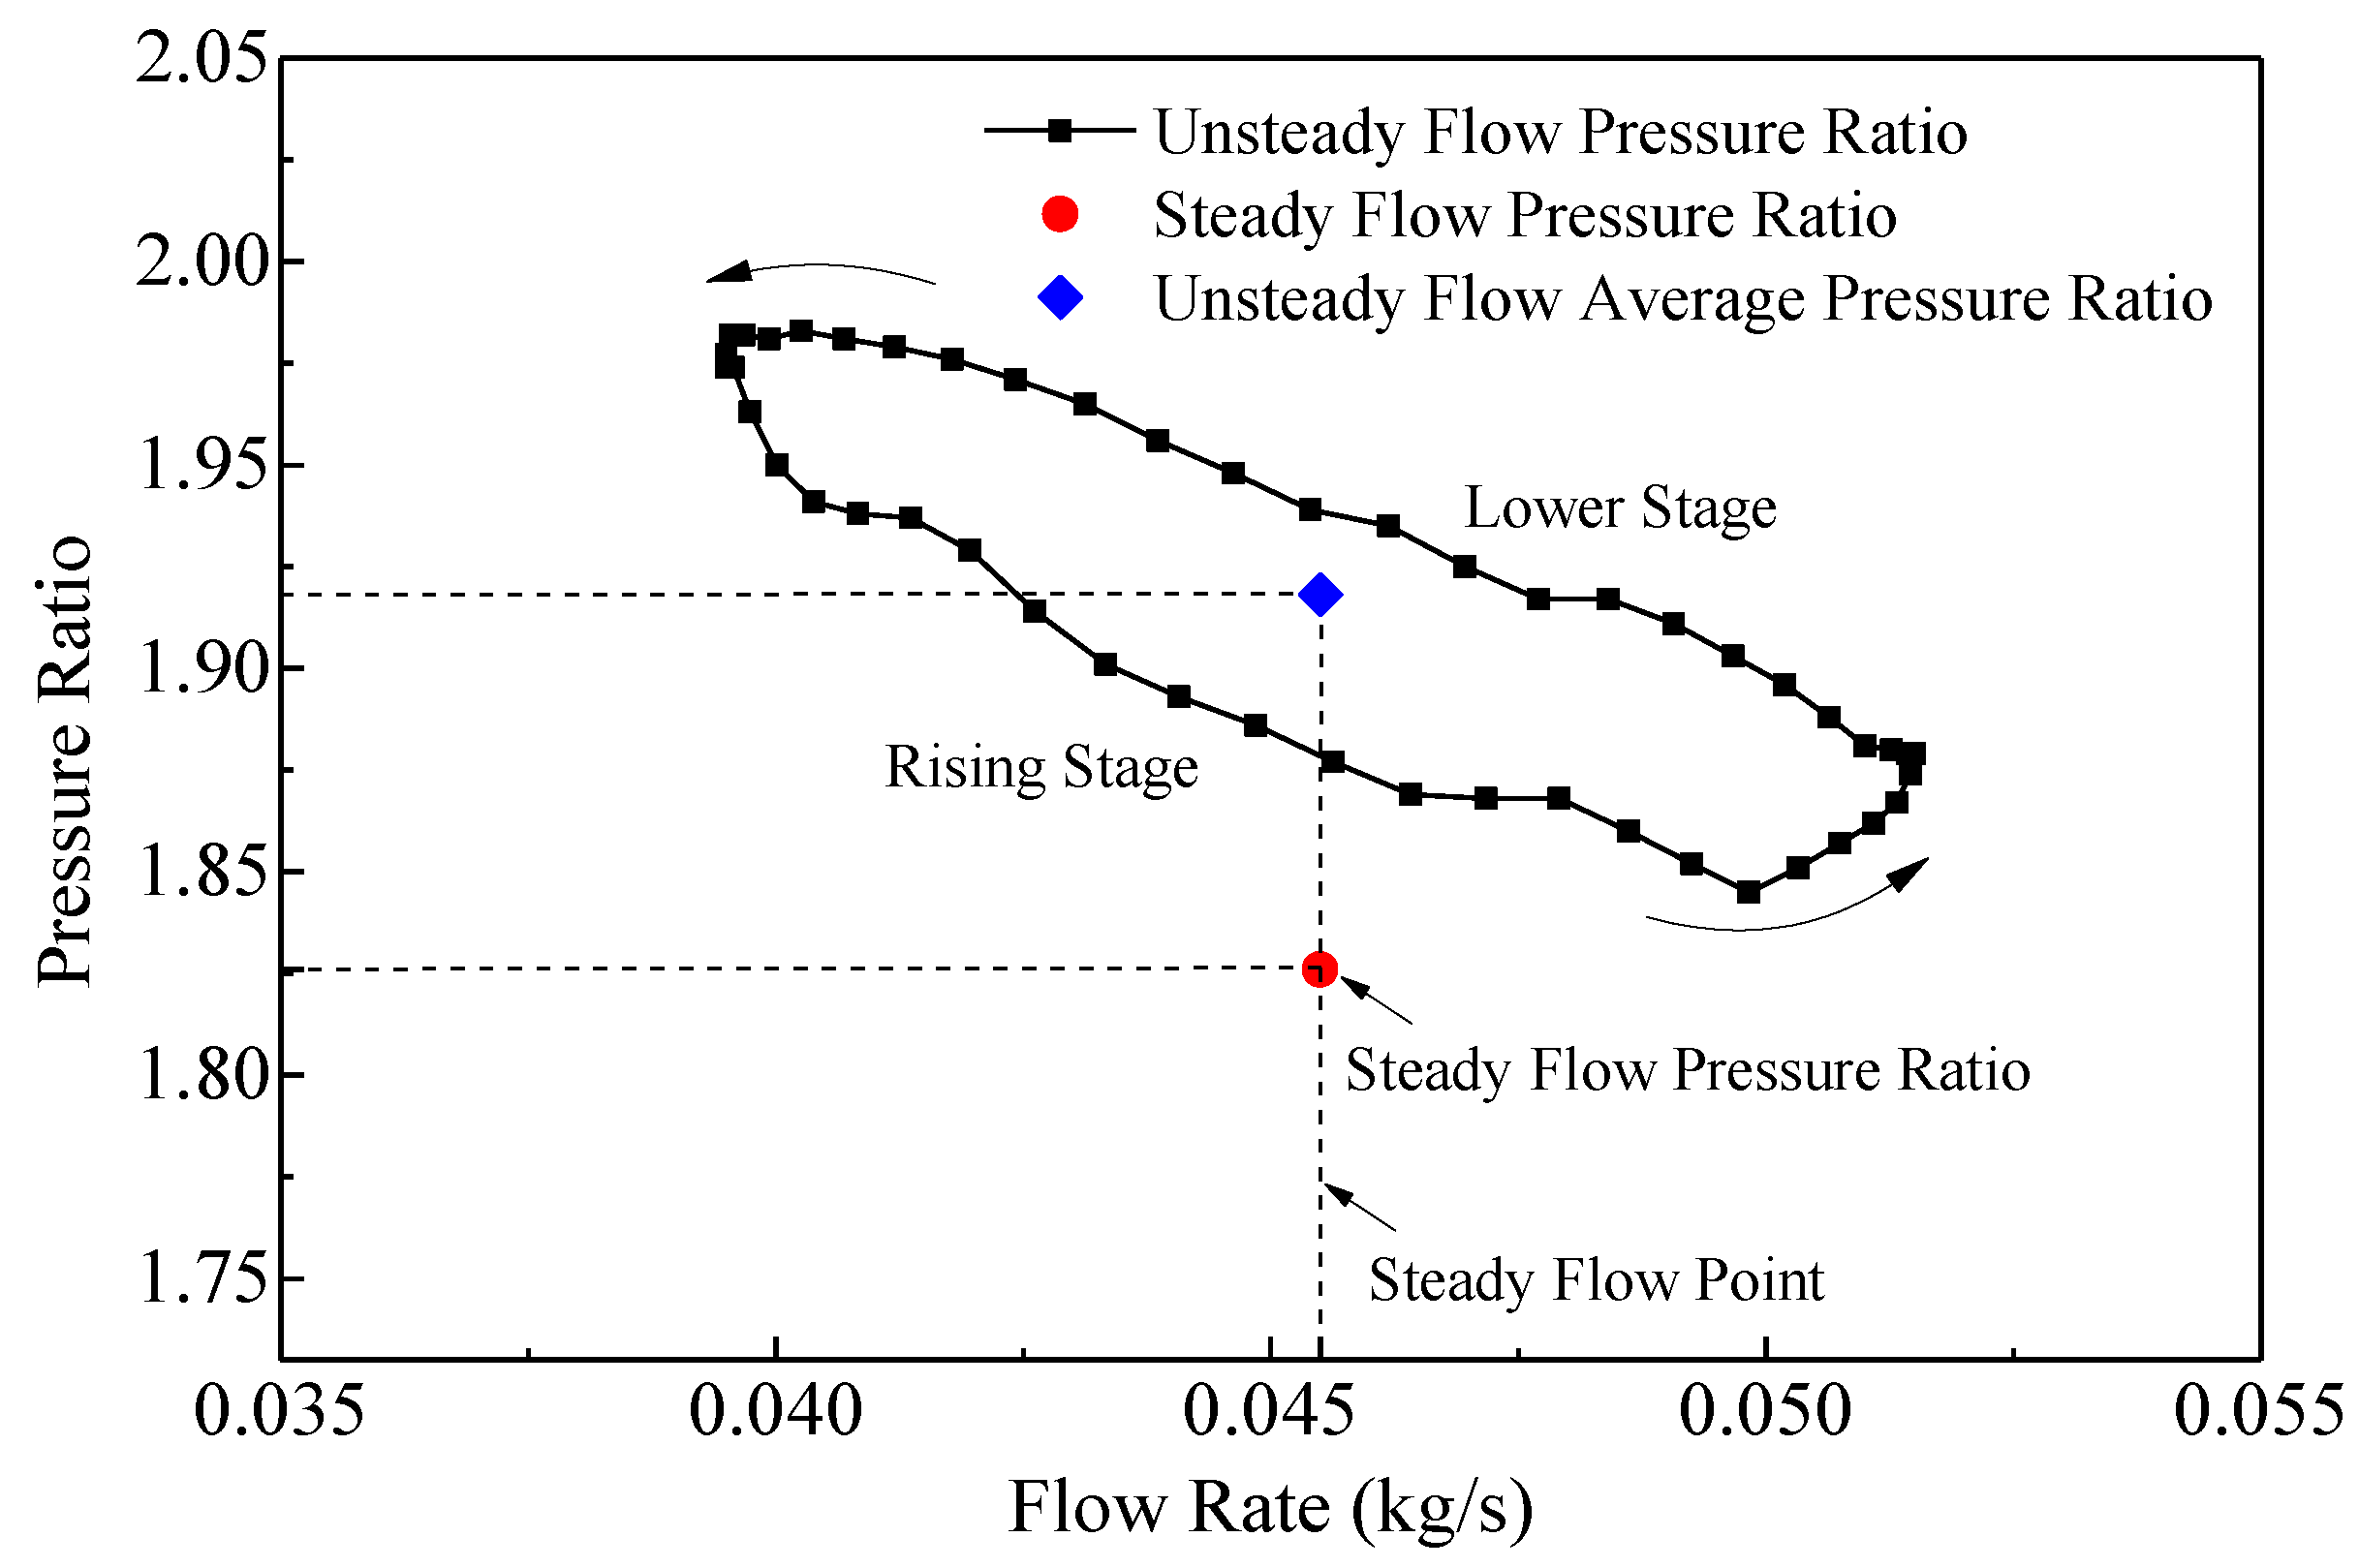
3.1. Concept and Calculation Method of Unsteady Correction for Compressor

The unsteady flow pressure ratio curve of the compressor forms a circle, which is formed during a fluctuation cycle of the compressor, and the unsteady flow pressure ratio characteristic circle is distributed counterclockwise according to the sequence of time, as shown in Figure 10. At the same flow rate, the pressure ratio of the rising section before the peak is smaller than that of the lower stage after the peak, and the pressure ratio difference between them is about 3.3%. The average value of the pressure ratio characteristic circle is higher than the corresponding steady flow pressure ratio, and the difference between them is 4.4%, as shown in Table 5. This indicates that the average value of the unsteady flow pressure ratio of the compressor cycle is clearly different from the steady flow pressure ratio.
In the pressure ratio characteristic circle of the compressor, the maximum flow rate is not in the minimum pressure ratio position, which is at the end of the rising section before the peak, and a hysteresis effect appears in the pressure ratio curve. In the case of steady flow, the higher the flow rate, the smaller the pressure ratio, and the flow rate and pressure ratio are in correspondence. It shows that the distribution of the pressure ratio of unsteady flow and steady flow is different.
The average values of compressor performance based on two unsteady flow cycles are presented, as shown in Table 5. The average values of unsteady flow performance are higher than the corresponding steady flow performance, with a difference of 4.4% to 5.4%. All the compressor unsteady flow performance deviates significantly from the steady flow condition. The premise of the unsteady flow correction for the compressor is to calculate the degree of deviation of the unsteady flow performance. The ratio of the unsteady flow performance to the corresponding steady flow performance is the compressor unsteady flow correction coefficient.
The variation of the compressor power consumption affects the power balance between the compressor and the turbine according to the turbocharger internal match. Therefore, the average ratio of the compressor’s unsteady flow power consumption and the corresponding steady flow power consumption is defined as the compressor unsteady flow power consumption coefficient, which is used to indicate the degree of deviation of the compressor unsteady flow power consumption from the corresponding steady flow power consumption, and the formula for calculating the compressor unsteady flow power consumption coefficient is shown in Equation (1). The unsteady flow power consumption coefficient is the compressor unsteady correction coefficient.
ε C = P u n s t e a d y P s t e a d y ,
where P u n s t e a d y is the average value of compressor power consumption for unsteady flow and P s t e a d y is the corresponding compressor steady flow power consumption value.
According to Table 5, the joint point of the original compressor unsteady flow power consumption coefficient is 1.055 at 150,000 rpm, which is the unsteady correction coefficient at this point. The correction factor is used to indicate the deviation of the compressor unsteady flow power consumption from that of the corresponding steady flow. The unsteady flow performance at 150,000 rpm is shown in Table 6.
The correction of the unsteady flow of the compressor is to use the unsteady flow power consumption coefficient to correct the steady flow power consumption map and the internal joint operation curve, as shown in Table 7. The modified maps are the original compressor and an optimized compressor with a 1mm reduction in inlet diameter.

3.2. Concept and Calculation Method of Unsteady Correction for Turbine

The turbine unsteady flow performance is more accurate to assess the turbine actual operating performance. The work to obtain the turbine unsteady flow performance is very large and hard to cover the full range of operating conditions, so it is difficult to realize the engineering application. It is necessary to quantify the degree of performance difference between unsteady flow and steady flow with the help of specific unsteady flow conditions. Corresponding correction coefficients are presented, and the turbine steady flow performance and corresponding internal joint operation curves are corrected, so that the corrected turbocharger performance is closer to the actual operating conditions.
In the pulse boost system, the pulse energy utilization coefficient is used to evaluate the degree of turbine energy utilization. The larger the pulse energy utilization coefficient is, the higher the degree of exhaust gas energy utilization by the turbocharger. The ratio of the turbine mean unsteady flow output power to the corresponding steady flow power is defined as the pulse energy utilization coefficient, which is the turbine unsteady correction coefficient. The turbine unsteady flow effect is more pronounced than the compressor end, and the turbine steady flow performance and the internal joint operation curve are more in need of unsteady flow correction.
The turbine effective power and internal joint operation curves are corrected using the pulse energy utilization coefficient, and the values of the pulse energy utilization coefficient are shown in Table 8. The turbine unsteady flow correction structures are the original turbine and the optimized 9-blade twin-entry turbine.

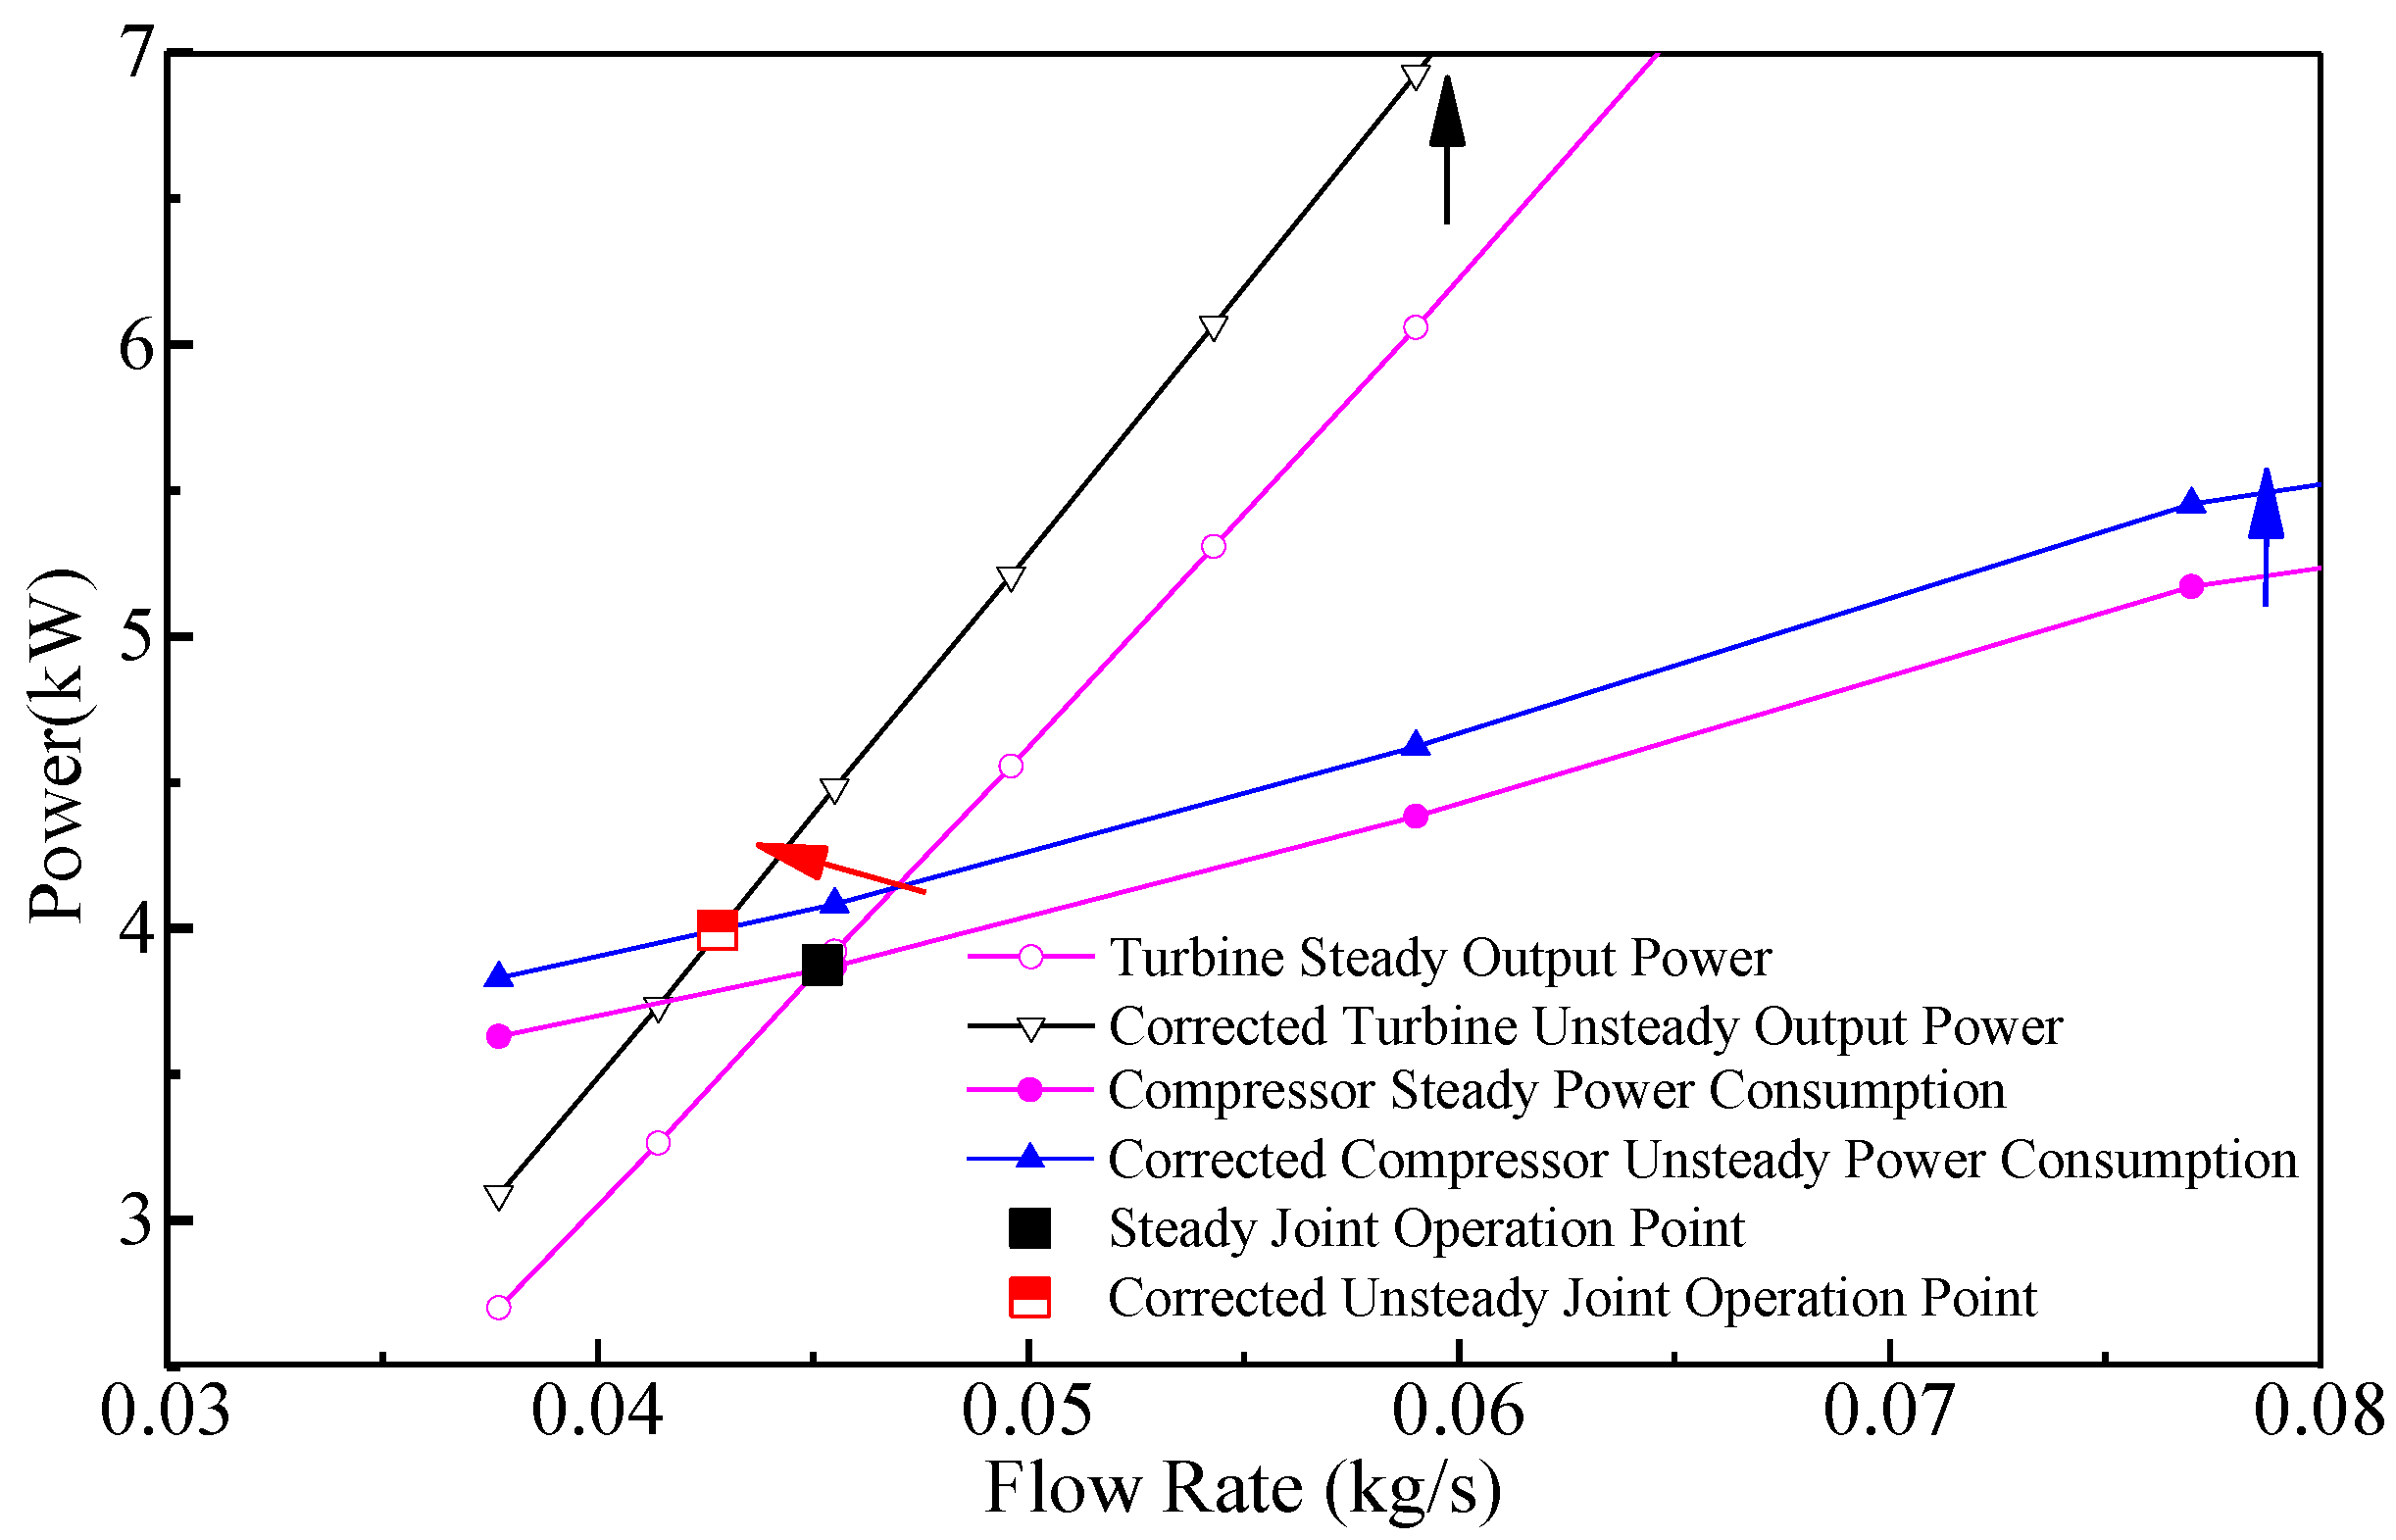
3.3. Simultaneous Unsteady Correction at Compressor and Turbine

Both the compressor and the turbine are at the unsteady flow boundary when the turbocharger matches the engine operation, and it is necessary to consider the unsteady flow coefficients at both ends of the turbocharger at the same time. The separate unsteady flow correction is carried out in the previous section to illustrate the effects of the compressor and turbine unsteady flow and the correction methods separately, which are the basis and reference for accounting for the unsteady coefficient correction at both ends simultaneously. Turbocharger performance at medium-low speeds is quantitatively evaluated by surge margin [39,40]. In addition, the definition of the surge margin (SM) used in this paper is
S M = ( P s m s c o r P w m w c o r 1 ) × 100 %
where P s is corrected power consumption at surge, m s c o r is corrected flow rate at surge, P w is corrected power consumption at operation point, m w c o r is corrected flow rate at operation point.
The corrections of the unsteady coefficient at both ends of the turbocharger are carried out based on Table 7 and Table 8. The compressor steady flow power consumption is corrected by the unsteady flow power consumption coefficient, as well as the turbine steady flow effective output power for the corresponding speed is corrected by the pulse energy utilization coefficient. Then, the corrected compressor power consumption curve and the corrected turbine effective output power curve are coupled to obtain the internal joint operating point for the unsteady coefficient correction at both ends simultaneously. The corrected joint point clearly shifts to the left and slightly up at 150,000 rpm, as shown in Figure 11.
The compressor power consumption curves and turbine effective output power curves for all revolution speed steady flows are superimposed and coupled with unsteady flow corrections to obtain the corrected internal joint operation curves at both ends of the turbocharger, respectively. The curve based on the original turbocharger with unsteady flow correction at both ends is shown in Figure 12. The curve based on the optimized turbocharger with unsteady flow correction at both ends is shown in Figure 13. The compressor power consumption maps are corrected by the unsteady coefficient in Figure 12 and Figure 13.
Compared with the steady flow curve, the curves are corrected by the unsteady coefficients at both ends shifting both to the left and up, with a larger shift to the left because the shift to the left corresponds to the turbine unsteady flow effect and the shift up corresponds to the compressor unsteady flow effect. The turbine unsteady flow effect is stronger than the compressor unsteady flow effect, especially in the medium–low-speed range; therefore, the correction of the internal joint operation curve shifts more to the left. The curve of the optimized turbocharger is corrected by unsteady coefficients at both ends shifting more compared to the original turbocharger due to the stronger unsteady flow effect at both ends of the optimized turbocharger.
In order to compare the performance of the two turbochargers, Figure 12 and Figure 13 are combined into a comparative figure of turbocharger performance in the same coordinate system, as shown in Figure 14. The main difference in the corrected curves of the two turbochargers is in the medium–low-speed range. The corrected curve of the optimized turbocharger is to the left of that of the original turbocharger, and the corrected curve of the optimized turbocharger is in the stable region to the right of the optimized compressor surge line. It shows that after unsteady correction at the compressor and turbine, the internal joint operation curves shift toward the surge line. The original turbocharger’s surge margin is reduced by 4.6% to 11.8%, and the optimized turbocharger’s surge margin is reduced by 15.2% to 21.9% in the medium–low-speed range, which makes the turbocharger work earlier and improve the response characteristics. It can improve the admission performance of the engine at medium–low speeds.
There is no significant difference between the corrected internal joint operation curves of the two turbochargers at 190,000 rpm, except near the compressor blocking point, as shown in Figure 14. In the operating conditions near the blocking point, the corrected curve of the optimized turbocharger is lower than that of the original turbocharger because the inlet diameter is reduced by 1 mm. The pressure ratio and power consumption of the optimized compressor in this range are lower than that of the original compressor. The steady flow curves of the two turbochargers basically overlap in the medium–low-speed range, which differs significantly from the assessment results of the unsteady flow. In contrast, both ends of the turbocharger are operating under unsteady flow conditions of the engine, so the unsteady flow method should be used to evaluate and correct the turbocharger performance, and the assessment of the turbocharger performance using the steady flow method shows significant deviations.

4. Discussion

The steady isentropic efficiency is one of the main performance parameters of compressors and turbines and is an indicator to evaluate the perfection of their structural design [41,42,43]. The steady isentropic efficiency is proposed based on steady flow and cannot fully reflect the energy utilization of the booster under unsteady flow conditions. Therefore, the concept of the turbocharger unsteady flow energy utilization factor is proposed to quantitatively assess the turbocharger energy utilization under actual operating conditions, which is the ratio of the turbine pulse energy utilization coefficient to the compressor unsteady flow power consumption coefficient. The unsteady flow energy utilization coefficient can be attained as per the following equation:
ε = ε T ε C
where ε T and ε C are the turbine pulse energy utilization coefficient and the compressor unsteady flow power consumption coefficient, respectively.
In Equation (3), each coefficient is 1 at the steady state. While the compressor’s unsteady power consumption is more than that of the steady flow, ε C is greater than 1, indicating that the compressor operating consumes extra energy due to the unsteady flow effect. When the turbine is under unsteady flow conditions, ε T is greater than 1, indicating that the turbine’s unsteady output power is greater than the corresponding steady output power, increasing the degree of turbocharger energy utilization, which is consistent with the actual operating conditions. The turbocharger unsteady flow energy utilization coefficient needs to consider the unsteady flow effects at both the compressor and the turbine. A combined coefficient ε is formed through the unsteady coefficients of the compressor and turbine, quantifying the energy conversion under unsteady flow conditions.
Figure 15 shows the trend of the unsteady flow energy utilization coefficients of the two turbochargers on the corrected internal joint operation curve. The unsteady flow energy utilization coefficient keeps decreasing with the speed and flow rate rise. The energy utilization coefficient is higher and the curve distribution is steeper at medium–low speeds because of the significant turbine unsteady flow effect. In the high-speed range at 170,000 rpm and beyond, the overall unsteady flow effect is weak for both the compressor and the turbine, and the compressor unsteady coefficient is close to 1, resulting in a flat distribution of unsteady flow energy utilization coefficients. The unsteady flow energy utilization coefficient of the optimized turbocharger is significantly higher than that of the original turbocharger, especially in the medium–low-speed range, which is more than 14.5% higher. The energy utilization advantage is obvious, which can effectively improve the admission performance of the engine in the medium–low-speed range.
The design and performance studies of compressors and turbines are mostly independent of each other, which is different from the real conditions of turbochargers. The results of optimizing the compressor and turbine separately and optimizing both ends of the turbocharger simultaneously based on the joint operating curves show that optimizing one end of the turbocharger separately results in poorer engine performance than optimizing both ends of the turbocharger. The optimized turbocharger increases the maximum torque by 9.6% and decreases the minimum brake-specific fuel consumption (BSFC) by 4.4% compared to the original engine, resulting in a significant performance advantage in the medium–low-speed range, as shown in Figure 16. It is consistent with the findings of the previous section on the comparison of the joint internal operating curves of the turbocharger and further suggests that the corrected unsteady flow method should be used to evaluate and correct for both ends of the turbocharger performance.

5. Conclusions

In this article, the internal joint operation curve has been proposed and tested. The turbocharger performance is investigated under the unsteady flow boundary conditions of the engine, and the turbocharger unsteady flow correction concept and correction method and calculation method are presented, and the curve is corrected. The main conclusions obtained from the results are as follows:
(1)
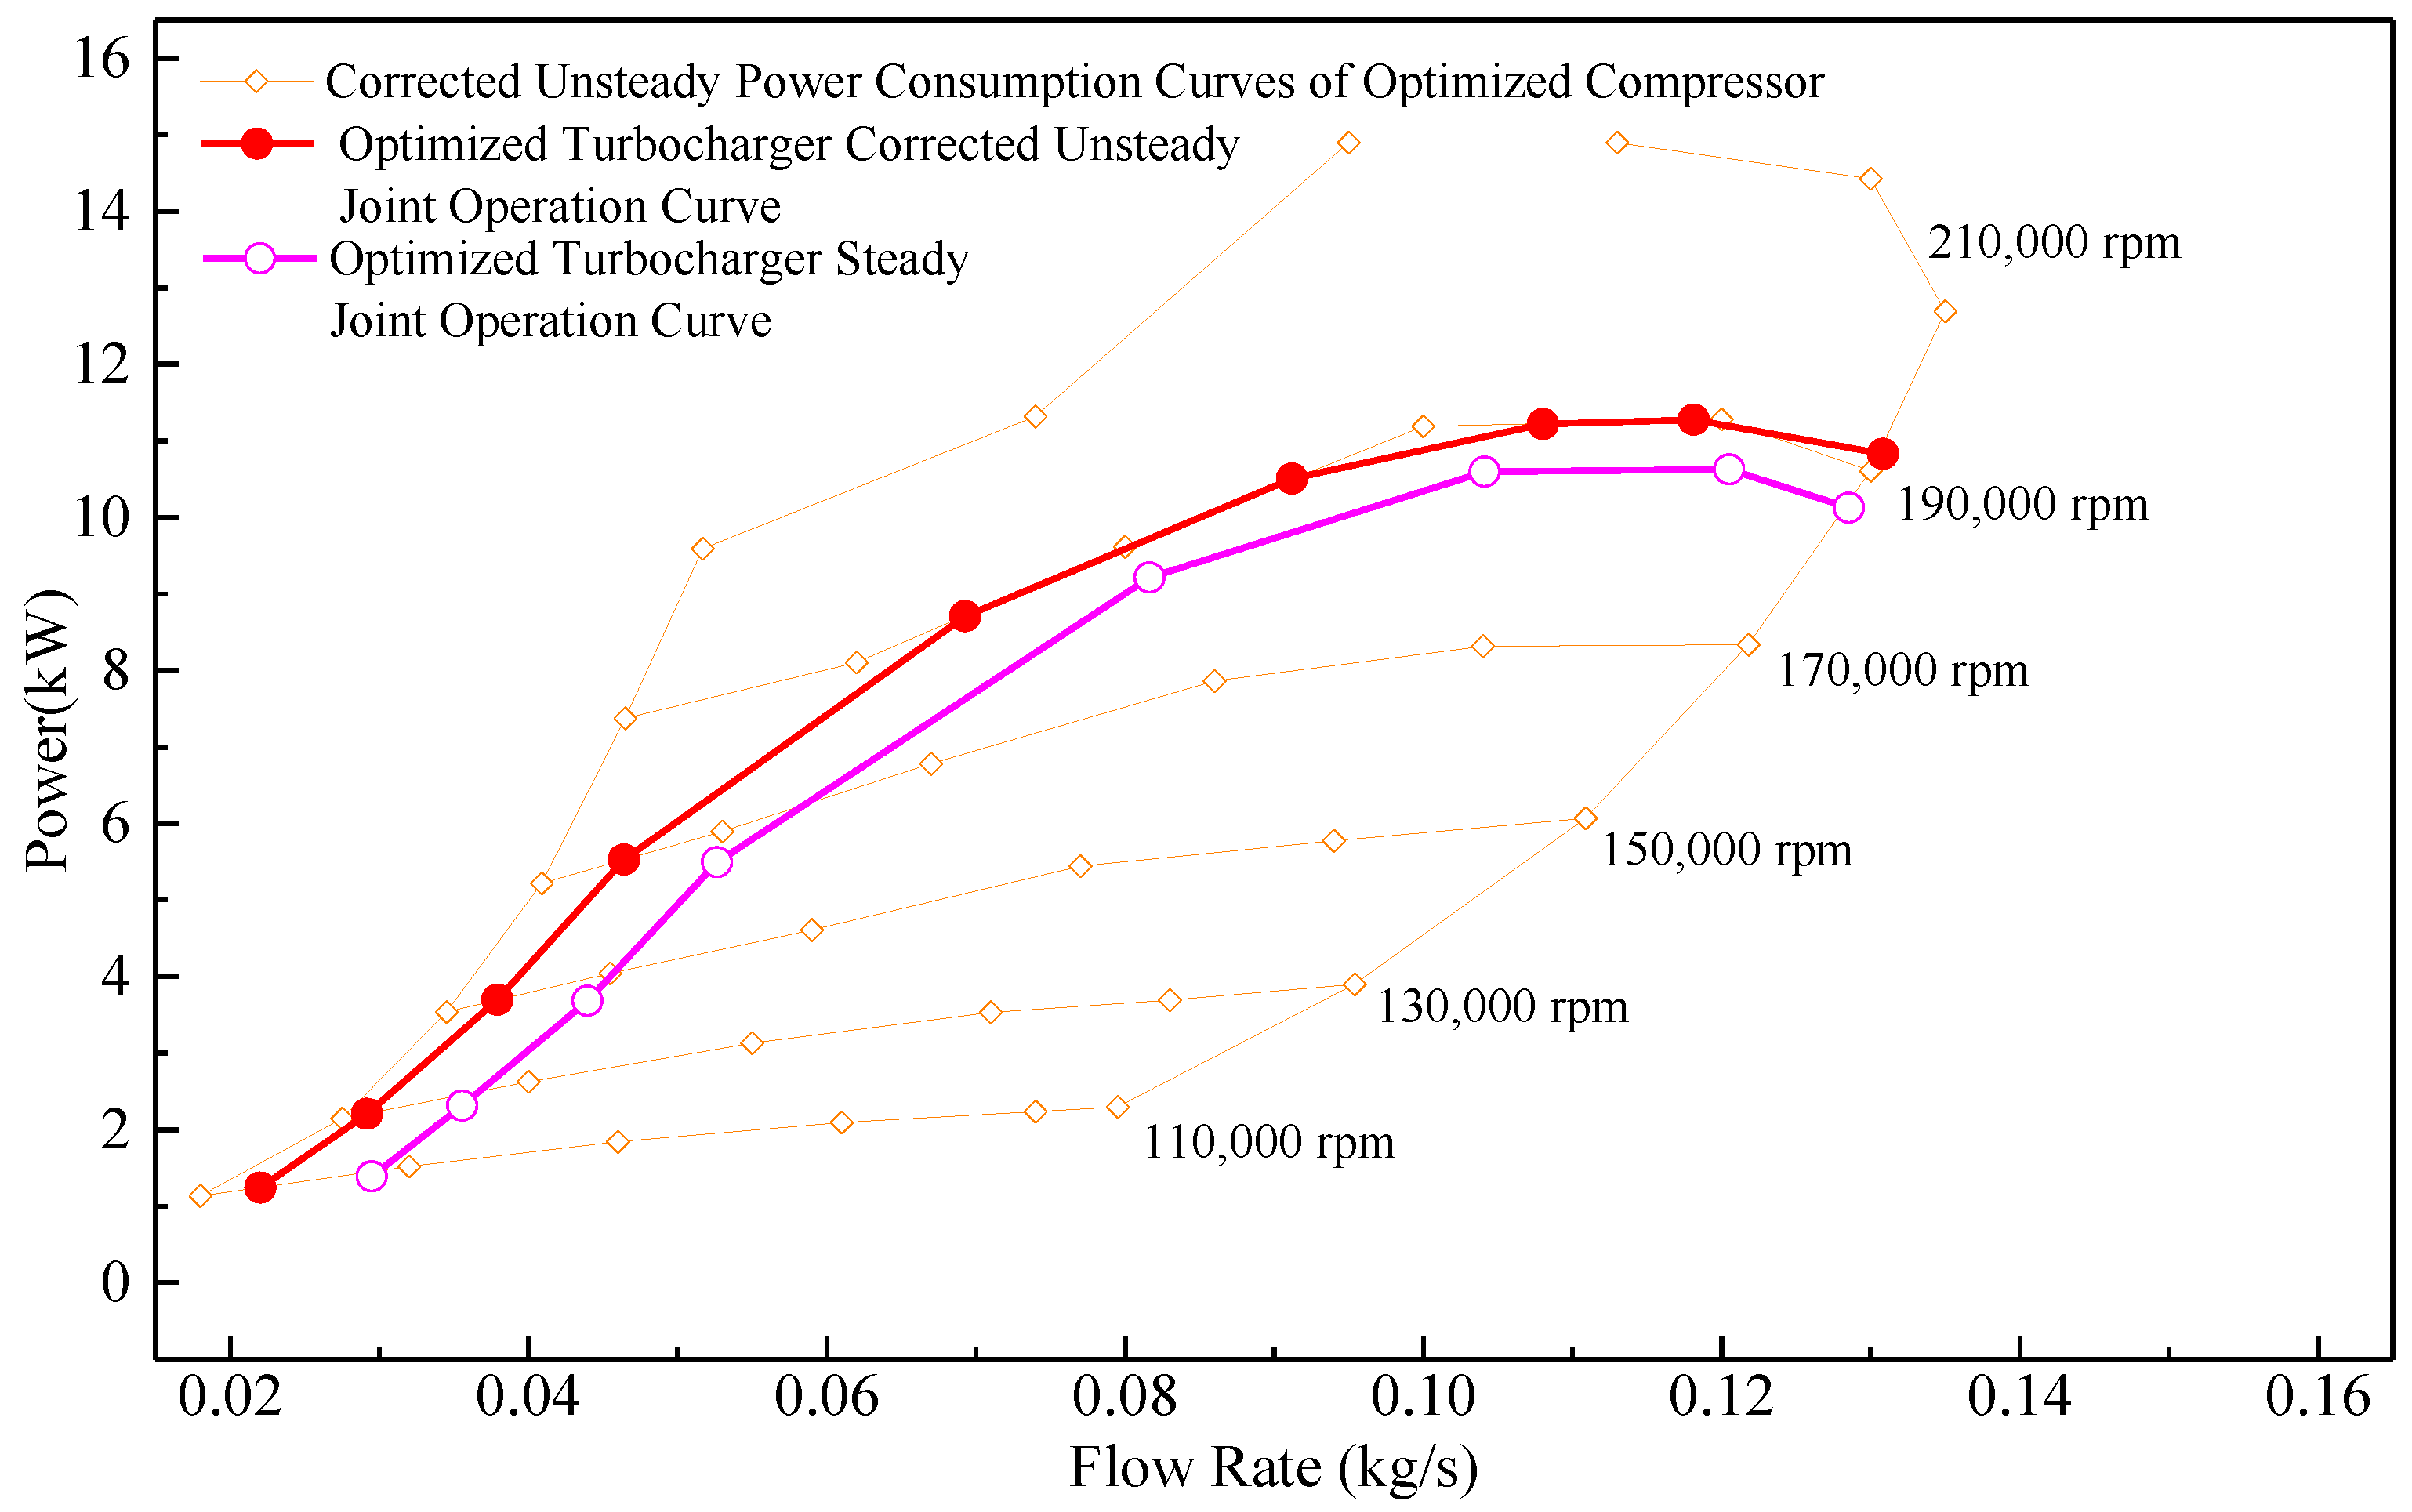
There is a difference in performance between the unsteady flow and the steady flow of the compressor, with the average value of the unsteady flow performance being 4.4% to 5.4% higher than the corresponding steady flow value. The unsteady flow power consumption coefficient for the combined conditions is calculated as the correction coefficient for the compressor unsteady flow, and the pulse energy utilization coefficient is used as the correction coefficient for the turbine unsteady flow.
(2)
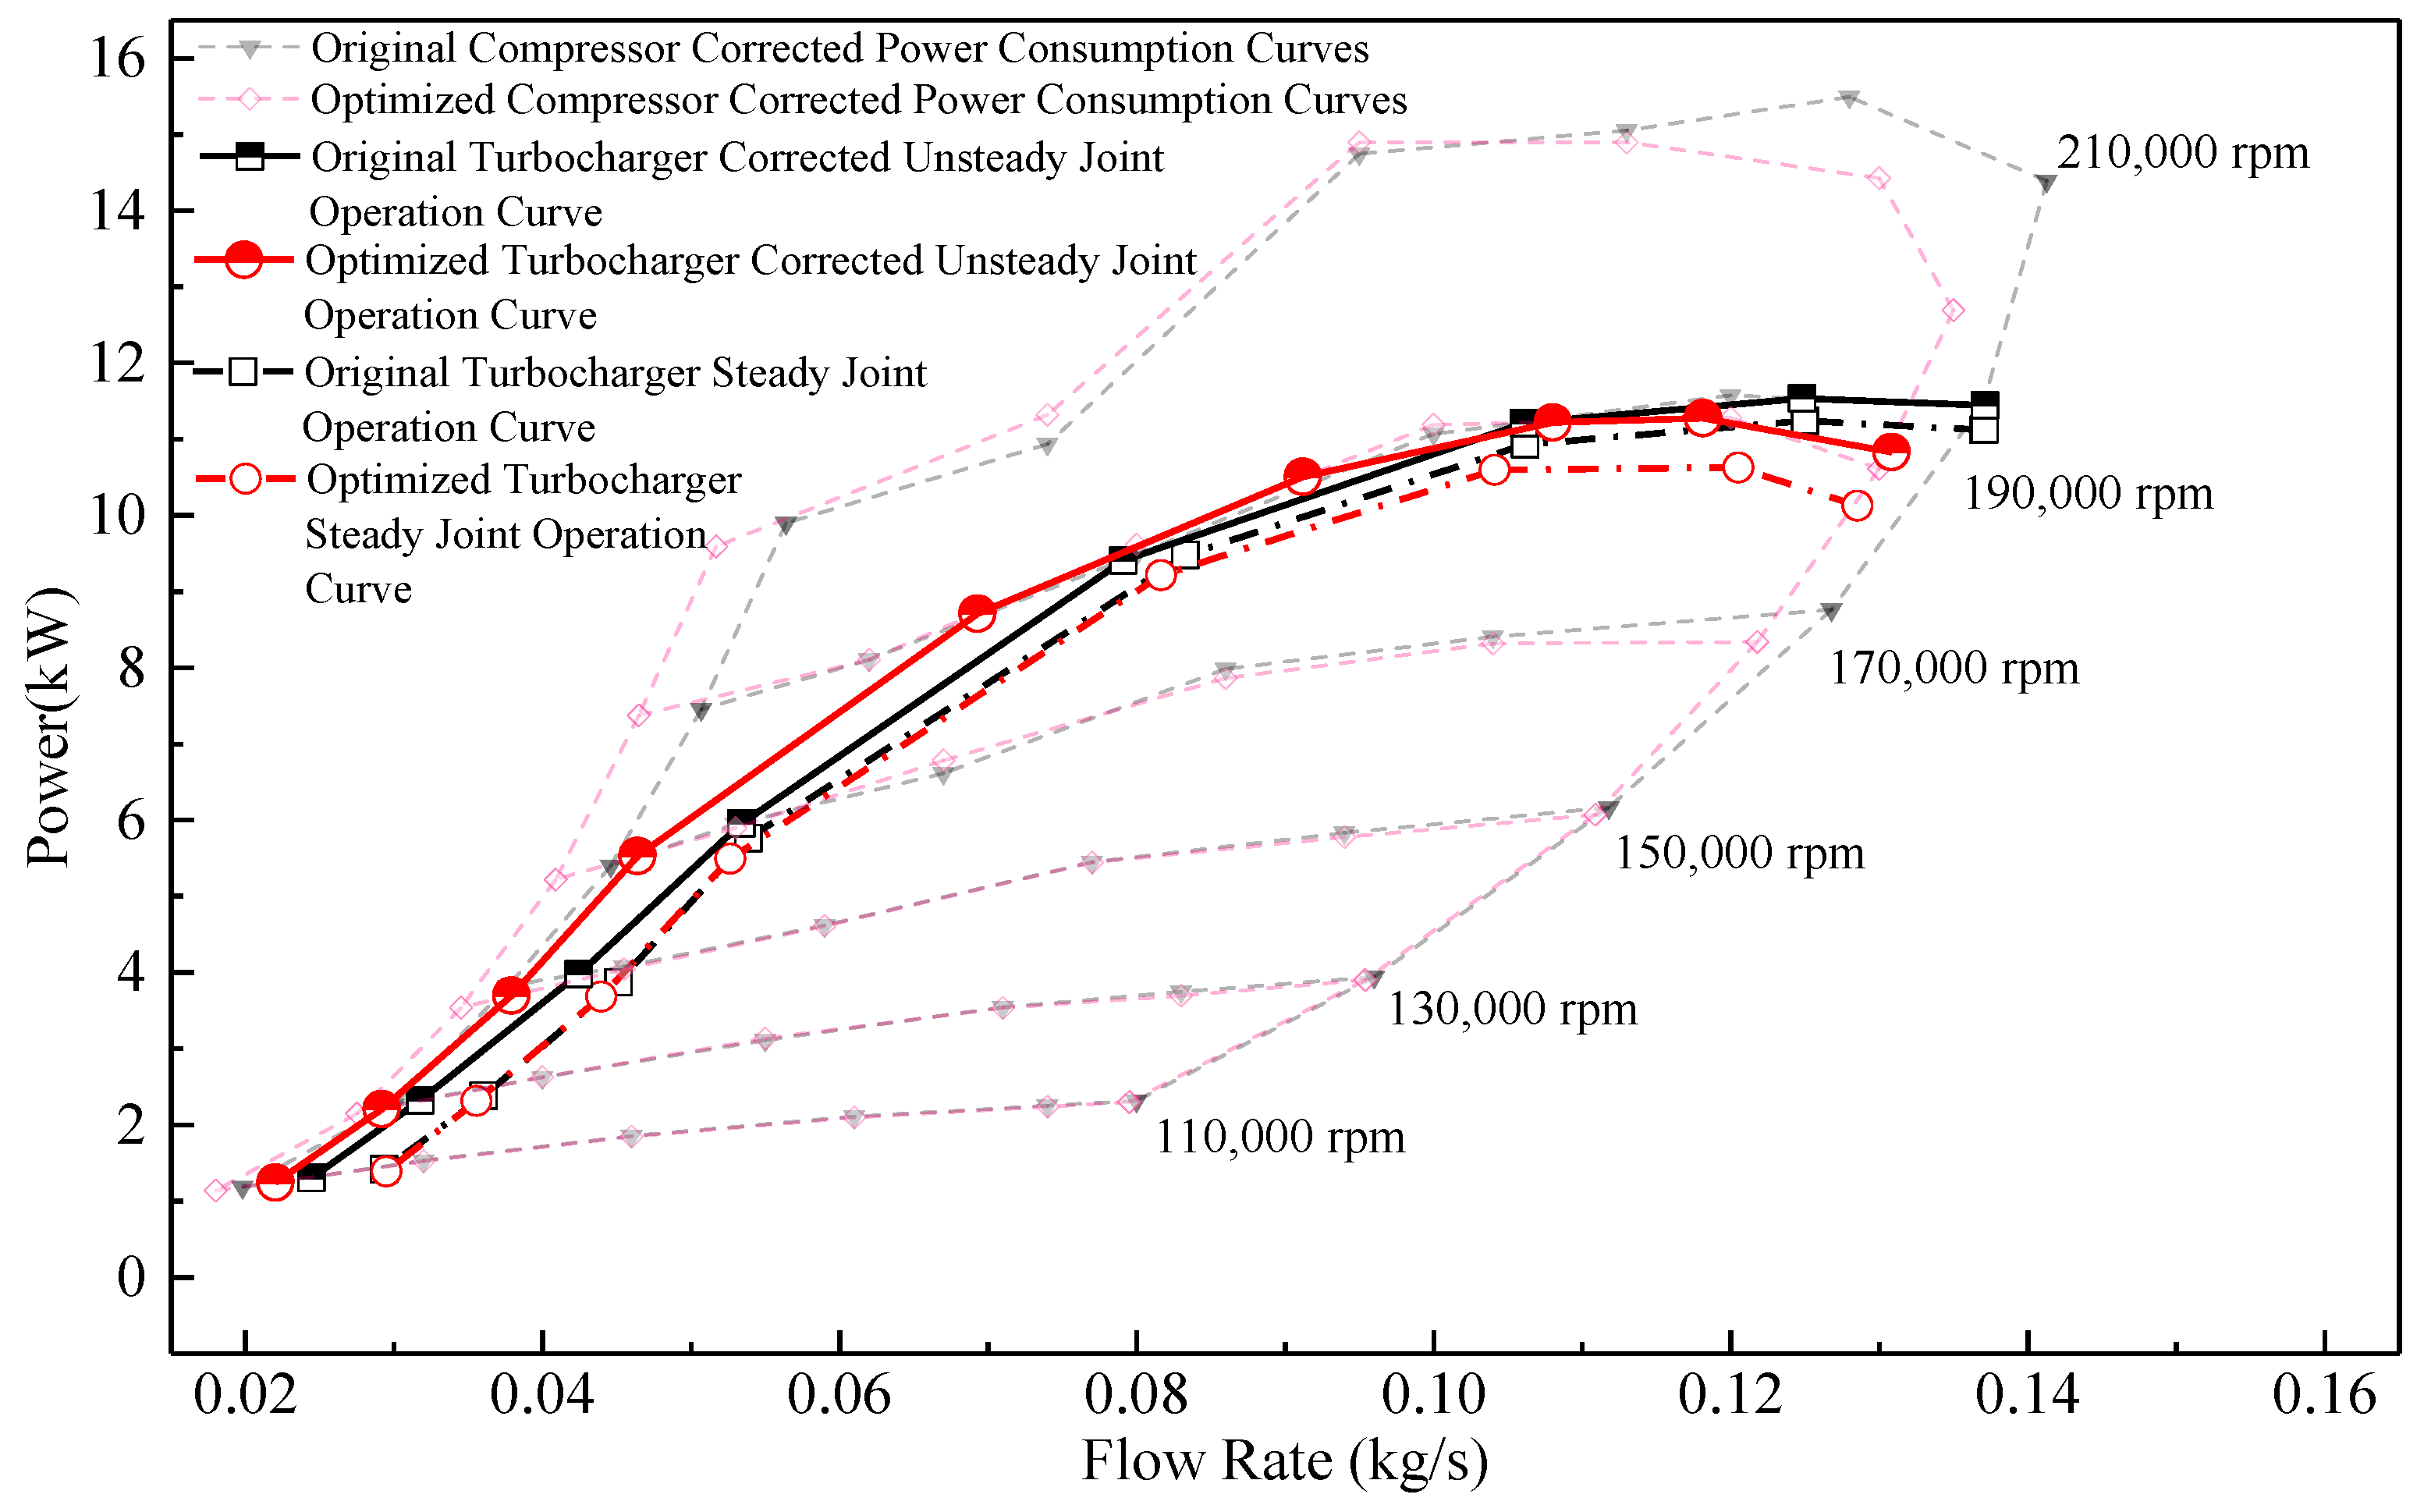
The turbocharger performance is closer to the actual operating condition after accounting for the unsteady coefficient correction at the compressor and the turbine. The internal joint operating curve shifts both to the left and up, with the left shift being larger.
(3)
The main difference between the corrected internal joint operating curves of the two turbochargers is at the medium–low-speed range. The original turbocharger’s surge margin is reduced by 4.6% to 11.8%, and the optimized turbocharger’s surge margin is reduced by 15.2% to 21.9% in the medium–low-speed range.
(4)
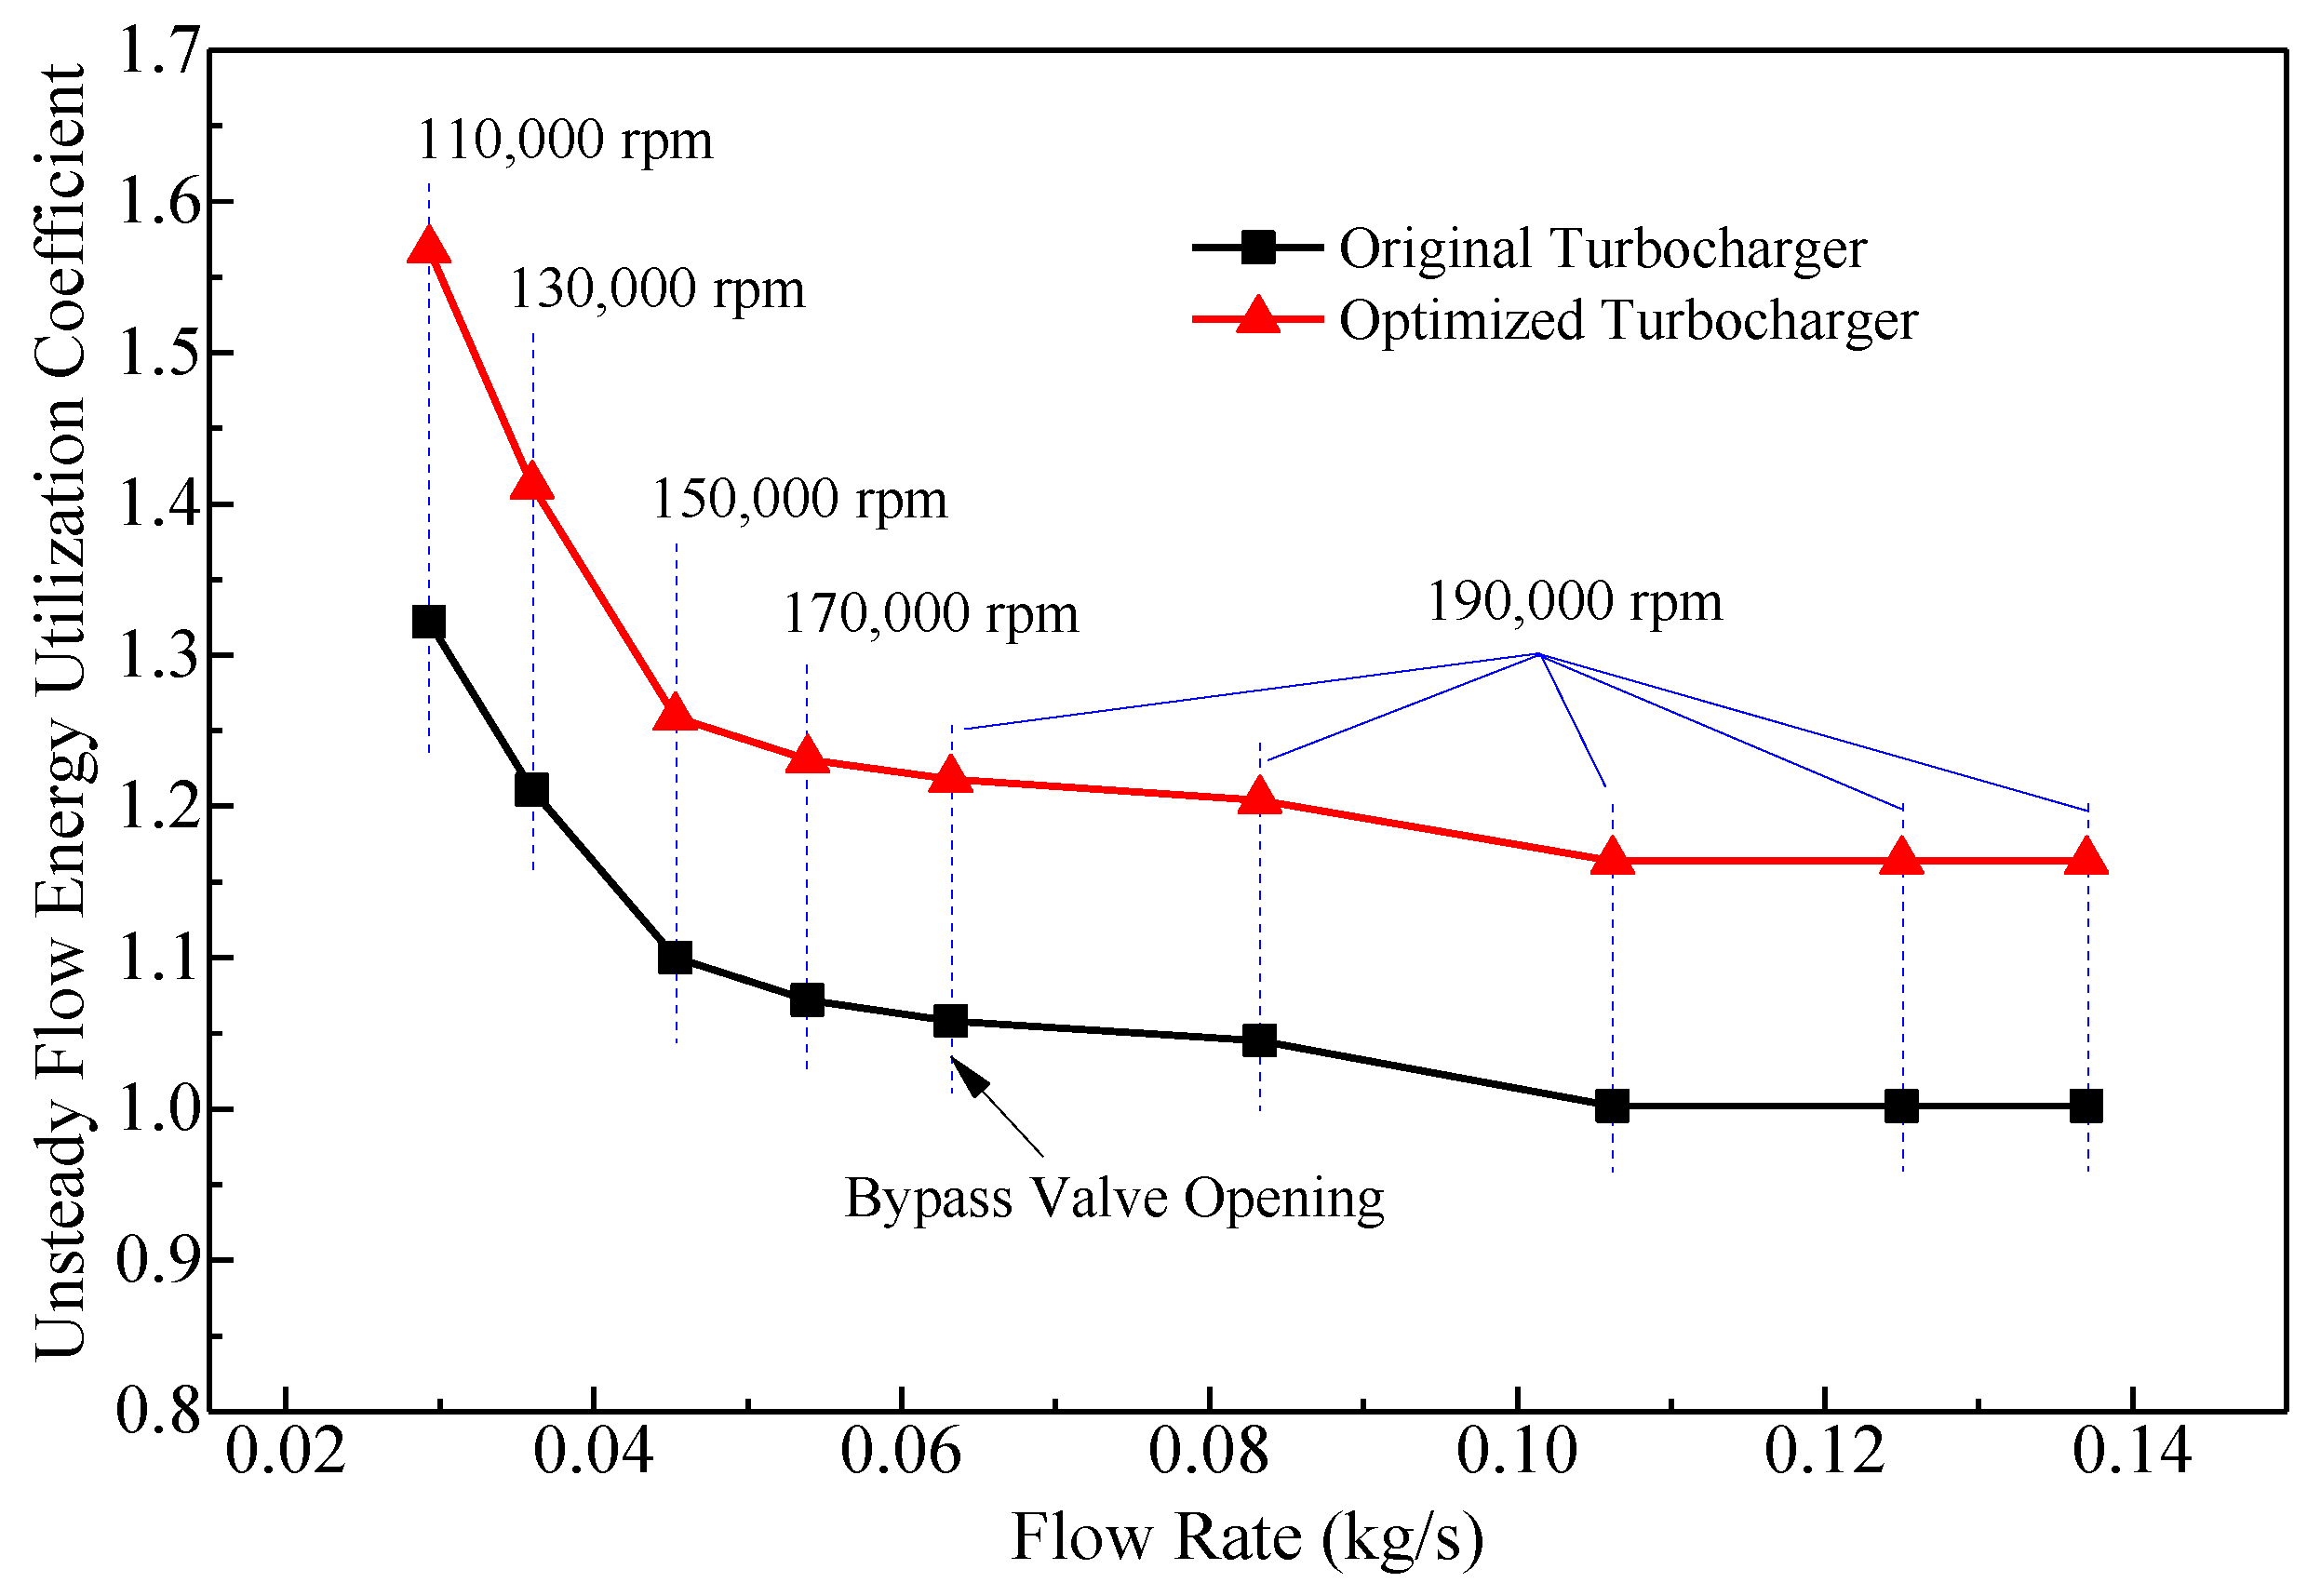
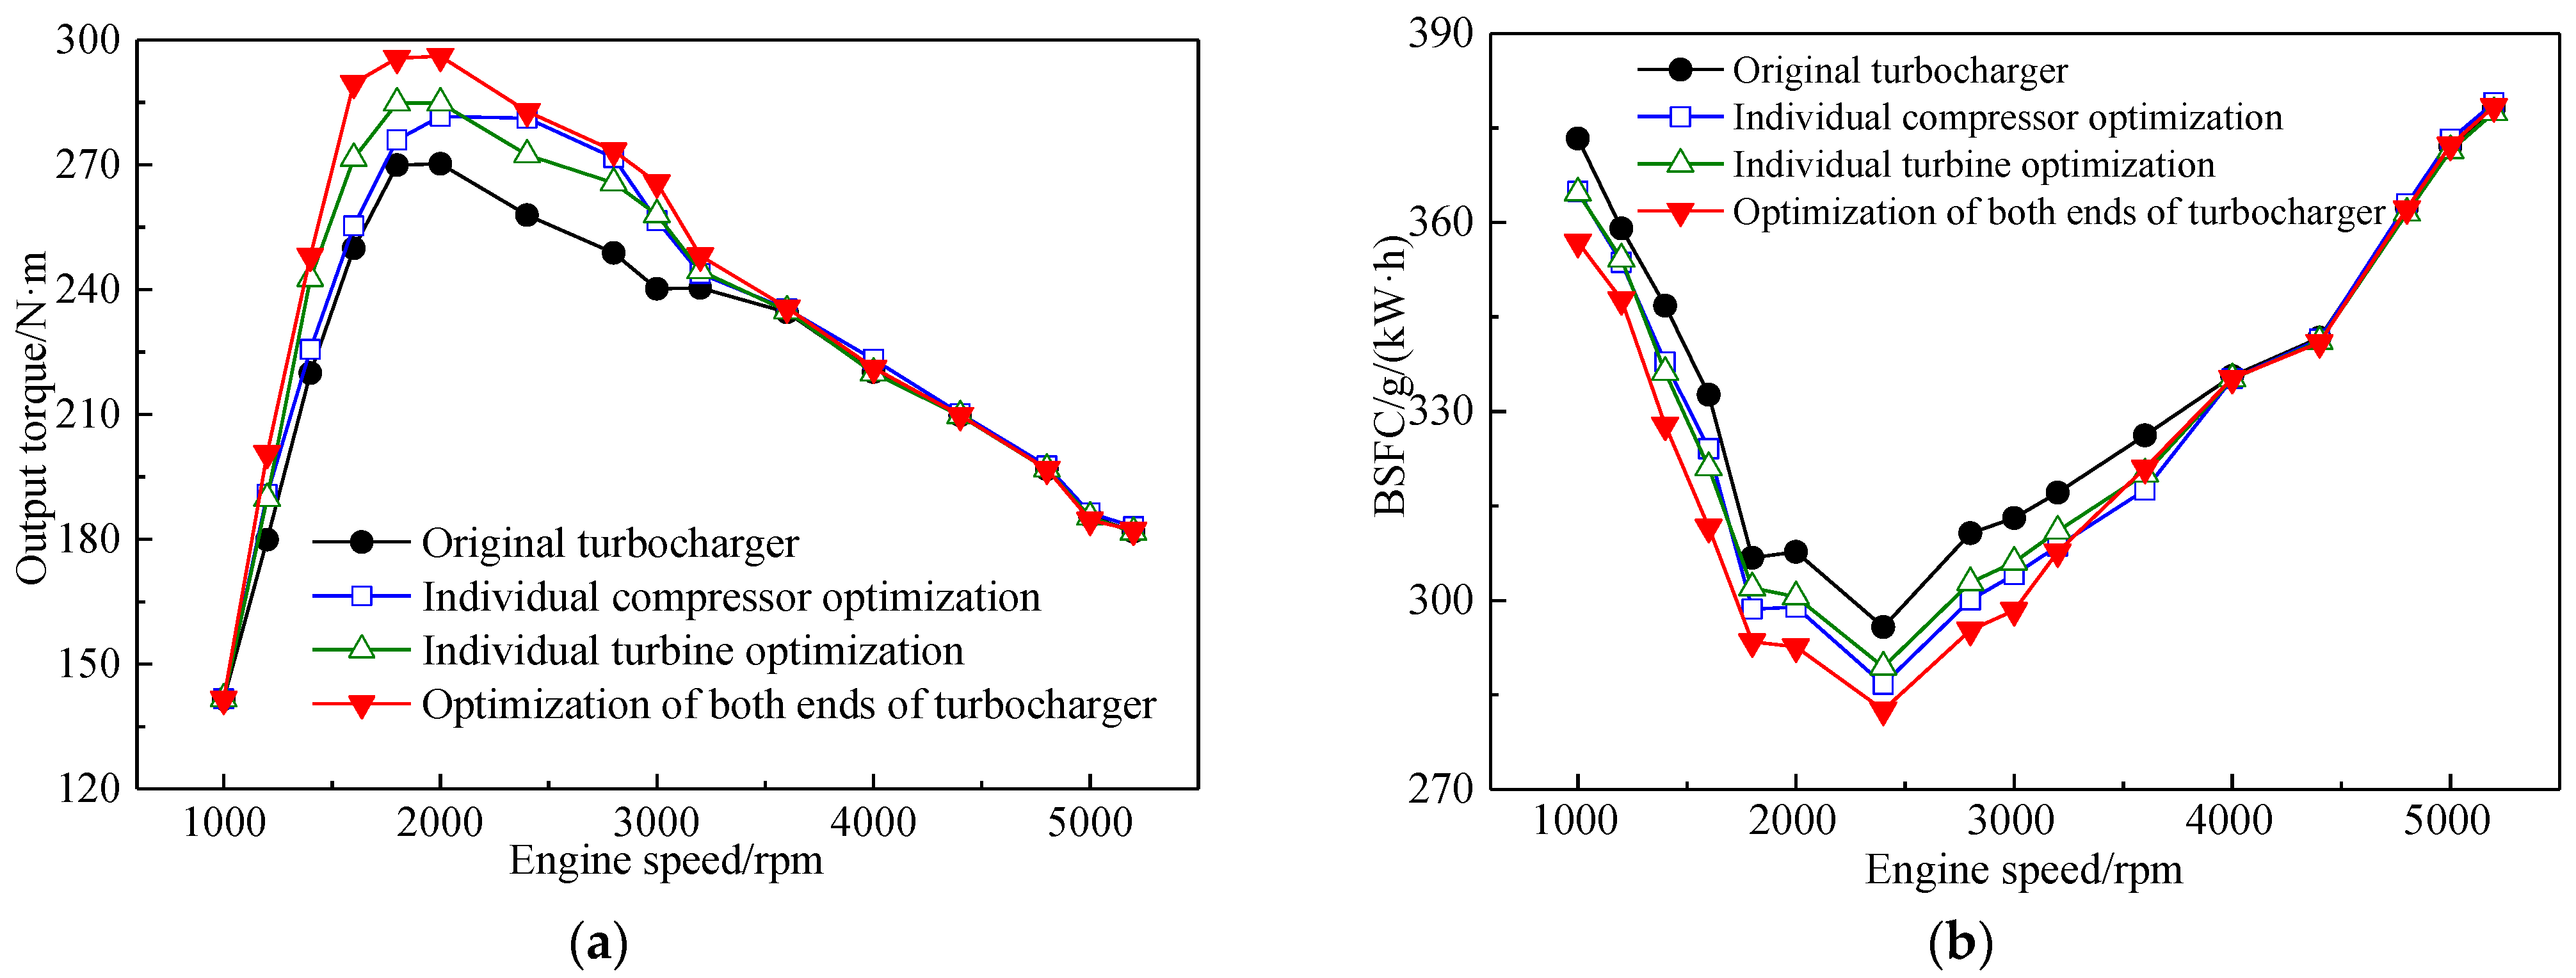
The concept of the turbocharger unsteady flow energy utilization factor is proposed to quantitatively assess the turbocharger energy utilization. The overall unsteady flow energy utilization advantage of the optimized turbocharger is significant, especially in the medium–low-speed range, where it is more than 14.5% higher than the original turbocharger. The optimized turbocharger increases the maximum torque by 9.6% and decreases the minimum BSFC by 4.4% compared to the original engine. Therefore, compared with the internal joint operation curve with steady flow, the curve with unsteady flow correction was closer to the actual engine performance.

Author Contributions

Conceptualization, S.Y. and H.F.; methodology, S.Y.; software, H.F.; validation, S.Y., H.F., and R.H.; formal analysis, H.F.; writing—original draft preparation, S.Y.; writing—review and editing, S.Y.; project administration, J.N.; funding acquisition, J.N. and X.S. All authors have read and agreed to the published version of the manuscript.

Funding

This research was funded by the National Natural Science Foundation of China youth Science Foundation project (Grant No. 22102116) and the Nanchang Intelligent New Energy Vehicle Research Institute Foresight Project (TPD-TC202110-12).

Institutional Review Board Statement

Not applicable.

Informed Consent Statement

Not applicable.

Data Availability Statement

The data presented in this study are available in the main text of the article.

Acknowledgments

The team of authors acknowledges anonymous reviewers for their feedback, which certainly improved the clarity and quality of this paper.

Conflicts of Interest

The authors declare no conflict of interest.

References

  1. Andreoni, V.; Galmarini, S. Drivers in CO2 emissions variation: A decomposition analysis for 33 world countries. Energy 2016, 103, 27–37. [Google Scholar] [CrossRef]
  2. Dong, K.; Hochman, G.; Timilsina, G.R. Do drivers of CO2 emission growth alter overtime and by the stage of economic development? Energy Policy 2020, 140, 11420. [Google Scholar] [CrossRef]
  3. Andre, M.; Rapone, M. Analysis and modelling of the pollutant emissions from European cars regarding the driving characteristics and test cycles. Atmos. Environ. 2009, 43, 986–995. [Google Scholar] [CrossRef]
  4. Fontaras, G.; Dilara, P. The of European passenger car characteristics 2000–2010 and its effects on real-world CO2 emissions and CO2 reduction policy. Energy Policy 2012, 10, 719–730. [Google Scholar] [CrossRef]
  5. Guo, N.; Zhang, X.; Zou, Y.; Guo, L.; Du, G. Real-time predictive energy management of plug-in hybrid electric vehicles for coordination of fuel economy and battery degradation. Energy 2021, 214, 119070. [Google Scholar] [CrossRef]
  6. Guo, N.; Zhang, X.; Zou, Y. Real-Time Predictive Control of Path Following to Stabilize Autonomous Electric Vehicles Under Extreme Drive Conditions. Automot. Innov. 2022. [Google Scholar] [CrossRef]
  7. Zhang, Y.F.; Zhao, C.; Dai, B.; Li, Z.H. Dynamic Simulation of Permanent Magnet Synchronous Motor (PMSM) Electric Vehicle Based on Simulink. Energies 2022, 15, 1134. [Google Scholar] [CrossRef]
  8. Guo, N.; Zhang, X.; Zou, Y.; Du, G.; Wang, C.; Guo, L. Predictive Energy Management of Plug-in Hybrid Electric Vehicles by Real-time Optimization and Data-driven Calibration. IEEE Trans. Veh. Technol. 2021, 71, 5677–5691. [Google Scholar] [CrossRef]
  9. Lu, D.Y.; Theotokatos, G.; Zhang, J.D.; Zeng, H.; Cui, K.Y. Comparative Assessment and Parametric Optimisation of Large Marine Two-Stroke Engines with Exhaust Gas Recirculation and Alternative Turbocharging Systems. J. Mar. Sci. Eng. 2022, 10, 351. [Google Scholar] [CrossRef]
  10. Liu, R.L.; Zhang, Z.J.; Yang, C.H.; Jiao, Y.F.; Zhou, G.M.; Ma, J.M. Influence of altitude on matching characteristic of electronic-controlled pneumatic two-stage turbocharging system with diesel engine. Proc. Inst. Mech. Eng. Part A 2020, 235, 94–105. [Google Scholar] [CrossRef]
  11. Galindo, J.; Fajardo, P.; Navarro, R.; Garcia-Cuevas, L.M. Characterization of a radial turbocharger turbine in pulsating flow by means of CFD and its application to engine modeling. Appl. Energy 2013, 103, 116–127. [Google Scholar] [CrossRef]
  12. Teo, A.E.; Chiong, M.S.; Yang, M.; Romagnoli, A.; Martinez-Botas, R.F.; Rajoo, S. Performance evaluation of low-pressure turbine, turbo-compounding and air-Brayton cycle as engine waste heat recovery method. Energy 2019, 166, 895–907. [Google Scholar] [CrossRef]
  13. Molinari, M.; Dawes, W.N. Review of evolution of compressor design process and future perspectives. Proc. Inst. Mech. Eng. Part C 2006, 220, 761–771. [Google Scholar] [CrossRef]
  14. Zhang, L.; He, R.Y.; Wang, S.L.; Zhang, Q. A review of rotating stall in vaneless diffuser of centrifugal compressor. J. Therm. Sci. 2020, 29, 323–342. [Google Scholar] [CrossRef]
  15. Niu, Z.T.; Sun, Z.Z.; Wang, B.T.; Zheng, X.Q. Effects of nonaxisymmetric volute on rotating stall in the vaneless diffuser of centrifugal compressors. J. Eng. Gas Turbines Power 2022, 144, 051015. [Google Scholar] [CrossRef]
  16. Xu, Y.D.; Zhang, X.M.; Lv, Q.Y.; Mu, G.Z. Design of compressor impeller under high Reynolds number conditions. Ind. Lubr. Tribol. 2022, 74, 1–9. [Google Scholar] [CrossRef]
  17. Suriyanarayanan, V.; Rendu, Q.; Vahdati, M.; Salles, L. Effect of manufacturing tolerance in flow past a compressor blade. J. Turbomach. 2022, 144, 041005. [Google Scholar] [CrossRef]
  18. Yang, M.Y.; Shu, M.Y.; Yang, B.J.; Martinez-Botas, R.; Deng, K.Y. Unsteady response of performance for centrifugal compressor under pulsating backpressure condition. Aerosp. Sci. Technol. 2022, 126, 107589. [Google Scholar] [CrossRef]
  19. Galindo, J.; Serrano, J.R.; Climent, H.; Tiseira, A. Experiments and modelling of surge in small centrifugal compressor for automotive engines. Exp. Therm. Fluid Sci. 2008, 32, 818–826. [Google Scholar] [CrossRef]
  20. Cao, D.M.; Yuan, C.J.; Wang, D.X.; Huang, X.Q. Transition from Unsteady Flow Inception to Rotating Stall and Surge in a Transonic Compressor. J. Therm. Sci. 2022, 31, 120–129. [Google Scholar] [CrossRef]
  21. Silvia, M.; Massimo, C.; Giorgio, Z. Pulsating flow performance of a turbocharger compressor for automotive application. Int. J. Heat Fluid Flow 2014, 45, 158–165. [Google Scholar] [CrossRef]
  22. Zhu, S.; Deng, K.; Liu, S. Modeling and extrapolating mass flow characteristics of a radial turbocharger turbine. Energy 2015, 87, 628–637. [Google Scholar] [CrossRef]
  23. Chen, S.L.; Ma, C.C.; Zhang, H.; Xu, C.; Lei, F.; Feng, T.; Cao, G.; Yang, H.Q.; Wei, C.F. Engine performance improvements through turbocharger matching and turbine design. Energy Sci. Eng. 2022, 10, 3384–3396. [Google Scholar] [CrossRef]
  24. Salameh, G.; Chesse, P.; Chalet, D. Mass flow extrapolation model for automotive turbine and confrontation to experiments. Energy 2019, 167, 325–336. [Google Scholar] [CrossRef]
  25. Ketata, A.; Driss, Z. Characterization of double-entry turbine coupled with gasoline engine under in- and out-phase admission. Energy 2021, 236, 121447. [Google Scholar] [CrossRef]
  26. Serrano, J.R.; Arnau, F.J.; Dolz, V.; Tiseira, A.; Cervelló, C. A model of turbocharger radial turbines appropriate to be used in zero- and one-dimensional gas dynamics codes for internal combustion engines modelling. Energy Convers. Manag. 2008, 49, 3729–3745. [Google Scholar] [CrossRef]
  27. Costiuc, I.; Chiru, A.; Costiuc, L. A Review of Engine’s Performance When Supercharging by a Pressure Wave Supercharger. Energies 2022, 15, 2721. [Google Scholar] [CrossRef]
  28. Serrano, J.R.; Arnau, F.J.; García-Cuevas, L.M.; Pablo, S.; Raymond, C. Experimental validation of a one-dimensional twin-entry radial turbine model under non-linear pulse conditions. Int. J. Engine Res. 2019, 22, 390–406. [Google Scholar] [CrossRef]
  29. Roberto, M.; Maw, L.S.; Mihai, M. Influence of Pulse Characteristics on Turbocharger Radial Turbine. J. Eng. Gas Turbines Power 2022, 144, 021018. [Google Scholar] [CrossRef]
  30. Wang, Z.H.; Ma, C.C.; Zhang, H.; Zhu, F. A novel pulse-adaption flow control method for a turbocharger turbine: Elastically restrained guide vane. Proc. Inst. Mech. Eng. Part C 2020, 234, 2581–2594. [Google Scholar] [CrossRef]
  31. Duan, Y.F.; Shi, X.Y.; Kang, Y.; Liao, Y.; Duan, L.S. Effect of Hydrous Ethanol Combined with EGR on Performance of GDI Engine. In Proceedings of the SAE 2020 World Congress and Exhibition, Detroit, MI, USA, 14 April 2016. [Google Scholar] [CrossRef]
  32. Broatch, A.; Galindo, J.; Navarro, R.; Garcia-Tiscar, J. Numerical and experimental analysis of automotive turbocharger compressor aeroacoustics at different operating conditions. Int. J. Heat Fluid Flow 2016, 61, 245–255. [Google Scholar] [CrossRef] [Green Version]
  33. Colaciti, A.K.; Lopez, L.; Navarro, H.A.; Cabezas-Gomez, L. Numerical simulation of a radial diffuser turbulent airflow. Appl. Math. Comput. 2007, 189, 1491–1504. [Google Scholar] [CrossRef]
  34. Campobasso, M.S.; Piskopakis, A.; Drofelnik, J.; Jackson, A. Turbulent Navier-Stokes analysis of an oscillating wing in a power-extraction regime using the shear stress transport turbulence model. Comput. Fluids 2013, 88, 136–155. [Google Scholar] [CrossRef]
  35. Fan, H.C.; Ni, J.M.; Shi, X.Y.; Qu, D.Y.; Zheng, Y.; Zheng, Y.H. Simulation of a combined nozzled and nozzleless twin-entry turbine for improved efficiency. J. Eng. Gas Turbines Power 2019, 141, 051019. [Google Scholar] [CrossRef]
  36. Fan, H.C.; Ni, J.M.; Shi, X.Y.; Jiang, N.; Qu, D.Y.; Zheng, Y.; Zheng, Y.H. Unsteady performance simulation analysis of a waste-gated turbocharger turbine under different valve opening conditions. In Proceedings of the SAE 2017 International Powertrains, Fuels and Lubricants Meeting, Detroit, MI, USA, 8 October 2017. [Google Scholar] [CrossRef]
  37. Galindo, J.; Tiseira, A.; Fajardo, P.; Garcıa-Cuevas, L.M. Development and validation of a radial variable geometry turbine model for transient pulsating flow applications. Energy Convers. Manag. 2014, 85, 190–203. [Google Scholar] [CrossRef]
  38. Yin, S.; Ni, J.M.; Fan, H.C.; Shi, X.Y.; Huang, R. A Study of Evaluation Method for Turbocharger Turbine Based on Joint Operation Curve. Sustainability 2022, 14, 9952. [Google Scholar] [CrossRef]
  39. Liu, X.F.; Zhao, L. Approximate Nonlinear Modeling of Aircraft Engine Surge Margin Based on Equilibrium Manifold Expansion. Chin. J. Aeronaut. 2012, 22, 663–674. [Google Scholar] [CrossRef] [Green Version]
  40. Pan, T.Y.; Li, Q.S.; Yuan, W.; Lu, H.N. Effects of axisymmetric arc-shaped slot casing treatment on partial surge initiated instability in a transonic axial flow. Aerosp. Sci. Technol. 2017, 69, 257–268. [Google Scholar] [CrossRef]
  41. Taburri, M.; Chiara, F.; Canova, M.; Wang, Y.Y. A model-based methodology to predict the compressor behaviour for the simulation of turbocharged engines. Proc. Inst. Mech. Eng. Part D 2012, 226, 560–574. [Google Scholar] [CrossRef]
  42. Niazmand, A.; Farzaneh-Gord, M.; Deymi-Dashtebayaz, M. Exergy analysis and entropy generation of a reciprocating compressor applied in CNG stations carried out on the basis models of ideal and real gas. Appl. Therm. Eng. 2017, 124, 1279–1291. [Google Scholar] [CrossRef]
  43. Alshammari, F.; Elashmawy, M.; Ben Hamida, M.B. Effects of working fluid type on powertrain performance and turbine design using experimental data of a 7.25L heavy-duty diesel engine. Energy Convers. Manag. 2021, 231, 113828. [Google Scholar] [CrossRef]
Figure 1. Flow chart of study framework.
Applsci 12 11943 g001
Figure 2. Three-dimensional structure model.
Applsci 12 11943 g002
Figure 3. Engine 1D model.
Applsci 12 11943 g003
Figure 4. (a) Original compressor whole-stage fluid domain; (b) original turbine whole-stage fluid domain.
Applsci 12 11943 g004
Figure 5. (a) Effect of the number of elements on the performance of the compressor; (b) effect of the number of elements on the performance of the turbine.
Applsci 12 11943 g005
Figure 6. (a) Kratzer test bench; (b) schematic diagram of the test bench arrangement.
Applsci 12 11943 g006
Figure 7. (a) Test validation of the original compressor; (b) test validation of the original turbine.
Applsci 12 11943 g007
Figure 8. Definition of the power balance at 150,000 rpm.
Applsci 12 11943 g008
Figure 9. (a) The joint operating point when the bypass valve is open; (b) the internal joint operating curve when the bypass valve is open.
Applsci 12 11943 g009
Figure 10. Distribution of pressure ratio characteristics at 150,000 rpm.
Applsci 12 11943 g010
Figure 11. Joint point correction of the original turbocharger at 150,000 rpm.
Applsci 12 11943 g011
Figure 12. The original turbocharger corrected internal joint operation curves.
Applsci 12 11943 g012
Figure 13. The optimized turbocharger corrected internal joint operation curves.
Applsci 12 11943 g013
Figure 14. Comparison of the corrected curves of two turbochargers.
Applsci 12 11943 g014
Figure 15. Comparison of turbocharger unsteady flow energy utilization coefficients on internal joint operating curves.
Applsci 12 11943 g015
Figure 16. (a) The effect of turbocharger structure on engine torque; (b) the effect of turbocharger structure on engine BSFC.
Applsci 12 11943 g016
Table 1. Turbocharger parameters.
ParameterProfileParameterProfile
Inlet diameter of compressor impeller/mm32.1Inlet diameter of turbine impeller/mm37.6
Outlet diameter of compressor impeller/mm44Outlet diameter of turbine impeller/mm33.1
Number of compressor impeller blades8Number of turbine impeller blades11
Height of diffuser/mm2.5Turbine impeller inlet blade angle/deg0
Compressor pressure ratio2.2Turbine impeller inlet blade height/mm5.1
Radial and axial tip clearance/mm0.5Turbine impeller axial length/mm18.9
Volute nozzle width/mm5.0Turbine impeller exit mean blade angle/deg56.4
Engine capacity/L1.5Turbine flow range/(kg/s)0.02–0.13
Table 2. PC information.
ParameterProfile
ComputerWorkstation
Operation systemWindows
RAM48 GB
Number of Cores24
Table 3. The elements for the compressor model.
Fluid DomainMesh TypeElement Number
Inlet ductStructured mesh71,995
Impeller single-blade channelStructured mesh239,868
Wheel back clearanceUnstructured mesh334,446
DiffuserUnstructured mesh406,381
Separate compressor voluteUnstructured mesh515,346
Outlet transitionStructured mesh110,449
Total elements 3,357,561
Table 4. The elements for the turbine model.
Fluid DomainMesh TypeElement Number
Inlet ductStructured mesh73,219
Separate Turbine VoluteUnstructured mesh620,189
Impeller single-blade channelStructured mesh203,038
Wheel back clearanceUnstructured mesh242,283
Outlet transitionUnstructured mesh527,878
Outlet ductStructured mesh169,575
Total elements 3,866,562
Table 5. Comparison of the unsteady flow energy of the original compressor at the joint point with the steady flow value at 150,000 rpm.
Pressure RatioEfficiency/%Power Consumption/kW
Steady flow1.8364.383.87
Unsteady flow1.9167.404.08
Degree of deviation/%4.44.75.4
Table 6. Performance comparison of different compressor structures at 150,000 rpm.
StructureSteady
Efficiency/%
Steady Power
Consumption
/kW
Unsteady Efficiency/%Unsteady Power Consumption/kWDegree of Deviation/%Power Consumption Coefficient
Original compressor64.383.8767.404.085.41.054
Optimized compressor65.103.7568.254.047.71.077
Table 7. Distribution of power consumption coefficients for the compressor unsteady flow.
Structure110,000 rpm130,000 rpm150,000 rpm170,000 rpm190,000 rpm
Original compressor1.0421.0491.0541.0421.028
Optimized compressor1.0471.0631.0771.0681.058
Table 8. Distribution of turbine pulse energy utilization coefficients.
Structure110,000 rpm130,000 rpm150,000 rpm170,000 rpm190,000 rpm
Original turbine1.5181.3311.1431.0871.030
Optimized turbine1.7901.5631.3351.2841.232
Publisher’s Note: MDPI stays neutral with regard to jurisdictional claims in published maps and institutional affiliations.

