1. Introduction
Simulation and visualization of transport process at transport nodes is of great importance as it provides a wide range of information on traffic and its better understanding [
1]. Computer simulation is one of the main tools in transport engineering nowadays. It helps to examine traffic processes in the smallest details, optimize them and search for new solutions [
2]. With the help of visualization and simulation, the strategy of transport development in specific areas or regions can be defined [
3]. At transport nodes, simulation and visualization enable transport telematics assessment [
4], transport flow analysis [
5] or a detailed assessment of traffic congestions [
5]. Various types of classic simulation tools can be used for these activities such as SUMO [
3] and PTV Vissim [
6] or, for the modeling and simulation of traffic processes, non-traditional software such as Matlab [
7] or Anylogic [
8]. These facts lead us to conclude that different types of simulation software can be applied for modeling and visualization of transport processes.
Tecnomatix Plant Simulation is a simulation software that is primarily intended for logistics and production processes. It is a robust analytical tool that is being widely used in scientific research. It is mainly used to create discrete simulated models [
9]. It allows to simulate a wide range of production processes, e.g., assembly [
10] or production lines [
11]. Its successful application is also possible in the field of ergonomics [
12]. In addition to its traditional use, scientific works are being presented on application of this simulation tool in other non-traditional areas, such as mining [
13] or critical infrastructure security [
14].
Tecnomatix Plant Simulation has a wide range of tools that allow analyzing different transport systems, including intra-company transport, where AGV systems are primarily concerned [
15]. It is used as an analytical and predictive tool for identifying problems associated with, e.g., intra-company transport [
16]. The program makes it possible to assess efficiency of transport processes and evaluate them [
17].
Tools available in Tecnomatix Plant Simulation for transport and transport systems are not only intended for a narrow range of issues associated with intra-company and inter-operational transport; quite the opposite, as the program has a great potential creating a prerequisite for its wider use in various transport systems, transport telematics and transport structures. This fact can be presented, e.g., based on the work of Sebestyenova and Kurdel [
18], who dealt with the use of Tecnomatix Plant Simulation for determining the shortest route for an ambulance car. However, this is not the only use in the field of transport for Tecnomatix program. Since the program features a Simtalk software tool [
19], allowing programming of unlimited program functionalities, possibilities open for a research hypothesis whether the Tecnomatix Plant Simulation can be used to create microscopic models of transport processes at transport nodes. This hypothesis is supported by the fact that the program is highly variable not only in additional programming of simulation functionalities, but also in the area of visualization of simulation models and experiments.
The goal of presented research is a result of an effort to create a simulation model of a complex logistics process, specifically a model consisting of two parts, the first one dedicated to production logistics and the second one to city logistics. In terms of creating a simulation model for both parts, a sufficient number of simulation tools is available.
Within production logistics, the intention is to model everything from the material entry into the logistics process, its handling and the course of production to creation of a final product and its sale using road freight transport, for which the Tecnomatix Plant Simulation is a suitable software tool.
In city logistics, the aim is to research the way in which freight transport, resulting from production logistics activities, will affect the traffic at the transport node, as well as if and how vehicles transporting manufactured products will affect the traffic at the transport hub. Once again, we can conclude that for the needs of city logistics, specialized simulation tools to create traffic models exist. However, at this point, we run into a connection problem of entity outputs (vehicles from the part of production logistics simulation model to the second part of the city logistics simulation model) in order to find out and analyze the way production processes (sales of production) will affect public transport and city mobility. For this reason, within presented research, a possibility of using Tecnomatix Plant Simulation program to simulate transport processes at the transport node was verified and a methodological procedure was proposed to implement it.
The article presents a draft methodology and its verification in the conditions of a real traffic node, demonstrating the options of Tecnomatix Plant Simulation when creating traffic microscopic simulation models of processes taking place at a transport hub. This is an issue that, from such a point of view, has not yet been presented anywhere in the available literature. The obtained results will thus extend the portfolio of areas in which the program can be used and verify its ability to visualize traffic processes.
2. Materials and Methods
Often, complex traffic nodes involving not only drivers but also pedestrians and cyclists can trigger complications in traffic and its management. The modern times enable to model and simulate such traffic nodes. The output of such a simulation, which contains collected data from specific places, is an accurate specification of traffic situations. Real system is being replaced with a simulation—a computer model. It allows us to perform various experiments with changing roads, traffic flows, traffic density, creating pedestrian crossings across the roads and many others. It can replay complex processes that take hours, days and weeks of real time in minutes. The results of such simulations can be compared between each other, thereby providing information needed for construction of new roads and transport hubs in a short time and with minimal cost. Another area for advantageous application of traffic modeling and simulation is traffic congestions.
Traffic congestion is a complex dynamic problem involving many complicated and interacting elements. These elements are vehicles, driver behavior, road and its geometry, traffic signs and others. In such a complex problem situation, the use of computer simulation can be very effective by providing assessment of different traffic conditions. It can help creators understand and analyze traffic, assess current issues, and propose the best solution. Simulation can support traffic management planning and decision-making for a long-term sustainable urban development. New solutions and techniques can be effectively tested in a virtual reality environment without interfering with real traffic. Effective traffic management and control strategies need up-to-date valid simulation test results. In all cases mentioned, visualization and simulation are playing an important role.
Traffic simulation systems as specialized tools used to analyze traffic congestion have played a fundamental role in traffic model development. In the existing lines of research, event-driven or time-driven development of models has been considered along with the deterministic or stochastic nature of processes. Under specific conditions, for many traffic models, we focused on two possible approaches so as to realize effective models in a single framework. The theory of traffic modeling focused on two main directions: trying to implement effective models and a unified framework [
20].
2.1. Visualization and Simulation of Traffic Processes
Visualization and simulation of traffic processes is a highly effective approach in solving a wide range of transport tasks and problems. Traffic engineers use it for a better understanding of the researched processes, obtaining information and searching for new solutions. With regard to detail, microscopic (
Figure 1), mesoscopic and macroscopic transport models are distinguished.
Microscopic models provide a detailed view of the course of transport processes and help to visualize them. Various specially created simulation tools are used to implement them. However, for traffic modeling, not only special software is needed. Very often simulation software not primarily intended for traffic modeling can be deployed as traffic models can be created and used due to their functionalities.
Simulation software, primarily intended for use in transport, is nowadays a widespread tool for analysis and prediction of various transport tasks and problems. It belongs to a large group of simulation tools that are now available and being used. In most cases, their use is strictly limited to transport. On the other hand, there are software tools available in the market that are not intended for transport, but due to their overall concept and functionalities, the question arises whether they can be applied in solving transport problems.
This question is of importance since if this is the case, users already owning such a software tool do not have to acquire another simulation tool to solve traffic problems. They can use their previous experience and competences to create simulation models and implement a wide range of experiments. The Tecnomatix Plan Simulation is among the simulation tools not primarily intended for transport, with the exception of inter-company ones.
2.2. Tecnomatix Plant Simulation
Tecnomatix Plant Simulation was primarily created for production modeling and its subsequent simulation. However, it is a highly variable simulation software that allows full customization of its application in different areas. Based on these facts, a research hypothesis was stipulated whether the mentioned simulation program can also be used in simulation and visualization of traffic processes of an urban agglomeration.
The research aim was to verify the use of simulation program in an area for which it was not created, but can be used for under certain circumstances. The goal was to design and create a methodology to be used for urban traffic simulation and visualization, and thereby expand possible simulation program’s application to create micromodels that can be used for traffic node analysis.
2.3. Research Hypothesis
Based on the knowledge from creation of simulation models by Tecnomatix Plant Simulation, a methodology was proposed, shown in
Figure 2.
The draft of original methodology is based on a gradual implementation of individual steps, while the SimTalk software is actively being used to program missing functions along with graphic tools enabling the creation of a discrete traffic node micromodel. The proposed methodology is generally valid from the point of view of traffic, but its application is designed only for Tecnomatix Plant Simulation software.
As part of the methodology, the use of existing blocks for creation of transport routes and roads is considered. Afterwards, pedestrian crossings, overpasses or underpasses or other traffic components on the routes using the SimTalk software must be added, as this is not a default feature of the simulation tool.
In the next step, the blocks in the library of Tecnomatix Plant Simulation need to be used, representing the means of transport. Since the software is primarily intended only for use in intra-company logistics, the blocks need to be modified and adapted to the new requirements needed for discrete micro transport models. Specifically, blocks need to be created in the library that represent individual means of transport and road users. In this activity, active use of the SimTalk is assumed, as well as graphic editing tools.
In the final phase of the proposed methodology, the rules of movement for road users at the traffic node need to be defined by active programming as well as by functioning of traffic lights signaling and other rules for proper functioning of the simulation model. At the end of this phase begins a final graphic editing of the simulation model. Both 2D and 3D graphic objects and elements can be used.
Due to a possible occurrence of ultimate facts (as the proposed procedure is a logical sequence of steps, but the simulation program is not intended for the area of transport) which could make it impossible to create a simulation model, the described methodology had to be verified.
3. Results
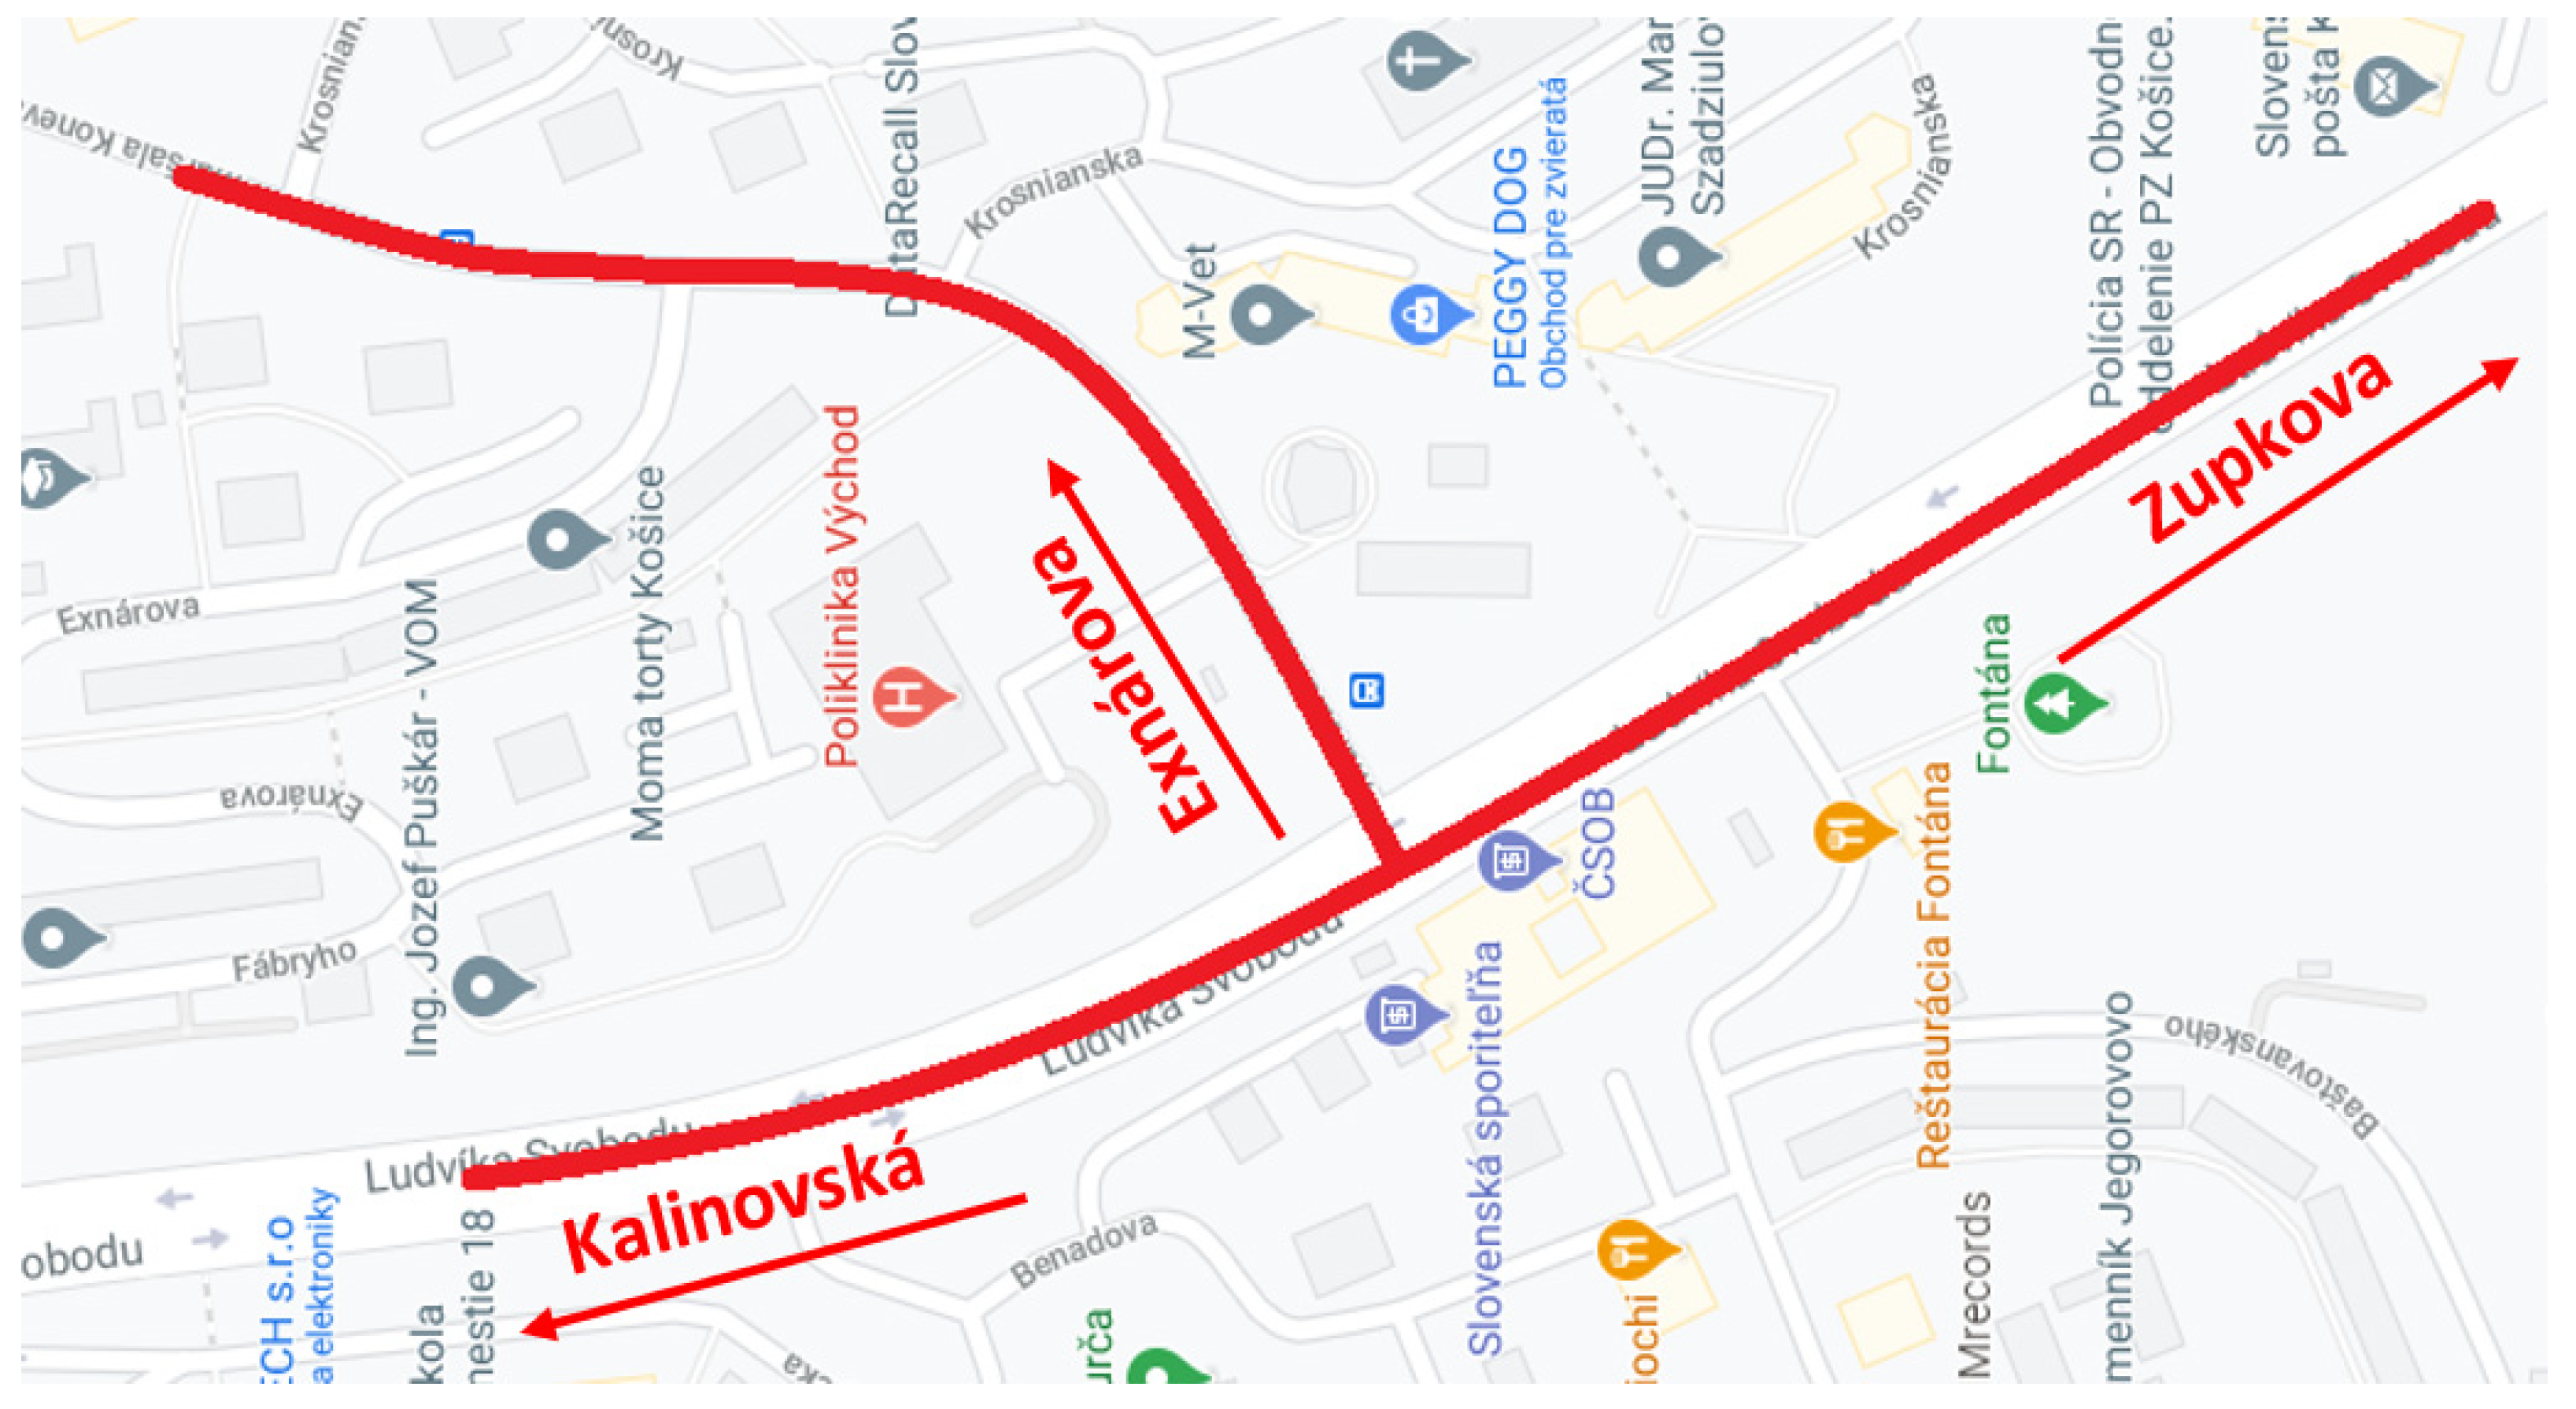
To verify a possibility of simulating and visualizing traffic processes by Tecnomatix Plant Simulation, a specific intersection was chosen in
Figure 3. As part of methodology verification, the effort was to create the most genuine model of the transport node with the definition of all rules and control systems including transport telematics.
3.1. Creation of a Simulation Model Driving Lanes
The first step in creating a simulation model of a three-arm intersection according to the proposed original methodology was the implementation of lanes (
Figure 4). In it, the basic characteristics of the intersection had to be taken into account. It is controlled by road light signaling, which controls not only vehicles, but also pedestrians.
The lanes in this simulation model were created using blocks originally meant in the program to connect production processes. Later on, the lanes will be made invisible for a visual effect (
Figure 4).
3.2. Creation of Object Library
Program’s library serves as a file that groups information flows, material flows, resources, user interface, tools and, last but not least, user objects. It makes the programmer’s work easier by offering pre-defined attributes needed when creating a model. When creating the model, only the Transporter object was used (
Figure 5). The object serves as a vehicle moving along designated routes. Six transporters were created, three of which, named AUTA_11, AUTA_22 and AUTA_33, represent passenger cars. The transporter AUTOBUS_15 is created for bus line 15. A denser interval is set for AUTOBUS_, as this transporter represents the remaining bus lines passing the intersection, i.e., line 17, 54, 55, 71, 72. The last transporter used in the model, Pedestrians, shows the pedestrians crossing the crossings and is graphically distinguished from passenger cars and buses.
In
Figure 6, Part and Container objects can be seen. However, these objects were not used in the simulation model (they are used to create production simulation models). The Container represents a handling unit and the Part represents an object that can be placed on the Container or Transporter.
3.3. Including Vehicles into the Model
Programs directly intended for modeling and traffic simulation have random vehicle generation included. They generate vehicles of different sizes, colors and speeds. However, in case of modeling the intersection in Tecnomatix Plant Simulation, the vehicles are generated by using inputs.
Another attribute entered after the input and before the lane is called Buffer. Its job is to hold back and divide vehicles between lanes as needed. There are several ways to distribute vehicles in the settings, but for this model, a random and percentage strategy was chosen.
In case of restricting vehicles entering the certain lane or their guidance, the method created in SimTalk program was used.
A very important operation is a correct alignment not only of inputs and outputs, but also of the lanes themselves in the model. It often happens that an incorrect objects alignment paralyzes the whole model. The connectors as shown in
Figure 6 can also be hidden in settings.
3.4. Setting of Vehicle and Pedestrian Graphics
The transporter in the library, the main part of the model, is displayed in vector graphics in the basic setting. The basic color combination for the transporter is a gray rectangle framed in orange. For the transporters to differ, their color can be changed and combined in different ways. The transporter vector graphics are shown in
Figure 7.
Tecnomatix Plant Simulation, after turning off vector graphics, offers several alternatives of transporter displaying. It offers, for example, an above view of the transporter, the connector, but also the worker. The program also features a function of adding your own transporter design. Graphic representation of moving objects in the model is needed not only visually, but also for the overall impression of the simulation.
3.5. Creation of Road Light Signaling
Light signaling determines vehicles priority according to a pre-defined cycle that controls it. Each light signal at the intersection has its own cycle, when STOP, WAIT and GO light signals alternate. It is very important to consistently adjust the cycle of all light signals to avoid collisions in the intersection.
In programs simulating only traffic, the priority at the intersection can be set using preferences or the aforementioned TLS. The programs offer a module enabling setting of signaling and its cycle with simple moves. There are several options for the ways to program the light signaling. The simplest method was chosen for this model including the attributes Station, Generator, a method–Method and a variable–Variable.
An attribute from the library called Station was placed in the model and renamed to Semafor_1. This Semafor_1 was, through Edit Icons option, graphically modified in three phases. The phases were named phase 1–RED, phase 2–ORANGE, phase 3–GREEN.
Proper naming of each element is very important when writing a source code. Additional settings in this attribute were not required. When entering additional light signals into the model, the first created object was used, which was then copied. Its settings have not changed.
Another element from the library needed to create light signaling is the aforementioned Generator. It was renamed to Gen_Semafor_1, then set according to a color generation interval. Each semaphore has its own generator, which is subsequently referred to by a method–Method element. The method was named Met_Semafor_1 (
Figure 8) and was also unique for each light signaling, defining the functionality of Semafor_1 attribute. This is where the principle—the brain of the entire light signaling—is embedded. It indicates that if the signaling status is equal to 1, the color of Semafor_1 should change to red. If its state is set to 2, it should change to orange, and when it is set to 3, to green. State 4 was added for a repeating cycle which includes orange color between the green and red signals. In this method, the Gen_Semafor_1 interval is included, followed by the next signal.
The last and very important element in the creation of road light signaling by Tecnomatix Plant Simulation is the definition of four Variables. These variables are used for overall setting of the light signaling, i.e., its cycle. The variable Stat_Semafor_1 defines the initial state of signaling. That is, if Stat_Semafor_1 = 1, the traffic light turns red when the simulation starts. If Stat_Semafor_1 = 2, the semaphore displays an orange signal, if Stat_Semafor_1 = 3, the semaphore turns green. Stat_Semafor_1 = 4 shows the orange color on the light signaling.
The other three variables (
Figure 8) are used to set the light signaling cycle. The Red_Semafor_1 variable is reserved for setting the STOP signal time. In this case, it is 20 s in this position. The third variable named Orange_Semafor_1 is intended for the WAIT signal and lasts for 5 s. The last variable is Green_Semafor_1, which is marked with a GO signal and lasts for 40 s.
As part of hypothesis verification, there are a total of eight independent light signals in the model, two of which are signals to control pedestrians at the crossing. Tecnomatix Plant Simulation user only works with the last step when setting up the traffic lights in the modeled intersection. As needed, TLS cycle can be varied, thus traffic situation in the intersection can be affected.
Other type of light signaling used in the model is signaling at the pedestrian crossing. It is modeled similarly to TLS for a vehicle control. The Station attribute is renamed to Semafor_7 and also by Edit Icons graphically modified into two phases, phase 1: RED and phase 2: GREEN.
Similar to the previous setup, two attributes were used from the library, namely Method and Generator. A method was entered in the generator that signals to the Station attribute (Semafor_7) to change its graphics.
Figure 9 shows the pedestrian crossing method.
This method indicates: if the state of the variable Stat_Semafor_7 = 1, the signal graphic should be changed to red and number 1 added to it. If the state of the variable Stat_Semafor_7 = 2, the attribute graphic should be changed to green and the variable set to number 1.
Three variables were used when entering road light signaling for pedestrians into the model. The first variable Stat_Semafor_7 specifies the initial state of Semafor_7. If Stat_Semafor_7 = 1, it means STOP for pedestrians and the Semafor_7 graphic attribute changes to red. If Stat_Semafor_7 = 2, it means WALK for pedestrians and the graphic of the Semaphore_7 attribute turns green. The second variable named Red_Semafor_7 determines the length of the red signal. The last variable named Green_Semafor_7 sets the length of the green signal. In the model, there are two light signals for pedestrians which control one pedestrian crossing.
3.6. Creation of Connectors for Stopping Vehicles
The last step for model’s functionality is the creation of connectors, whose task is to stop the vehicles when needed. That is, if the vehicle approaches the intersection and the light signaling shows the STOP signal, the vehicle stops at the connector. If the signal is GO, the connector sends the vehicle an impulse to safely drive through the intersection. Each light signal has its own connector with a unique code.
The model includes three types of safe pedestrian crossings in the intersection. The first of these is an underpass that crosses the main lane. The second is a crossing controlled by road light signaling, which also crosses a four-lane road.
At this crossing crossed by a road, a conflict zone arises, which was resolved by one connector for stopping the vehicle if the STOP signal is present.
Figure 10 shows a method of stopping and letting pedestrians go. It works on the same principle as the previous connector, i.e., if the status of variable Stat_Semafor_8 = 2, it stops pedestrians, and if the status of variable Stat_Semafor_8 = 1, it lets them go.
The third type of crossing is the one not provided with light signaling. At this crossing, vehicles observe the connector created from all sides before entering the conflict zone. In
Figure 11, the connector method for stopping the vehicle at the crossing can be seen.
This method implies stopping the vehicle at the connector if the pedestrian crossing (TwoLaneTrack1) is occupied. If the crossing is free, the vehicle should not be stopped at the connector and should continue. Three completely identical connectors were used for one pedestrian crossing.
3.7. Including Underlying Microscopic Model into the Simulation Model
To visualize traffic processes by microscopic simulation models, it is necessary to focus attention on individual participant behavior in the traffic process (e.g., vehicles) and their mutual interaction. Vehicle behavior in the traffic flow often changes in a random way [
21].
Among the most widespread ways of defining vehicles behavior based on their distance are CFMs—car following models. The model is characterized by the behavior of the means of transport being described based on a safe distance between the two vehicles. There are currently several variants of CFM models suitable for microscopic transport modeling. Their basis is the following relationship (1):
where
n − 1—car followed by the car
n,
τ—reaction time,
xn(t)—position of car
n in time
t,
vn(t)—speed of car
n in time
t,
an(t+τ)—acceleration of car
n in time
t +
τ.
However, CFM models are demanding, as the dependencies and parameters need to be defined that cannot be expressed by mathematical relationships. These dependencies are directly related to individual driver behavior. e.g., distance between individual vehicles. There are several modifications of the CFM model, e.g., Gipps model or Wiedemann model.
Tecnomatix Plant Simulation has tools that allow modeling different types of vehicles and their behavior, e.g., in the CFM model. It is, first of all, the MUs.Transporter (
Figure 12). As can be seen, possibilities to define parameters and behavior of the transport means are wide. At the same time, the second tool that supports the CFM implementation is using the method of programming in the SimTalk language.
In the program, such parameters can be considered as tracking the distance between vehicles and possibility of approaching and moving away from each other. Based on these facts, within the simulation model describing transport processes created in the Tecnomatix Plant Simulation program it is possible to implement suitable Microscopic simulation tools based on underlying microscopic models, e.g., Wiedemann’s Car-following Model (
Figure 13).
3.8. 2D and 3D Visualization of a Model Intersection
The intersection model was visually modified in the final version. All attributes were placed outside the intersection and all connectors were hidden. Station attributes, representing road traffic lights in the model, were placed in the intersection they control.
Figure 14 shows a 2D model.
For even better visualization, a model was created in a three-dimensional view (
Figure 15), which copies the exact model parameters in a two-dimensional view.
4. Discussion
Presented results clearly demonstrate the accuracy of research hypothesis. Tecnomatix Plant Simulation, despite being not primarily intended as a simulation tool for modeling traffic processes in transport, allows us, with the use of available software tools and the proposed methodology, to create a full-featured, discrete microscopic traffic model of any traffic node. The proposed methodology was verified in the creation of a real traffic node simulation model. Due to additional programming, modeling of roads and transport infrastructure is enabled, including transport telematics. At the same time, it provides solid possibilities to visualize traffic processes in 2D (
Figure 16) and 3D (
Figure 17).
Next, the Tecnomatix Plant Simulation enables additional SimTalk programming, i.e., practical modelling of any rules for restricting the movement of vehicles at a traffic node.
At the same time, it is possible to work with input information obtained from traffic surveys in the simulation model and define any light signaling system with the help of additional programming (
Figure 18). Due to variability and additional programming, different results and analyzes can be obtained from the model, as the SimTalk allows programming a wide range of different analysis calculations and graphical displays.
Presentation of simulation experiments results and their assessment is very important.
Figure 19 shows sample results obtained in the Vissim program.
The Tecnomatix Plant Simulation offers and enables presentation of results of the same character. It enables monitoring characteristics of each vehicle that is on the road during the simulation experiment. It enables evaluating roads permeability with regard to their capacity. The listed outputs can be seen in
Figure 20.
The creation of transport micro models using the Tecnomatix Plant Simulations program has several limitations compared to classic programs such as PTV Vissim. First of all, the software is not primarily intended to create traffic models, it does not directly implement the most well-known models such as “Car following” model, but also GHR (Gazis–Herman–Rothery), “safe distance”, Linear or psycho-physical models. However, this has been proven not to disqualify this simulation program from a possibility of creating discrete simulation models. Using the SimTalk programming tool, this shortcoming can be eliminated. However, it requires a sufficiently experienced user and the simulation model creation can be a bit more difficult.
Other shortcoming that is also fully solvable is that the Tecnomatix Plant Simulations program for the field of transport does not have certain specific outputs in form of various traffic characteristics by default. However, they can be reprogrammed using the SimTalk.
At the same time, when creating simulation models, it is necessary to individually define the characteristics of individual participants in the transport process. Even in this case, it is possible to define all of them.
On the other hand, in contrast to the mentioned limitations, there is an advantage of Tecnomatix Plant Simulation in the use of the SimTalk tool, which can implement missing functionalities into the simulation program. The above PTV Vissim does not have such a programming tool which can manifest itself in the creation of a simulation model by simplifying simulated processes or by neglecting certain variables.
The last limiting factor to mention in connection with the use of the Tecnomatix Plant Simulation program for traffic micromodels is the user themself, namely their knowledge in the field of creating traffic models, the use of the SimTalk language and its level of abstraction.
On the other hand, compared to conventional simulation tools intended for creation of traffic micromodels, Tecnomatix Plant Simulation enables creation of complex simulation models that unite various fields such as, e.g., production logistics, warehouse logistics, sense of logistics, transport telematics with the aim of comprehensive problem solution and analysis. Such a solution via classic simulation tools for transport is difficult to impossible. Possible implementation through the data transfer from two different simulation tools may be inaccurate and provide distorted results caused by, e.g., data transfer.
5. Conclusions
The research results presented in the paper confirmed that the Tecnomatix Plant Simulation program enables creation of traffic microsimulation models. In comparison with specific simulation tools for microsimulation models, it is necessary to program several models and functionalities commonly available in them using the SimTalk language, which could indicate more demanding criteria for simulation model creation.
On the other hand, the article verified that capabilities of Tecmnomatix program are not limited only to production logistics. On the contrary, the results show that the program enables creation of complex simulation models that can monitor, for example, the way the production volume affects the situation at the transport node. Another example is the option of verifying the way in which traffic at the transport node affects deliveries for the needs of securing production logistics processes. The models created in this way can then be used for designing and planning of industrial parks. They will help to reveal any deficiencies that could worsen the traffic situation at transport nodes or affect sustainability in the area of transport and urban agglomerations.
The aim of presented research and contribution was not and is not to promote Tecnomatix Plant Simulation as an exclusive simulation tool to create traffic micromodels. The aim was to point out that in certain cases, this simulation tool can be used to create reliable traffic micromodels that can show the influence of broader factors on traffic organization efficiency at a traffic node or nodes. The research can mean a starting point of longer-term research and a subject for further research purposes devoted to the impact of industrial production and production in micro-mobility and sustainable cities.
In conclusion, we can state that Tecnomatix Plant Simulation enables a full-scale creation of microscopic traffic models. It is suitable for traffic modeling and simulation, and allows to sufficiently visualize all types of traffic processes.

 ,
, 