Featured Application
Our research can be used as poultry breeding equipment or as an authenticated device for other breeding methods. It is of great significance for poultry breeding or weight tracking and monitoring of feeding behavior.
Abstract
The feeding behavior of poultry at a young age is very likely to determine the final growth of the chicken, and can also reflect the feeding status and the health status. It is also of great significance for breeding. This paper describes the development and testing of a real-time automated system and a single passage for monitoring the individual feed intake and body weight of poultry. This system integrates an automatic feeding mechanism, an RFID reading module, a weight scale, a feed scale, and a drop weighting scale. The system uses analog circuits and digital filtering to improve the weighing accuracy, and directly measures the amount of feed falling to the ground using a high-precision weighing scale. Through the sequential opening and closing of a sliding door, group-housed chickens are separated so that the young ones are fed individually. As a result of the experiment, we learned that a young chicken grows at a rate of about 8.88 g/day, and the food conversion rate (FCR) is about 4.4, which proves that this system matches the single passage and can accurately monitor the body weight change and feeding behavior of young chickens.
1. Introduction
It is important to study the feeding behavior of poultry [1,2,3,4]. The feeding behavior of poultry not only reflects the feeding status [5] and health status [6,7,8], but is also necessary for breeding [9,10,11]. A direct way of monitoring poultry feeding behavior is to track changes in body weight and feed intake [12,13].
In recent years, there have been numerous studies related to the weight of livestock, mainly focusing on image processing measures and automatic weighing systems [14,15,16]. Image processing is currently one of the most popular methods for livestock body weight measurement. Several authors have developed techniques for obtaining animals’ weight from digital images [17,18,19], an efficient, noninvasive method. However, image weighing can only obtain approximate body weight, and it is difficult to track small changes in real time. Taking into account feed intake measurement and identification at the same time is a major technical problem. Therefore, more research is necessary to improve the precision and adaptability of weighing techniques [20,21,22].
Compared with image weighing, the automatic weighing system has higher accuracy and is easier to adapt to complex conditions. According to the perching characteristics of birds, some scholars have developed perching scales that can track changes in poultry weight [16,23]. However, it is difficult for perching scales to determine individual feed intake and identity. With age, the poultry’s perching behavior will weaken, and the use, as well as the effect, will decrease. Some scholars have developed an automatic feeding and weighing system (AFWS) that measures the body weight of poultry during feeding and identifies poultry through radio frequency identification (RFID) [24,25,26,27]. As the chicken is fed, since it moves on the scale, the signal obtained from the load cell is highly oscillatory, never reaching a steady state equivalent to the static weight of the item, so this is called dynamic weighing. Dynamic weighing can pose difficulties for accurate measurement [28,29,30]. Yan used an AFWS to study the relationship between feeding behavior and performance traits in slow-growing yellow broilers, pointing out that the experimental subjects were too small for there to be accurate measurements, so AFWS was used only to provide and record feed consumption during the experiment [27]. The AFWS was also used only to provide and record feed consumption when Basso performed a feeding behavior analysis of male and female mule ducks [24]. Tu described a real-time monitoring system for the individual feed intake and body weight of a group of turkeys; the feeding inlet size of the system could be adjusted to suit the size of the turkeys [26].
As mentioned above, all of the systems rely on space restrictions to allow a single chicken to eat at a time, and regard the amount of feed dropped to the ground as having little effect on feed intake. However, due to the small feed intake of young chickens, the dropped amount has a great impact on the feed intake. Moreover, because young chickens have more serious competition behavior than during other growth stages, many young chickens are often crowded in the feeder, resulting in invalid feeding data. The dynamic weighing system used to measure young chickens requires higher accuracy. In conclusion, the existing automatic feeding and weighing system is not suitable for young birds. However, the feeding behavior of poultry at a young age is very important, as it is very likely to determine the final growth of the poultry [31,32]. However, there is little information in the literature about automatically monitoring the feeding of young chickens.
In this research, a novel method is investigated in which a passage allows a single chicken to eat. Moreover, we improve the dynamic weighing accuracy and increased drop weight scales. We demonstrate automatic tracking of body weight change and feeding change for young chickens for the first time. Thus, the objectives of this research are: (1) to develop an automated feed and body weight monitoring system for studying the feeding behavior of individual young yellow broilers in a group; and (2) to evaluate the performance and reliability of the developed system through live trials.
2. Materials and Methods
2.1. Birds and Housing
To complete this experiment, 10 healthy yellow broilers with an age of about one week and a weight of about 60 g were obtained from a local chicken seedling factory in Guangzhou. RFID tags (TK4100RFID, 134.2 KHz, Shenzhen Sanduo IOT Technology Co., Ltd., Shenzhen, China) were worn on the right foot of each chicken. These chickens were raised in a chicken house surrounded by a 5 m × 2.3 m fence, and the broiler feed (crude protein 12–18%) was purchased from a local market. The experiment lasted for 40 days.
2.2. Mechanic System Design
The feeder developed in this project was composed of an automatic feeding mechanism, RFID reading module, weight scale, feed scale, drop weighing scale, limit mechanism, and a microcontroller unit (MCU) controller. To avoid the influence of competition for food on the measurement, a passage that only allowed a single chicken to pass through was also placed in front of the feeder. The system is shown in Figure 1 and Figure 2.
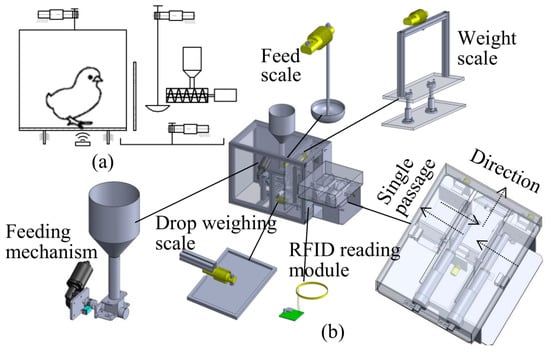
Figure 1.
Poultry automatic feeding and real-time monitoring system: (a) schematic diagram; (b) the system with a single passage.
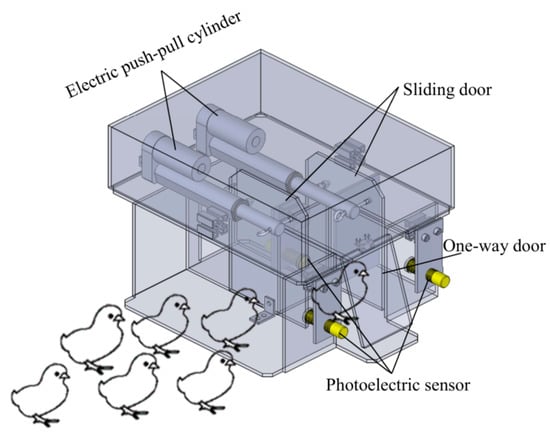
Figure 2.
Chicken passes through a single passage.
The automatic feeding mechanism was driven by a direct current (DC) motor to extrude the feed. When the scale was idle, the feed was automatically replenished, so that the amount of feed in the feeding tray was kept at a fixed value (typically 30 g). At each feeding, there was enough feed in the tray to realize the free feeding of the chickens. The weight scale of the feeder was composed of a load cell (HSX5KG, Hangzhou, China), a moving guide mechanism, and a limit mechanism, which were used to measure the body weight. When the chicken was standing on the weight scale, the MCU controller took a weight value every 200 ms, and then a median mean filter was used. The feed scale and drop weighing scale of the feeder were composed of the same load cell (HSX5KG, Hangzhou, China). The feed amount was calculated by subtracting the average value of the feed scale after eating from the average value of the feed scale before eating. The drop amount was calculated by subtracting the average drop amount before eating from the average drop amount after eating. The actual feed intake was the difference between the feed amount and the drop amount. When feeding, the feeder read the RFID tag on the chicken’s feet through the RFID reading module (DW13, Shenzhen, China) under the weight scale to identify the feeding chicken; at the end, a set of data were formed by the MCU controller. The set of data included body weight, ID, feed amount, drop amount, feeding duration, feeding end time, etc. The data were sent to the HMI, and the feeding record table was generated on the HMI.
The single channel consisted of three compartments with partitions. Between each compartment was a sliding door made of transparent panels. This door was pushed and pulled by an electric push–pull cylinder (24 V, 90 mm/s, Zhongshan, China), with a photoelectric sensor (E3F-DS30C4, NPN, Wenzhou, China) installed on the wall of each compartment. When the chicken entered the corresponding compartment, it blocked the sensor in the compartment and triggered the sensor. Through the sequential opening and closing of the sliding door, the group-housed chickens were separated so that the young chickens could be fed individually.
2.3. Signal Acquisition and Processing
The signal transmission is shown in Figure 3. The load sensor was connected to the amplification and filtering circuit, and after signal amplification, filtering, and noise reduction, it was directly connected to the analogue to digital converter (ADC) channel of the MCU (STM32f103, ARM). The MCU scanned every 200 ms and saved a weight value for each scan. The chicken identification number was read by the RFID electronic module and passed to the MCU by the USART. The body weight sequence was digitally filtered after feeding to obtain the body weight [33]. The feed amount and drop amount were weighed statically. To study the effect of the amplification and filtering circuit, this project transmitted the weight data during feeding to the personal computer (PC) synchronously, to obtain the dynamic weighing sequence of body weight when feeding.
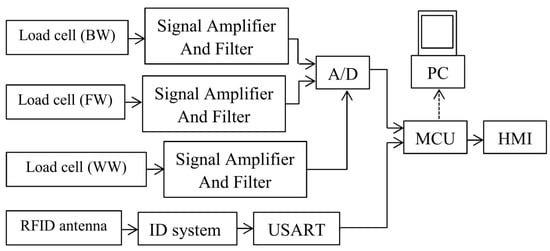
Figure 3.
Signal transmission direction; A/D, analogue to digital converter; USART, universal synchronous asynchronous receiver and transmitter; MCU, microcontroller unit; PC, personal computer.
2.3.1. Signal Amplification and Analog Filtering
The load cell converted the weight signal of the object on the scale into a voltage signal. The load cell range used in this article was 5 kg, the voltage output range was 0–20 mv, and the 0–5 kg weight signal linearly corresponded to the 0–20 mv voltage signal. Due to the weak output voltage signal of the sensor and the existence of external interference [34,35], it was necessary to process the output signal of the load sensor. This paper used an analog circuit to amplify, filter, and reduce the noise of the voltage signal. As shown in Figure 4, the analog circuit was divided into three main parts. The first part was a differential amplifier circuit, with the resistors R1 = R2 and R3 = R4 used to amplify the signal and suppress the in-phase signal. The second part was a second-order analog low-pass filter that mainly played the role of low-pass filtering [36,37]. The third part was an RC-τ-shaped filter; due to the resistance value and capacitance value being small in this part, it mainly played the role of noise reduction and current-limiting to protect the MCU.
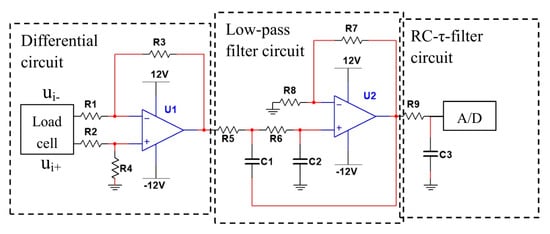
Figure 4.
Signal amplification and filter circuit.
The magnification of the first part was:
The magnification and transfer function of the second part were:
Combined with Equations (1)–(3), the transfer function of the signal amplification and filter circuit was:
In this equation, R5, R6, and R9 are resistances whose unit is Ω, and C1, C2, C3, and C4 are capacitances whose unit is F.
2.3.2. Median Mean Filter
Due to the swaying and shaking of the poultry on the scale when they were eating, some low-frequency interference signals were generated, which appeared to fluctuate around the real body weight. When the chicken entered or left the scale, an impact signal was also formed, making the weight signal unstable. Generally, unstable signals are significantly larger or smaller than the real signals. Nevertheless, since these low-frequency interferences were close to the frequency of the body weight signal, they were generally difficult for analog circuits to filter out. In digital filtering, an interference signal that is larger or smaller than the real signal can be removed by sorting and taking the median value. The median mean filter [38] can be expressed by Equation (5), as follows:
where x(i) is the sequence, N is the sequence length and p and q are the proportion of the sequence length; p = q is the symmetric median mean filter, p ≠ q is the asymmetric median mean filter, and SME is the sorting-based mass estimator.
2.4. Performance Evaluation
2.4.1. Coefficient
By using an object with a known weight and an error < 0.1 g, ranging from 50 to 1500 g, and placing it on the scale of the feeder at 50-g intervals, recording the weight (M) and the numerical (N), we calculated the body weight coefficient according to Equation (6). In the same way, using the known weight and error < 0.1 g, with a range of 0–100 g, we calculated the feed scale and the drop weight scale at 10 g intervals. The relationship between weight (M) and numerical (N) is:
where M is the weight in g; N is the numerical, ranging from 0 to 4095, with no unit; N0 is the initial numerical; the initial weight is obtained by Mref × N0; and Mref is the coefficient in g.
2.4.2. Static Error
Using a static object with a known weight and error < 0.1 g, the range 50–1500 g was taken as the real weight (mReal), and weighed with a scale of the feeder at intervals of 50 g. The value measured by the scale of the feeder was taken as the sample weight (m) to calculate the static mean and standard deviation of the scale of the feeder by means of Equations (7) and (8). The same method was used to calculate the static error of the feed scale and drop weighing scale. The known weight range was 0–100 g, with weight error < 0.1 g, and the static object was taken as the real weight (mReal), which was weighed by the feed scale and the drop weight scale at 10 g intervals. If the value was taken as the sample weight (m), then the mean and standard deviation of the feed scale and the drop weighing scale were calculated by Equations (7) and (8).
2.4.3. Dynamic Error
The chicken was placed on the electronic balance (MT301, ±0.1 g, Shenzhen Mobil Electronics Co., Ltd., Shenzhen, China) as shown in Figure 5a. We read the balance until it was stable, repeating 10 times, and took the average value as the chicken’s weight (mReal). The chickens were then driven to the weight scale of the feeder, where they could eat normally, as shown in Figure 5. The MCU scanned every 200 ms and saved a weight value for each scan. After the chicken left the weight scale, the weight sequence was formed. The MCU performed median mean filtering on the weight sequence according to Equation (5), to calculate the weight of the chickens fed this time, and used this weight as the sample weight (m). We sampled chickens and individuals multiple times at different growth stages, and calculated the dynamic error of the weight scale using Equations (7) and (8).
where μ is the average deviation; σ is the standard deviation; mReal is the real weight in g; m is the sample weight in g; and n is the number of repeated tests.
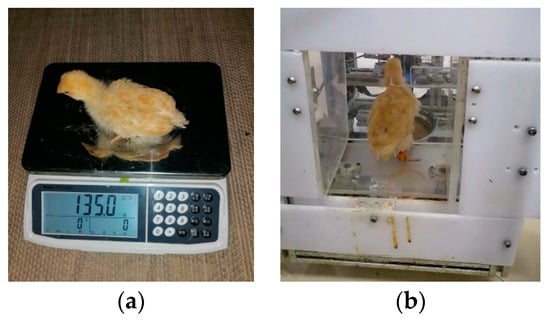
Figure 5.
Chicken weight measurement: (a) weighing a chicken with an electronic balance; (b) chicken body weight being measured by the system.
2.5. Live Trials
In the chicken house, we placed the feeder system and single passage developed in this project far away from the water tray to encourage the chickens to stay away from the feeder after eating, so that the chickens that had not eaten would be more likely to eat. There was a platform with a height of 0.6 m in the chicken house, and the chickens could move freely around the chicken house. The layout of the chicken house is shown in Figure 6. The feeder automatically replenished the feed when the weighing scale was idle so that the amount of feed (typically 30 g) in the feed tray was sufficient for one intake per chicken. The feeder outside the house was replenished once every three days, to try to not to interfere with the behavior of the chickens, and the feeding behavior was automatically recorded by the system.
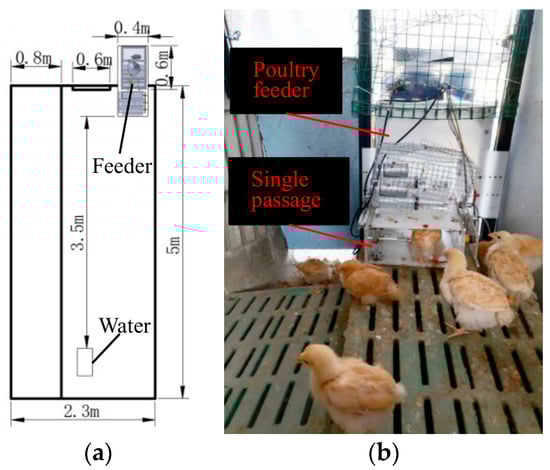
Figure 6.
Experiment with chicken feeding ad libitum: (a) layout of chicken house; (b) live trial.
3. Results
3.1. Signal Acquisition and Median Filtering
In this paper, the MCU controller collects the dynamic weighing and static weighing signals after filtering by the circuit at a frequency of 5 Hz to analyze the difference between the two weighing methods, as shown in Figure 7. The results show that dynamic weighing and static weighing are significantly different, and there can be a large error when directly reading the weight of a living body by static weighing.
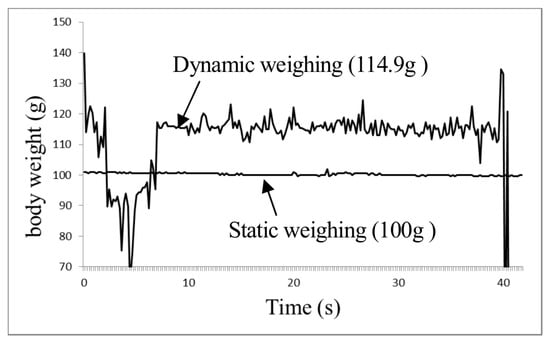
Figure 7.
Original load cell signal of weight scale.
The interference caused by the activities of poultry on the scale are close to the frequency of the body weight signal, and the analog circuit is difficult to filter out. Therefore, the median mean filter is used to eliminate the interference, as shown in Figure 8. The experimental results show that, after sorting the weight sequence from small to large, the rearranged sequence will always have an interval that overlaps with the actual weight, and the mean interval (p, q) has different values, which will affect the final calculated weight.
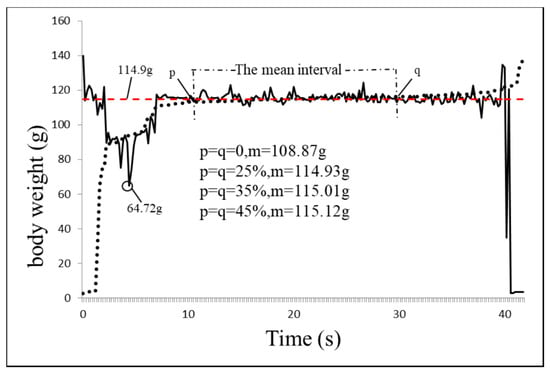
Figure 8.
Filtering by median mean: solid line, dynamic weighing raw signal acquired at 5 Hz; dotted line, weight signals are sorted from smallest to largest.
3.2. Weight Coefficient and Error Calculation Results
3.2.1. Coefficient and Static Weighing Error
To calculate the coefficient of each scale and verify the static weighing performance, we used the feeder’s weight scale, feed scale, and drop weighing scale to weigh at certain intervals of known weight, and obtained each scale. The results are shown in Figure 9, Figure 10 and Figure 11. The results show that the digital signals of the weight scale, the feed scale, and the drop weight scale have a linear relationship with the weight; the weight coefficient of the scale is 0.3187, the average deviation is 0.827 g, and the standard deviation is 0.943. The weight coefficient of the feed scale is 0.188, the average deviation is 0.108 g, and the standard deviation is 0.124. The weight coefficient of the drop weighing scale is 0.1877, the average deviation is 0.259 g, and the standard deviation is 0.27.
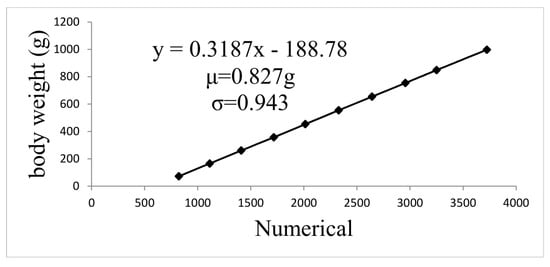
Figure 9.
Static errors and scale coefficients for weight scale.
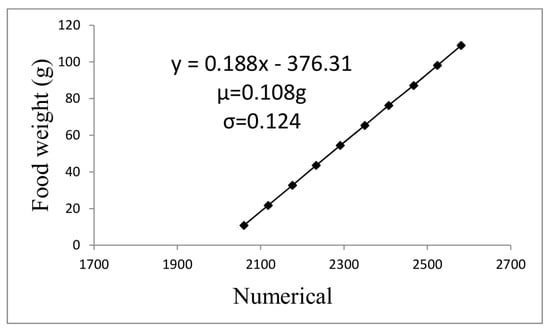
Figure 10.
Static errors and scale coefficients for feed scale.
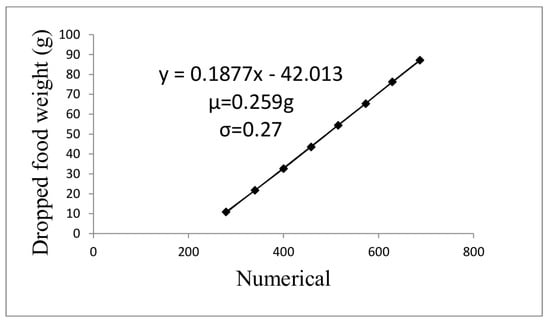
Figure 11.
Static errors and scale coefficients for drop weighing scale.
3.2.2. Dynamic Weighing Error
In order to verify the dynamic weighing performance, the live chickens were weighed with a high-precision electronic balance as the true value, and then the chickens were driven to the weight scale of the feeder to eat normally. The feeder obtained the weighing signal and processed it. The obtained body weight was used as the sample weight, and the dynamic error was calculated. The experimental results are shown in Table 1. When the symmetric median mean filter was used, and the initial length of the sorted body weight sequence accounted for p = q = 35% of the overall sequence ratio, the dynamic average deviation was u = 2.164 g, and the standard deviation was σ = 2.648, which were the smallest deviation and fluctuation.

Table 1.
Weight scale dynamic error calculation results.
3.3. Chicken Ad Libitum Test Results
3.3.1. The Results of Single Chicks
To analyze the feeding behavior and body weight change law of a single young chicken, one chicken’s data were randomly selected from the data of group-housed chickens, as shown in Figure 12 and Figure 13. The experimental results show that this young chicken was growing at about 9 g/day. The FCR for this sample in its 4th week of growth was calculated by summing all of its meals during the week (Figure 13) to obtain the total amount of feed intake (366.32 g) and dividing it by its weight increase (366.32 g/68.74 g = 5.33).
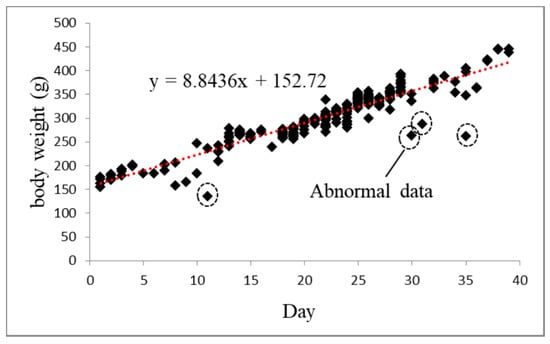
Figure 12.
Body weight changes in young chickens during ad libitum feeding.
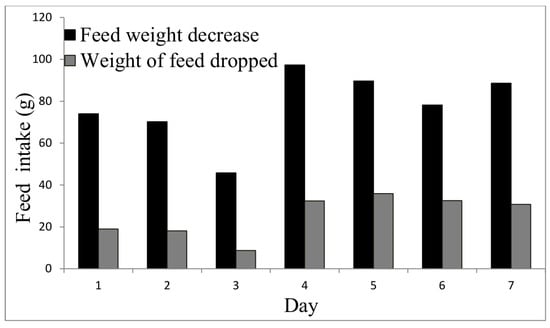
Figure 13.
One week’s feeding of a young chicken.
3.3.2. The Results of Flock Chicks
In the chicken house, the system automatically feeds and records. The amount of feed in the feeder was kept at a fixed value (typically 30 g). Only a single chicken was allowed to eat ad libitum at a time. The experiment lasted for 40 days. The data for the 4th week were taken out, as shown in Table 2. The average body weight of the flock increased at a rate of about 8.88 g/day, the average consumption of feed was about 6.14 g/meal, and 1.67 g/meal feed fell to the ground. The actual feed intake was about 4.47 g/meal each time, each chicken fed about 8.7 times/day, and the average length of each feed was about 620 s. However, some chickens stayed in the feeder for a long time: the chick with electronic foot tag number 57 spent 3490 s, 2001 s, and 1712 s in the feeder on the 4th, 6th, and 7th days, respectively.
Table 2.
Monitoring results for flock growth.
4. Discussion
In this study, we found that, due to the low accuracy of the dynamic weighing of poultry, the impact of feed drop on the actual feed intake, and the competition between young birds creating errors in the measured value, there are some differences in the measurement of body weight changes and feeding behavior of young chickens. To improve the dynamic weighing accuracy of poultry, we used circuits to amplify, filter, and denoise the weight signal, and then performed digital filtering through the median mean filter. We achieved a static weighing accuracy of 0.82 g and a dynamic weighing accuracy of 2.164 g, while the feed scale and drop scale accuracy were 0.108 g and 0.259 g, respectively. The system developed in this project added a drop weighing scale for the amount of feed dropped and calculated the actual intake of each feed by establishing the difference between the feed consumption and the amount of feed dropped. To solve the problem of crowding by multiple chicks introducing errors into the measured value, we developed a single passage that only allows a single chick to pass through, to realize single feeding and accurately measure the body weight changes and feeding behavior of the chicks. As a result of the experiment, the feeding behavior of chickens, as well as their body weight change, was analyzed. Young chickens grow at a rate of about 8.88 g/day, and the FCR is about 4.4, with a body weight range from 208 g to 280 g, which proved that this system, paired with a single passage, can accurately monitor the body weight changes and feeding behavior of young chickens. We also concluded that dynamic weighing is required to improve the accuracy of live poultry weighing.
Chicks leave one weight measurement each time they eat, so body weight data on the chicks can be collected multiple times in one day. Abnormal data can easily be excluded from the distribution range of the multiple body weight data of the day. As shown in Figure 12, data that are much smaller than the weight range of the day can be considered abnormal, and it can be concluded that the young chicken is not completely standing on the weight scale, so an accurate weight change rule can be obtained. In terms of the actual feed intake of young chickens, as shown in Figure 13, although there may be some fluctuations in the daily consumption, the actual daily feed intake changes are small. When food is abundant, the young chickens will rummage in the feed, and the drop amount will increase. The feed scale and drop weighing scale in this study only measure the weight when the chicken is not eating, which can be described as static weighing. Although the feed intake of young chickens is small, it also makes the feed scale and the range of the drop weighing scale small, which is conducive to the improvement of weighing accuracy, so even if a small amount of intake and drop can be obtained when the young chickens are eating, this can allow us to calculate the accurate actual intake.
When comparing dynamic weighing with static weighing, as shown in Figure 7, the results show that there is a significant difference between static weighing and dynamic weighing. After circuit amplification, analog filtering, and noise reduction of static weighing, when the signal reaches stability, its signal fluctuation is small, the high-frequency interference is greatly suppressed, the signal-to-noise ratio is significantly improved, and the accurate weight can be obtained. However, the swaying and shaking of poultry on the scales produce some disturbances. It is difficult to obtain accurate weights of chickens when they are eating by means of static weighing. Moreover, because such disturbances are close to the frequency of the weight signal, the analog circuit generally struggles to filter them out. It can also be concluded that the interference source of static weighing is related to the weighing system itself, and the interference source of dynamic weighing is mainly from living activities. For the weighing of static objects, the weighing signal generally fluctuates only at the moment when the static object is placed on the scale, while the signal in dynamic weighing is unstable throughout the whole weighing process. As shown in Figure 8, when the chick is eating, its weight fluctuation range can reach 56%; therefore, to improve the accuracy of live weighing, digital filtering is required. In preliminary experiments, it was found that even if a high-precision electronic scale was used to weigh live poultry, and the chicken stayed calm and did not move, balance readings also fluctuated; the larger the chicken, the greater the fluctuation of the electronic balance. On the other hand, when a load sensor with large static weighing error collected data at 5 Hz and then performed digital filtering in the median mean, the obtained poultry weight was not significantly different from the body weight data manually read out using a high-precision electronic balance.
Combining the results of different researchers, it can be concluded that there are differences in the feeding behavior of different breeds of poultry at different ages. In this study, our calculation of the FCR (4.4) of yellow broilers was larger than that of Tu for turkeys (2.57) [26], which may be due to the difference in breed. An adult turkey is three to four times larger than a domestic chicken, while a yellow broiler is a slightly smaller domestic chicken, and its growth rate is lower than that of the turkey. Our FCR (4.4) is also greater than the result of Yan, who also calculated the FCR of yellow broilers (2.6–3.7) [27], most likely due to the age difference. In their study, the initial weight of the chicken was 1774.23 g, while our initial weight was only 208 g. The experimental results are consistent with the actual situation. In the experiment, it was observed that the chick with the largest feed intake grew the fastest, but its FCR was relatively high. This may be because when the feed exceeds a certain amount, it cannot grow into meat, but is excreted in feces.
In this study, we showed for the first time the automated monitoring of body weight change and feeding behavior in group-housed chicks. We also directly measured the amount of feed falling to the ground during each feeding using a high-precision weighing scale, thereby avoiding the error caused by estimating the actual feed intake. We also developed a single passage that only allows a single chick to feed, avoiding the failure of feeding data measurement caused by multiple chicks crowding onto the scale when competing for food.
Our research subjects were yellow broilers weighing between 105 and 500 g, and the sample size was only 10 young chickens. Two died over the course of the experiments, so the density was smaller than intended: 10.6 per feeder [25,27]. Moreover, we found that there were instances of chickens lying in the feeder after having a feed, which had some impact on the measurements. In the next step, we will research expelling and frightening methods when young chickens lie in a feeder.
5. Conclusions
The results suggest that we have improved the accuracy of live poultry weighing, and the real-time automated monitoring system developed in this study, paired with a single passage, can accurately monitor the body weight changes and feeding behavior of young chickens. Our research may be useful in poultry breeding or can be used as a verification device for other breeding methods, and it could improve the growth rate of poultry and make the FCR better, which would reduce the time taken in raising poultry and improve the feed utilization rate, shorten the production cycle and reduce the feeding cost. This is beneficial to alleviate the current food crisis facing the world. Our research is also of great significance for poultry weight tracking and feeding behavior monitoring, which would improve the automation level of poultry production, and the timely detection of abnormal behavior in poultry to prevent major economic losses before they occur, bringing economic benefits for poultry farmers.
Author Contributions
Y.P.: Writing—original draft, writing—review and editing, conceptualization, methodology, investigation, data curation, software, formal analysis, validation, Resources. Z.Z.: writing—review and editing, supervision, conceptualization, Resources, funding acquisition. E.L.: investigation, data curation, software, formal analysis, Resources, conceptualization, funding acquisition. X.H.: Data curation, investigation, Methodology, Software. B.Z.: Data curation, investigation, Methodology, Software. F.W.: Data curation, Resources, investigation, review. J.G.: investigation, data curation, formal analysis, Resources. Z.L.: investigation, Resources, Validation, Supervision. All authors have read and agreed to the published version of the manuscript.
Funding
This research was funded by a Start-up Research Project of Maoming Laboratory (2021TDQD002), the Key Laboratory of Modern Agricultural Intelligent Equipment in South China, Ministry of Agriculture and Rural Affairs, China (HNZJ202209), Special Fund for Rural Revitalization Strategy of Guangdong Province, Improvement of Agricultural Science and Technology Capacity (403-2023-XMZC-0002-90).
Institutional Review Board Statement
Not applicable.
Informed Consent Statement
Not applicable.
Data Availability Statement
Not applicable.
Acknowledgments
We acknowledge Guangzhou Jiaen Technology Co., Ltd. for the materials and facilities.
Conflicts of Interest
The authors declare no conflict of interest.
References
- Aydin, A.; Berckmans, D. Using sound technology to automatically detect the short-term feeding behaviours of broiler chickens. Comput. Electron. Agric. 2016, 121, 25–31. [Google Scholar] [CrossRef]
- Bokkers, E.; Koene, P. Eating behaviour, and preprandial and postprandial correlations in male broiler and layer chickens. Br. Poult. Sci. 2003, 44, 538–544. [Google Scholar] [CrossRef]
- Forbes, J. Feeding behaviour. In Voluntary Food Intake and Diet Selection in Farm Animals; CABI: Wallingford, UK, 2007; pp. 12–40. [Google Scholar]
- Huang, J.; Zhang, T.; Cuan, K.; Fang, C. An intelligent method for detecting poultry eating behaviour based on vocalization signals. Comput. Electron. Agric. 2021, 180, 105884. [Google Scholar] [CrossRef]
- Patra, A.; Lalhriatpuii, M. Progress and prospect of essential mineral nanoparticles in poultry nutrition and feeding—A review. Biol. Trace Elem. Res. 2020, 197, 233–253. [Google Scholar] [CrossRef]
- Carroll, B.T.; Anderson, D.V.; Daley, W.; Harbert, S.; Britton, D.F.; Jackwood, M.W. Detecting symptoms of diseases in poultry through audio signal processing. In Proceedings of the 2014 IEEE Global Conference on Signal and Information Processing (GlobalSIP), Atlanta, GA, USA, 3–5 December 2014; pp. 1132–1135. [Google Scholar]
- Swayne, D.E. Diseases of Poultry; Wiley-Blackwell: Ames, Iowa, 2013. [Google Scholar]
- Fang, C.; Zheng, H.; Yang, J.; Deng, H.; Zhang, T. Study on Poultry Pose Estimation Based on Multi-Parts Detection. Animals 2022, 12, 1322. [Google Scholar] [CrossRef]
- Aggrey, S.E.; Rekaya, R. Poultry Breeding. In Animal Breeding and Genetics; Spangler, M.L., Ed.; Springer: New York, NY, USA, 2022; pp. 181–190. [Google Scholar] [CrossRef]
- Li, J.; Yang, W.; Liu, L.; Liu, X.; Qiu, F.; Ma, X. Development and environmental impacts of China’s livestock and poultry breeding. J. Clean. Prod. 2022, 371, 133586. [Google Scholar] [CrossRef]
- Saxena, V.K.; Kolluri, G. Selection methods in poultry breeding: From genetics to genomics. In Application of Genetics and Genomics in Poultry Science; IntechOpen: London, UK, 2018; pp. 19–32. [Google Scholar]
- Li, N.; Ren, Z.; Li, D.; Zeng, L. Automated techniques for monitoring the behaviour and welfare of broilers and laying hens: Towards the goal of precision livestock farming. Animal 2020, 14, 617–625. [Google Scholar] [CrossRef]
- Richards, M.; Proszkowiec-Weglarz, M. Mechanisms regulating feed intake, energy expenditure, and body weight in poultry. Poult. Sci. 2007, 86, 1478–1490. [Google Scholar] [CrossRef]
- Chedad, A.; Vranken, E.; Aerts, J.-M.; Berckmans, D. Behaviour of chickens towards automatic weighing systems. IFAC Proc. Vol. 2000, 33, 207–212. [Google Scholar] [CrossRef]
- Doyle, I.; Leeson, S. Automatic weighing of poultry reared on a litter floor. Can. J. Anim. Sci. 1989, 69, 1075–1081. [Google Scholar] [CrossRef]
- Turner, M.; Gurney, P.; Crowther, J.; Sharp, J.R. An automatic weighing system for poultry. J. Agric. Eng. Res. 1984, 29, 17–24. [Google Scholar] [CrossRef]
- Amraei, S.; Abdanan Mehdizadeh, S.; Salari, S. Broiler weight estimation based on machine vision and artificial neural network. Br. Poult. Sci. 2017, 58, 200–205. [Google Scholar] [CrossRef]
- Amraei, S.; Mehdizadeh, S.A.; Nääs, I.A. Development of a transfer function for weight prediction of live broiler chicken using machine vision. Eng. Agrícola 2018, 38, 776–782. [Google Scholar] [CrossRef]
- Mortensen, A.K.; Lisouski, P.; Ahrendt, P. Weight prediction of broiler chickens using 3D computer vision. Comput. Electron. Agric. 2016, 123, 319–326. [Google Scholar] [CrossRef]
- Ahn, J.; Briers, G.; Baker, M.; Price, E.; Sohoulande Djebou, D.C.; Strong, R.; Piña, M.; Kibriya, S. Food security and agricultural challenges in West-African rural communities: A machine learning analysis. Int. J. Food Prop. 2022, 25, 827–844. [Google Scholar] [CrossRef]
- Strong, R.; Wynn, J.T.; Lindner, J.R.; Palmer, K. Evaluating Brazilian Agriculturalists’ IoT Smart Agriculture Adoption Barriers: Understanding Stakeholder Salience Prior to Launching an Innovation. Sensors 2022, 22, 6833. [Google Scholar] [CrossRef]
- Zeng, Z.; Zeng, F.; Han, X.; Elkhouchlaa, H.; Yu, Q.; Lü, E. Real-time monitoring of environmental parameters in a commercial gestating sow house using a zigbee-based wireless sensor network. Appl. Sci. 2021, 11, 972. [Google Scholar] [CrossRef]
- Chedad, A.; Aerts, J.-M.; Vranken, E.; Lippens, M.; Zoons, J.; Berckmans, D. Do heavy broiler chickens visit automatic weighing systems less than lighter birds? Br. Poult. Sci. 2003, 44, 663–668. [Google Scholar] [CrossRef]
- Basso, B.; Lagüe, M.; Guy, G.; Ricard, E.; Marie-Etancelin, C. Detailed analysis of the individual feeding behavior of male and female mule ducks. J. Anim. Sci. 2014, 92, 1639–1646. [Google Scholar] [CrossRef]
- Howie, J.; Avendano, S.; Tolkamp, B.; Kyriazakis, I. Genetic parameters of feeding behavior traits and their relationship with live performance traits in modern broiler lines. Poult. Sci. 2011, 90, 1197–1205. [Google Scholar] [CrossRef]
- Tu, X.; Du, S.; Tang, L.; Xin, H.; Wood, B. A real-time automated system for monitoring individual feed intake and body weight of group housed turkeys. Comput. Electron. Agric. 2011, 75, 313–320. [Google Scholar] [CrossRef]
- Yan, W.; Sun, C.; Wen, C.; Ji, C.; Zhang, D.; Yang, N. Relationships between feeding behaviors and performance traits in slow-growing yellow broilers. Poult. Sci. 2019, 98, 548–555. [Google Scholar] [CrossRef]
- Cveticanin, D.; Wendl, G. Dynamic weighing of dairy cows: Using a lumped-parameter model of cow walk. Comput. Electron. Agric. 2004, 44, 63–69. [Google Scholar] [CrossRef]
- Cveticanin, D. New approach to the dynamic weighing of livestock. Biosyst. Eng. 2003, 86, 247–252. [Google Scholar] [CrossRef]
- Watanabe, S.; Izawa, M.; Kato, A.; Ropert-Coudert, Y.; Naito, Y. A new technique for monitoring the detailed behaviour of terrestrial animals: A case study with the domestic cat. Appl. Anim. Behav. Sci. 2005, 94, 117–131. [Google Scholar] [CrossRef]
- Mbukwane, M.J.; Nkukwana, T.T.; Plumstead, P.W.; Snyman, N. Sunflower Meal Inclusion Rate and the Effect of Exogenous Enzymes on Growth Performance of Broiler Chickens. Animals 2022, 12, 253. [Google Scholar] [CrossRef]
- Solomon, H.; Adejoro, F.A.; Nkukwana, T.T. Efficacy of three heat-stable microbial phytases on growth performance and bone development and strength of broilers fed diets deficient in available phosphorus. Can. J. Anim. Sci. 2022, 102, 420–430. [Google Scholar] [CrossRef]
- Winder, S. Analog and Digital Filter Design; Elsevier: Amsterdam, The Netherlands, 2002. [Google Scholar]
- Pourashraf, S.; Ramirez-Angulo, J.; Cabrera-Galicia, A.R.; Lopez-Martin, A.J.; González-Carvajal, R. An amplified offset compensation scheme and its application in a track and hold circuit. IEEE Trans. Circuits Syst. II Express Briefs 2017, 65, 416–420. [Google Scholar] [CrossRef]
- Wu, Q.; Wang, S.; Liao, C.; Tang, Z.; Luo, H.; Huang, S.; Deng, L. A mV-level real-time peak-voltage detection circuit based on differential structure. Rev. Sci. Instrum. 2021, 92, 034713. [Google Scholar] [CrossRef]
- Ahn, D.; Park, J.-S.; Kim, C.-S.; Kim, J.; Qian, Y.; Itoh, T. A design of the low-pass filter using the novel microstrip defected ground structure. IEEE Trans. Microw. Theory Tech. 2001, 49, 86–93. [Google Scholar] [CrossRef]
- Karki, J. Active Low-Pass Filter Design; Texas Instruments: Dallas, TX, USA, 2000. [Google Scholar]
- Zhang, J.; Ying, Y.; Jiang, H.; Wang, H.; Yang, C.; Yu, Y.; Wang, J. Application of optimized digital filters and asymmetrically trimmed mean to improve the accuracy of dynamic egg weighing. Trans. ASABE 2017, 60, 1099–1111. [Google Scholar] [CrossRef]


Publisher’s Note: MDPI stays neutral with regard to jurisdictional claims in published maps and institutional affiliations. |
© 2022 by the authors. Licensee MDPI, Basel, Switzerland. This article is an open access article distributed under the terms and conditions of the Creative Commons Attribution (CC BY) license (https://creativecommons.org/licenses/by/4.0/).