1. Introduction
It is important to study the feeding behavior of poultry [
1,
2,
3,
4]. The feeding behavior of poultry not only reflects the feeding status [
5] and health status [
6,
7,
8], but is also necessary for breeding [
9,
10,
11]. A direct way of monitoring poultry feeding behavior is to track changes in body weight and feed intake [
12,
13].
In recent years, there have been numerous studies related to the weight of livestock, mainly focusing on image processing measures and automatic weighing systems [
14,
15,
16]. Image processing is currently one of the most popular methods for livestock body weight measurement. Several authors have developed techniques for obtaining animals’ weight from digital images [
17,
18,
19], an efficient, noninvasive method. However, image weighing can only obtain approximate body weight, and it is difficult to track small changes in real time. Taking into account feed intake measurement and identification at the same time is a major technical problem. Therefore, more research is necessary to improve the precision and adaptability of weighing techniques [
20,
21,
22].
Compared with image weighing, the automatic weighing system has higher accuracy and is easier to adapt to complex conditions. According to the perching characteristics of birds, some scholars have developed perching scales that can track changes in poultry weight [
16,
23]. However, it is difficult for perching scales to determine individual feed intake and identity. With age, the poultry’s perching behavior will weaken, and the use, as well as the effect, will decrease. Some scholars have developed an automatic feeding and weighing system (AFWS) that measures the body weight of poultry during feeding and identifies poultry through radio frequency identification (RFID) [
24,
25,
26,
27]. As the chicken is fed, since it moves on the scale, the signal obtained from the load cell is highly oscillatory, never reaching a steady state equivalent to the static weight of the item, so this is called dynamic weighing. Dynamic weighing can pose difficulties for accurate measurement [
28,
29,
30]. Yan used an AFWS to study the relationship between feeding behavior and performance traits in slow-growing yellow broilers, pointing out that the experimental subjects were too small for there to be accurate measurements, so AFWS was used only to provide and record feed consumption during the experiment [
27]. The AFWS was also used only to provide and record feed consumption when Basso performed a feeding behavior analysis of male and female mule ducks [
24]. Tu described a real-time monitoring system for the individual feed intake and body weight of a group of turkeys; the feeding inlet size of the system could be adjusted to suit the size of the turkeys [
26].
As mentioned above, all of the systems rely on space restrictions to allow a single chicken to eat at a time, and regard the amount of feed dropped to the ground as having little effect on feed intake. However, due to the small feed intake of young chickens, the dropped amount has a great impact on the feed intake. Moreover, because young chickens have more serious competition behavior than during other growth stages, many young chickens are often crowded in the feeder, resulting in invalid feeding data. The dynamic weighing system used to measure young chickens requires higher accuracy. In conclusion, the existing automatic feeding and weighing system is not suitable for young birds. However, the feeding behavior of poultry at a young age is very important, as it is very likely to determine the final growth of the poultry [
31,
32]. However, there is little information in the literature about automatically monitoring the feeding of young chickens.
In this research, a novel method is investigated in which a passage allows a single chicken to eat. Moreover, we improve the dynamic weighing accuracy and increased drop weight scales. We demonstrate automatic tracking of body weight change and feeding change for young chickens for the first time. Thus, the objectives of this research are: (1) to develop an automated feed and body weight monitoring system for studying the feeding behavior of individual young yellow broilers in a group; and (2) to evaluate the performance and reliability of the developed system through live trials.
2. Materials and Methods
2.1. Birds and Housing
To complete this experiment, 10 healthy yellow broilers with an age of about one week and a weight of about 60 g were obtained from a local chicken seedling factory in Guangzhou. RFID tags (TK4100RFID, 134.2 KHz, Shenzhen Sanduo IOT Technology Co., Ltd., Shenzhen, China) were worn on the right foot of each chicken. These chickens were raised in a chicken house surrounded by a 5 m × 2.3 m fence, and the broiler feed (crude protein 12–18%) was purchased from a local market. The experiment lasted for 40 days.
2.2. Mechanic System Design
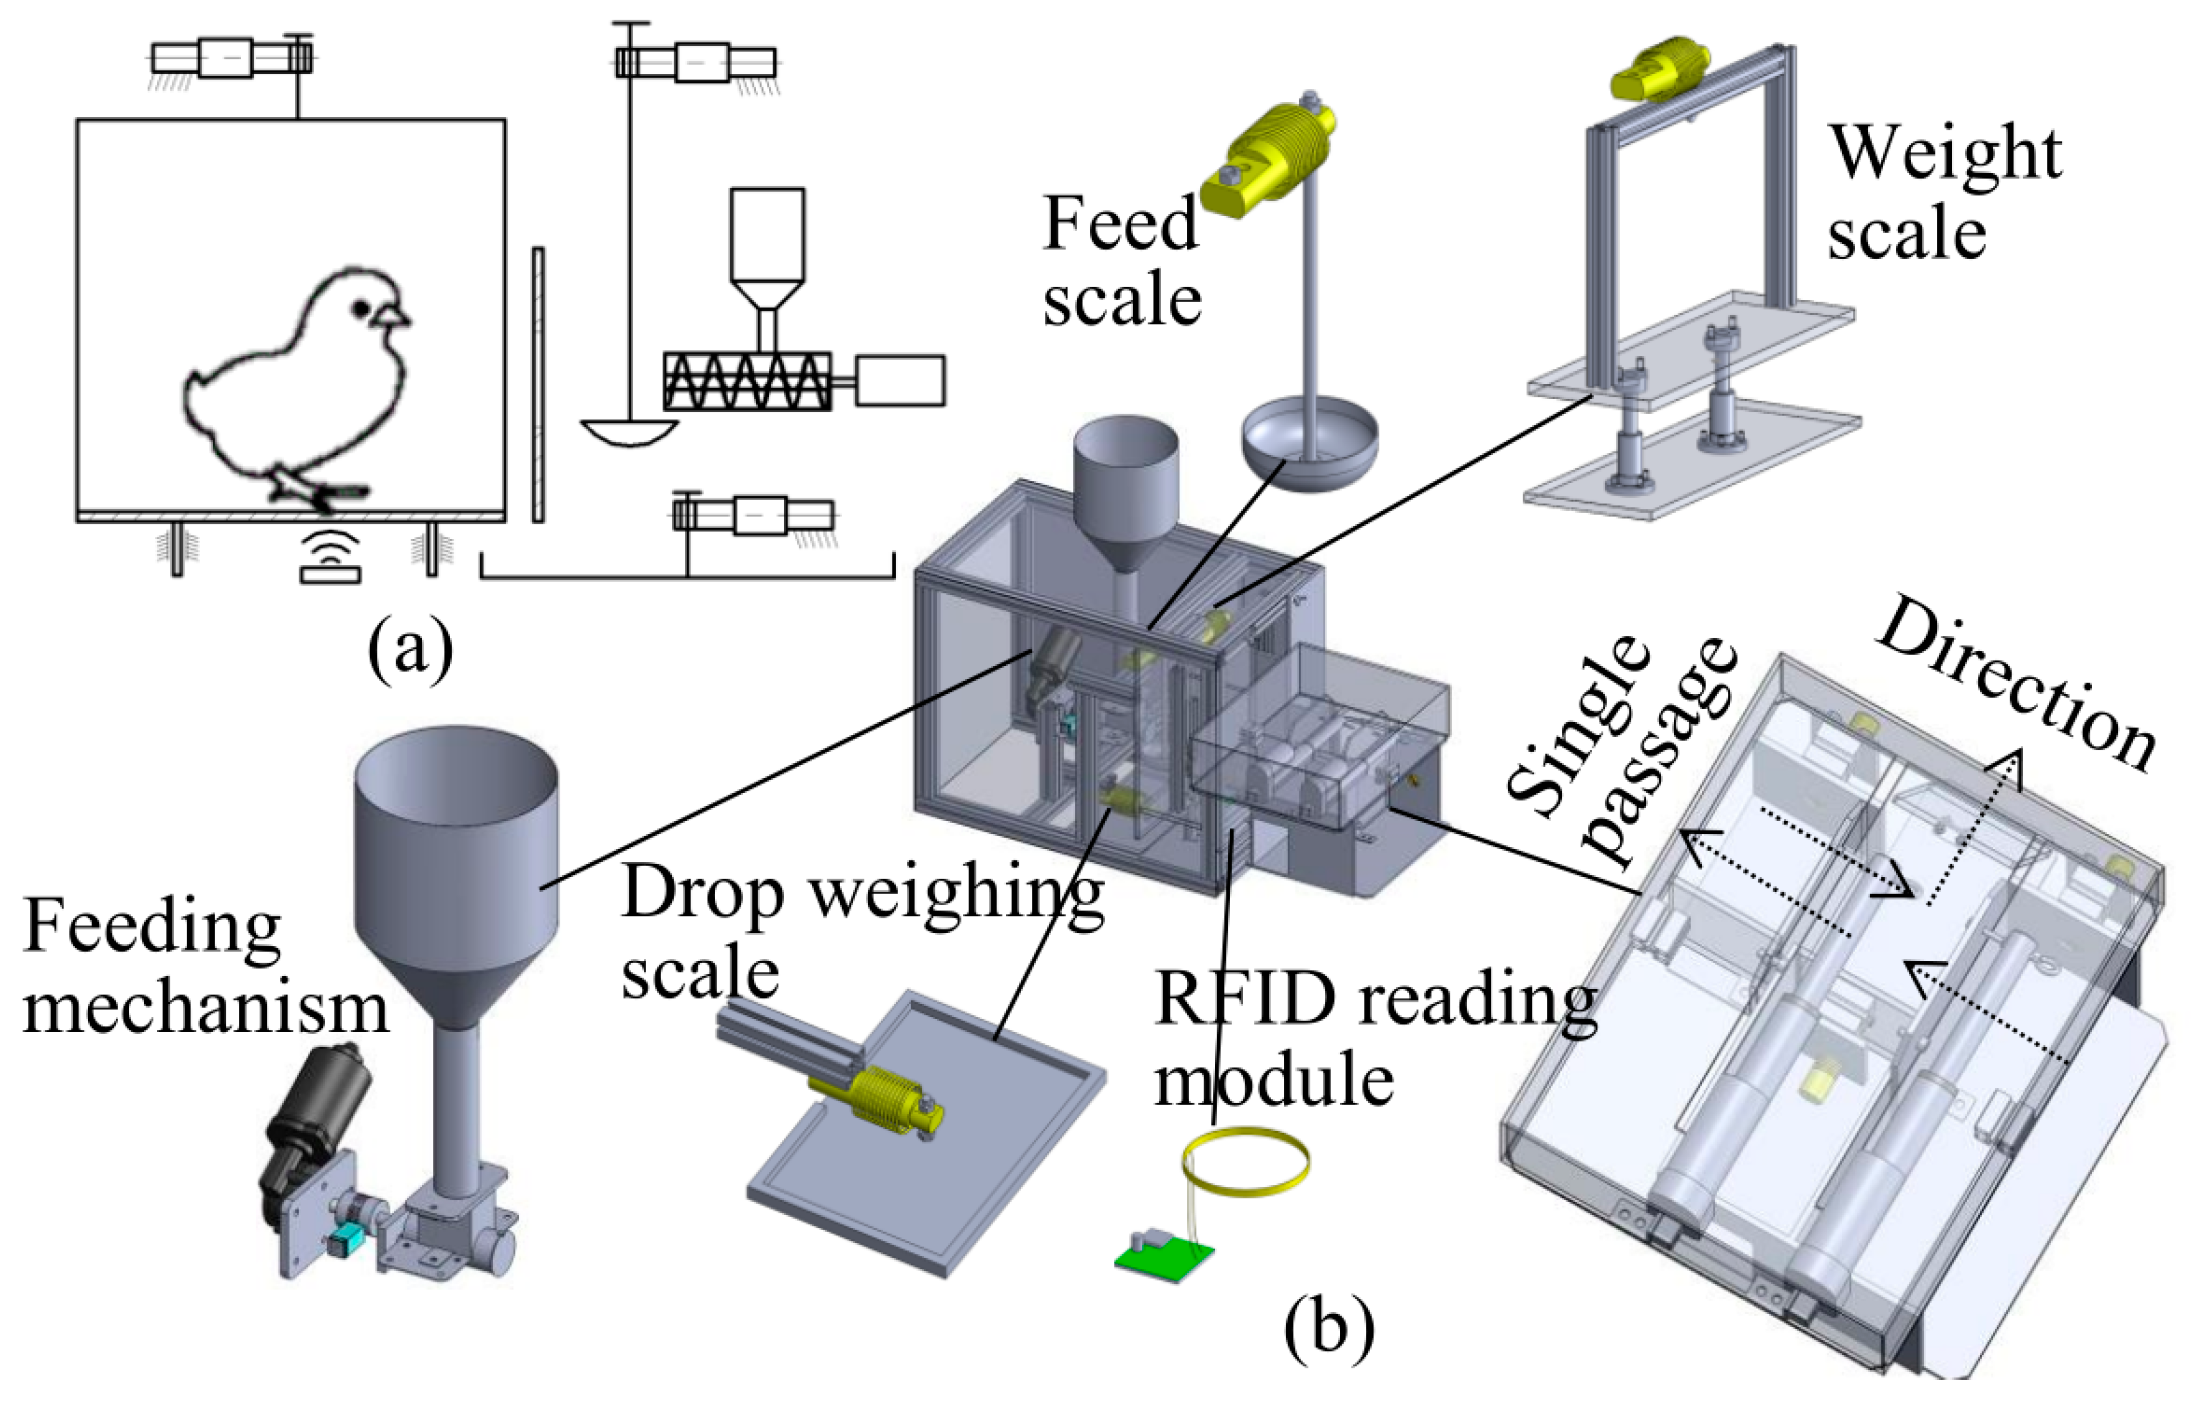
The feeder developed in this project was composed of an automatic feeding mechanism, RFID reading module, weight scale, feed scale, drop weighing scale, limit mechanism, and a microcontroller unit (MCU) controller. To avoid the influence of competition for food on the measurement, a passage that only allowed a single chicken to pass through was also placed in front of the feeder. The system is shown in
Figure 1 and
Figure 2.
The automatic feeding mechanism was driven by a direct current (DC) motor to extrude the feed. When the scale was idle, the feed was automatically replenished, so that the amount of feed in the feeding tray was kept at a fixed value (typically 30 g). At each feeding, there was enough feed in the tray to realize the free feeding of the chickens. The weight scale of the feeder was composed of a load cell (HSX5KG, Hangzhou, China), a moving guide mechanism, and a limit mechanism, which were used to measure the body weight. When the chicken was standing on the weight scale, the MCU controller took a weight value every 200 ms, and then a median mean filter was used. The feed scale and drop weighing scale of the feeder were composed of the same load cell (HSX5KG, Hangzhou, China). The feed amount was calculated by subtracting the average value of the feed scale after eating from the average value of the feed scale before eating. The drop amount was calculated by subtracting the average drop amount before eating from the average drop amount after eating. The actual feed intake was the difference between the feed amount and the drop amount. When feeding, the feeder read the RFID tag on the chicken’s feet through the RFID reading module (DW13, Shenzhen, China) under the weight scale to identify the feeding chicken; at the end, a set of data were formed by the MCU controller. The set of data included body weight, ID, feed amount, drop amount, feeding duration, feeding end time, etc. The data were sent to the HMI, and the feeding record table was generated on the HMI.
The single channel consisted of three compartments with partitions. Between each compartment was a sliding door made of transparent panels. This door was pushed and pulled by an electric push–pull cylinder (24 V, 90 mm/s, Zhongshan, China), with a photoelectric sensor (E3F-DS30C4, NPN, Wenzhou, China) installed on the wall of each compartment. When the chicken entered the corresponding compartment, it blocked the sensor in the compartment and triggered the sensor. Through the sequential opening and closing of the sliding door, the group-housed chickens were separated so that the young chickens could be fed individually.
2.3. Signal Acquisition and Processing
The signal transmission is shown in
Figure 3. The load sensor was connected to the amplification and filtering circuit, and after signal amplification, filtering, and noise reduction, it was directly connected to the analogue to digital converter (ADC) channel of the MCU (STM32f103, ARM). The MCU scanned every 200 ms and saved a weight value for each scan. The chicken identification number was read by the RFID electronic module and passed to the MCU by the USART. The body weight sequence was digitally filtered after feeding to obtain the body weight [
33]. The feed amount and drop amount were weighed statically. To study the effect of the amplification and filtering circuit, this project transmitted the weight data during feeding to the personal computer (PC) synchronously, to obtain the dynamic weighing sequence of body weight when feeding.
2.3.1. Signal Amplification and Analog Filtering
The load cell converted the weight signal of the object on the scale into a voltage signal. The load cell range used in this article was 5 kg, the voltage output range was 0–20 mv, and the 0–5 kg weight signal linearly corresponded to the 0–20 mv voltage signal. Due to the weak output voltage signal of the sensor and the existence of external interference [
34,
35], it was necessary to process the output signal of the load sensor. This paper used an analog circuit to amplify, filter, and reduce the noise of the voltage signal. As shown in
Figure 4, the analog circuit was divided into three main parts. The first part was a differential amplifier circuit, with the resistors R1 = R2 and R3 = R4 used to amplify the signal and suppress the in-phase signal. The second part was a second-order analog low-pass filter that mainly played the role of low-pass filtering [
36,
37]. The third part was an RC-τ-shaped filter; due to the resistance value and capacitance value being small in this part, it mainly played the role of noise reduction and current-limiting to protect the MCU.
The magnification of the first part was:
The magnification and transfer function of the second part were:
Combined with Equations (1)–(3), the transfer function of the signal amplification and filter circuit was:
In this equation, R5, R6, and R9 are resistances whose unit is Ω, and C1, C2, C3, and C4 are capacitances whose unit is F.
2.3.2. Median Mean Filter
Due to the swaying and shaking of the poultry on the scale when they were eating, some low-frequency interference signals were generated, which appeared to fluctuate around the real body weight. When the chicken entered or left the scale, an impact signal was also formed, making the weight signal unstable. Generally, unstable signals are significantly larger or smaller than the real signals. Nevertheless, since these low-frequency interferences were close to the frequency of the body weight signal, they were generally difficult for analog circuits to filter out. In digital filtering, an interference signal that is larger or smaller than the real signal can be removed by sorting and taking the median value. The median mean filter [
38] can be expressed by Equation (5), as follows:
where
x(i) is the sequence,
N is the sequence length and
p and
q are the proportion of the sequence length;
p =
q is the symmetric median mean filter,
p ≠
q is the asymmetric median mean filter, and SME is the sorting-based mass estimator.
2.4. Performance Evaluation
2.4.1. Coefficient
By using an object with a known weight and an error < 0.1 g, ranging from 50 to 1500 g, and placing it on the scale of the feeder at 50-g intervals, recording the weight (M) and the numerical (N), we calculated the body weight coefficient according to Equation (6). In the same way, using the known weight and error < 0.1 g, with a range of 0–100 g, we calculated the feed scale and the drop weight scale at 10 g intervals. The relationship between weight (M) and numerical (N) is:
where M is the weight in g; N is the numerical, ranging from 0 to 4095, with no unit; N
0 is the initial numerical; the initial weight is obtained by M
ref × N
0; and M
ref is the coefficient in g.
2.4.2. Static Error
Using a static object with a known weight and error < 0.1 g, the range 50–1500 g was taken as the real weight (mReal), and weighed with a scale of the feeder at intervals of 50 g. The value measured by the scale of the feeder was taken as the sample weight (m) to calculate the static mean and standard deviation of the scale of the feeder by means of Equations (7) and (8). The same method was used to calculate the static error of the feed scale and drop weighing scale. The known weight range was 0–100 g, with weight error < 0.1 g, and the static object was taken as the real weight (mReal), which was weighed by the feed scale and the drop weight scale at 10 g intervals. If the value was taken as the sample weight (m), then the mean and standard deviation of the feed scale and the drop weighing scale were calculated by Equations (7) and (8).
2.4.3. Dynamic Error
The chicken was placed on the electronic balance (MT301, ±0.1 g, Shenzhen Mobil Electronics Co., Ltd., Shenzhen, China) as shown in
Figure 5a. We read the balance until it was stable, repeating 10 times, and took the average value as the chicken’s weight (m
Real). The chickens were then driven to the weight scale of the feeder, where they could eat normally, as shown in
Figure 5. The MCU scanned every 200 ms and saved a weight value for each scan. After the chicken left the weight scale, the weight sequence was formed. The MCU performed median mean filtering on the weight sequence according to Equation (5), to calculate the weight of the chickens fed this time, and used this weight as the sample weight (m). We sampled chickens and individuals multiple times at different growth stages, and calculated the dynamic error of the weight scale using Equations (7) and (8).
where
μ is the average deviation; σ is the standard deviation; m
Real is the real weight in g; m is the sample weight in g; and n is the number of repeated tests.
2.5. Live Trials
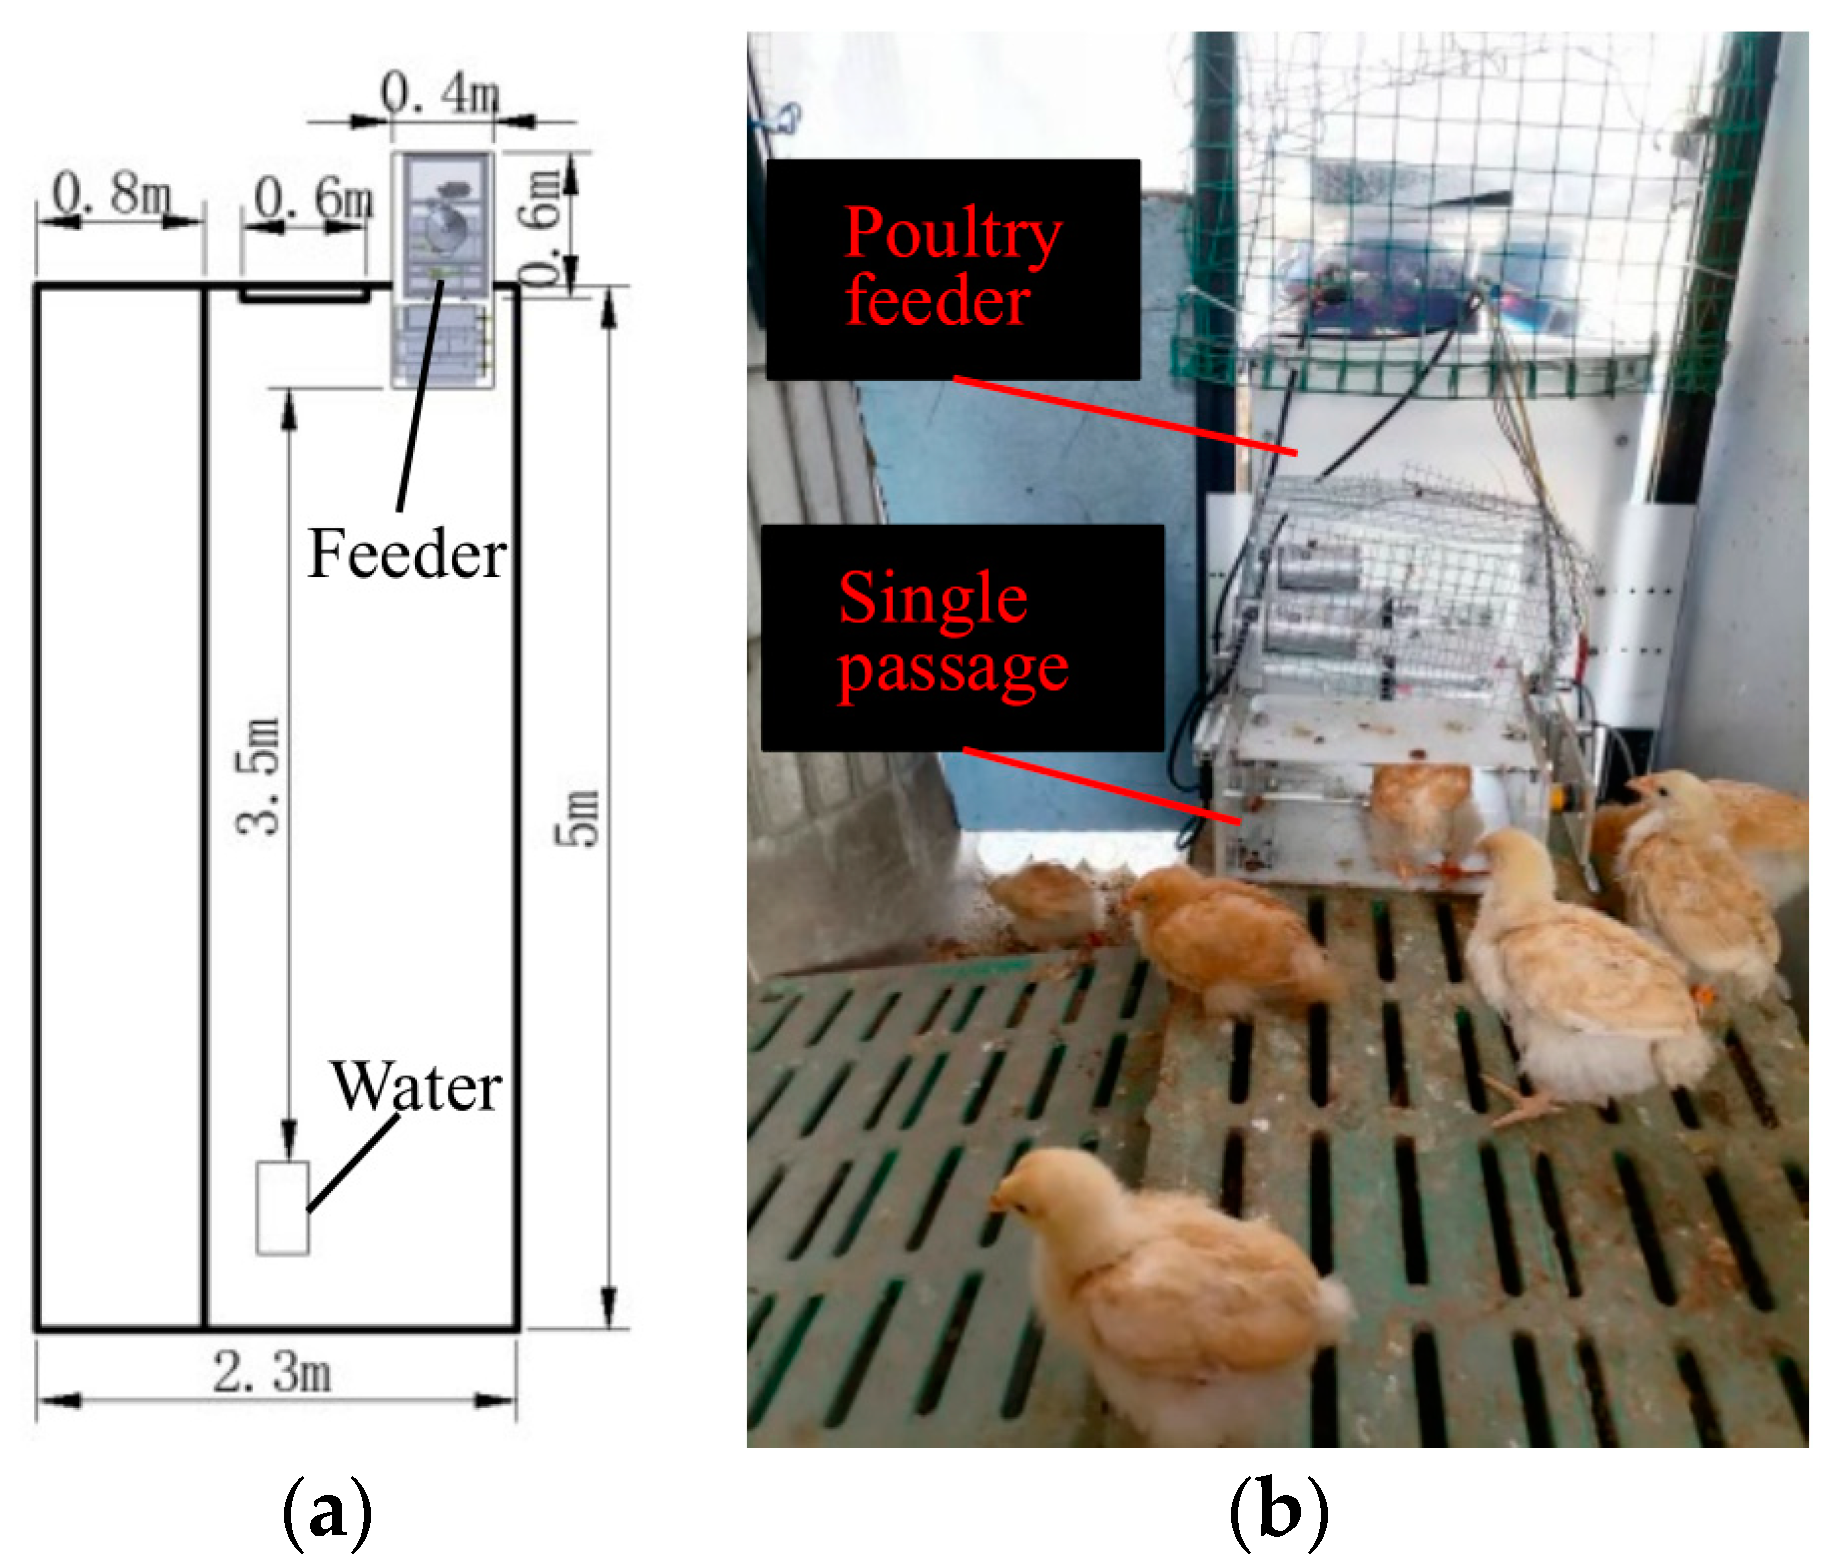
In the chicken house, we placed the feeder system and single passage developed in this project far away from the water tray to encourage the chickens to stay away from the feeder after eating, so that the chickens that had not eaten would be more likely to eat. There was a platform with a height of 0.6 m in the chicken house, and the chickens could move freely around the chicken house. The layout of the chicken house is shown in
Figure 6. The feeder automatically replenished the feed when the weighing scale was idle so that the amount of feed (typically 30 g) in the feed tray was sufficient for one intake per chicken. The feeder outside the house was replenished once every three days, to try to not to interfere with the behavior of the chickens, and the feeding behavior was automatically recorded by the system.
4. Discussion
In this study, we found that, due to the low accuracy of the dynamic weighing of poultry, the impact of feed drop on the actual feed intake, and the competition between young birds creating errors in the measured value, there are some differences in the measurement of body weight changes and feeding behavior of young chickens. To improve the dynamic weighing accuracy of poultry, we used circuits to amplify, filter, and denoise the weight signal, and then performed digital filtering through the median mean filter. We achieved a static weighing accuracy of 0.82 g and a dynamic weighing accuracy of 2.164 g, while the feed scale and drop scale accuracy were 0.108 g and 0.259 g, respectively. The system developed in this project added a drop weighing scale for the amount of feed dropped and calculated the actual intake of each feed by establishing the difference between the feed consumption and the amount of feed dropped. To solve the problem of crowding by multiple chicks introducing errors into the measured value, we developed a single passage that only allows a single chick to pass through, to realize single feeding and accurately measure the body weight changes and feeding behavior of the chicks. As a result of the experiment, the feeding behavior of chickens, as well as their body weight change, was analyzed. Young chickens grow at a rate of about 8.88 g/day, and the FCR is about 4.4, with a body weight range from 208 g to 280 g, which proved that this system, paired with a single passage, can accurately monitor the body weight changes and feeding behavior of young chickens. We also concluded that dynamic weighing is required to improve the accuracy of live poultry weighing.
Chicks leave one weight measurement each time they eat, so body weight data on the chicks can be collected multiple times in one day. Abnormal data can easily be excluded from the distribution range of the multiple body weight data of the day. As shown in
Figure 12, data that are much smaller than the weight range of the day can be considered abnormal, and it can be concluded that the young chicken is not completely standing on the weight scale, so an accurate weight change rule can be obtained. In terms of the actual feed intake of young chickens, as shown in
Figure 13, although there may be some fluctuations in the daily consumption, the actual daily feed intake changes are small. When food is abundant, the young chickens will rummage in the feed, and the drop amount will increase. The feed scale and drop weighing scale in this study only measure the weight when the chicken is not eating, which can be described as static weighing. Although the feed intake of young chickens is small, it also makes the feed scale and the range of the drop weighing scale small, which is conducive to the improvement of weighing accuracy, so even if a small amount of intake and drop can be obtained when the young chickens are eating, this can allow us to calculate the accurate actual intake.
When comparing dynamic weighing with static weighing, as shown in
Figure 7, the results show that there is a significant difference between static weighing and dynamic weighing. After circuit amplification, analog filtering, and noise reduction of static weighing, when the signal reaches stability, its signal fluctuation is small, the high-frequency interference is greatly suppressed, the signal-to-noise ratio is significantly improved, and the accurate weight can be obtained. However, the swaying and shaking of poultry on the scales produce some disturbances. It is difficult to obtain accurate weights of chickens when they are eating by means of static weighing. Moreover, because such disturbances are close to the frequency of the weight signal, the analog circuit generally struggles to filter them out. It can also be concluded that the interference source of static weighing is related to the weighing system itself, and the interference source of dynamic weighing is mainly from living activities. For the weighing of static objects, the weighing signal generally fluctuates only at the moment when the static object is placed on the scale, while the signal in dynamic weighing is unstable throughout the whole weighing process. As shown in
Figure 8, when the chick is eating, its weight fluctuation range can reach 56%; therefore, to improve the accuracy of live weighing, digital filtering is required. In preliminary experiments, it was found that even if a high-precision electronic scale was used to weigh live poultry, and the chicken stayed calm and did not move, balance readings also fluctuated; the larger the chicken, the greater the fluctuation of the electronic balance. On the other hand, when a load sensor with large static weighing error collected data at 5 Hz and then performed digital filtering in the median mean, the obtained poultry weight was not significantly different from the body weight data manually read out using a high-precision electronic balance.
Combining the results of different researchers, it can be concluded that there are differences in the feeding behavior of different breeds of poultry at different ages. In this study, our calculation of the FCR (4.4) of yellow broilers was larger than that of Tu for turkeys (2.57) [
26], which may be due to the difference in breed. An adult turkey is three to four times larger than a domestic chicken, while a yellow broiler is a slightly smaller domestic chicken, and its growth rate is lower than that of the turkey. Our FCR (4.4) is also greater than the result of Yan, who also calculated the FCR of yellow broilers (2.6–3.7) [
27], most likely due to the age difference. In their study, the initial weight of the chicken was 1774.23 g, while our initial weight was only 208 g. The experimental results are consistent with the actual situation. In the experiment, it was observed that the chick with the largest feed intake grew the fastest, but its FCR was relatively high. This may be because when the feed exceeds a certain amount, it cannot grow into meat, but is excreted in feces.
In this study, we showed for the first time the automated monitoring of body weight change and feeding behavior in group-housed chicks. We also directly measured the amount of feed falling to the ground during each feeding using a high-precision weighing scale, thereby avoiding the error caused by estimating the actual feed intake. We also developed a single passage that only allows a single chick to feed, avoiding the failure of feeding data measurement caused by multiple chicks crowding onto the scale when competing for food.
Our research subjects were yellow broilers weighing between 105 and 500 g, and the sample size was only 10 young chickens. Two died over the course of the experiments, so the density was smaller than intended: 10.6 per feeder [
25,
27]. Moreover, we found that there were instances of chickens lying in the feeder after having a feed, which had some impact on the measurements. In the next step, we will research expelling and frightening methods when young chickens lie in a feeder.


 ,
, 


