Author Contributions
Conceptualization, X.Y. and C.W.; methodology, X.Y.; software, X.Y.; validation, X.Y., C.W. and H.J.; formal analysis, C.W.; investigation, H.J.; resources, H.J.; data curation, C.W.; writing—original draft preparation, C.W.; writing—review and editing, C.W.; visualization, X.Y.; supervision, H.J.; project administration, X.Y.; funding acquisition, H.J. All authors have read and agreed to the published version of the manuscript.
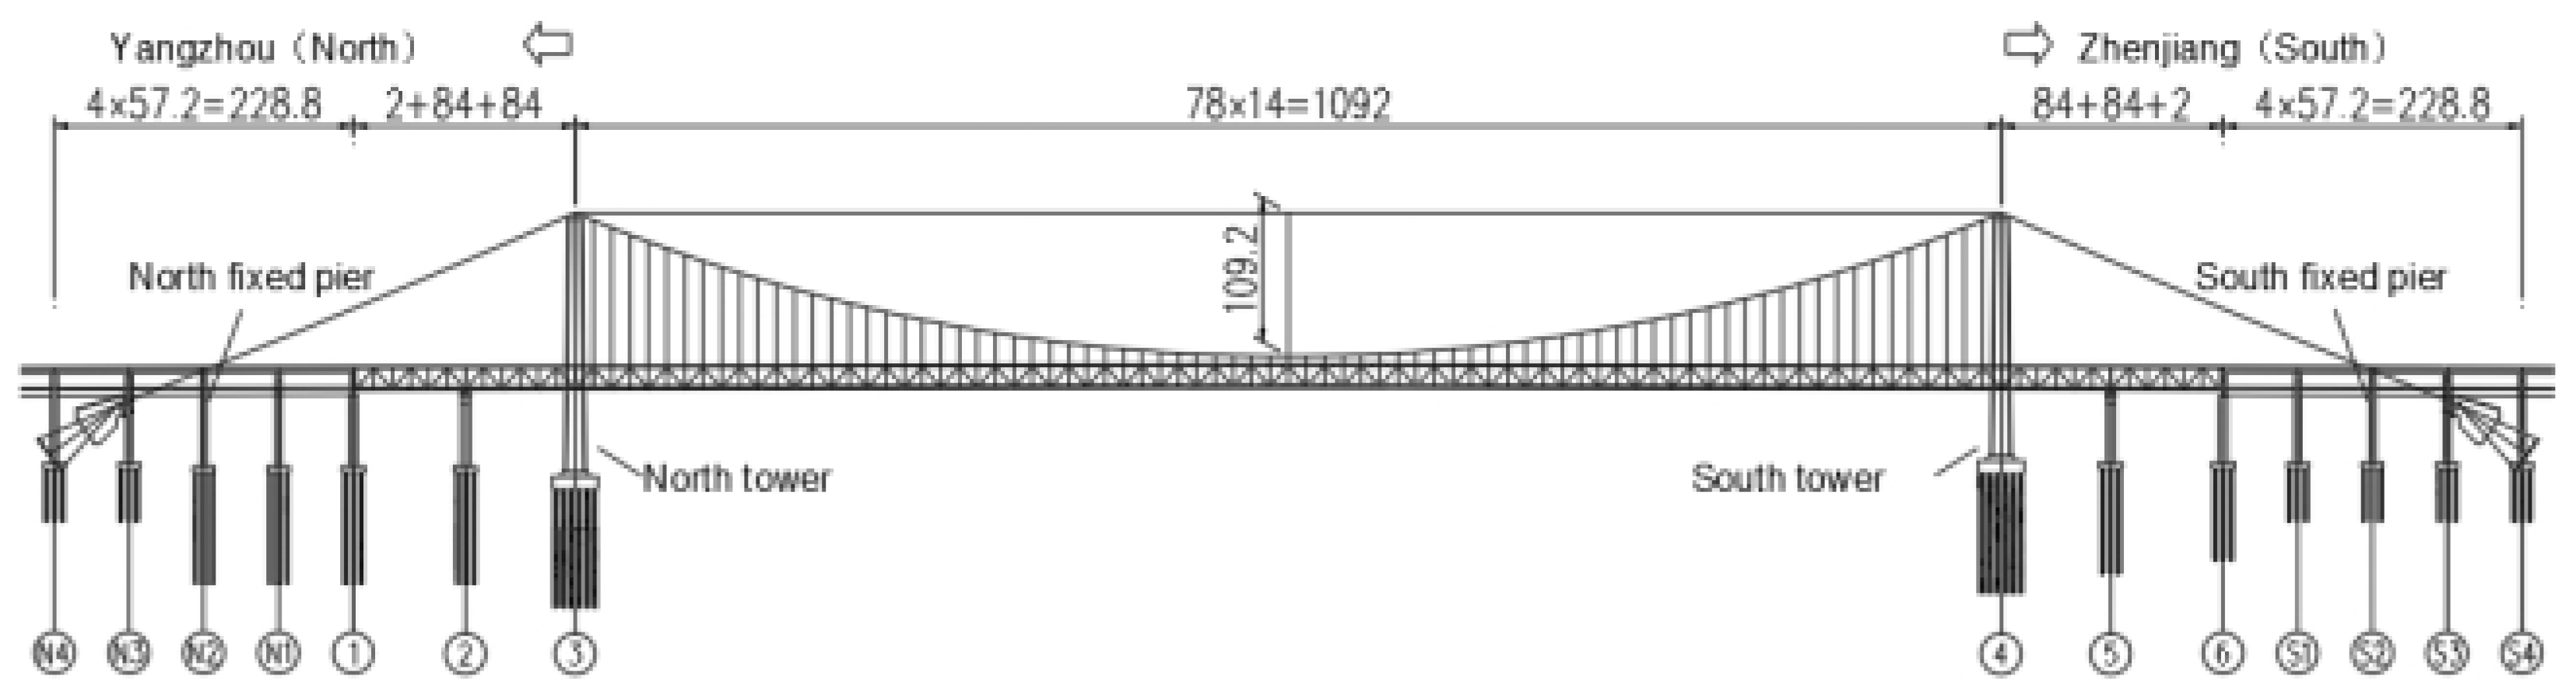
Figure 1.
Elevation layout.
Figure 1.
Elevation layout.
Figure 2.
Cross section of stiffener beam.
Figure 2.
Cross section of stiffener beam.
Figure 3.
Analytical model of beam–rail system.
Figure 3.
Analytical model of beam–rail system.
Figure 4.
Full bridge finite element model.
Figure 4.
Full bridge finite element model.
Figure 5.
Type III sleeper resistance curve.
Figure 5.
Type III sleeper resistance curve.
Figure 6.
Rail initial stress.
Figure 6.
Rail initial stress.
Figure 7.
Curve of power amplification factor β.
Figure 7.
Curve of power amplification factor β.
Figure 8.
Corrected response spectrum for railway Class II Sites.
Figure 8.
Corrected response spectrum for railway Class II Sites.
Figure 9.
Earthquake acceleration time history.
Figure 9.
Earthquake acceleration time history.
Figure 10.
Rail stress at different apparent wave velocities.
Figure 10.
Rail stress at different apparent wave velocities.
Figure 11.
Time-history curve of rail stress at point A under different apparent wave velocities.
Figure 11.
Time-history curve of rail stress at point A under different apparent wave velocities.
Figure 12.
Time-history curve of beam–rail relative displacement at point A under different apparent wave velocities.
Figure 12.
Time-history curve of beam–rail relative displacement at point A under different apparent wave velocities.
Figure 13.
The stress–time-history curve of the rail at point A and point D when the apparent wave velocity is 200 m/s.
Figure 13.
The stress–time-history curve of the rail at point A and point D when the apparent wave velocity is 200 m/s.
Figure 14.
The stress–time-history curve of the rail at point A and point D when the apparent wave velocity is 500 m/s.
Figure 14.
The stress–time-history curve of the rail at point A and point D when the apparent wave velocity is 500 m/s.
Figure 15.
The stress–time-history curve of the rail at point A and point D when the apparent wave velocity is 4000 m/s.
Figure 15.
The stress–time-history curve of the rail at point A and point D when the apparent wave velocity is 4000 m/s.
Figure 16.
The stress–time-history curve of the rail at point A and point D when the apparent wave velocity is 8000 m/s.
Figure 16.
The stress–time-history curve of the rail at point A and point D when the apparent wave velocity is 8000 m/s.
Figure 17.
Stress–time-history curves of rails at points A and D under consistent excitation.
Figure 17.
Stress–time-history curves of rails at points A and D under consistent excitation.
Figure 18.
Comparison of curves before and after adjustment.
Figure 18.
Comparison of curves before and after adjustment.
Figure 19.
Longitudinal displacement of beam end at different apparent wave velocities.
Figure 19.
Longitudinal displacement of beam end at different apparent wave velocities.
Figure 20.
Time course of main bridge end displacement at different visual wave speeds.
Figure 20.
Time course of main bridge end displacement at different visual wave speeds.
Figure 21.
Comparison of stress–time-history curve at point A and displacement time history curve at point A.
Figure 21.
Comparison of stress–time-history curve at point A and displacement time history curve at point A.
Figure 22.
The absolute maximum value of shear force at different apparent wave speeds.
Figure 22.
The absolute maximum value of shear force at different apparent wave speeds.
Figure 23.
The absolute maximum value of the bending moment at different apparent wave velocities.
Figure 23.
The absolute maximum value of the bending moment at different apparent wave velocities.
Figure 24.
Comparison of time-history curves of internal force at the bottom of 3# main tower when apparent wave velocity is 200 m/s.
Figure 24.
Comparison of time-history curves of internal force at the bottom of 3# main tower when apparent wave velocity is 200 m/s.
Figure 25.
Comparison of time-history curves of internal force at the bottom of 3# main tower when apparent wave velocity is 8000 m/s.
Figure 25.
Comparison of time-history curves of internal force at the bottom of 3# main tower when apparent wave velocity is 8000 m/s.
Figure 26.
Comparison of time-history curves of internal force at the bottom of 3# main tower under consistent incentives.
Figure 26.
Comparison of time-history curves of internal force at the bottom of 3# main tower under consistent incentives.
Table 1.
The values of the resistance parameters of the ballast bed.
Table 1.
The values of the resistance parameters of the ballast bed.
| Direction of Constraint | | | | | | |
| Resistance | Figure 5 | | | | | |
| Figure legend | ![Applsci 12 12368 i001]() | The constraint direction is the direction specified by the overall coordinate axis
X: Bridge longitudinal
Y: Vertical
Z: Bridge Transverse |
Table 2.
Comparison of main cable Internal force and sling Internal force results.
Table 2.
Comparison of main cable Internal force and sling Internal force results.
| Modeling Software | Internal Force of the Main Cable (kN) | Internal Force of the Sling (kN) |
|---|
| MAX | MIN | MAX | MIN |
|---|
| Midas Civil | 712,100 | 657,100 | 5643 | 2004 |
| ANSYS | 714,618 | 659,450 | 5875 | 1785 |
| Percentage of difference | 0.35% | 0.36% | 4.11% | −10.93% |
Table 3.
Natural frequency of the structure.
Table 3.
Natural frequency of the structure.
| Mode Order | Natural Frequency (Hz) | Natural Period (s) | Mode Shape Description |
|---|
| 1 | 0.073 | 13.629 | Symmetrical transverse bending of main truss |
| 2 | 0.152 | 6.591 | Antisymmetric side bending of main girders |
| 3 | 0.159 | 6.291 | Symmetrical vertical bending of main truss |
| 4 | 0.161 | 6.195 | Antisymmetric vertical bending of main girders |
| 5 | 0.207 | 4.836 | Main girder torsion and main girder positive symmetrical side bending |
| 6 | 0.256 | 3.907 | Symmetric side bending of main cable and main girder |
| 7 | 0.266 | 3.761 | Main girder torsion |
| 8 | 0.276 | 3.617 | Symmetrical vertical bending of main truss |
| 9 | 0.294 | 3.405 | Main girder torsion and main girder antisymmetric side bending |
| 10 | 0.297 | 3.367 | Main cable side bending |
| 11 | 0.314 | 3.183 | Main cable side bending |
| 12 | 0.323 | 3.101 | Main cable side bending |
| 13 | 0.325 | 3.072 | Antisymmetric side bending between main cable and main girder |
| 14 | 0.369 | 2.712 | Symmetric side bending of main cable and main girder |
| 15 | 0.385 | 2.597 | Longitudinal floating and antisymmetric vertical bending of main truss |
| 16 | 0.413 | 2.421 | Main cable side bending and main girder torsion (side movement of bridge tower) |
| 17 | 0.413 | 2.420 | Antisymmetric side bending between main cable and main girder |
| 18 | 0.422 | 2.369 | Main girder torsion |
| 19 | 0.447 | 2.239 | Longitudinal floating of main truss and antisymmetric vertical bending (side movement of bridge tower) |
| 20 | 0.470 | 2.127 | Main cable yaw |
Table 4.
Rail stress at different apparent wave velocities.
Table 4.
Rail stress at different apparent wave velocities.
| Apparent Wave Speed (m/s) | Stress of Rail at Point A (MPa) | Stress of Rail at Point B (MPa) | Stress of Rail at Point C (MPa) | Stress of Rail at Point D (MPa) | Main Bridge Span Mid-Rail Stress (MPa) |
|---|
| MAX | MIN | MAX | MIN | MAX | MIN | MAX | MIN | MAX | MIN |
|---|
| 200 | 206.5 | −197.1 | 34.8 | −33.3 | 37.5 | −46.3 | 202.2 | −189.9 | 50.6 | −49.6 |
| 500 | 163.7 | −150.1 | 36.0 | −36.4 | 39.6 | −36.4 | 151.0 | −130.0 | 51.8 | −50.6 |
| 1000 | 146.3 | −140.1 | 38.2 | −38.0 | 45.2 | −35.2 | 136.8 | −110.7 | 40.9 | −39.2 |
| 2000 | 132.8 | −130.4 | 35.3 | −34.8 | 39.8 | −37.1 | 128.0 | −109.5 | 29.8 | −25.4 |
| 000 | 125.8 | −128.2 | 35.9 | −38.2 | 35.8 | −34.7 | 143.2 | −107.3 | 16.0 | −12.7 |
| 8000 | 120.1 | −128.0 | 53.4 | −37.5 | 39.8 | −49.5 | 127.9 | −111.3 | 9.4 | −5.2 |
| 115.6 | −127.9 | 52.9 | −38.9 | 41.9 | −53.1 | 128.1 | −115.4 | 3.8 | −0.3 |
Table 5.
Numerical value of PPMCC.
Table 5.
Numerical value of PPMCC.
| Apparent Wave Speed | 200 m/s | 500 m/s | 1000 m/s | 2000 m/s | 4000 m/s | 8000 m/s | |
| PPMCC | 0.75 | 0.74 | 0.72 | 0.76 | 0.78 | 0.79 | 0.80 |
Table 6.
The moment when the maximum stress occurs at points A and D.
Table 6.
The moment when the maximum stress occurs at points A and D.
| Apparent Wave Speed (m/s) | The Moment When the Maximum Tensile Stress Occurs at Point A (s) | The Moment When the Maximum Tensile Stress Occurs at Point D (s) | Interval Time (s) | The Moment when the Maximum Compressive Stress Occurs at Point D (s) |
|---|
| 200 | 7.52 | 16.94 | 9.42 | 22.08 |
| 500 | 9.02 | 13.14 | 4.12 | 16.26 |
| 1000 | 8.94 | 11.4 | 2.46 | 4.52 |
| 2000 | 8.9 | 10.52 | 1.62 | 6.38 |
| 4000 | 8.82 | 9.92 | 1.1 | 3.02 |
| 8000 | 8.8 | 5 | _ | 4.76 |
| 8.8 | 4.76 | _ | 8.8 |
Table 7.
Longitudinal displacement of beam end at different apparent wave velocities.
Table 7.
Longitudinal displacement of beam end at different apparent wave velocities.
| Apparent Wave Speed (m/s) | Longitudinal Displacement of the Approach Bridge at Point A (mm) | Longitudinal Displacement of Main Bridge at Point B (mm) | Longitudinal Displacement of Main Bridge at Point C (mm) | Longitudinal Displacement of the Approach Bridge at Point D (mm) |
|---|
| MAX | MIN | MAX | MIN | MAX | MIN | MAX | MIN |
|---|
| 200 | 109 | −100 | 366 | −463 | 564 | −418 | 92 | −105 |
| 500 | 74 | −61 | 168 | −223 | 269 | −234 | 44 | −60 |
| 1000 | 56 | −51 | 146 | −171 | 122 | −104 | 33 | −49 |
| 2000 | 46 | −45 | 106 | −127 | 60 | −38 | 32 | −43 |
| 4000 | 42 | −43 | 67 | −93 | 48 | −61 | 32 | −54 |
| 8000 | 38 | −43 | 72 | −86 | 73 | −63 | 33 | −43 |
| 36 | −43 | 71 | −81 | 85 | −69 | 35 | −43 |
Table 8.
Time for each position to reach the maximum positive longitudinal displacement at different apparent wave velocities.
Table 8.
Time for each position to reach the maximum positive longitudinal displacement at different apparent wave velocities.
| Apparent Wave Speed (m/s) | The Moment When Point A Reaches the Maximum Positive Longitudinal Displacement (s) | The Moment When Point B Reaches the Maximum Positive Longitudinal Displacement (s) | The Moment When Point C Reaches the Maximum Positive Longitudinal Displacement (s) | The Moment When Point D Reaches the Maximum Positive Longitudinal Displacement (s) |
|---|
| 200 | 7.52 | 39.24 | 18.52 | 22.08 |
| 500 | 9.04 | 12.14 | 13.88 | 16.26 |
| 1000 | 8.94 | 9.28 | 19.66 | 4.52 |
| 2000 | 8.9 | 7.76 | 19.58 | 6.38 |
| 4000 | 8.82 | 3.56 | 3.5 | 3.02 |
| 8000 | 8.8 | 3.48 | 3.32 | 9.02 |
| 8.8 | 3.12 | 3.12 | 8.8 |
Table 9.
Numerical value of PPMCC of displacement and stress at point A.
Table 9.
Numerical value of PPMCC of displacement and stress at point A.
| Apparent Wave Speed | 200 m/s | 500 m/s | 1000 m/s | 2000 m/s | 4000 m/s | 8000 m/s | |
| PPMCC | 0.76 | 0.72 | 0.74 | 0.78 | 0.81 | 0.81 | 0.82 |
Table 10.
Absolute maximum of internal force at the bottom of 3# main tower at different visual wave speeds.
Table 10.
Absolute maximum of internal force at the bottom of 3# main tower at different visual wave speeds.
| Apparent Wave Speed (m/s) | Time (s) | Absolute Maximum Value of Shear Force (kN) | Time (s) | Absolute Maximum Value of Bending Moment (kN·m) |
|---|
| 200 | 9.94 | 37,658 | 21.52 | 2,571,377 |
| 500 | 6.02 | 24,596 | 21.78 | 1,540,600 |
| 1000 | 5.08 | 43,257 | 24.72 | 1,673,810 |
| 2000 | 4.90 | 48,575 | 8.12 | 2,146,168 |
| 4000 | 4.74 | 40,321 | 4.76 | 1,752,818 |
| 8000 | 4.68 | 41,705 | 4.72 | 1,866,733 |
| 4.62 | 43,313 | 4.66 | 1,965,863 |
Table 11.
Numerical value of PPMCC of bending moment and shear force.
Table 11.
Numerical value of PPMCC of bending moment and shear force.
| Apparent Wave Speed | 200 m/s | 500 m/s | 1000 m/s | 2000 m/s | 4000 m/s | 8000 m/s | |
| PPMCC | 0.34 | 0.41 | 0.65 | 0.83 | 0.88 | 0.88 | 0.88 |


