Abstract
This paper reports an in situ measurement on the effects of a tunnel and its ventilation modes on the aerodynamic drag of a subway train with eight carriages during its routine operation. The train speed (V) varied continually from 0 to 22 m/s. Two modes of tunnel ventilation were examined, i.e., recirculation and free-cooling modes. The former mode is associated with pumping cooled air into the tunnel to provide extra cooling, while the latter is not. The friction coefficient Cf of the train surface was estimated using two hotwire probes mounted on the roof of the first and last carriages, respectively. The front- and rear-stagnation pressures (Pf and Pl) were measured using two pressure taps located at the center of the forward surface of the first carriage and the backward surface of the last carriage, respectively. It has been found that the presence of a tunnel significantly increases both Cf and Pf. For example, at V = 20.5 m/s, Cf and Pf were 30.2% and 24.5% higher, respectively, in the tunnel than their counterparts in open air. The tunnel ventilation mode also has remarkable effects on Cf. The recirculation mode resulted in 23.5% higher Cf than the free-cooling mode. On the other hand, the tunnel ventilation mode does not seem to have an appreciable effect on Pf. The physics behind these observations is also discussed.
1. Introduction
During recent decades, rapid developments have been made in railway transport, e.g., high-speed trains and metropolis subways, because trains play an increasingly important role in modern transportation [1]. The train aerodynamic problems have recently received a great deal of attention due to the speed up of the train system [2]. Apparently, trains differ in aerodynamics from other vehicles because of their large length-to-width ratio and blockage in a tunnel.
The aerodynamic drag on a train mainly consists of pressure drag (Dp) and skin friction drag (Df), resulting from pressure differences between the forward and backward ends of the train and the wall shear stress (τw) on its surfaces, respectively. Df is in general much larger than Dp. Vardy’s estimate indicated a ratio of Df/Dp ≈ 5.5 [3,4]. Gawthorpe [5] suggested that Dp and Df accounted for about 14% and 70%, respectively, of the total aerodynamic drag of a high-speed streamlined train. The remaining aerodynamic drag is related to roof equipment and gaps between carriages.
Dp may be estimated from the pressure distributions on both forward and backward ends of a train. Mackrodt et al. [6] observed little dependence of Dp on the shape of a train head without sharp edges. Zhang and Liang [7] measured the pressure distribution on a full-scale non-streamlined train head and found that the pressure drops almost to zero at the edge of the forward surface. As such, the averaged pressure on the forward surface was linearly related to the front stagnation pressure (Pf). They further noted that the pressure magnitude on the forward surface was much larger than that on the backward surface, implying that Dp could be estimated from the pressure on the forward surface. Schetz ascribed this observation to the very large length-to-width ratio of a train, pointing out that the tail end was completely immersed in the thick boundary layer developing along the train [2].
The direct measurement of τw is more challenging than Dp. The boundary layer over a train develops; it is highly three-dimensional with an increasing thickness along the train [8]. The τw can be determined from the mean velocity profile based on a Clauser chart, which assumes a logarithmic mean velocity distribution in the boundary layer [9]. Brockie and Baker [10] measured the velocity distribution in the boundary layer on a 1:75 scale train model using hot film anemometry. Their estimated τw based on a Clauser chart gave a local wall friction coefficient Cf (, where ρ is density of air) of 0.0039. The measurement of the velocity distribution on a full-scale train during routine operation is more difficult. Using a Preston tube [11,12], which is essentially a Pitot tube placed on the wall facing the flow, Brokie and Baker [10] measured Cf for a full-scale passenger train and obtained a Cf range of 0.002~0.004. It is worth mentioning that Cf may vary remarkably depending on the train surface conditions and the gaps between carriages. Schetz [2] summarized the reported Cf, suggesting a range of 0.001~0.006. However, Vardy and Reinke [13] suggested that Cf could reach 0.01 for a freight train with irregularly arranged carriages.
The present railway system involves more and more tunnels for various reasons, such as environmental considerations, scarcity of free flat space in urban areas and the desire for straighter tracks for high-speed operation [1,2]. Aerodynamic drag on a train in a tunnel can significantly exceed its counterpart in open air. Consequently, a train in a tunnel requires much more power and incurs more traction energy consumption than in the open air. The tunnel effects on the aerodynamic drag on a train depend primarily on the ratio of the cross-sectional area of the train to that of the tunnel, i.e., the blockage ratio (R), the lengths of the tunnel and the train, and the presence of air shafts. Gaillard [14] suggested that Df rose in a tunnel, compared to that in the open air, by a factor of 1 + 2.21 R for a high-speed train with V > 34.7 m/s (≈125 km/hr). Sockel [8] found that this factor decreased with an increasing train length and was almost independent of the train speed for R ≈ 0.1~0.2. However, Vardy [3,4] cautioned that the tunnel effects might not be conclusively determined because many factors could contribute to the drag on a train in the tunnel.
Most previous investigations of the tunnel effects on the aerodynamic drag were performed for high-speed trains, since aerodynamic drag on a train is approximately proportional to the square of train speed (V) and accounts for 75~80% of its total resistance for V = 250~300 km/h [5]. Most of these studies focused on the pressure waves induced by a high-speed train when it passes through a tunnel [15], which may deteriorate the comfort of passengers and cause additional load on the tunnel and its appurtenances, e.g., catenary system, cables, etc.
Due to an increase in the subway train speeds and a large blockage ratio, the aerodynamic issues of the tunnels in subway systems attracted more and more attention [16,17,18]. A number of investigations, including field test, moving model experiments and numerical simulations, have been conducted on the pressure load on platform screen doors (PSDs) imposed by passing subway trains [17,18,19]. This aerodynamic load is crucial for their structural design and proper operation. In view of an increasing concern of energy consumption, there is an emerging need to improve our understanding of aerodynamic drag on low-speed trains, as foreseen by the management of the Mass Transit Railway (MTR) Co. (Hong Kong, China) Limited. For example, the annual fuel cost of MTR well exceeds one billion dollars (HKD). Even one percent fuel saving implies an operation cost reduction of more than HKD 10 million.
The data of low-speed trains are scarce in the literature. This paper reports the in situ measurement of the aerodynamic drag on a full-scale low-speed subway train with eight carriages during its routine operation. Both τw and Dp are estimated based on measurements inside a tunnel and in open air. Two issues are addressed: (1) the effects of a tunnel on the aerodynamic drag of a low-train train; and (2) the effects of the tunnel ventilation mode on the aerodynamic drag. Two tunnel ventilation modes were examined, i.e., the free-cooling mode and the recirculation mode. In the recirculation mode cooled air is pumped into the tunnel through the ventilation shafts at all stations to provide extra cooling effects, while in the free-cooling mode no cooled air is pumped into the tunnel and the tunnel ventilation is mainly provided by the piston effect induced by the train movement. The physics behind the observations is also discussed.
2. Measurement Details
Measurements were conducted in the Tsuen Wan (TSW) to Central (CEN) line of MTR during its routine operation. The TSW–CEN line has a total distance of 14.6 km, including 16 stops. About 1.1 km of this line is exposed to open air and the remainder is in tunnels. The tested train consisted of eight carriages, with five powered and three unpowered. The two kinds of carriages were identical except for a pantograph on the roof of each powered carriage. The length and cross-sectional areas of the carriages were 22.85 m and 9.9 m2, respectively. The cross-sectional area of the tunnel varied along the line, resulting in R = 0.4~0.8. Two return test trips were made from TSW to CEN, with tunnel ventilation operated at recirculation and free-cooling mode, respectively. It is worth mentioning that the test was conducted during the routine operation of TSW to CEN line, with the possibility that other trains were running in the tunnel either in front of or behind the test train. Besides, the train might accelerate or decelerate frequently during its trips. Thus, it is impossible to keep the working conditions of the two test trips exactly the same. In the present paper, we only focus on the statistical results, rather than those at specific times, to uncover the possible effects of the tunnel and its ventilation modes on the aerodynamic forces on the test train. Measurements were performed to document the variation in τw and Dp inside and outside the tunnel, or between different ventilation modes since the work aims to evaluate the effects of the tunnel and ventilation modes on the aerodynamic drag of the train, not to determine it accurately.
2.1. Measurement of τw
With the no-slip boundary condition imposed, τw on a smooth surface is given by
where η is the viscosity of air, u is the longitudinal velocity and y is the coordinate normal to the train surface. This relation was used by Bai et al. [20] to measure the velocity gradient and hence τw on an flat plate with hot-wire measured data. Given wholly submerged in the viscous sublayer, a rough surface could be considered as aerodynamically smooth [21]. The viscous sublayer on the tested train was estimated to have a thickness exceeding 0.54 mm (the details of the estimate will be given later), which is sufficiently thick to have the train roof roughness immersed. Therefore, Equation (1) is presently applicable.
Before the in-suit experiments, both hotwires were calibrated using a wind tunnel in the Hong Kong Polytechnic University. See Huang et al. [22] for more details of the tunnel. The calibration was performed at wind speed ranges from 0 m/s to 30 m/s, which sufficiently covers the maximum train speed in routine operation. The two calibrated hotwires (Dantec model 55P71) were mounted, as shown in Figure 1, on the roof of the first carriage, about 15 m downstream of the forward face, and the tail carriage, about 10 m upstream of the backward face, respectively. The boundary layer, where the two hotwires were mounted, was fully turbulent even at V = 1 m/s. The gap (Δy) between the hotwire and the roof surface was set to 0.41 mm by adjusting the screws in the mounting block (Figure 1). This gap was smaller than the viscous sublayer thickness. For a turbulent boundary layer, the velocity gradient in the viscous sublayer is almost constant [23]. The velocity gradient can be expressed as , where u is the velocity measured using hotwire within the viscous sublayer. Therefore, τw is determined by
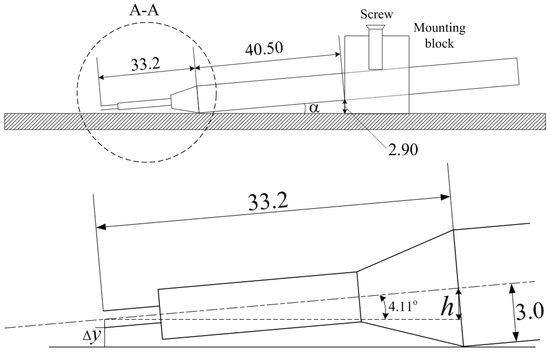
Figure 1.
Installation of the hot-wire probe on train roof (all length dimensions are in mm).
The uncertainty in u was estimated to be within ±4%. The gap Δy between the hotwire and wall was adjusted and measured using the mounting facility shown in Figure 1. The related dimensions, e.g., probe diameter, probe length and height of the block, were measured in the laboratory with an experimental uncertainty of no more than ±2%. Thus, the uncertainty in Δy should be smaller than ±5%. Thus, the uncertainty in was estimated to be within ±9%.
2.2. Measurement of Pf and Pl
The forward and backward surfaces of the tested train were quite flat, implying approximately a linear relationship between the averaged pressure and the stagnation pressure [7]. Two pressure tabs were mounted at the geometrical centers of the forward and backward surfaces, respectively, to measure forward- and backward-stagnation pressures (Pf and Pl). The pressure tabs were connected to pressure transducers (SMP131 Leeg Co., Shanghai, China) with a rubber tube of 3.5 mm inner diameter. The measurement range of the transducers was 2 KPa with an accuracy of 0.5% FS. Pf and Pl were measured with the atmospheric pressure (P0) as the reference. Thus, the uncertainty for the mean stagnation pressure was estimated to be ±5%.
Since the wind temperature may differ between the two ventilation modes and also between the conditions inside and outside the tunnels, one thermocouple was mounted on the train surface to monitor the temperature variation. The thermocouple signal was processed by the build-in function of the Dantec Streamline Hotwire Anemometer. The signal of the train speed was also recorded for validation. There were two data acquisition systems located in the first and last carriages, respectively, as shown in Figure 2. The measurements were conducted when this train ran from TSW to CEN during its routine operation. Two return trips were made for the two different tunnel ventilation modes, respectively. In each test, all signals were offset and low-pass filtered at a cut-off frequency of 1 kHz, and then sampled at a frequency of 2 kHz using two identical 16-bit A/D converters. The two data acquisition systems were synchronized to record all signals simultaneously for each test. The sampling duration for each test was 2000 sec (≈33 min), covering the entire trip from TSW to CEN.
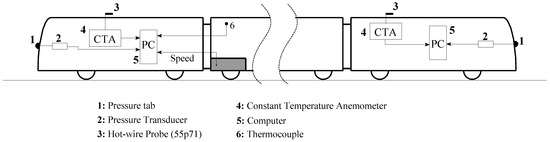
Figure 2.
Schematic of the instrumented train.
3. Measurement Results
Figure 3 illustrates the time histories of the signals obtained under the recirculation ventilation mode. The time histories of the signals under the free-cooling mode are qualitatively similar to Figure 3, thus not presented. Since there are 16 stations along the TSW–CEN line, V varies greatly during the trip. Mounted within the viscous sublayer, the hotwire measured velocity u is always smaller than the corresponding V. As expected, both Pf and u exhibit reasonable correlation with V.
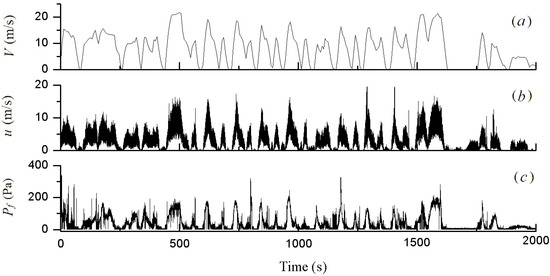
Figure 3.
Time histories of measured data: (a) train speed (V), (b) the longitudinal velocity (u) measured by the hotwire mounted on the first carriage, (c) the forward stagnation pressure (Pf).
3.1. Effects of Tunnel Ventilation Modes on the Temperature
Figure 4 compares the time histories of the temperature measured by the thermocouple in the two ventilation modes. The mean temperatures inside the tunnel for recirculation and free-cooling modes were 29.05 °C and 29.80 °C, respectively. A higher temperature is expected in the free-cooling mode when no cooled air is pumped into the tunnel and heat generated by running trains raises the temperature in the tunnel. During measurements, the test train ran first in the recirculation mode of the tunnel and then in the free-cooling ventilation mode for only about 1 h. Therefore, the temperature rise in the free-cooling mode was only 0.75 °C, compared with the recirculation mode.
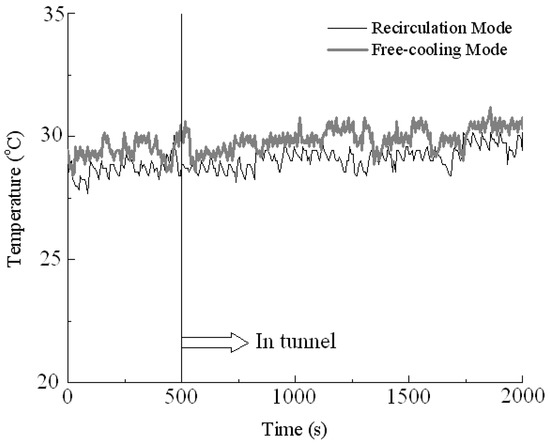
Figure 4.
Time histories of thermocouple measured temperature in the two ventilation modes.
The air density ρ is related to its temperature by
where p is the mean pressure inside the tunnel, T is the mean temperature in Kelvin and J/kg·°K is the specific gas constant. Since the train speed is relatively low, p is considered to be a constant. A 0.75 °C increase in temperature in the free-cooling mode produces a 0.26% decrease in ρ, compared with that in the recirculation mode. On the other hand, η is also related to temperature from Sutherland’s formula [24]:
where T0 = 288.15 °K is a reference temperature, and η0 = 1.78 × 10⁻⁵ kg/(m.s) is the reference viscosity at T0. C is Sutherland’s constant, which is 120 for dry air. Based on Equation (4), a 0.75 °C increase in temperature in the free-cooling mode causes a 0.22% increase in η, compared with that in the recirculation mode. It may be inferred that the effects of tunnel ventilation modes on temperature and subsequently on ρ and η are limited, thus not considered in the following discussions.
3.2. Train Speed Distribution
As illustrated in Figure 3a, V varies greatly during the entire trip. V = 0 m/s in Figure 3a corresponds to the stops of the train in the stations. The aerodynamic drag, D, on a train depends on V, and is proportional to V with a power of slightly less than two [2]. The energy consumption caused by D is the product of D and the distance the train travels. The distance a train travels in a given time is also proportional to V. Therefore, the power consumption caused by aerodynamic drag is approximately proportional to V3. It is then interesting to examine the probability density functions, PDF (t) and PDF (V3·t), of t and V3·t at various train speeds, where t is time. PDF (t) and PDF (V3·t) are shown in Figure 5 for the two ventilation modes. The maximum speed (Vmax) in the two ventilation modes is the same, i.e., Vmax ≈ 22 m/s = 79.2 km/h, which accounts for less than 2% of the entire trip. The most likely or representative train speed is about 11.5 m/s (=41.4 km/h), which accounts for 10% and 8% in time of the entire trip for the recirculation and free-cooling modes, respectively (Figure 5a). The contribution to the total power consumption at the representative V (=11.5 m/s) is only around 8% and 6% in the recirculation and free-cooling modes, respectively (Figure 5b). On the other hand, although the higher V of 20.5 m/s accounts for only 3.9% of total time, its contribution to the total power consumption reaches about 17% (Figure 5b), irrespective of the ventilation modes. This observation indicates a necessity to examine a representative higher train speed as well as the most likely train speed. As such, two selected train speeds, i.e., the most likely train speed V = 11.5 m/s and the representative high train speed V = 20.5 m/s, are chosen as examples to analyze the effects of tunnel and ventilation modes on τw and Dp.
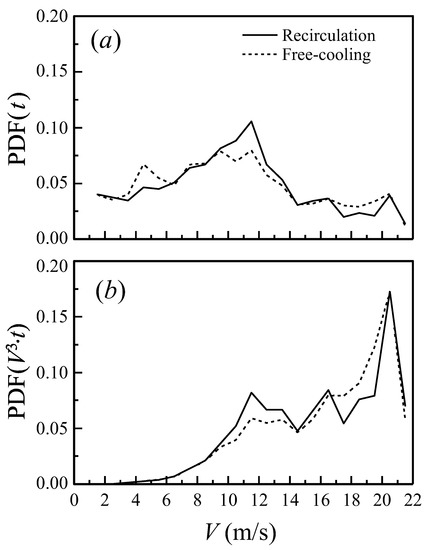
Figure 5.
Probability density functions PDF of (a) t and (b) V3·t at various train speed V.
3.3. Measured τw
Since Equation (2) will be used to evaluate τw, it is necessary to confirm that the hotwire was submerged within the viscous sublayer. Since Cf ranges from 0.002~0.004 for most passenger trains [10], the Cf was chosen to be 0.003 for present estimation of wall shear stress. The wall shear stress at V = 11.5 m/s may be estimated by (N/m2). Substitute τw into following equations,
where uτ is the wall fiction velocity, ν is kinematic viscosity of air, and λ is the wall unit. We may obtain λ ≈ 36.11 × 10⁻³ mm. Since the boundary layer over the test train is fully turbulent, the viscous sublayer thickness is about 15λ [25], i.e., 0.54 mm. Therefore, the hotwire, mounted 0.41 mm away from the train roof surface (Section 2.1), was submerged within the viscous sublayer, thus providing a validation for the use of Equation (2) to estimate τw. Note that since the thickness of the viscous sublayer depends on the train speed, τw may be underestimated based on Equation (2), if this thickness is smaller than 0.41 mm. However, this underestimate is expected to be about the same for different ventilation modes or inside and outside the tunnel, and therefore should not affect the qualitative comparison for τw between different circumstances.
Figure 6 presents the instantaneous wall shear stress on the first carriage, τwf, calculated from Equation (2), for the recirculation mode. The dependence on V of the instantaneous wall stress on the last carriage, τwl, was qualitatively similar to that of τwf, thus not presented. The second order polynomial curve fit (solid curve) for the data obtained using the least square method is also presented to facilitate data interpretation. Apparently, τwf increases rapidly with V, and its trend, as indicated by the fitting curve, is consistent with the fact that the aerodynamic drag is approximately proportional to V2 [2].
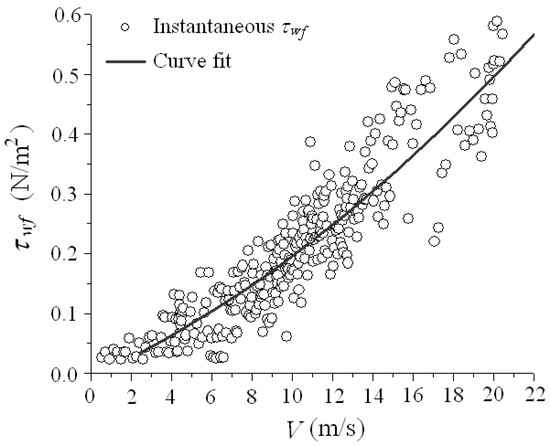
Figure 6.
Instantaneous τwf measured on the first carriage and the second order polynomial curve fit in the recirculation mode.
The fitting curves of τwf and τwl, along with their average τwa (), are presented in Figure 7 for the recirculation mode. The measured τwl is slightly higher than τwf. For example, at V = 11.5 m/s, τwl exceeds τwf by approximately 13%. A similar observation is made for the free-cooling mode, as will be shown later. It is well known that τw on a flat plate immersed in a turbulent boundary layer decreases with increasing distance from the leading edge [26] because of the growing thickness of the boundary layer or viscous sublayer. The present observation may be ascribed to the tunnel blockage and the gap, about 0.9 m, between two adjacent carriages, which altered the boundary layer development along the train. There are seven gaps between the first and last carriages, which interrupt the growth of the boundary layer and viscous sublayer. As a matter of fact, a gap generates additional turbulence in flow surrounding the surfaces of the train. As such, the sublayer thickness on the last carriage may shrink [27,28], resulting in larger τwl than τwf. The result suggests that the boundary layer over the presently tested train surface differs from that over a continuous flat plate. The results of τwf, τwl and τwa for the free-cooling mode are presented in Figure 8. The difference between τwf and τwl is reduced, compared with the recirculation mode; for example, τwl exceeds τwf by only approximately 8% at V = 11.5 m/s.
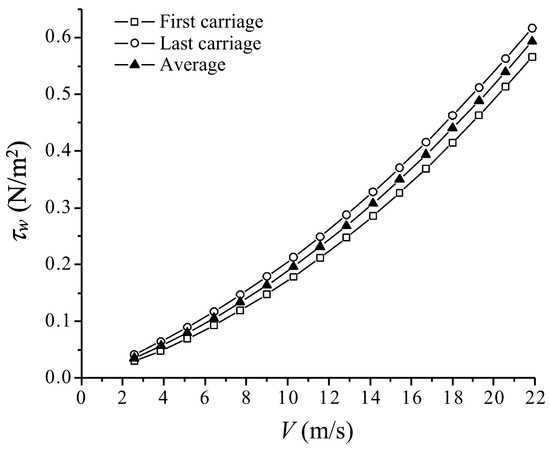
Figure 7.
Dependence on the train speed V of the wall shear stresses τwf measured on the first carriage, τwl on the last carriage and their average τwa in the recirculation mode.
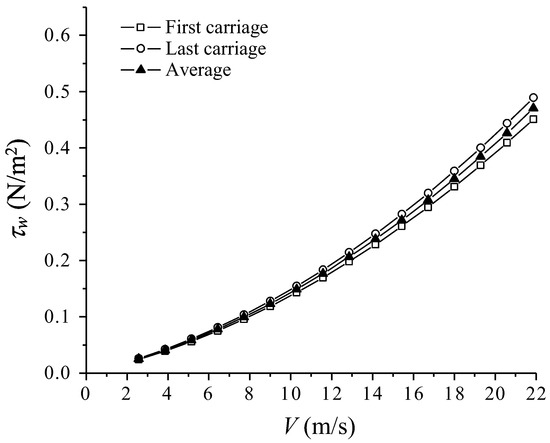
Figure 8.
Dependence on the train speed V of the wall shear stresses τwf measured on the first carriage, τwl on the last carriage and their average τwa in the free-cooling mode.
At V = 11.5 m/s, τwa = 0.23 N/m2 and 0.19 N/m2 for the recirculation and free-cooling modes, respectively. The corresponding Cf = 0.0027 and 0.0022, lying in the range of 0.002~0.004 reported by [10] for a full-scale train. This agreement provides a validation for the present in situ measurements. In following discussion, τwa is considered as a representative averaged shear stress for the whole train. The effects of tunnel and tunnel ventilation modes on τwa will be discussed in Section 4.
3.4. Measurement Results of Pf and Pl
Figure 9 presents the instantaneous stagnation pressures on the forward and backward surfaces of the train, Pf and Pl, measured in the recirculation mode. The second order polynomial curve fit to the data is also given. The data in the free-cooling mode appear similar to those shown in Figure 9, thus not shown. The measured instantaneous Pf displays a considerable scatter. For example, at V = 11.5 m/s, the measured Pf ranges from 15 Pa to 110 Pa. This scattering is not unexpected since the train stopped, accelerated and decelerated frequently during the trip, resulting in a large fluctuation in V (Figure 3a). At a given V, acceleration gives rise to a bigger Pf, whereas deceleration corresponds to a smaller Pf, owing to the inertia of the surrounding air. Furthermore, the cross-sectional area of the tunnel is not the same along the line; a higher R corresponds to a larger Pf at a given V.
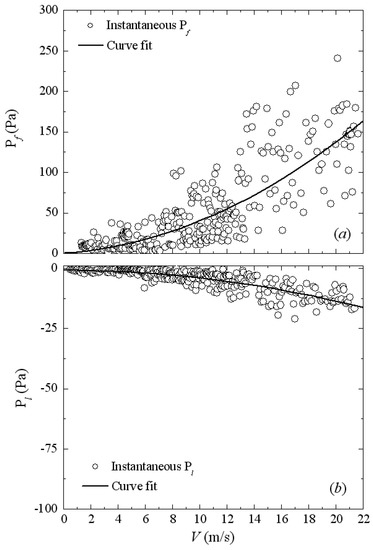
Figure 9.
Instantaneous stagnation pressure and the corresponding second order polynomial curve fit in the recirculation mode: (a) the forward stagnation pressure of the first carriage, Pf; (b) the backward stagnation pressure of the last carriage, Pl.
The magnitude of Pl is only approximately 1/10 of Pf. Zhang and Liang [7] measured the pressure distribution on a full-scale high-speed train with six carriages with the length-to-height ratio of 52.4 at V = 50 m/s (180 km/hr). They observed that Pf was 44 times higher than Pl, suggesting that Dp was largely determined by Pf. The smaller magnitude of Pl on the tail end was ascribed to the large length-to-height ratio of the train. If the length-to-height ratio is large, 55.2 for the present train, the tail end of the train is completely immersed in the turbulent boundary layer over the train, yielding a small magnitude of Pl [2].
4. Discussion
4.1. Effects of Tunnel and Tunnel Ventilation Modes on τwa
Figure 10 compares τwa inside the tunnel with that in the open air for both recirculation and free-cooling modes. The maximum V in the open air was about 15 m/s; thus, the measured τwa in the open air is only available below this speed. The second order curve fit to the data in the open air is extrapolated to V = 22 m/s for comparison, as shown by the dashed line. The presence of the tunnel increases τwa, especially at a higher V. At V = 11.5m/s, τwa in the tunnel exceeds that in the open air by 13.3% and 53.3% for the free-cooling and recirculation modes, respectively, and by 30.2% and 62.0%, respectively, at V = 20.5 m/s. Gaillard [14] suggested for a high-speed train at V ≈ 70 m/s (250 km/h) that the presence of the tunnel increases the wall shear stress by a factor of 1 + 2.21R. If we take R = 0.6, the averaged blockage ratio along the present tunnel, the corresponding increase in τwa should be 133%. An extrapolation of the data in Figure 9 to V = 70 m/s (not shown here) predicts the increase in τwa by about 118% and 179% for the free-cooling and recirculation modes, respectively, which agrees with Gaillard’s formula.
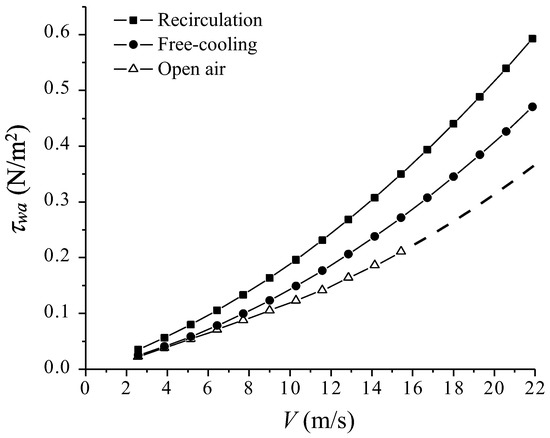
Figure 10.
Averaged wall shear stress τwa in the two ventilation modes and in the open air.
Interestingly, the tunnel ventilation mode also has a remarkable effect on τwa. The τwa in the recirculation mode is significantly larger than that in the free-cooling mode; for example, the former exceeds the latter by 35.2% and 27% at V = 11.5 m/s and 20.5 m/s, respectively. Several previous investigations on a fully developed turbulent boundary layer [27,28,29] unveiled that the wall shear stress grew with the increasing free-stream turbulence intensity Ti (, where urms is the root mean square value of the fluctuating streamwise velocity and U∞ is free-stream velocity). This observation is linked to the fact that the increased turbulence intensity promotes lateral momentum transport, and the random fluctuation carries more fast-moving fluid from the outer layers into the near wall region, thus increasing the velocity gradient at the wall. Blair (1983) pointed out that a 6% increase in the nominal turbulence intensity resulted in as much as a 20% increase in the wall shear stress, compared to that in smooth flow. In the present measurement, Ti in the tunnel at the recirculation mode was obviously higher than in the free-cooling mode, because the lateral injection of cooled air enhanced flow disturbance inside the tunnel. Therefore, the increase in τwa in the recirculation mode (Figure 10) is essentially caused by the enhanced Ti inside the tunnel.
Figure 11 presents the dependence of the friction coefficient Cf on V in the two ventilation modes and the open air. The data in the open air are extrapolated to V = 22 m/s, as indicated by the dashed line. For the range of V examined, Cf falls in the range of 0.001 to 0.006, as proposed by Schetz [2]. In all cases, Cf drops with increasing V and approaches gradually its asymptotic value. The observation is qualitatively similar to the well-known skin friction law for an incompressible turbulent boundary layer. Compared with the open-air case, Cf in the tunnel increases by 30.2 % and 66.2 % at V = 11.5 m/s and 27.9% and 76.5% at V = 20.5 m/s for the free-cooling and recirculation modes, respectively. Note that the difference in Cf between the free-cooling mode and the open air shrinks with decreasing V, down to approximately zero at V ≤ 5 m/s. That is, the tunnel effect on Cf completely vanishes at low V if no additional turbulence is introduced. On the other hand, the recirculation mode, which introduces additional turbulence, has a considerable effect on Cf even at low V. The measured Cf for the three cases is extrapolated to a higher V until reaching a constant, and the asymptotic Cf is 0.0013, 0.0017 and 0.0021 in the open air, free-cooling mode and recirculation mode, respectively. Therefore, the presence of the tunnel in the free-cooling mode causes a 30.8% increase in Cf, compared to that in the open air. Cf will be further increased by 23.5% if changing the free-cooling mode to the recirculation mode.
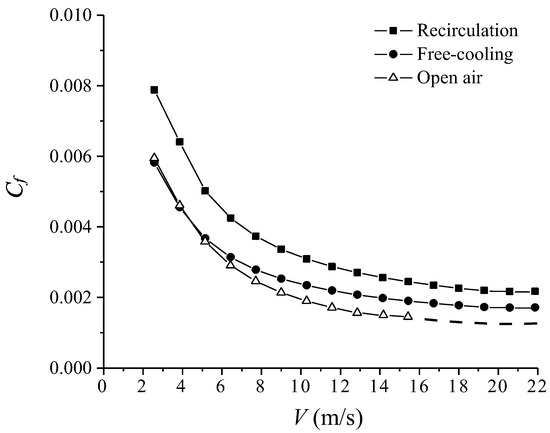
Figure 11.
Friction drag coefficient Cf in the two ventilation modes and in the open air.
4.2. Effects of Tunnel and Tunnel Ventilation Modes on Pf
The effects on Pf of the tunnel and the tunnel ventilation modes are presented in Figure 12. As expected, the presence of the tunnel increases Pf, especially at higher V. However, the tunnel effect on Pf is less remarkable than that on τwa; for instance, the presence of the tunnel, operated in the free-cooling mode, increases Pf and τwa by 24.5% (Figure 12) and 30.2% (Figure 10), respectively, at V = 20.5 m/s.
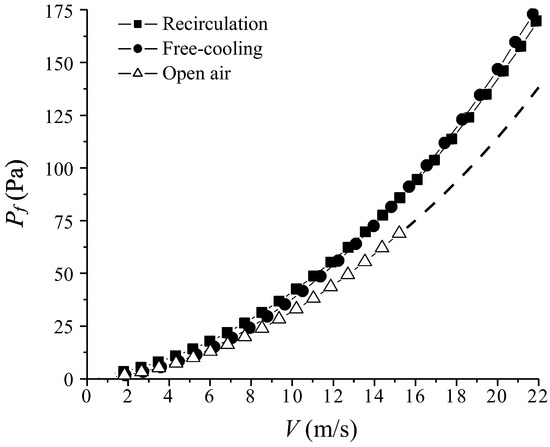
Figure 12.
The forward stagnation pressure Pf of the first carriage in the two ventilation modes and in the open air.
The tunnel ventilation mode appears to have a negligible effect on Pf, relative to its effects on τwa (Figure 10 and Figure 12), suggesting that Ti inside the tunnel has a minor effect on Pf. Based on Bernoulli’s principle, , that is, Pf on a bluff body depends only on the oncoming flow velocity, rather than Ti. The result conforms to the finding by [30], who measured the pressure distribution on a circular cylinder at Re = 1.8 × 10⁴ and observed no change in the forward stagnation pressure with Ti varying from 0.56% to 25%. The effect of the ventilation mode on Pl is also negligibly small (not presented). Therefore, the tunnel ventilation mode, or the turbulence intensity in the tunnel, has an insignificant effect on the form drag on the train.
5. Conclusions
The effects of the tunnel and also tunnel ventilation modes on the aerodynamic drag of a subway train of eight carriages at a relatively low speed are investigated. In situ measurements were conducted during a routine operation to estimate the surface shear stress, using a hotwire, and the pressure difference between the forward surface of the first carriage and the backward surface of the last carriage. Two tunnel ventilation modes were examined, i.e., the recirculation and the free-cooling modes. The following conclusions may be drawn based on the investigation:
(1) The measured wall shear stress or the skin friction coefficient agrees with previous reports in terms of its value and dependence on the train speed, thus providing a validation for the present measurement. The magnitude of the stagnation pressure on the forward surface of the first carriage is about 10 times that on the backward surface of the tail carriage. As such, the pressure drag (Dp) on the train is largely determined by the pressure on its forward surface;
(2) It has been found that the presence of the tunnel increases considerably both τwa and Pf on the train even at low speeds. The tunnel effect is more appreciable on τwa than on Pf; and at a train speed V = 20.5 m/s the presence of the tunnel operated in the free-cooling mode increases τwa by 30.2% and Pf by 24.5%;
(3) The tunnel ventilation mode has an appreciable effect on τwa, but not on Pf. In the recirculation mode, the injection of cooled air raises the turbulence intensity inside the tunnel, thus resulting in an increase in the velocity gradient at the surface and hence a higher τwa. The effect of the ventilation mode on τwa is enhanced with increasing V. The increase in τwa, compared with the free-cooling mode, owing to the recirculation ventilation mode is negligibly small at a small V, but reaches 27% at V = 20.5 m/s;
(4) The friction coefficient Cf decreases with increasing V and reaches an asymptotic value of 0.0013, 0.0017 and 0.0021 in the open air, free-cooling and recirculation modes, respectively. Cf in the free-cooling and recirculation modes augments, compared with that in the open air, by 30.4% and 66.2% at V =11.5 m/s and by 27.9% and 76.5% at V = 20.5 m/s, respectively. The effect of the tunnel on Cf shrinks with decreasing V in the free-cooling mode, effectively vanishing at V = 2–6 m/s; this effect is however still appreciable in the recirculation mode even at V < 6 m/s.
Author Contributions
Conceptualization, Y.Z.; Methodology, H.W., Y.Z. and J.H.; Data curation, G.L.; Writing—original draft, H.W.; Writing—review & editing, Y.Z., H.T., J.D. and M.M.A.; Supervision, Y.Z.; Funding acquisition, Y.Z., H.T. and J.D. All authors have read and agreed to the published version of the manuscript.
Funding
Y.Z. wishes to acknowledge support given to him from CRRC Qingdao Sifang Co., Ltd. through contract SF/JS-徐字-2021-239.
Institutional Review Board Statement
Not applicable.
Informed Consent Statement
Not applicable.
Data Availability Statement
Data is contained within the article.
Acknowledgments
This work was completed when authors worked at The Hong Kong Polytechnic University and would be impossible without the support, through Train Service Engineering Manager Ir Ronald Cheng, of MTR Corporation Limited in Hong Kong, which not only funded the project but also provided all facilities essential for the measurements.
Conflicts of Interest
The authors declare that they have no known competing financial interests or personal relationships that could have appeared to influence the work reported in this paper.
References
- Raghunathan, R.S.; Kim, H.D.; Setoguchi, T. Aerodynamic of high-speed railway train. Pro. Aerospace Sci. 2002, 38, 469–514. [Google Scholar] [CrossRef]
- Schetz, J.A. Aerodynamics of high-speed trains. Annu. Rev. Fluid Mech. 2001, 33, 371–414. [Google Scholar] [CrossRef]
- Vardy, A.E. Aerodynamic drag on trains in tunnels: Synthesis and definitions. Proc. World Congr Inst. Mech. Eng. 1996, 210, 29–38. [Google Scholar] [CrossRef]
- Vardy, A.E. Aerodynamic drag on trains in tunnels: Prediction and validation. Proc. World Congr Inst. Mech. Eng. 1996, 210, 39–49. [Google Scholar] [CrossRef]
- Gawthorpe, R.G. Aerodynamics of trains in the open air. Railw. Eng. Int. 1978, 3, 7–12. [Google Scholar]
- Mackrodt, P.A.; Steinheuer, J.; Stoffers, G. Aerodynamishc Optimal Kopfformen Für Triebzüge, DFVLR IB 152 79 A27; DFVLR: Gottingen, Germany, 1980. [Google Scholar]
- Zhang, B.; Liang, X.F. Measurement of surface pressure distribution on quasi-high-speed train. Railw. Veh. 2000, 38, 14–16. [Google Scholar]
- Sockel, H. The aerodynamics of trains. Handbook of Fluid Dynamics and Fluid Machinery; Elsevier: Amsterdam, The Netherlands, 2013. [Google Scholar]
- Wei, T.; Schmidt, R.; McMurtry, P. Comment on the Clauser chart method for determining the friction velocity. Exp. Fluids 2005, 38, 695–699. [Google Scholar] [CrossRef]
- Brockie, N.J.W.; Baker, C.J. The aerodynamic drag of high-speed trains. J. Wind Eng. Ind. Aerodyn. 1990, 34, 73–90. [Google Scholar] [CrossRef]
- Preston, J.H. The estermination of turbulent skin friction by means of Pitot tubes. J. Royal Aero. Soc. 1954, 58, 109–121. [Google Scholar] [CrossRef]
- Head, M.R.; Rechenberg, I. The Preston tube as a means of measuring skin friction. J. Fluid Mech. 1962, 14, 1–17. [Google Scholar] [CrossRef]
- Vardy, A.E.; Reinke, P. Estimation of train resistance coefficients in tunnels from measurements during routine operation. Proc. Instn. Mech. Engrs. 1999, 213, 71–87. [Google Scholar] [CrossRef]
- Gaillard, M.A. Aerodynamic measurements with high-speed trains (250 km/hr) in the Heitersburg tunnel. In Proceedings of the 3rd International Symposium on the Aerodynamics and Ventilation of Vehicle Tunnels, Sheffield, UK, 19–21 March 1979; pp. 343–362. [Google Scholar]
- Ricco, P.; Baron, A.; Molteni, P. Nature of pressure waves induced by a high-speed train travelling through a tunnel. J. Wind Eng. Ind. Aerod. 2007, 95, 781–808. [Google Scholar] [CrossRef]
- Gilbert, T.; Baker, C.J.; Quinn, A. Gusts caused by high-speed trains in confined spaces and tunnels. J. Wind Eng. Ind. Aerod. 2013, 121, 39–48. [Google Scholar] [CrossRef]
- Yuan, H.; Zhou, D.; Shuang, M. Study of the unsteady aerodynamic performance of an inter-city train passing through a station in a tunnel. Tunn. Undergr. Space Technol. 2019, 86, 1–9. [Google Scholar] [CrossRef]
- Zeng, L.W.; Wang, H.F.; Li, L.Q.; Guo, W.; Yi, F.M. Experimental study of train-induced pressure acting on the platform screen doors in subway station. Tunn. Undergr. Space Technol. 2021, 117, 104105. [Google Scholar] [CrossRef]
- Kim, J.Y.; Kim, K.Y. Experimental and numerical analyses of train-induced unsteady tunnel flow in subway. Tunn. Undergr. Space Technol. 2007, 22, 166–172. [Google Scholar]
- Bai, H.L.; Zhou, Y.; Zhang, W.G.; Xu, S.J.; Wang, Y.; Antonia, R.A. Active control of a turbulent boundary layer based on local surface perturbation. J. Fluid Mech. 2014, 750, 316–354. [Google Scholar] [CrossRef]
- Brockie, N.J.W. The Aerodynamic Drag of High-Speed Trains. Ph.D. Thesis, University of Nottingham, Nottingham, UK, 1988. [Google Scholar]
- Huang, J.F.; Zhou, Y.; Zhou, T.M. Three-dimensional wake structure measurement using a modified PIV technique. Exp. Fluids 2006, 40, 884–896. [Google Scholar] [CrossRef]
- Mazumder, M.K.; Wanchoo, S.; Mcleod, P.C.; Ballard, G.S.; Mozumdar, S.; Caraballo, N. Skin friction drag measurements by LDV. Appl. Opt. 1981, 20, 2832–2837. [Google Scholar] [CrossRef]
- Crane Company. Flow of Fluids through Values, Fittings and Pipe; Technical Paper No. 410; Vervante: Springville, UT, USA, 1988. [Google Scholar]
- Douglas, J.F.; Gasiorek, J.M.; Swaffield, J.A. Fluid Mechanics; Pearson Education: England, UK, 2001. [Google Scholar]
- Batchelor, G.K. An Introduction to Fluid Dynamics; Cambridge University Press: Cambridge, UK, 1973. [Google Scholar]
- Hancock, P.E.; Bradshaw, P. The effect of free-stream turbulence on turbulent boundary layers. J. Fluids Eng. 1983, 105, 284–289. [Google Scholar] [CrossRef]
- Kuzenkov, V.K.; Levitskii, V.N.; Repik, E.U.; Sosedko, Y.P. 1995 Effect of free-stream turbulence on surface friction in a turbulent boundary layer. Fluid Dyna. 1995, 30, 210–218. [Google Scholar] [CrossRef]
- Blair, M.F. Influence of free-stream turbulence on turbulent boundary layer heat transfer and mean profile development, Part I-Experimental data. J. Heat Trans. 1983, 105, 33–40. [Google Scholar] [CrossRef]
- Dyban, Y.P.; Epik, E.Y.; Kozlova, L.G. Effect of free stream turbulence on the flow past a circular cylinder. Fluid Mech. Sov. Res. 1974, 3, 75–83. [Google Scholar]


Publisher’s Note: MDPI stays neutral with regard to jurisdictional claims in published maps and institutional affiliations. |
© 2022 by the authors. Licensee MDPI, Basel, Switzerland. This article is an open access article distributed under the terms and conditions of the Creative Commons Attribution (CC BY) license (https://creativecommons.org/licenses/by/4.0/).