Abstract
Polymer-based composites with a high dielectric property have shown great potential in electrical energy storage applications. It is important to predict the dielectric constant in designing polymer composites, but it is costly and time consuming. In this study, dielectric properties of various polymer composites have been predicted by using an artificial neural network (ANN) model trained with hundreds of experimentally measured data. Eight variables such as the dielectric constant of matrix, filler, and shell, the diameter of filler, the volume fraction of filler, the dimension of filler, the thickness of shell, and the frequency were considered. To improve the prediction accuracy, hyper parameters of the ANN model were optimized through the hyperband method. Using the ANN model, we demonstrated the correlation between the dielectric constant of polymer composites and the variables. The ANN model predicted the dielectric constant with a coefficient of determination (R2) of 0.97. Furthermore, the ANN model shows good performance to predict dielectric constant at various frequencies (spanning from 100 Hz to 100 kHz). Hence, we present that the AI-based prediction model using ANN method can be helpful in designing the polymer composites with desired properties.
1. Introduction
Dielectric capacitors have been used in pulsed power weapons, electrical power systems and hybrid electric vehicles (HEVs) due to their capability of ultrafast charging-discharging rate and ultrahigh power density [1,2]. In particular, dielectric polymers such as polyvinylidene fluoride (PVDF) are one of the most promising material candidates for high-density energy storage applications because of their high breakdown strength, low dielectric loss, facile fabrication, low cost, and flexibility [3,4]. Dielectric materials store electrostatic energy through reversible orientation polarization under applied electric field. High discharged energy density can be attained by high dielectric property. However, most dielectric polymers have a low dielectric constant, which limits their application to energy storage devices. In order to improve their dielectric properties, many studies have been conducted by introducing high dielectric constant ceramic fillers such as BaTiO3 [5], BaSrTiO3 [6], and Pb(Zr,Ti)O3 [7] as fillers into polymer matrices to improve their dielectric properties.
It is important to predict the dielectric constant of the polymer composites to achieve a desirable energy density. However, it is difficult to predict the dielectric constant of the polymer composites because of nonlinearity in the increase of a dielectric constant and diverse factors such as filler’s morphology, post processing of filler, and frequency [8,9,10,11,12]. In order to predict the dielectric constant of a polymer composite, the methods of using theoretical prediction models or directly measuring through experiments has been used. Luo et al. [13] introduced modified Rother–Lichtenecker, Maxwell–Wagner, and Jayasundere–Smith models to compare experimental data and prediction models. Zak et al. [14] used Maxwell, Furukawa, and Rayleigh prediction models to compare which models showed high accuracy with experimental data. However, these theoretical prediction models have limitations in predicting the dielectric constant of composites. It is difficult to consider all factors, so the theoretical models approximate many factors except for main variables. These models use only a dielectric constant of a matrix and filler, and filler’s volume fraction excluding other conditions such as filler’s morphology and size, frequency, and filler’s post processing. Therefore, the theoretical models can predict the dielectric properties in only simple composite models.
With the advent of machine learning (ML) technology based on experimental and computational data, the machine learning method has been widely applied as a popular and powerful alternative for material and structural design or for predicting electrical properties. Shen et al. [15] introduced a ML model to study the effect of nanoparticles physical properties on the breakdown strength of poly(vinylidene fluoride)-co-hexafluoropropylene [P(VDF-HFP)]-based nanocomposites, which was performed on a dataset from the high-throughput phase-filed simulations. Yi et al. [16] applied a ML model to investigate the influence of the polymer’s key molecular descriptors on the dielectric constant. Although these studies opened up chances for ML and data-driven methods in dielectric polymer-based composite, comprehensive research on a more practical predictive model considering various important factors to predict the dielectric constant has not yet been considered.
In this study, an ML model based on an artificial neural network is developed to predict the dielectric property of polymer composites using hundreds of experimentally measured data from existing references in consideration of various polymer matrices and ceramic nanofillers. An artificial neural network (ANN) network is trained with collected data considering the dielectric constant of matrix, filler, and shell, volume fraction, diameter and morphology of filler, operating frequency, and shell thickness in core–shell structures. In order to improve the model prediction performance, the model structure is optimized by a hyper parameter method [17]. In addition, the main factors dominating the dielectric constant of the polymer composite is studied by using the ANN model and a desirable polymer composite model with a high dielectric constant is presented.
2. Materials and Methods
2.1. Data Collection and Model Variables Description
The experimental data for various polymer-based composites were collected to train the ANN model for predicting dielectric constants from the references [18,19,20,21,22,23,24,25,26,27,28,29,30,31,32,33,34,35,36,37,38,39,40,41,42,43,44,45,46,47,48,49]. Table 1 shows the kinds and dielectric constants of all polymer matrices and ceramic nanofillers used in this work [50,51].

Table 1.
The dielectric constant values for different polymer matrixes and nano ceramic fillers.
From the data points, the four groups of input parameters were considered: (i) the properties of matrix and filler (dielectric constant, diameter of filler, and volume fraction), (ii) the morphology of filler (particle [0D], nanowire [1D], and nanosheet [2D]), (iii) the properties of shell (dielectric constant and thickness), and (iv) operating parameter (frequency), as shown in Figure 1.
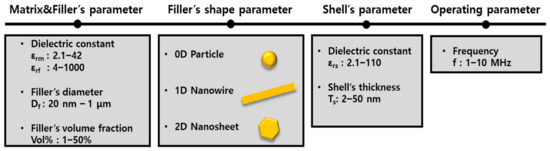
Figure 1.
Schematic of the input parameters in the machine learning.
The total experimental datasets available for modeling was 744. The data used in this study show the distribution of a normalized with a range from 0.25–5.75 in Figure 2. The normalized of most composites exceeds 1 with an average value of 1.27, indicating that the dielectric constant is enhanced by adding ceramic nanofillers due to their higher dielectric constant. In other hands, some data show values below 1, which is the case with nanofillers with a lower dielectric constant than polymers such as boron nitride (BN). Model training mainly concentrated on minimizing a mean squared error (MSE) to estimate the accuracy of the prediction model given as
where is measured output data from the result in previous research, is a calculated output data from the prediction model, and N is a total number of datapoints.
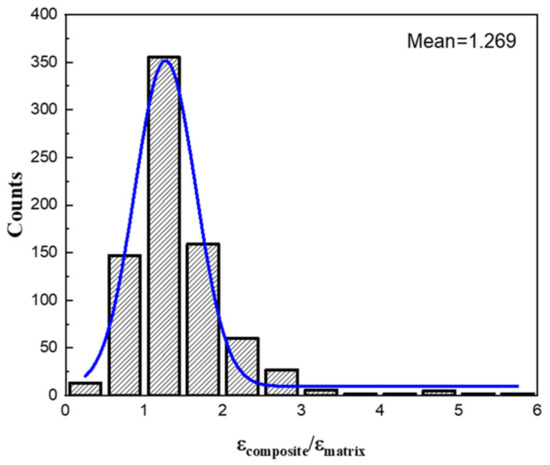
Figure 2.
Distribution of normalized εr for all samples in the dataset.
2.2. Development and Optimization the ANN Model
ANN consists of interrelated adaptive network components inspired by the regulation of connected neurons in the human brain and can perform large-scale parallel computations for data processing [52]. Typically, the network components of ANN are composed of layer, node, and connection. Figure 3 shows the structural design of the ANN model with input, hidden, and output layers. The MATLAB version R2021a was used to build the ANN model structure. To perform model training, the 774 experimental databases were divided into training, validation, and testing datasets with 70%, 15%, and 15%, respectively.
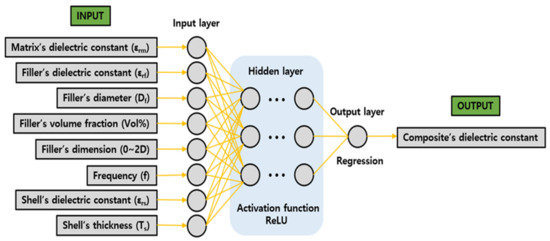
Figure 3.
Schematic of the ANN model structure with input, hidden, and output layers.
Before model training, it is important to optimize the number of hidden layers and nodes to improve a prediction accuracy. The hyper parameter optimization was conducted using Python 3 through a hyperband method [17]. The model was evaluated by increasing the number of layers from 2 to 5 and the number of nodes from 16 to 64 by 16 steps. The rectified linear unit (ReLU) was used to optimize the model as an activation function. The Adam was selected for optimizer. The results of optimization are shown in Table 2, and the best performance model had 4 hidden layers, 48, 32, 32, and 16 nodes at the hidden layers, and a learning rate of 0.001.
Table 2.
Top 5 model structures in the hyperband optimization.
3. Results & Discussions
3.1. Training of the ANN Model
Figure 4 shows the MSE drops of the proposed ANN model until 200 epochs when the network learns as expected for a well-trained ANN. This is a good indication of the network’s learning process. The blue line and red line represent the decreasing error of the training and validation data, respectively. It measures the network generalization ability and stops training as soon as the generalization does not improve. As shown in Figure 4, the training error was smaller than the validation error as expected, and the error lines were continuously decreased without overfitting.
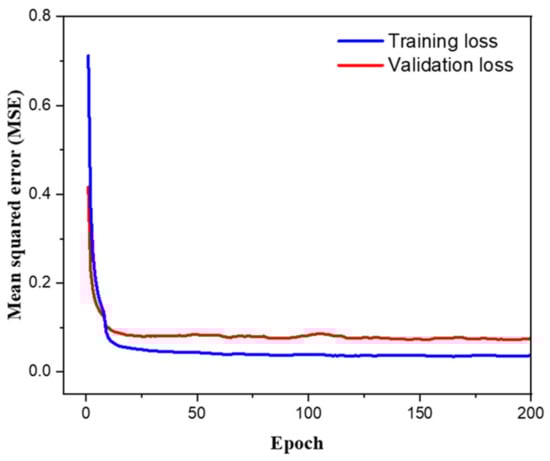
Figure 4.
Training and validation loss curves of the ANN over epochs.
The results of predicted and experimental of composites are shown in Figure 5. The ANN model had high accuracy in the prediction of composite’s dielectric constant. Figure 5a presents the prediction results were trained by all 744 databases with a high coefficient of determination (R2) of 0.95. The three red circles indicate relatively larger errors between the predicted and experimental than the other predicted values. Although the prediction error of some data points are relatively large, the ANN model shows a pretty high prediction accuracy. Data points in red circles were collected from the reference [18] using P(VDF-TrFE-CFE) as the matrix and a relatively high frequency of 106 Hz. Ferroelectric matrices with high dielectric constant can abruptly decrease dielectric constant at high frequencies, and under these conditions, there were only a limited number of data points in this study. Figure 5b shows the accuracy of an ANN model trained without the data in red circles. As expected, the prediction accuracy is higher than Figure 5a with the R2 of 0.97.
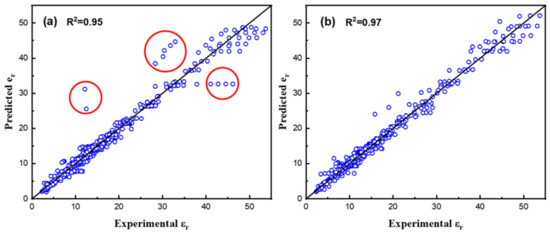
Figure 5.
Dielectric constant prediction accuracy between ML prediction vs. experimental values from (a) original dataset and (b) modified dataset.
3.2. Correlation Analysis of Variables
The Pearson coefficients between various input parameters and composite’s were calculated to discover the key factors, as shown in Figure 6. The Pearson coefficient ranges from −1 to 1 with −1 representing the strongest negative correlation and 1 representing the strongest positive correlation [53]. The largest positive correlation to is dominated by and filler’s volume fraction, while the most negative correlation comes from shell’s thickness. The has also a positive correlation to , but considering that the correlation coefficient of is higher than that of , it can be seen that the dielectric constant of the polymer matrix is more dominant to increase the dielectric constant of the composite. On the other hand, the operating frequency and thickness of the shell are negatively correlated with . The shell plays a role to compensate a dielectric mismatch between polymer matrices and ceramic fillers in core–shell structure. It shows that the shell is important for the purpose of increasing breakdown strength, but it is consistent with the results of previous studies that it plays a negative role in terms of increasing dielectric constant [54].
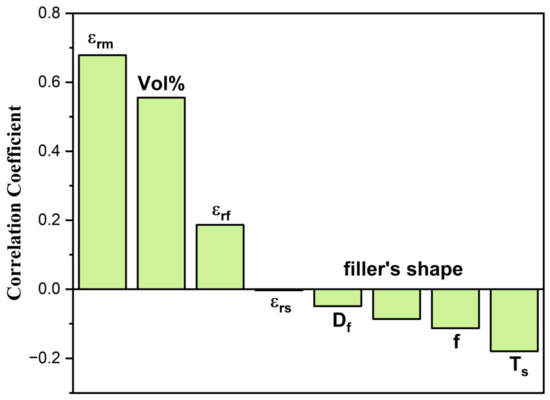
Figure 6.
Pearson coefficients between the eight input variables and composite’s dielectric constant.
In polymer-based composites, the dielectric constant of the composites primarily depends on the dielectric constant of the matrix and filler, and filler’s volume fraction as shown in Figure 6. The combined effect of the dielectric constant of matrix and filler, and the volume fraction of filler on composite’s dielectric constant was studied using the ANN as shown in Figure 7a–c. When we set the x-axis and y-axis with the main variables, the other variables are fixed based on the most overlapping data, with a filler diameter of 200 nm, a filler dimension of 1D nanowire, a frequency of 1 kHz, and without a core–shell structure. Figure 7a,b show the combined effect of the dielectric constant of matrix and filler, and the volume fraction of filler, respectively. As we can estimate, the dielectric constant of the composite shows a typically proportional tendency to increase as the dielectric constant of the matrix and the volume fraction of the filler increase. In Figure 7b, there are some distortion contour lines. It is derived from insufficient data with the dielectric constants of filler between about 500 and 800. Despite the lack of data, it shows the tendency of the composite’s dielectric constant to generally increase as the dielectric constant and the volume fraction of the filler increase. When matrix and filler’s dielectric constant are considered together in Figure 7c, it shows the same tendency as in Figure 7a,b that composite’s dielectric constant increases as matrix and filler’s dielectric constant increase. Furthermore, it is presented to discuss the effect of minor variables such as filler’s diameter and shell’s thickness in Figure 7d,e. When it comes to filler’s diameter, the dielectric constant of the composite represents a general tendency to decrease as the filler’s diameter decreases. This is mainly attributed to the lowered dielectric constant of filler caused by decreasing particle size. The dielectric constant of nanofillers decreases with decreasing particle size due to depolarization fields, surface properties, electrical boundary conditions, and defects [55]. As for the effect of the shell’s thickness, it shows the tendency of the composite’s dielectric constant to decrease as the shell’s thickness increases. This is because in the core–shell structure, the shell reduces the high electrical mismatch between the filler and the matrix. Therefore, as the shell’s thickness increases, the electrical mismatch and the effect of filler introduction to increase the composite’s dielectric constant are reduced at the same time [56]. It can be seen in Figure 7a–e that the dielectric constant of the polymer composites through the ANN model can be predicted without a theoretical model or empirical measuring method regarding the major and minor parameters.
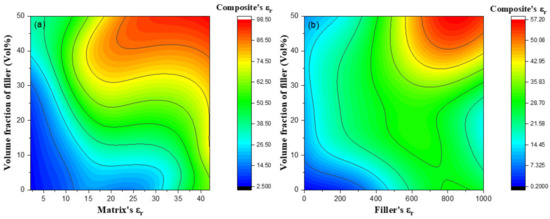
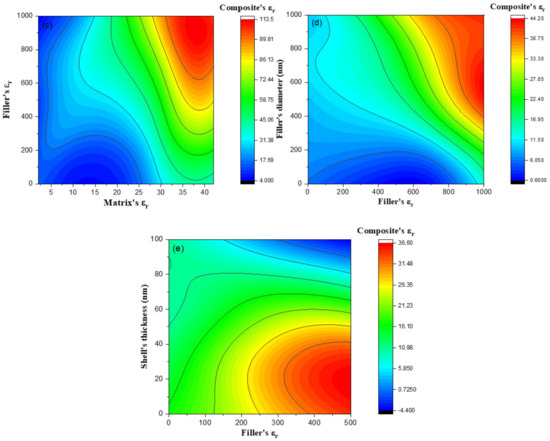
Figure 7.
2D contour plots showing combined effect of (a) matrix’s dielectric constant, (b) filler’s dielectric constant and filler’s volume fraction, (c) matrix and filler’s dielectric constant, (d) filler’s diameter, (e) shell’s thickness and filler’s dielectric constant.
3.3. Influence of Variables on Dielectric Constant
3.3.1. Effect of Filler Dimension
Figure 8 presents the predicted dielectric constant depends on three types of different filler’s dimensions (0D, 1D, and 2D) as a function of filler volume fraction. The predicted of 0D nanoparticle and 1D nanowire increases with the volume fraction, while 2D nanosheet decreases with the volume fraction. It is derived from the different ceramic filler’s shape (0D, 1D, and 2D). Compared to spherical nanoparticles (0D), nanofibers or nanowires (1D) can induce higher dielectric constants at much lower concentrations due to their large dipole moments as a result of their high aspect ratio [54]. On the other hand, BN( ~ 4) used in this study as the 2D nanosheet filler, has a lower dielectric constant than P(VDF-HFP) ( ~ 8.4), used as a matrix, showing a tendency to decrease as the volume fraction increases.
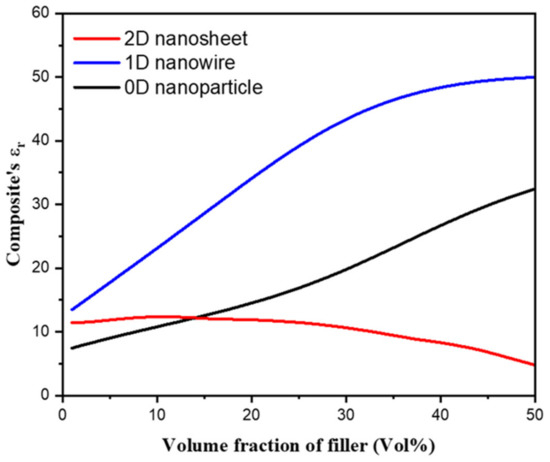
Figure 8.
Predicted dielectric constant depends on different filler’s dimensions as a function of filler volume fraction.
3.3.2. Effect of Operating Frequency
In general, the dielectric constant of a dielectrics comes from the result of complex interactions of a total of four polarizations: (i) the electronic polarization between the nucleus and electrons of an atom, (ii) the ionic polarization between a cation and an anion, (iii) the directional polarization according to the orientation of the permanent dipoles, and (iv) the space charge polarization caused by the movement of charge carriers (electron, hole, ion, and vacancy) to form a space charge [54]. For these polarizations to appear, a displacement of the charged particle must occur. When the applied electric field is alternating current, polarization can occur only when the displacement of the particle follows the change in the direction of the electric field. Therefore, as the charged particles are heavier, they cannot respond to high-frequency electric fields, and the dielectric constant decreases gradually. Although it is important to predict the dielectric constant with increasing frequency because of these characteristics, it has not been studied much [55,56].
To further confirm the accuracy of the ANN model with increasing frequency, three polymer composites were considered: P(VDF-TrFE-CFE)/BaTiO3 nanoparticle, P(VDF-HFP)/TiO2 nanowire, and P(VDF-HFP)/BN nanosheet. The normalized as a function of volume fraction with the increasing frequency range from 100–100 kHz is shown in Figure 9a–d. It can be seen that the trends of the volume fraction and frequency-dependent for the three composites are predicted fairly well. The normalized of P(VDF-TrFE-CFE)/BaTiO3 nanoparticle and P(VDF-HFP)/TiO2 nanowire increases with the volume fraction, while P(VDF-HFP)/BN nanosheet decrease with the volume fraction, which agree with Figure 8. When we compared the experimental and predicted values, there is no big difference with increasing frequency until 100 kHz. From the above, the ANN models can well show high accuracy between predicted and experimental at various frequency ranges.
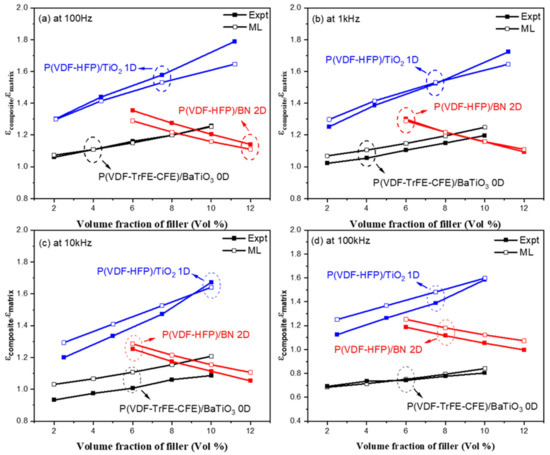
Figure 9.
Comparison of experimental and predicted dielectric constant as a function of filler volume fraction depends on increasing frequency: (a) 100 Hz, (b) 1 kHz, (c) 10 kHz, and (d) 100 kHz.
4. Conclusions
In this work, a machine learning driven an ANN model was developed to rationally design the desired dielectric constant of polymer composites, using hundreds of experimentally measured data. The hyper parameters were optimized by a hyperband method to improve the prediction performance. The designed ANN model can represent the correlations between 8 input variables and a dielectric constant of polymer composite with an accuracy of 97%. The main conclusions obtained from this ANN model are listed as the follows. Firstly, when considering the polymer matrix and the ceramic filler, it was found that the dielectric constant of the matrix was more dominant in increasing the dielectric constant of the composite than that of the filler. Secondly, regarding the dimension of the filler, it was shown to increase the dielectric constant of the composite in the order of 1D and 0D. As for 2D, additional studies are required because other 2D fillers except BN were not considered in this study. Lastly, the ANN model shows a good prediction performance for a dielectric constant at various frequencies (spanning from 100 Hz to 100 kHz). Therefore, we demonstrated the AI-based ANN model can design the dielectric constant of polymer composites for a high energy density in electrical energy storage applications.
Author Contributions
Conceptualization, S.J. and S.Y.; methodology, S.J., D.-Y.J. and C.K.; investigation, S.J.; resources, D.-Y.J. and S.Y.; data curation, S.J.; writing—original draft preparation, S.J.; writing—review and editing, S.Y.; supervision, C.K. and S.Y.; funding acquisition, D.-Y.J. and S.Y. All authors have read and agreed to the published version of the manuscript.
Funding
This research was supported in part by the MOTIE (Ministry of Trade, Industry, and Energy) in Korea, under the Fostering Global Talents for Innovative Growth Program (P0017303) supervised by the Korea Institute for Advancement of Technology (KIAT); and in part by the Korea Institute of Industrial Technology, under the project “Development of root technology of multi-product flexible production (KITECH-EO-22-0006)”.
Institutional Review Board Statement
Not applicable.
Informed Consent Statement
Not applicable.
Data Availability Statement
Not applicable.
Conflicts of Interest
The authors declare no conflict of interest.
References
- Huan, T.D.; Boggs, S.; Teyssedre, G.; Laurent, C.; Cakmak, M.; Kumar, S.; Ramprasad, R. Advanced polymeric dielectrics for high energy density applications. Prog. Mater. Sci. 2016, 83, 236–269. [Google Scholar] [CrossRef]
- Chen, J.; Wang, Y.; Xu, X.; Yuan, Q.; Niu, Y.; Wang, Q.; Wang, H. Ultrahigh discharge efficiency and energy density achieved at low electric fields in sandwich-structured polymer films containing dielectric elastomers. J. Mater. Chem. A 2019, 7, 3729–3736. [Google Scholar] [CrossRef]
- Shen, Y.; Lin, Y.; Zhang, Q.M. Polymer nanocomposites with high energy storage densities. MRS Bull. 2015, 40, 753–759. [Google Scholar] [CrossRef]
- Liu, F.; Li, Q.; Cui, J.; Li, Z.; Yang, G.; Liu, Y.; Wang, Q. High-energy-density dielectric polymer nanocomposites with trilayered architecture. Adv. Funct. Mater. 2017, 27, 1606292. [Google Scholar] [CrossRef]
- Tang, H.; Lin, Y.; Sodano, H.A. Synthesis of high aspect ratio BaTiO3 nanowires for high energy density nanocomposite capacitors. Adv. Energy Mater. 2013, 3, 451–456. [Google Scholar] [CrossRef]
- Tang, H.; Sodano, H.A. Ultra high energy density nanocomposite capacitors with fast discharge using Ba0.2Sr0.8TiO3 nanowires. Nano Lett. 2013, 13, 1373–1379. [Google Scholar] [CrossRef]
- Tang, H.; Lin, Y.; Andrews, C.; Sodano, H.A. Nanocomposites with increased energy density through high aspect ratio PZT nanowires. Nanotechnology 2010, 22, 015702. [Google Scholar] [CrossRef]
- Das, A.; Haider, A.; Samaddar, S. An automation approach in dielectric constant prediction using machine learning. In Proceedings of the International Conference on Energy, Communication, Data Analytics and Soft Computing (ICECDS), Chennai, India, 1–2 August 2017; pp. 3084–3086. [Google Scholar]
- Kota, R.; Ali, A.F.; Lee, B.I.; Sychov, M.M. Dielectric constant of barium titanate/cyanoethyl ester of polyvinyl alcohol composite in comparison with the existing theoretical models. Microelectron. Eng. 2007, 84, 2853–2858. [Google Scholar] [CrossRef]
- Umeda, Y.; Hayashi, H.; Moriwake, H.; Tanaka, I. Prediction of dielectric constants using a combination of first principles calculations and machine learning. Jpn. J. Appl. Phys. 2019, 58, SLLC01. [Google Scholar] [CrossRef]
- Ding, C.; Yu, S.; Tang, X.; Liu, Z.; Luo, H.; Zhang, Y.; Chen, S. The design and preparation of high-performance ABS-based dielectric composites via introducing core-shell polar polymers@ BaTiO3 nanoparticles. Compos. Part A Appl. Sci. Manuf. 2022, 163, 107214. [Google Scholar] [CrossRef]
- Luo, H.; Ma, C.; Zhou, X.; Chen, S.; Zhang, D. Interfacial design in dielectric nanocomposite using liquid-crystalline polymers. Macromolecules 2017, 50, 5132–5137. [Google Scholar] [CrossRef]
- Luo, B.; Wang, X.; Wang, Y.; Li, L. Fabrication, characterization, properties and theoretical analysis of ceramic/PVDF composite flexible films with high dielectric constant and low dielectric loss. J. Mater. Chem. A 2014, 2, 510–519. [Google Scholar] [CrossRef]
- Zak, A.K.; Gan, W.C.; Majid, W.A.; Darroudi, M.; Velayutham, T.S. Experimental and theoretical dielectric studies of PVDF/PZT nanocomposite thin films. Ceram. Int. 2011, 37, 1653–1660. [Google Scholar] [CrossRef]
- Shen, Z.H.; Wang, J.J.; Jiang, J.Y.; Huang, S.X.; Lin, Y.H.; Nan, C.W.; Shen, Y. Phase-field modeling and machine learning of electric-thermal-mechanical breakdown of polymer-based dielectrics. Nat. Commun. 2019, 10, 1–10. [Google Scholar] [CrossRef]
- Yi, Y.; Wang, L.M.; Yin, F.H. Interval support vector regression enables high-throughput machine learning predictions for dielectric constant of polymer dielectrics. Appl. Phys. Lett. 2021, 118, 223901. [Google Scholar] [CrossRef]
- Awad, N.; Mallik, N.; Hutter, F. DEHB: Evolutionary Hyperband for Scalable, Robust and Efficient Hyperparameter Optimization. arXiv 2021, arXiv:2105.09821. [Google Scholar]
- Liu, Y.; Wen, Y.; Xu, W.; Li, B.; Song, Z.; Li, Y.; Xia, F. Improving the energy density of P (VDF-HFP)/boron nitride nanosheets nanocomposites by using the third phase filler with high dielectric constant. J. Polym. Res. 2021, 28, 411. [Google Scholar] [CrossRef]
- Li, Y.; Zhou, Y.; Zhu, Y.; Cheng, S.; Yuan, C.; Hu, J.; Li, Q. Polymer nanocomposites with high energy density and improved charge-discharge efficiency utilizing hierarchically-structured nanofillers. J. Mater. Chem. A 2020, 8, 6576–6585. [Google Scholar] [CrossRef]
- Lu, X.; Zhang, L.; Tong, Y.; Cheng, Z.Y. BST-P (VDF-CTFE) nanocomposite films with high dielectric constant, low dielectric loss, and high energy-storage density. Compos. Part B Eng. 2019, 168, 34–43. [Google Scholar] [CrossRef]
- Song, Y.; Shen, Y.; Hu, P.; Lin, Y.; Li, M.; Nan, C.W. Significant enhancement in energy density of polymer composites induced by dopamine-modified Ba0.6Sr0.4TiO3 nanofibers. Appl. Phys. Lett. 2012, 101, 152904. [Google Scholar] [CrossRef]
- Hu, P.; Song, Y.; Liu, H.; Shen, Y.; Lin, Y.; Nan, C.W. Largely enhanced energy density in flexible P (VDF-TrFE) nanocomposites by surface-modified electrospun BaSrTiO3 fibers. J. Mater. Chem. A 2013, 1, 1688–1693. [Google Scholar] [CrossRef]
- Xiong, X.; Zhang, Q.; Zhang, Q.; Yang, H.; Tong, J.; Wen, J. Superior energy storage performance of PVDF-based composites induced by a novel nanotube structural BST@SiO2 filler. Compos. Part A: Appl. Sci. Manuf. 2021, 145, 106375. [Google Scholar] [CrossRef]
- Beier, C.W.; Sanders, J.M.; Brutchey, R.L. Improved breakdown strength and energy density in thin-film polyimide nanocomposites with small barium strontium titanate nanocrystal fillers. J. Phys. Chem. C 2013, 117, 6958–6965. [Google Scholar] [CrossRef]
- Liu, S.; Wang, J.; Hao, H.; Zhao, L.; Zhai, J. Discharged energy density and efficiency of nanocomposites based on poly (vinylidene fluoride) and core-shell structured BaTiO3@Al2O3 nanoparticles. Ceram. Int. 2018, 44, 22850–22855. [Google Scholar] [CrossRef]
- Hu, P.; Jia, Z.; Shen, Z.; Wang, P.; Liu, X. High dielectric constant and energy density induced by the tunable TiO2 interfacial buffer layer in PVDF nanocomposite contained with core–shell structured TiO2@BaTiO3 nanoparticles. Appl. Surf. Sci. 2018, 441, 824–831. [Google Scholar] [CrossRef]
- Ma, J.; Azhar, U.; Zong, C.; Zhang, Y.; Xu, C.; Zhang, Z.S. Core-shell structured PVDF@ BT nanoparticles for dielectric materials: A novel composite to prove the dependence of dielectric properties on ferroelectric shell. Mater. Des. 2019, 164, 107556. [Google Scholar] [CrossRef]
- Liu, S.; Zhai, J. Improving the dielectric constant and energy density of poly (vinylidene fluoride) composites induced by surface-modified SrTiO3 nanofibers by polyvinylpyrrolidone. J. Mater. Chem. A 2015, 3, 1511–1517. [Google Scholar] [CrossRef]
- Yao, M.; You, S.; Peng, Y. Dielectric constant and energy density of poly (vinylidene fluoride) nanocomposites filled with core-shell structured BaTiO3@Al2O3 nanoparticles. Ceram. Int. 2017, 43, 3127–3132. [Google Scholar] [CrossRef]
- Wang, J.; Long, Y.; Sun, Y.; Zhang, X.; Yang, H.; Lin, B. Enhanced energy density and thermostability in polyimide nanocomposites containing core-shell structured BaTiO3@SiO2 nanofibers. Appl. Surf. Sci. 2017, 426, 437–445. [Google Scholar] [CrossRef]
- Wang, M.; Li, W.L.; Feng, Y.; Hou, Y.F.; Zhang, T.D.; Fei, W.D.; Yin, J.H. Effect of BaTiO3 nanowires on dielectric properties and energy storage density of polyimide composite films. Ceram. Int. 2015, 41, 13582–13588. [Google Scholar] [CrossRef]
- Wang, J.; Sun, Y.; Wang, P.; Yu, X.; Shi, H.; Zhang, X.; Lin, B. High energy density of polyimide composites containing one-dimensional BaTiO3@ZrO2 nanofibers for energy storage device. J. Alloys Compd. 2019, 789, 785–791. [Google Scholar] [CrossRef]
- Wang, G.; Huang, X.; Jiang, P. Bio-inspired fluoro-polydopamine meets barium titanate nanowires: A perfect combination to enhance energy storage capability of polymer nanocomposites. ACS Appl. Mater. Interfaces 2017, 9, 7547–7555. [Google Scholar] [CrossRef] [PubMed]
- Xie, B.; Zhang, Q.; Zhang, H.; Zhang, G.; Qiu, S.; Jiang, S. Largely enhanced ferroelectric and energy storage performances of P (VDF-CTFE) nanocomposites at a lower electric field using BaTiO3 nanowires by stirring hydrothermal method. Ceram. Int. 2016, 42, 19012–19018. [Google Scholar] [CrossRef]
- Niu, Y.; Yu, K.; Bai, Y.; Wang, H. Effect of the modifier structure on the performance of barium titanate/poly (vinylidene fluoride) nanocomposites for energy storage applications. IEEE Trans. Ultrason. Ferroelectr. Freq. Control. 2015, 62, 108–115. [Google Scholar] [CrossRef] [PubMed]
- Pan, Z.; Ding, Q.; Yao, L.; Huang, S.; Xing, S.; Liu, J.; Zhai, J. Simultaneously enhanced discharge energy density and efficiency in nanocomposite film capacitors utilizing two-dimensional NaNbO3@Al2O3 platelets. Nanoscale 2019, 11, 10546–10554. [Google Scholar] [CrossRef] [PubMed]
- Chen, J.; Ye, D.; Wu, X.; Zhu, W.; Wang, X.; Xiao, P.; Yu, X. Large enhancement of discharge energy density of polymer nanocomposites filled with one-dimension core-shell structured NaNbO3@SiO2 nanowires. Compos. Part A Appl. Sci. Manuf. 2020, 133, 105832. [Google Scholar] [CrossRef]
- Pan, Z.; Yao, L.; Ge, G.; Shen, B.; Zhai, J. High-performance capacitors based on NaNbO3 nanowires/poly (vinylidene fluoride) nanocomposites. J. Mater. Chem. A 2018, 6, 14614–14622. [Google Scholar] [CrossRef]
- Zhang, H.; Zhu, Y.; Li, Z.; Fan, P.; Ma, W.; Xie, B. High discharged energy density of polymer nanocomposites containing paraelectric SrTiO3 nanowires for flexible energy storage device. J. Alloys Compd. 2018, 744, 116–123. [Google Scholar] [CrossRef]
- Li, J.; Seok, S.I.; Chu, B.; Dogan, F.; Zhang, F.; Wang, Q. Nanocomposites of ferroelectric polymers with TiO2 nanoparticles exhibiting significantly enhanced electrical energy density. Adv. Mater. 2009, 21, 217–221. [Google Scholar] [CrossRef]
- Wang, G.; Huang, X.; Jiang, P. Mussel-inspired fluoro-polydopamine functionalization of titanium dioxide nanowires for polymer nanocomposites with significantly enhanced energy storage capability. Sci. Rep. 2017, 7, 43071. [Google Scholar] [CrossRef]
- Ding, S.; Yu, S.; Zhu, X.; Xie, S.; Sun, R.; Liao, W.H.; Wong, C.P. Enhanced breakdown strength of polymer composites by low filler loading and its mechanisms. Appl. Phys. Lett. 2017, 111, 153902. [Google Scholar] [CrossRef]
- Wang, G.; Huang, X.; Jiang, P. Tailoring Dielectric Properties and Energy Density of Ferroelectric Polymer Nanocomposites by High-k Nanowires. ACS Appl. Mater. Interfaces 2015, 7, 18017–18027. [Google Scholar] [CrossRef] [PubMed]
- Ai, D.; Li, H.; Zhou, Y.; Ren, L.; Han, Z.; Yao, B.; Wang, Q. Tuning nanofillers in in situ prepared polyimide nanocomposites for high-temperature capacitive energy storage. Adv. Energy Mater. 2020, 10, 1903881. [Google Scholar] [CrossRef]
- Xie, Z.; Liu, D.; Wu, K.; Fu, Q. Improved dielectric and energy storage properties of polypropylene by adding hybrid fillers and high-speed extrusion. Polymer 2021, 214, 123348. [Google Scholar] [CrossRef]
- Xue, J.; Zhang, T.; Zhang, C.; Zhang, Y.; Feng, Y.; Zhang, Y.; Chi, Q. Excellent energy storage performance for P (VDF-TrFE-CFE) composites by filling core-shell structured inorganic fibers. J. Mater. Sci. Mater. Electron. 2020, 31, 21128–21141. [Google Scholar] [CrossRef]
- Thakur, V.K.; Gupta, R.K. Recent progress on ferroelectric polymer-based nanocomposites for high energy density capacitors: Synthesis, dielectric properties, and future aspects. Chem. Rev. 2016, 116, 4260–4317. [Google Scholar]
- Tan, D.Q. The search for enhanced dielectric strength of polymer-based dielectrics: A focused review on polymer nanocomposites. J. Appl. Polym. Sci. 2020, 137, 49379. [Google Scholar] [CrossRef]
- Kushvaha, V.; Kumar, S.A.; Madhushri, P.; Sharma, A. Artificial neural network technique to predict dynamic fracture of particulate composite. J. Compos. Mater. 2020, 54, 3099–3108. [Google Scholar] [CrossRef]
- Zhu, M.X.; Yu, Q.C.; Song, H.G.; Chen, T.X.; Chen, J.M. Rational design of high-energy-density polymer composites by machine learning approach. ACS Appl. Energy Mater. 2021, 4, 1449–1458. [Google Scholar] [CrossRef]
- Kang, D.; Wang, G.; Huang, Y.; Jiang, P.; Huang, X. Decorating TiO2 nanowires with BaTiO3 nanoparticles: A new approach leading to substantially enhanced energy storage capability of high-k polymer nanocomposites. ACS Appl. Mater. Interfaces 2018, 10, 4077–4085. [Google Scholar] [CrossRef]
- Bi, M.; Hao, Y.; Zhang, J.; Lei, M.; Bi, K. Particle size effect of BaTiO3 nanofillers on the energy storage performance of polymer nanocomposites. Nanoscale 2017, 9, 16386–16395. [Google Scholar] [CrossRef] [PubMed]
- Zhu, H.; Liu, Z.; Wang, F.; Yan, K. Influence of shell thickness on the dielectric properties of composites filled with Ag@SiO2 nanoparticles. RSC Adv. 2016, 6, 64634–64639. [Google Scholar] [CrossRef]
- Hao, X. A review on the dielectric materials for high energy-storage application. J. Adv. Dielectr. 2013, 3, 1330001. [Google Scholar] [CrossRef]
- Zhang, X.J.; Wang, G.S.; Wei, Y.Z.; Guo, L.; Cao, M.S. Polymer-composite with high dielectric constant and enhanced absorption properties based on graphene–CuS nanocomposites and polyvinylidene fluoride. J. Mater. Chem. A 2013, 1, 12115–12122. [Google Scholar] [CrossRef]
- Wu, W.; Huang, X.; Li, S.; Jiang, P.; Toshikatsu, T. Novel three-dimensional zinc oxide superstructures for high dielectric constant polymer composites capable of withstanding high electric field. J. Phys. Chem. C 2012, 116, 24887–24895. [Google Scholar] [CrossRef]


Publisher’s Note: MDPI stays neutral with regard to jurisdictional claims in published maps and institutional affiliations. |
© 2022 by the authors. Licensee MDPI, Basel, Switzerland. This article is an open access article distributed under the terms and conditions of the Creative Commons Attribution (CC BY) license (https://creativecommons.org/licenses/by/4.0/).