Article

Influencing Factors of Steel States in Concrete Based on Electrochemical Impedance Spectroscopic Measurements

Department of Structural Engineering Research, Korea Institute of Civil Engineering and Building Technology, 283 Goyangdae-ro, Goyang-si 10223, Gyeonggi-do, Republic of Korea
*
Author to whom correspondence should be addressed.
Appl. Sci. 2022, 12(24), 12611; https://doi.org/10.3390/app122412611
Submission received: 23 November 2022 / Revised: 5 December 2022 / Accepted: 6 December 2022 / Published: 8 December 2022
(This article belongs to the Section Civil Engineering)

Abstract

:
To cope with the premature deterioration of reinforced concrete structures caused by chloride-induced corrosion, the corrosion rate is required to be estimated and the transport parameters calculated. The electrochemical impedance spectroscopy (EIS) technique can evaluate steel corrosion behaviors at different frequencies. However, its capacity to interpret the impedance response of the system (steel embedded in concrete) is still challenged. Although concrete is a good barrier used to secure structural performance, one of the main obstacles associated with electrical measurements relates to the cases in which concrete contains unexpected or invisible variables, such as changes in pore structure induced by the continuous hydration process. In addition, the fact that steel embedded in concrete is controlled during experiments is technically challenging. Due to these limitations, various circuits have been proposed to explain the corrosion behavior of steel in concrete. EIS measurements are very sensitive to small perturbations. During the analysis process of EIS data, it is possible to introduce unexpected errors attributed to variables; thus, the estimated corrosion values based on the analysis rate may be misleading. To overcome the limitations, it is necessary to confirm the impedance responses first in controlled variable cases. In this study, EIS measurements were conducted for active/passive states of steel in concrete in various conditions to minimize variable errors which are likely induced by operators.

1. Introduction

Steel corrosion in concrete structures is becoming increasingly severe throughout the world. The premature deterioration of concrete structures caused by corrosion results in safety risks and considerable economic losses [1]. In this sense, it is helpful to establish well-planned maintenance strategies, such as monitoring systems, and proper designs for the structures based on predictive models or performance-based concepts to avoid catastrophic damages.
Chloride is a typical source of steel corrosion in concrete structures resulting from the deicing salt used for snow removal, or from sea water in marine structures. Chloride-induced corrosion in concrete structures is divided into two stages: corrosion initiation and corrosion propagation [2]. Studies on the corrosion initiation phase have been detailed and are exhaustive compared with the corrosion propagation phase, owing to the time consumption requirements until depassivation and additional influencing variables, such as those attributed to interfacial effects and steel conditions. From practical or engineering views, it is obvious that corrosion propagation in addition to corrosion initiation should also be involved in the prediction/evaluation of the service life of concrete.
Until now, to overcome the time-consumption of corrosion in concrete, many methods have been proposed to accelerate corrosion. Three methods are typically used to accelerate chloride-induced corrosion. These involve the: (1) direct application of currents to steel [3,4], (2) premixing chloride during casting [5,6,7,8], and (3) use of wet/dry cyclic regimes [9,10,11]. The methods are combined depending on the purpose of the study. The applied current or premixed chloride methods yield fast results compared with wet/dry cyclic regimes. Meanwhile, wet/dry cyclic methods are more realistic than those used in other methods. Steel exposed to a simulated pore solution can observe corrosion products directly and can reduce the required time for corrosion initiation [12,13,14], but this method is difficult to fully simulate the inhomogeneity of concrete.
Various techniques have been used for corrosion measurements based on the use of (a) destructive methods, such as the mass loss technique, and (b) nondestructive methods, such as the half-cell potential technique and the DC (direct current) and AC (alternating current) polarization techniques. Nondestructive methods fascinate engineers compared with destructive methods [15]. The half-cell potential technique is extensively used to detect steel corrosion in concrete [16], but it is inappropriate for the quantification of the amount of corrosion. Polarization techniques, such as the linear polarization and galvanostatic/potentiostatic methods, are preferred for measurements of the corrosion rate of steel. In linear polarization, the estimation of ohmic resistance and the determination of the Tafel constant B are the main issues. It is difficult to archive a steady state rapidly using galvanostatic/potentiostatic methods due to the polarization phenomenon. In addition, it is hard to apply a proper current to avoid unintended corrosion using the galvanostatic method [11]. Electrochemical impedance spectroscopic (EIS) measurements as another polarization technique seem to be the most reliable in evaluating the corrosion rate, as repeatable measurements using AC sources are available. However, there are limitations attributed to sensitivity measurements [17], such as ambiguous responses at low frequencies [5] and interpretation difficulties [18,19]. To improve the applicability of EIS in measuring the corrosion of steel in concrete, it is necessary to first identify various influencing factors on the measurement.
Accordingly, the main aim of this study is the confirmation of the effects of variables (contact solution/contact pressure in a concrete–sponge–electrode system, counter electrode size, and location) on EIS data (based on measurements), and the achievement of improvements in the interpretation of an impedance spectra. Therefore, this study investigates the effects of these variables on high-frequency responses accounting for concrete properties.

2. Background of EIS Corrosion Measurements

The polarization technique involves the application of an electrical stimulus between two electrodes, i.e., the counter and working electrodes, and the observation of the response, and is extensively used in corrosion science. Among all the polarization techniques, EIS (AC) measurements are based on the frequency domain, thus allowing various types of information, including inductive, capacitive, and diffusion processes on electrochemical cells. The measured impedance is expressed in a complex form consisting of the real (resistance) and fictitious (reactive) parts.
Z ( ω ) =   Z ( ω ) i   Z ( ω ) ,
where ω is the angular frequency ( ω = 2 π f , f is the frequency (Hz)),   Z ( ω ) is the real part,   Z ( ω ) is the fictitious part, and i = 1 .
Two types of formats are typically used to represent EIS data, namely the (1) Nyquist and (2) Bode formats [20].
  • Nyquist format: The real (   Z ( ω ) ) and the fictitious (   Z ( ω ) ) parts are expressed on the x- and the y-axes, respectively. The impedance can be represented with the vector’s length ( | Z ( ω ) | ) , and the angle between this vector and the x-axis. This representation cannot express the frequency directly.
2.
Bode format: Both the modulus of the impedance and the phase shift on the y-axis are plotted with respect to the frequency on the x-axis. The Bode format explicitly shows frequency information, unlike the Nyquist format.
The corrosion of steel in concrete is an electrochemical process, which consists of anode, cathode, and ohmic resistance. The corrosion process in concrete is controlled based on (a) anodic control with iron dissolution, (b) cathodic control with oxygen availability, and (c) ohmic control based on the concrete’s resistance. Although the corrosion rate is determined by one dominant factor, both polarization and ohmic resistances are required to calculate the corrosion rate of steel in concrete. The corrosion rate can be calculated using the Stern–Geary equation [21].
I c = B R p
where I c is the corrosion current (mA), and B is an empirical value as 26 mV for the active state and as 52 mV for passive state.
To this end, the EIS technique is beneficial for the estimation of the behavior of steel in concrete as both parameters are measured separately. As shown in Figure 1, the impedance spectra for steel in concrete may ideally consist of two semicircles, including a large one for the low-frequency limit (corresponding to the steel’s response), and a small one for the high-frequency limit (corresponding to the concrete’s response). In porous materials, the semicircle is typically depressed by the decreasing capacitance at increasing frequencies so that the capacitance element is replaced with a constant phase element (CPE) to improve the fitting in the following equation.
Z C P E = 1 C 0 ( i ω ) p
where Z C P E is the fictitious impedance, C 0 is a coefficient, p is the exponent ( 0 < p < 1 ) , and i = 1 .
3.
Reviews for Electrical Equivalent Circuits
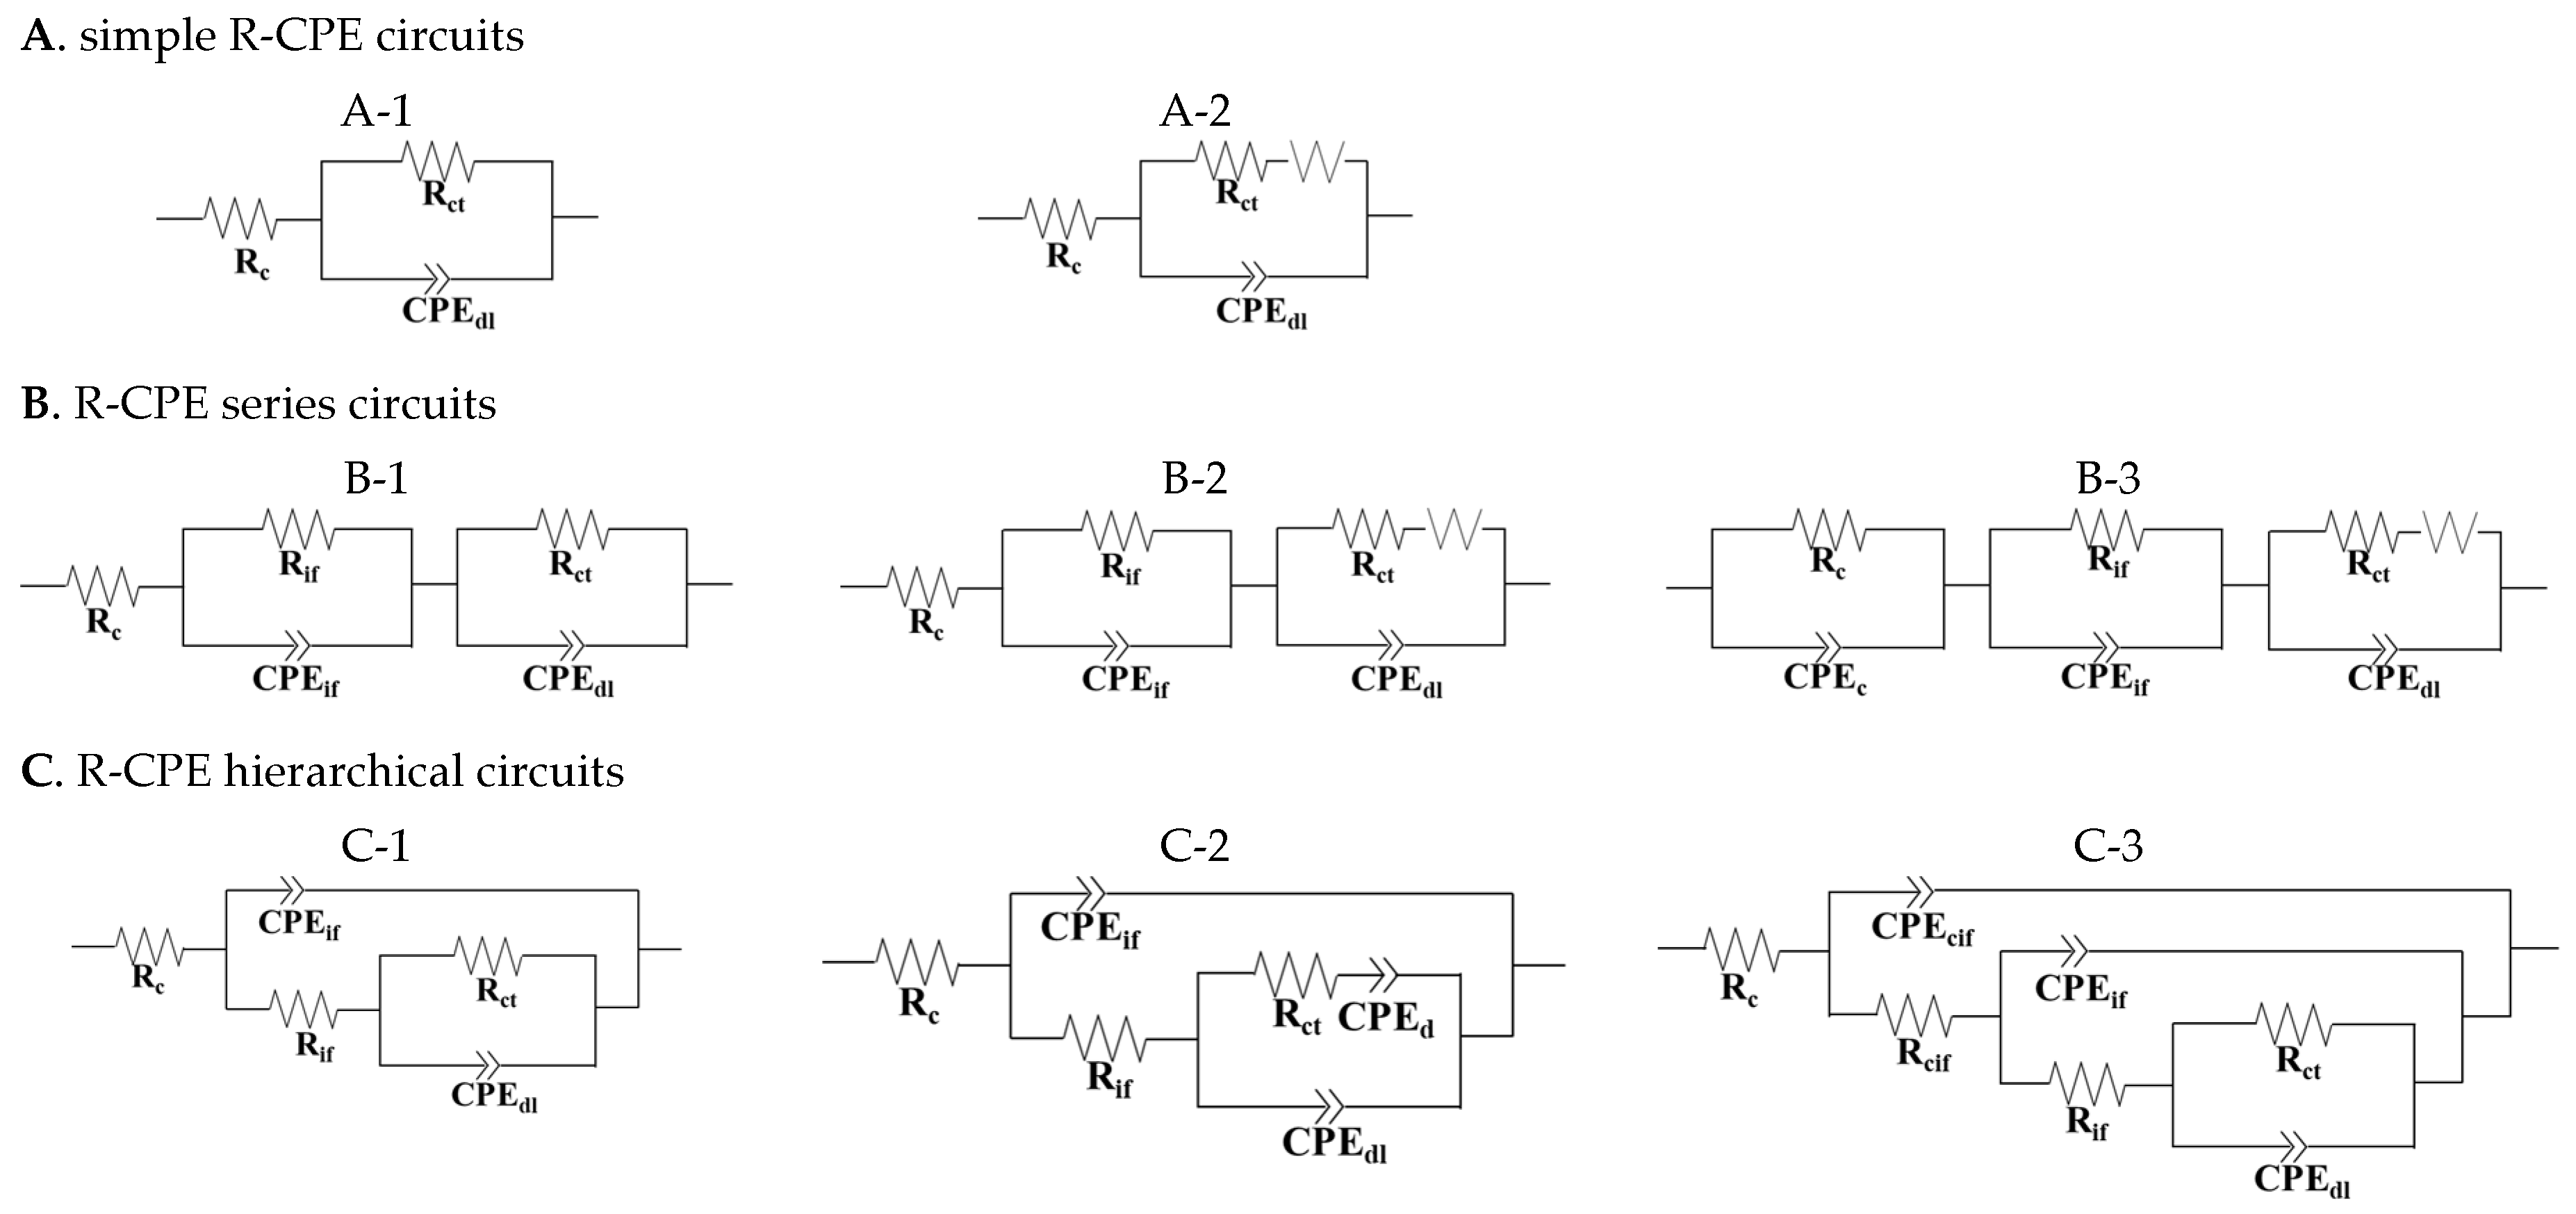
EIS data may contain various types of information, including bulk resistance, diffusion processes, and charge transfers. To explain these, various electrical equivalent circuits have been proposed [5,7,8,11,22,23,24,25,26,27]. Depending on the purpose of the study, the arrangements of elements in the circuits can be diverse; consequently, it is necessary to first review the circuits proposed in the literature, as shown in Figure 2 and Table 1. Complicated circuits, such as transmission-line models, provide mechanistic characters for corrosion processes, e.g., pitting corrosion, diffusion processes, and the presence of passive films, and yield a good relation between impedance data and fitting [28]; however, their applications are not straightforward to engineers. Only simplified electrical circuits are reviewed herein.
In most electrical equivalent circuits, the response of bulk concrete (Rc) is simplified, wherein only a single resistor is used, as shown in Figure 2, for which the high-frequency limit is set up as an origin despite the existence of capacitances and resistances (in the high-frequency arc) together. An analysis error may be induced depending on the high-frequency limit set to determine the concrete’s resistance. In addition, the steel–concrete interface is represented by a charge transfer resistance (Rct) in conjunction with a constant phase element (CPEdl) for the double layer.
To describe the presence of the low-frequency tail representing the diffusion control of oxygen in the vicinity of the steel surface, a Warburg impedance (W) is introduced in series with the charge transfer resistance, which explains the Faradic process at the interface (A-2, B-2, B-3 in Figure 2). The phenomenon can explain the reason why it is difficult for traditional DC measurements to archive steady states within a prolonged period of time. However, when a Warburg impedance is introduced, it is ambiguous to verify whether the fitting process is proper or not as this tail cannot be always observed, even at lower frequencies [23]. The elements representing the response in the intermediate frequency are mostly introduced in the circuits (Rif and CPEif in Series B and C), but the physical meanings proposed by researchers vary. For example, the responses for the intermediate frequency in R-CPE series circuits (Series B) were described by Pereira et al. [11] based on the effect on the interfacial layer between mortar and steel; by Choi et al. [22] based on the de-electrical properties of concrete; and by Park et al. [24] based on the effects of the surface film on steel. Meanwhile, hierarchical R-CPE circuits (Series C) are used to determine an intermediate frequency response. This response is considered with steel’s redox transformation [8,26]; but according to Dhouibi et al. [27], the response (C-3 in Figure 2) is separated into hydration products formed in cement pores around the steel surface (Rcif and CPEcif) and redox transformation (Rif and CPEif).
The impedance spectrum in the Nyquist plot generally consists of the concrete and steel responses (comprising two semicircles). The electrical circuits are expanded to describe additional semicircles or tails based on a combination of resistors and capacitors, or a Warburg element. However, the roles of some elements used in the circuit are still unclear; therefore, it is necessary to define the role of the element clearly.

3. Experiments

3.1. Materials and Sample Preparation

The chemical composition of the cement and mix design details used in this study are presented in Table 2 and Table 3.
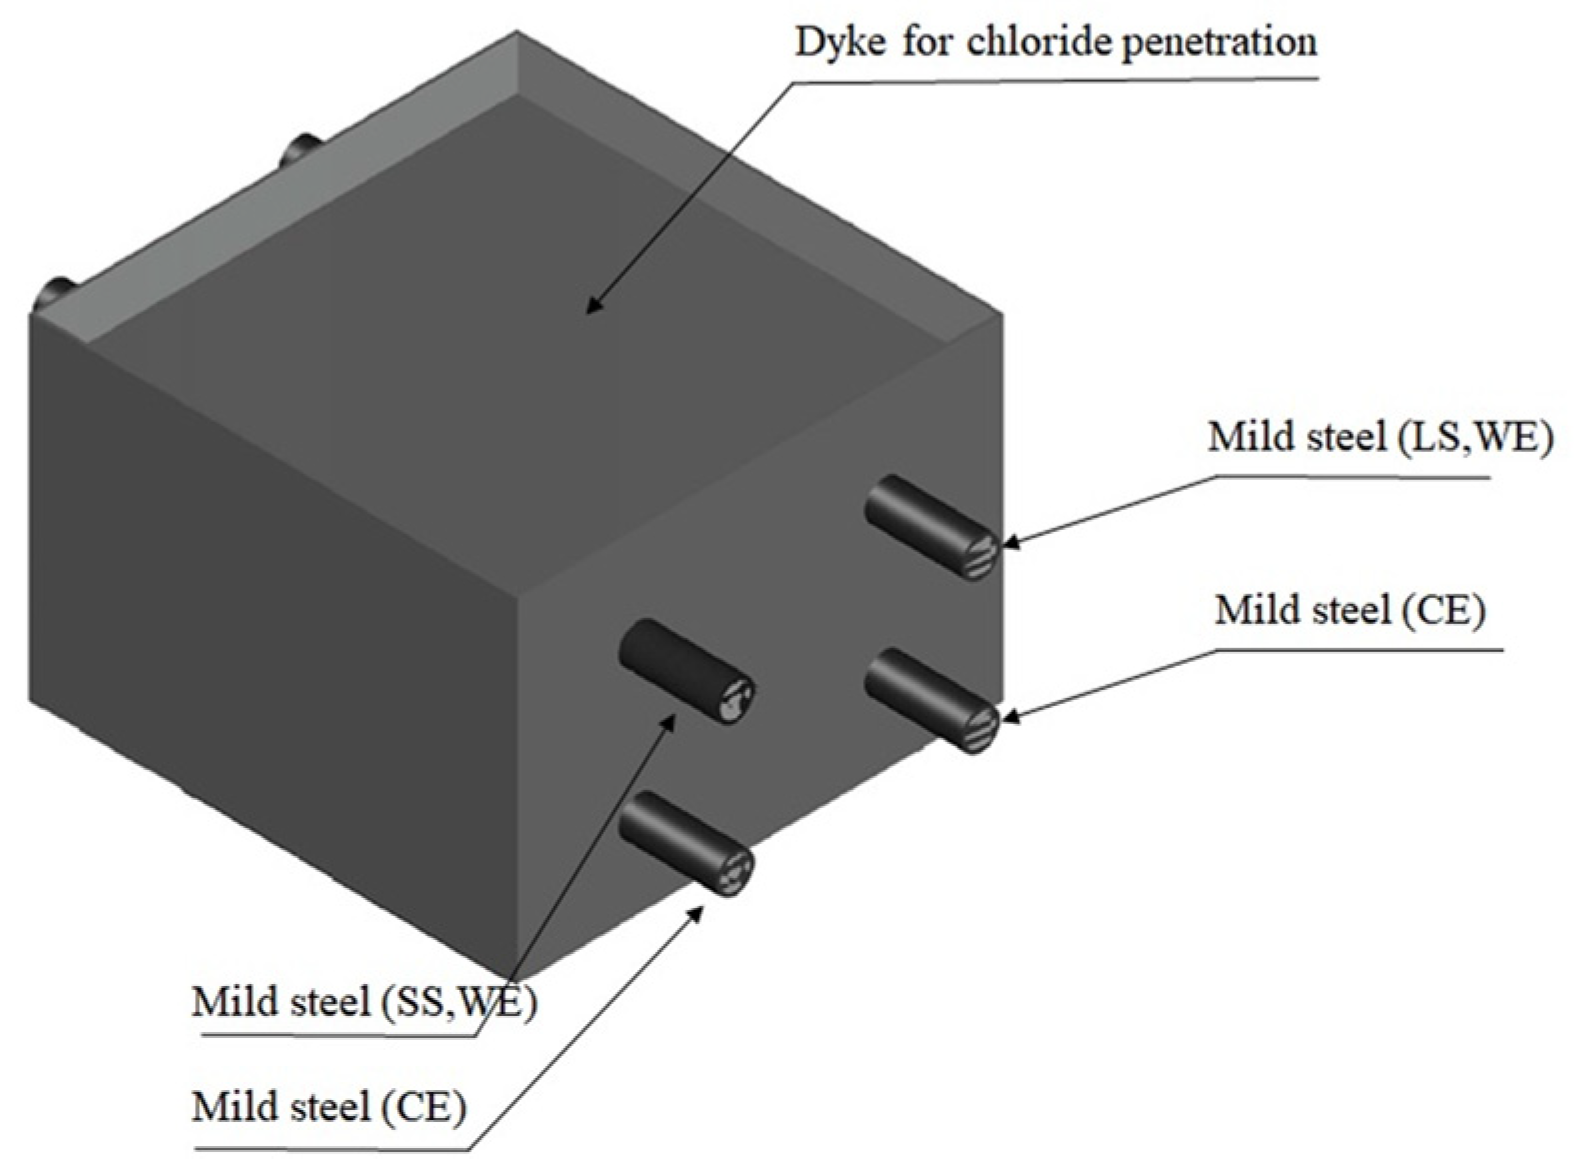
Portland cement (CEM I 52.5N to BS EN 197-1:2000) [30] was mixed with crushed aggregate with the concrete pan mixer (capacity = 0.1 m3). The physical properties of the aggregate and sand are additionally given in Table 4. To accelerate the corrosion process, high water-to-cement ratios were employed. Three concrete samples were cast as 250 × 250 × 150 mm slabs with a dyke against the face (dimensions: 250 × 250 mm) to facilitate a wet/dry cycle regime using plywood mold. Each concrete sample contained four electrically isolated mild steel bars (diameter = 16 mm and length = 300 mm). A copper wire was attached to one end of each mild steel, and both ends of the steel were then heat-shrinkage-wrapped to provide a specific exposure area. Before casting, all steel bars were cleaned with acetone to degrease. The details for the steel are the following:
  • Two steel bars were used (cover depth = 25 mm)
    One of them (length = 150 mm) had an exposed area equal to 75.40 cm2 and was denoted by the symbol LS (steel with long exposed area); the other accounted for an area equal to 50.27 cm2 and was denoted by the symbol SS (steel with small exposed area). The center of SS (length = 50 mm) was insulated to separate the corroded and non-corroded area locally by assuming that pit corrosion was formed by chloride.
  • Two steel bars were used (cover depth = 100 mm); these were positioned in parallel with each working electrode (acting as counter electrodes).
    Both steel bars at this depth had the same exposed length (equal to 150 mm) and were used to monitor the chloride-induced corrosion behavior of steel. In addition, the steel located under the LS acted as a cathode so that the steel was always connected with the working electrode except for the measurement.
  • To eliminate the effect on steel corrosion (in addition to the effect on the exposure area), the protruding ends of the steel specimens were also sealed with a heat-shrinkage band. Before the sealing of the protruding ends of steel, these ends were sandblasted to eliminate all types of blemishes, e.g., cement paste and corrosion products formed on steel during casting and curing.

3.2. Curing and Test Regime

After casting, the specimens were wrapped with polythene film and were then kept in the mold for 7 days. After demolding at 7 days, all faces of the specimen (except for one exposure area which corresponded to a dyke) were double-coated with epoxy resin to induce all the corrosion processes, i.e., the penetration of aggressive agents, such as chlorides, oxygen, and moisture. Then, all samples were wrapped again with polythene film and were placed in a polythene bag for 28 days at a constant temperature (20 ± 1 °C). The wrapping method was used to minimize moisture loss during air curing. The sample schematics are shown in Figure 3.
The cyclic regime was used to simulate unsaturated conditions in marine environments in which corrosion is severe. The chloride solution used in the study (chloride concentration = 19.5 g/L) accounted for the salinity of sea water. Prior to the cyclic regime, the surface of the sample was ponded with distilled water for an additional 7-day period before they were subjected to a wet/dry cyclic regime. This ensured that the samples were in a saturated condition and that the absorption effect induced by the drying phase was eliminated. During the drying phase, the chloride solution was removed from the concrete surface and the surface was then exposed to laboratory conditions (temperature: 20 ± 1 °C and relative humidity: 55 ± 5%); by contrast, the chloride solution was ponded using a dyke formed in the concrete surface during the wetting phase. The cyclic regime increased stage by stage, i.e., 2 days drying and 5 days wetting for the first month, 5 days drying and 2 days wetting for the second month, and 8 days drying and 6 days wetting for the remaining period.
To confirm the effects of variables on EIS measurements, a wide range of frequency was chosen to cover both the concrete response and steel response. Three samples were fabricated, but EIS measurements were conducted on one of the samples that was chosen, which contained corroded and non-corroded steel. This led to the minimization of local effects, such as chloride-induced contamination and concrete inhomogeneity depending on the sample. Moreover, during the measurements, areas which were not measured were covered with a wetted synthetic sponge (thickness = 2 mm) to minimize the evaporation effect.
EIS measurements were conducted with a frequency response analyzer (Solartron 1260A Impedance/Gain-phase analyzer) in conjunction with potentiostats (Solartron Analytical 1287 Electrochemical Interface). A sinusoidal wave (root mean square value = 10 mV at open-circuit potential) was applied over the frequency range 10 mHz–250 kHz, based on a logarithmic sweep at 10 frequency points per decade. The open-circuit potential was set up to be less than 10 mV/min. As only high-frequency responses were considered in this part, a low-frequency limit was set up; this led to rapid measurements. Curve fittings were performed with the software package ZView® (Scribener Associates Inc., Southern Pines, NC, USA). The experimental setup was based on a traditional three-electrode configuration. The reference electrode was made of copper/copper sulfate (Model 8-A, Farwest Corrosion Control Co., Denver, CO, USA) and two types of counter electrodes were used, namely stainless plates (35 × 200 mm and 35 × 100 mm) denoted by the external counter electrode and embedded mild steel in concrete denoted by the internal counter electrode. As shown in Figure 4, the two experimental setups were given depending on the types of the counter electrode. When using the internal counter electrode, the reference electrode was placed on the surface of the sample and then the measurements were carried out (refer to Figure 4a). On the other hand, for the experimental set-up with the external counter electrode, to improve the electrical connection between the counter/reference and the working electrodes, a wetted sponge was placed on the exposure face for 10 min before EIS measurements. When the measurement was conducted using stainless plates, the sponge was placed between the surface and the plates. In addition, a mass equal to 2 kg for the small stainless plate or 4 kg (2 kg + 2 kg) for the large stainless plate was placed on the plates on the small and long counter electrodes during the measurements to improve the extent of the contact at the electrode–sponge–concrete interface (refer to Figure 4b).
As mentioned previously, sets of variables were used in this study to verify the concrete responses, as follows:
  • The effect of contact solution to confirm the existence of an interfacial effect.
    • Mains tap water;
    • A saturated solution of calcium hydroxide (as calcium hydration causes typical hydration products to leach out easily in concrete);
    • Sodium chloride (0.55 M NaCl) solution (as the solution is the same as that used in the cyclic ponding regime);
    • A simulated cement pore solution comprising 0.1 M sodium hydroxide (NaOH) and 0.3 M potassium hydroxide (KOH) (as the alkali oxides in the cement clinker are highly soluble).
  • The effect of contact pressure to confirm the existence of an interfacial effect.
    • No pressure was applied on the external counter electrode;
    • A mass of 2 kg was placed on the center of the small counter electrode, or 4 kg (2 kg + 2 kg) were placed at the one-third and two-third loci of the long counter electrode to ensure uniform contact;
    • A mass of 1 kg was placed at the one-third point, and a mass of 2 kg was placed at the two-third points of the large counter electrode to simulate workmanship-induced errors caused by the nonuniformly distributed pressure.
  • The effect of counter electrode size to confirm the self-confinement of applied current to corroded steel.
    • Use of stainless-steel plates (lengths = 200 mm and 100 mm);
    • The effect of the counter electrode’s position to confirm differences in high-frequency responses;
    • Internal and external counter electrodes.
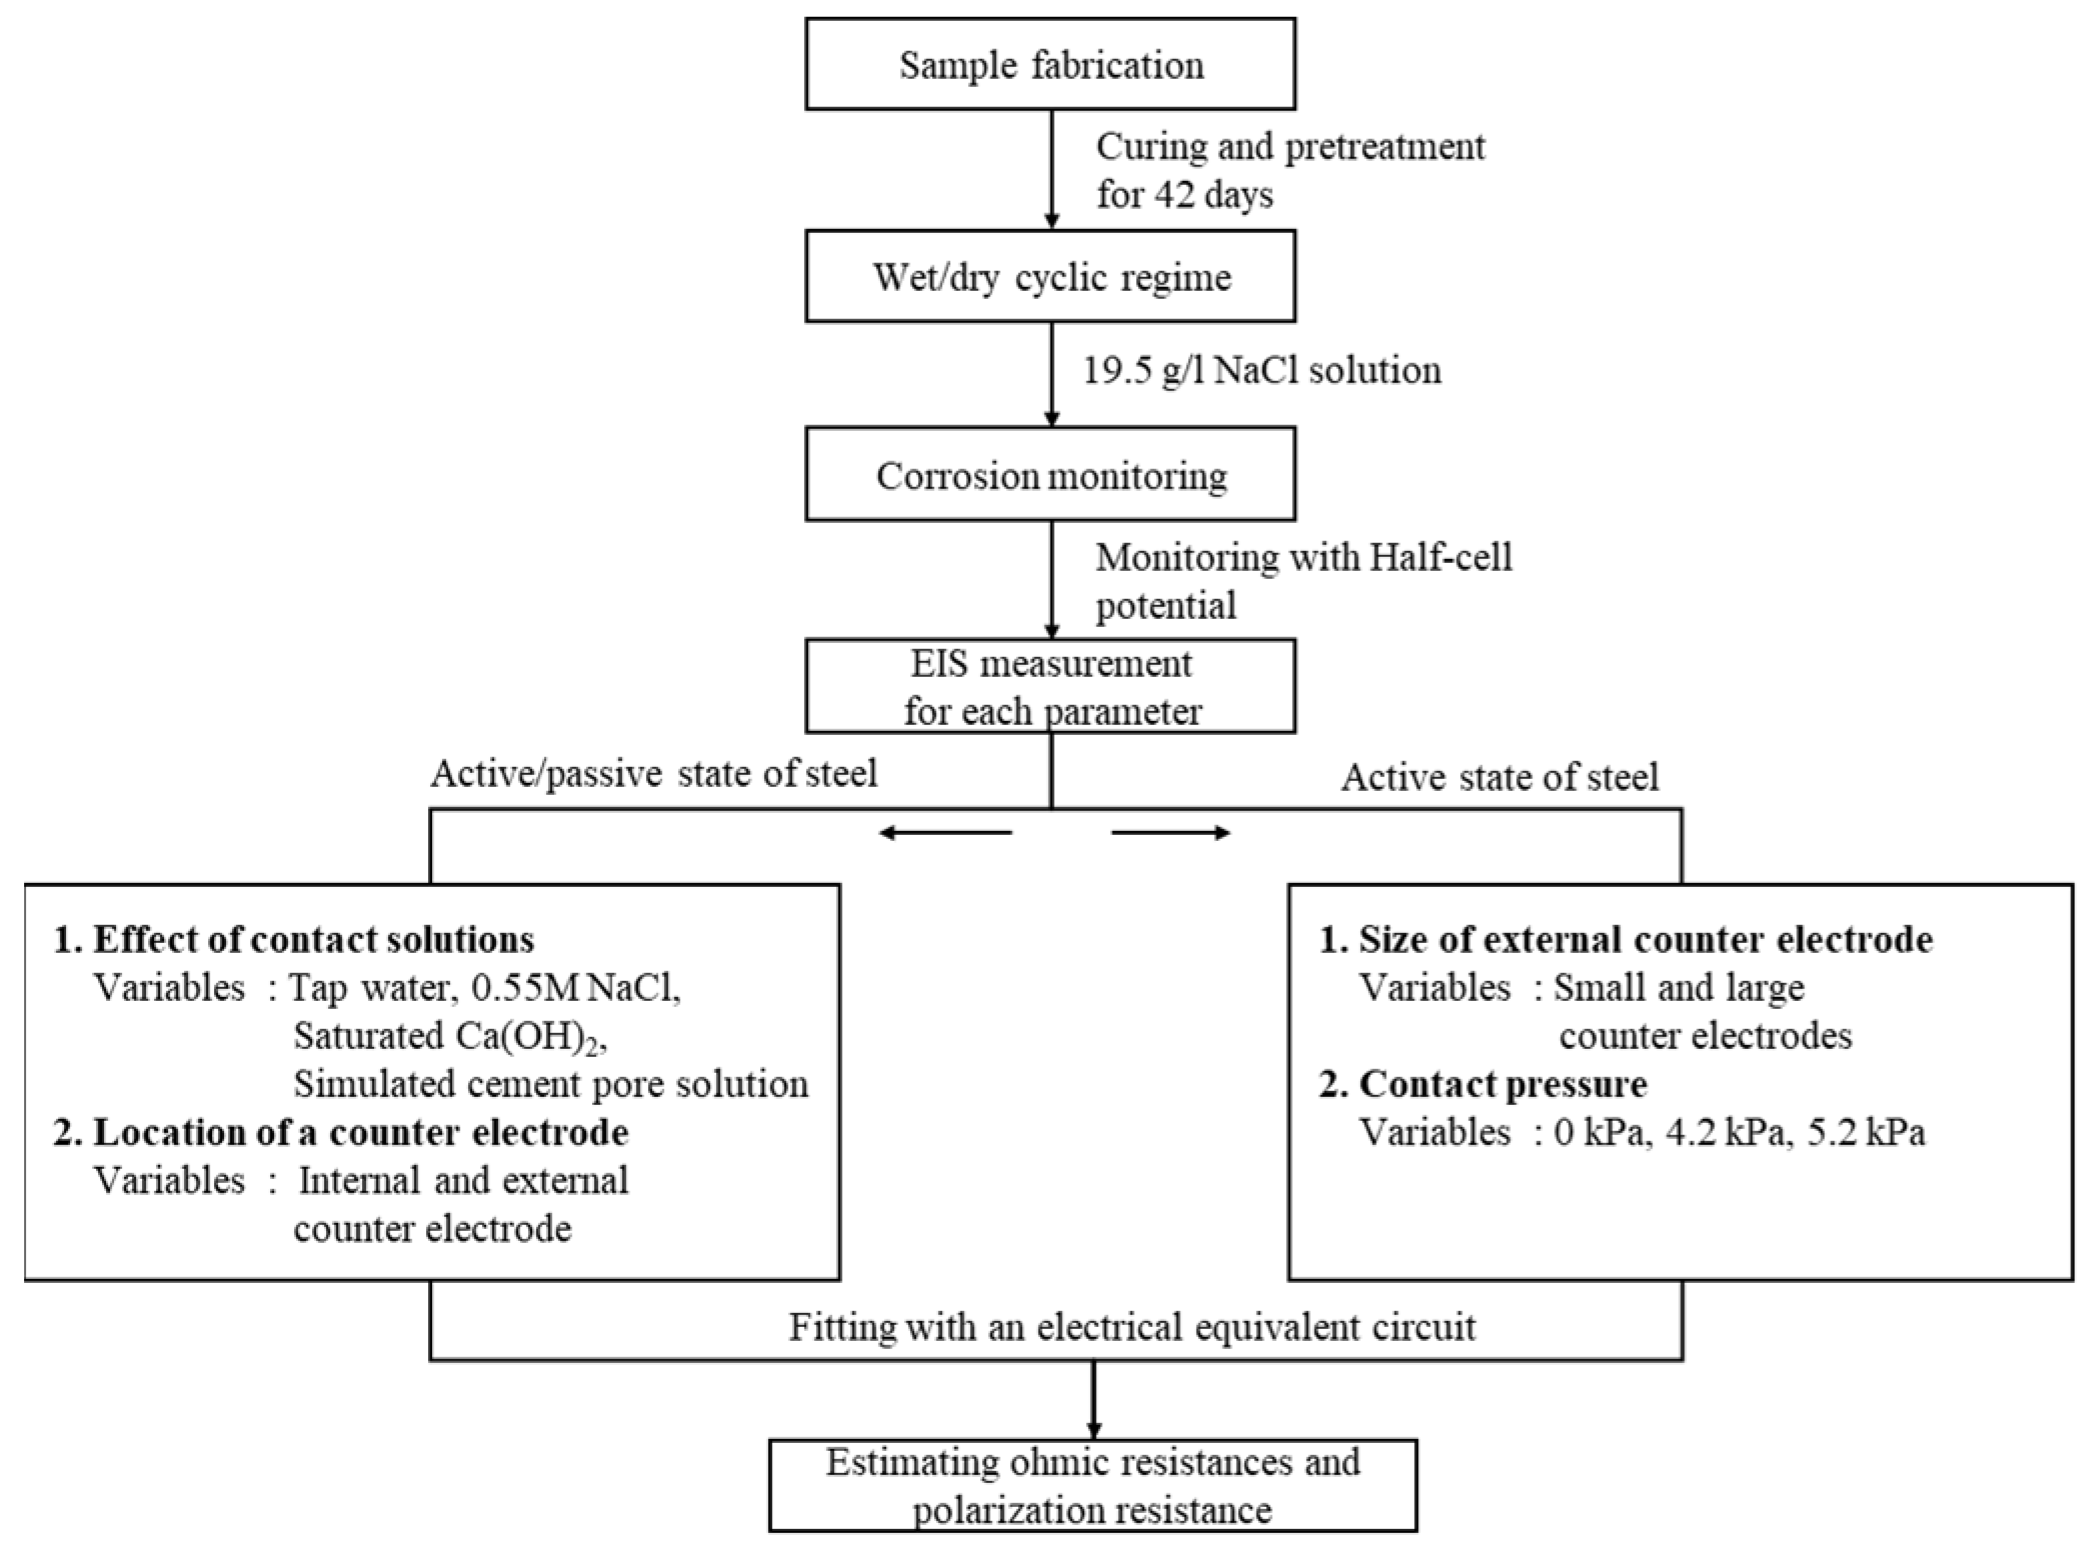
In summary, Figure 5 provides a diagrammatic representation of the experiment procedure.

4. Results and Discussion

4.1. Influences on the Interfacial Effect between the Concrete Surface and the Counter Electrode

In EIS measurements, which use an external counter electrode, electrical contact between the working and counter electrodes should be properly maintained. To improve the electrical contact, a synthetic sponge saturated with various solutions is typically used. It was confirmed that the concrete resistance was affected depending on the types of solutions used as the contact media [31,32,33]. Moreover, the contact pressure can affect considerably the determination of the concrete’s resistance [31].
As the ohmic resistance is typically considered as concrete resistance for the calculation of the corrosion rate, it is necessary to choose a proper contact medium that can affect the concrete resistance between the counter (35 × 200 mm) and working electrodes. The EIS measurements were conducted by using an external counter electrode with various solutions as the contact media, as mentioned above. The electrical impedance spectra for active (corroded steel; LS in the sample) and passive (non-corroded steel; SS in the sample) states are shown in Figure 6. For clarity, in all the figures, solid marks indicate every decade within the used frequency ranges, whereas curves are drawn by plotting all the data points. Additionally, the impedances at 100 Hz were omitted in all impedance spectra as the values spiked in all the studied sample cases. The resistance at 1 kHz, corresponding to a cusp point, multiplied by the exposed area is estimated as ohmic resistance in this study. In a passive state corresponding to SS, ohmic resistances were obtained: 13.0 for tap water, 13.2 for a saturated Ca(OH)2 solution, 13.0 for 0.55 M NaCl solution, and 14.2 kΩ·cm2 for a simulated cement pore solution, respectively. On the other hand, ohmic resistances in an active state were 14.8, 14.9, 15.0, and 16.5 kΩ·cm2 for tap water, a saturated Ca(OH)2 solution, 0.55 M NaCl solution, and a simulated cement pore solution. Even concrete resistances were estimated within one sample, but the values for the passive state were approximately 15% lower than for the active state. The difference results from the inhomogeneity of the concrete. Although it was expected that lower ohmic resistance in the active state is lower due to higher contamination of chloride or ionic movements between the cathode and anode, these local effects were not observed.
Although various contact solutions were used, it was observed that the concrete resistances with the contact media were similar (less than 3% difference) except for that in the simulated pore solution. The electrical resistances of the contact solutions themselves were not considered, as the concrete between the surface and the steel depth may have been highly contaminated by chlorides. In other words, as the pore solution in concrete attained an adequately high conductivity due to chloride ingress during the wetting period, it would be reasonable that an interfacial effect by a contact medium could be canceled out, even though a solution with a high electrical resistance (such as tap water) was used. It was observed that the resistances using the simulated cement pore solution at 1 kHz in both steel conditions were approximately 10% higher than those of other solutions. It may seem that the electrical resistance of the contact medium increased by the diffusion of dissolved alkali ions into the concrete sample, and led to a decrease in ionic contents which were present in the contact medium. The conductivity of KOH or NaOH solutions was higher than that of the NaCl solution at the same concentration, but the influences on the bulk resistance were marginal as the sample used in this study had already been highly contaminated by chloride, and, given the high solubility of the alkali solution, only led to an increase in resistance.
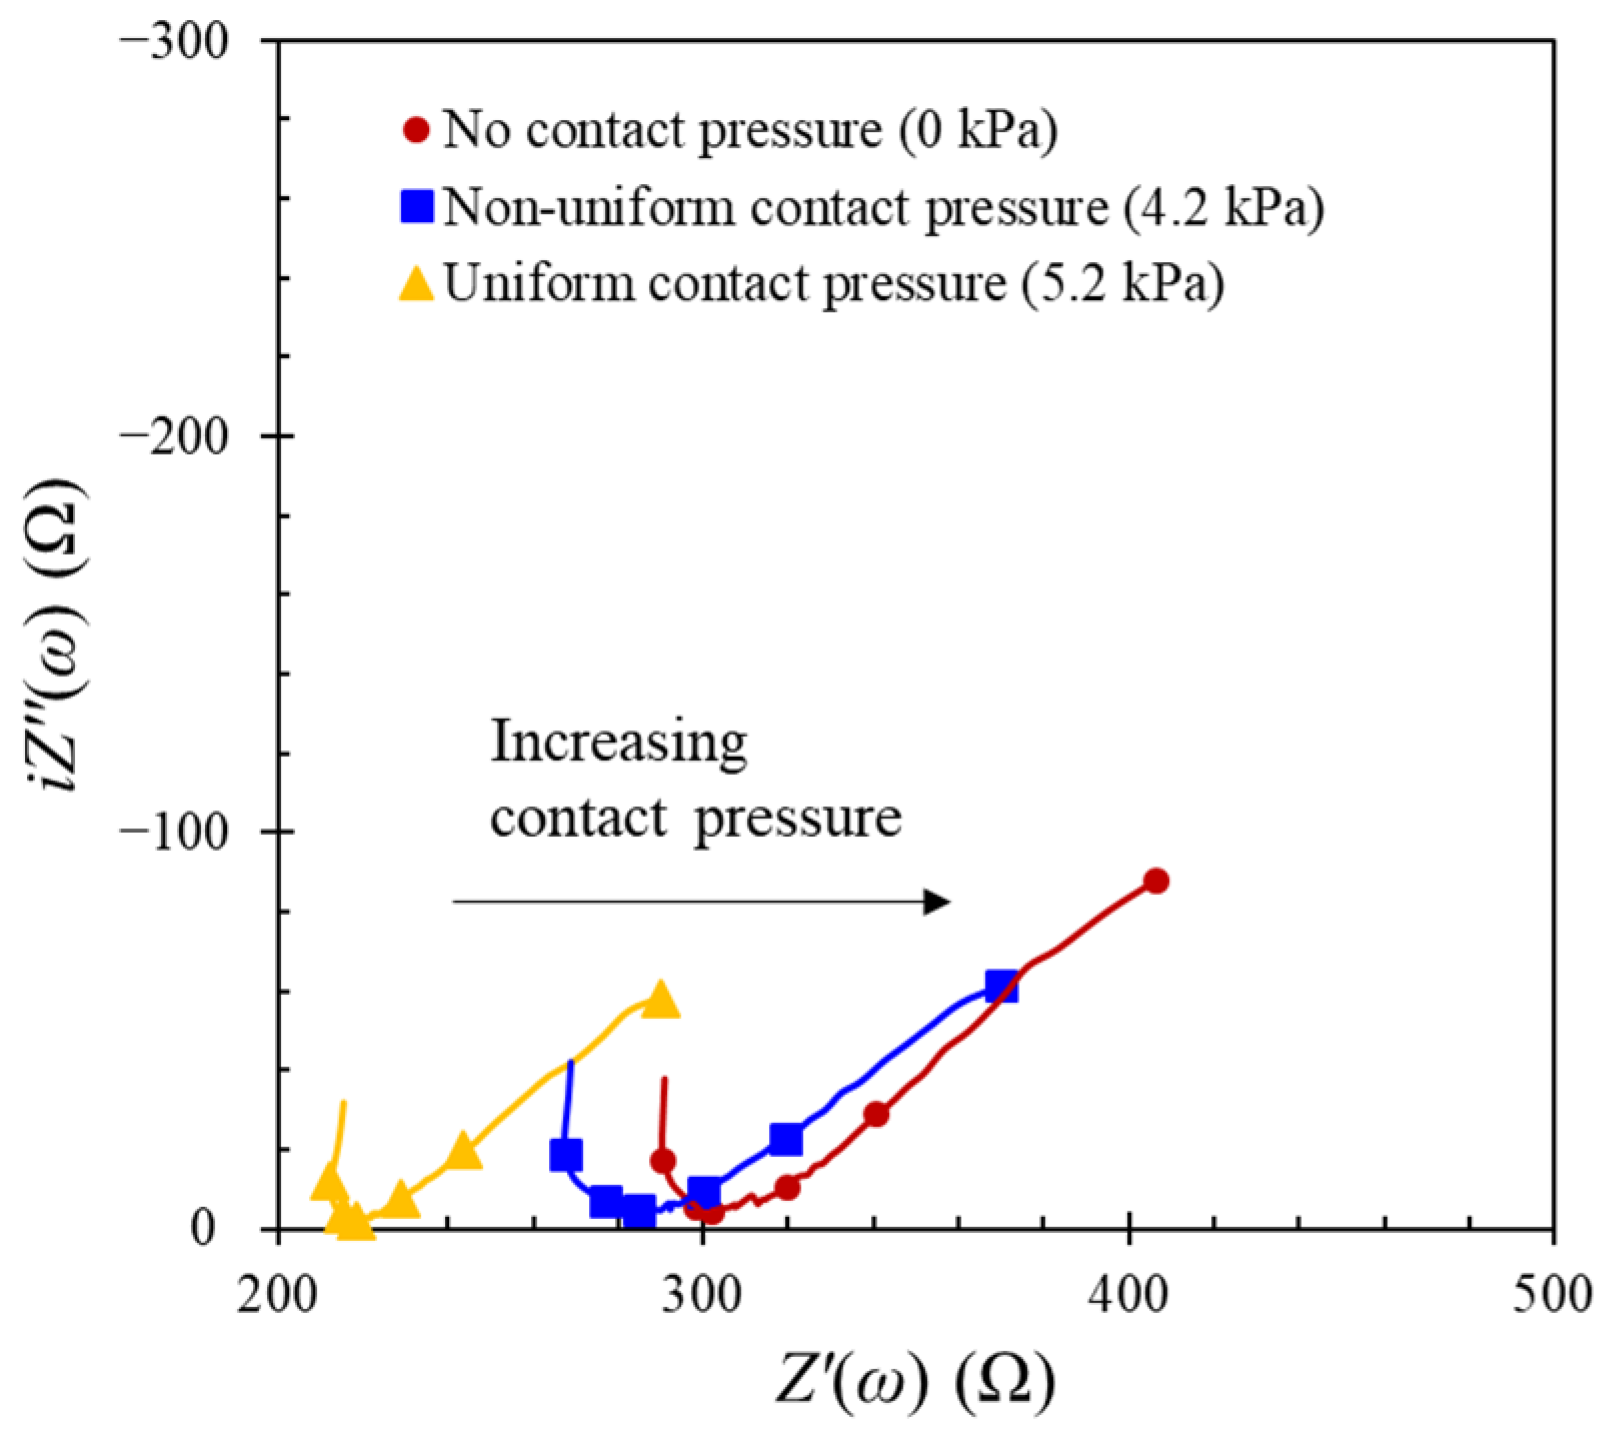
In addition to contact media, contact pressure also affected the resistance at the high-frequency arc [31]. Figure 7 shows the electrical impedance spectra for active states at different pressures corresponding to 0 Pa, 4.2 kPa (nonuniform pressure), and 5.6 kPa (uniform pressure). It was observed that lower contact pressures caused increases in the resistance of the high-frequency arc. Additionally, as the contact pressure decreases, a transition point between high-frequency and low-frequency arcs becomes unclear. It was indicated that an interfacial effect existed between the concrete’s surface and the sponge, as reported in a previous study [32]. It could be considered that this resistance can be an artefact in the estimation of the pure resistance of bulk concrete. However, when the ohmic resistance is estimated with the same experimental setup, the resistance, including the bulk concrete and interfacial resistances, could be considered as the compound ohmic resistance.

4.2. Influences on Electrode Positions

It is well known that in active states, the self-confinement of the electrical field makes the determination of the true corrosion rate difficult [34]. Figure 8 also shows the electrical impedance spectrum for LS at different sizes of the counter electrode stainless plates (35 × 100 and 35 × 200 mm). Although different sizes of counter electrodes were used, the impedance responses were almost similar, especially in the low-frequency arc, thus accounting for the steel response. For comparison purposes, when using counter electrode sizes to calculate polarization resistance, the corrosion rate associated with the use of a small counter electrode was twice as high as that used for the large counter electrode. The current applied to the working electrode was concentrated on the corrosion spot which had the lowest polarization resistance on the steel [35]. This would lead to a considerable error when the corrosion rate was calculated based on the electrical measurements, especially in pitting corrosion. To overcome this limitation, the empirical values suggested for the estimation of the corrosion rate in pitting corrosion ranged from four to eight [36]. As shown in Figure 8, the small counter electrode (35 × 100 mm) was only positioned on bare steel, but the large counter electrode (35 × 200 mm) covered the exposed steel and the part areas masked by heat-shrink insulation. Differences in the shapes of the high-frequency arc were observed, but the cusp points were similar for the small electrode (resistance = 203.85 Ω) and large electrode (resistance = 199.46 Ω) at 1 kHz. Considering the exposed area of steel, the resistance of the large electrode was 50% higher than that of the small electrode. It seems that the estimation of the polarized area is limited in its capacity to determine the true value.
Many studies have used different types of counter electrodes for corrosion measurements, as shown in Table 1. Among them, there is a study on the differences between the external and the internal counter electrodes. Provided that the concrete sample is immersed or placed in saturated environments, any types can be used owing to the high electrical connection. However, concrete structures are mostly unsaturated and exposed to the atmosphere from a practical viewpoint. In the field, a small external counter electrode is also preferred owing to the considerations of its portability and practical use; however, an error can be involved attributed to various factors (contact media, electrical connection between the concrete and electrode, and the estimation of a polarized area), as described above. Meanwhile, noble materials are used for the counter electrodes in the lab; this is beneficial as they prevent corrosion in the cases of the premixed chloride or applied current methods, and because they are directly embedded into concrete to secure intimate electrical contact. This method seems to be impractical in the field because electrodes are costly and it is difficult to install embedded electrodes directly.
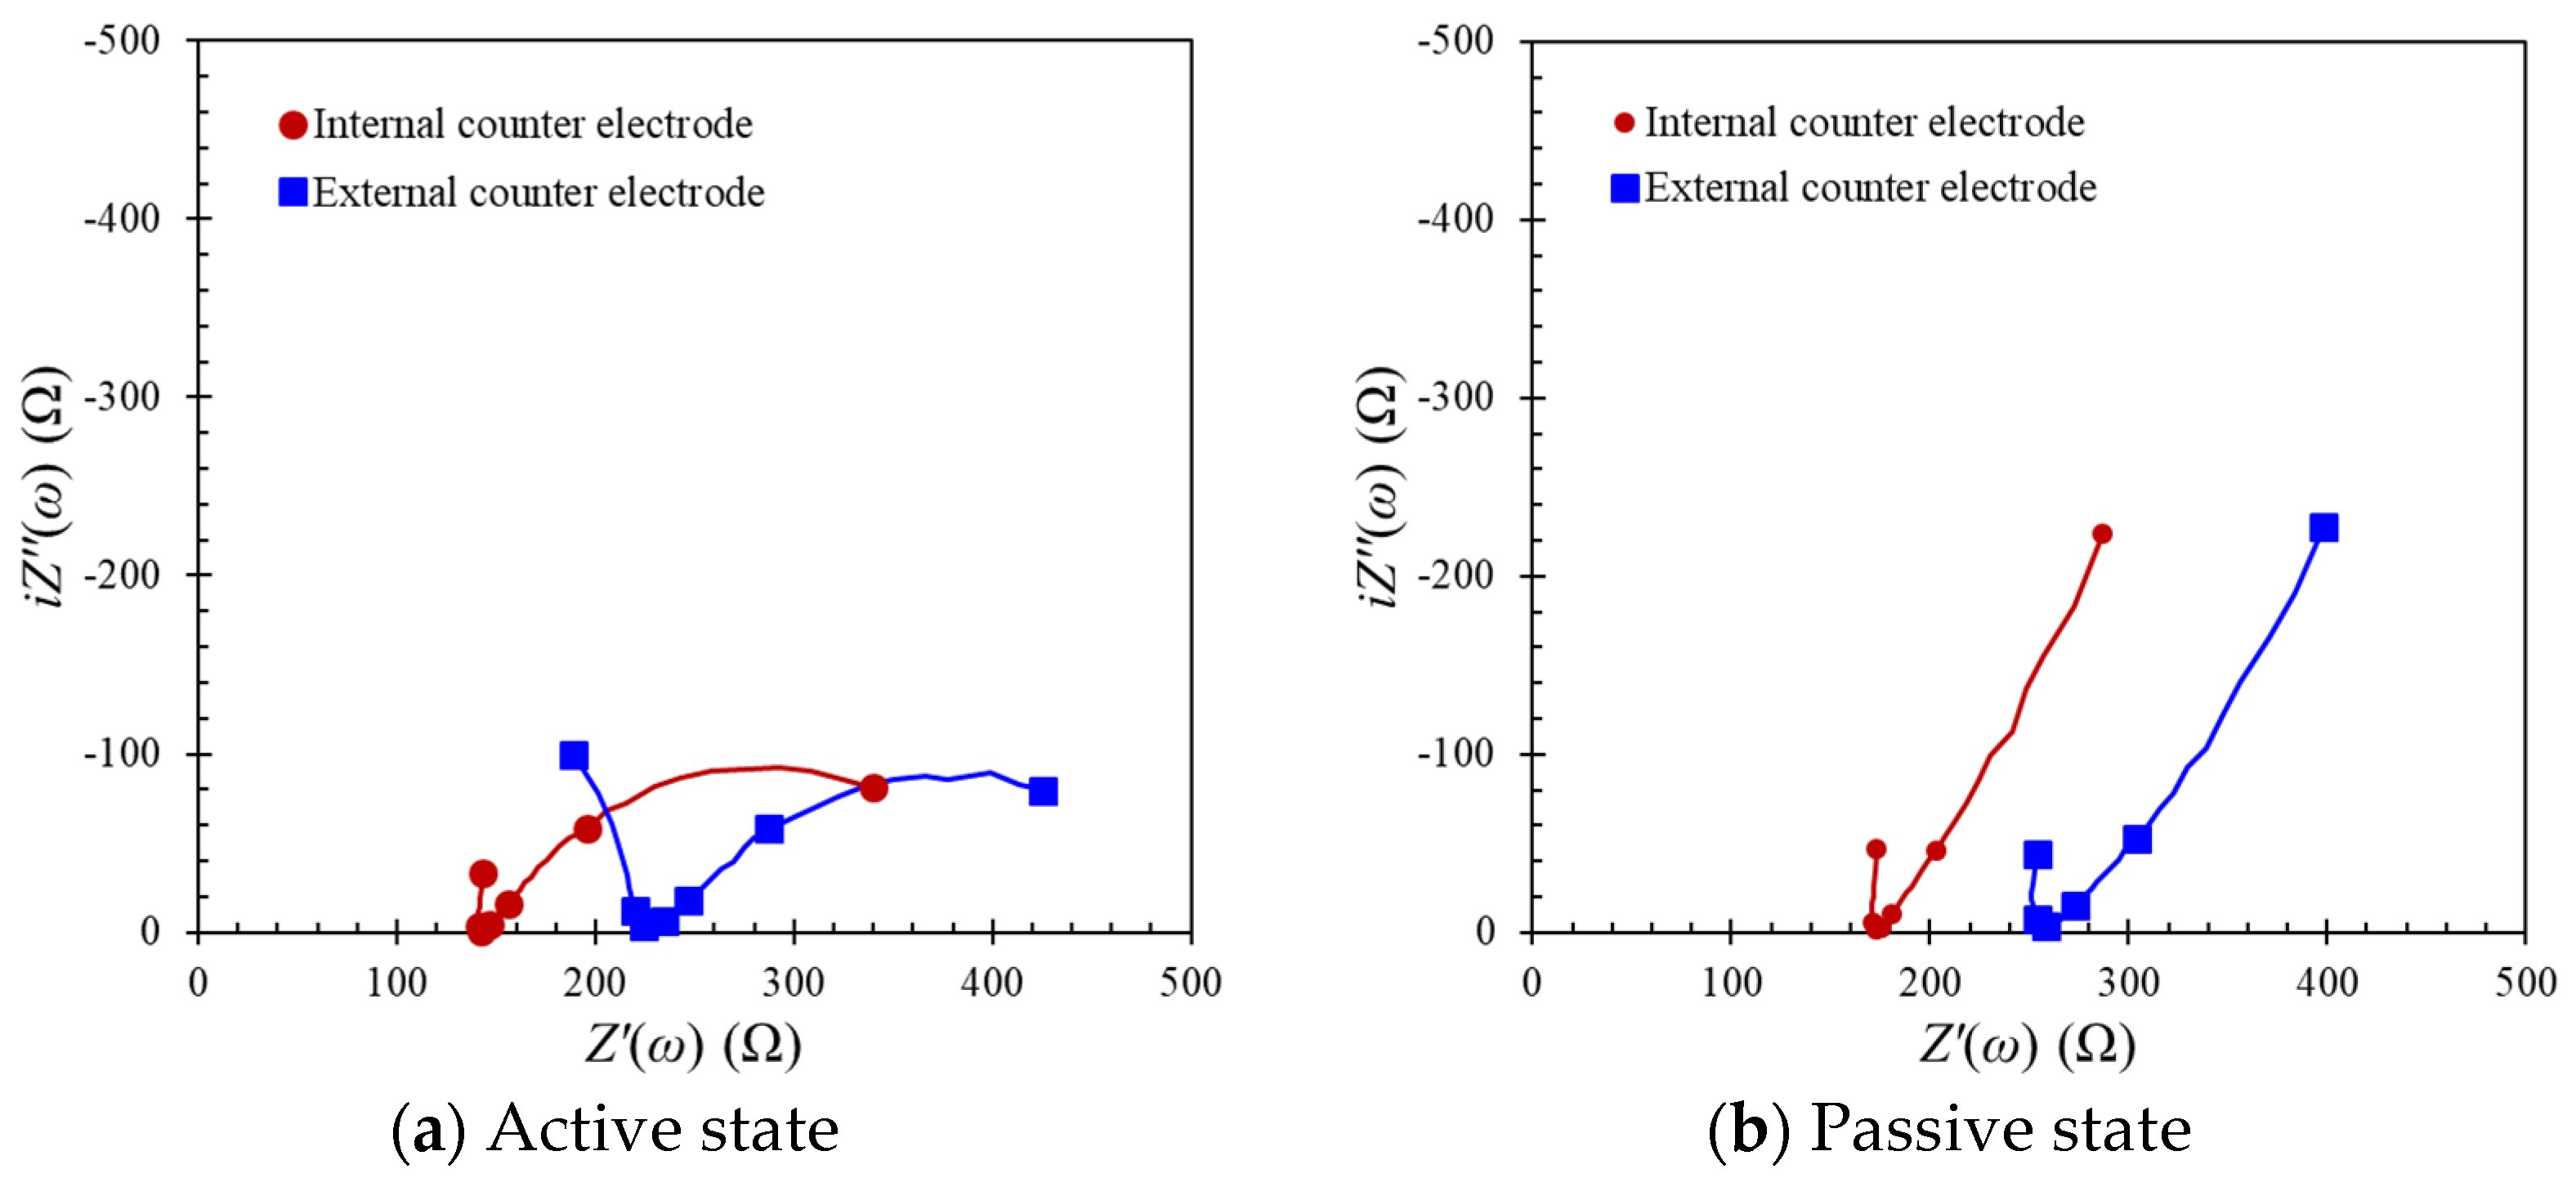
Figure 9 indicates the impedance spectra at different counter electrode locations. Firstly, in a passive state, the resistance of the high-frequency arc which used the internal counter electrode (resistance = 173.03 Ω at 1 kHz) was considerably lower than that which used the external counter electrode (resistance = 258.98 Ω at 1 kHz); in an active state, the resistances were also 142.54 Ω and 224.21 Ω for the internal and external counter electrodes at 1 kHz, respectively. It was shown that the differences of resistances were made depending on the counter electrode locations in both a passive and active state. The reasons were the following: (1) different moisture distributions in concrete, (2) interfacial effects for the external counter electrode, and (3) different polarized areas (the main factor as described above).
In the case of the low-frequency arc, the curve seems to be a line rather than a part of the semicircle in both types of counter electrodes in a passive state; however, it is notable that the slopes (in the frequency range of 100 to 1 Hz) were −1.19 and −1.59 in the cases of the external and internal electrodes, respectively. It is interesting that chloride ions penetrated into concrete affect formation of low-frequency arc. According to Bisquert et al. [37], a protective film formed on the electrode; this hindered the injected ions from reaching the steel, and the impedance response thus consisted of one line (slope = −1) which intersected another line (slope > −1).
On the other hand, it was confirmed that in an active state, the low-frequency arcs were formed in both types of counter electrodes, and the slopes (in the frequency range of 100 to 1 Hz) were −0.81 and −1.21 for the external and internal electrodes. A decrease in the slope (<−1) is associated with an increase in the steel’s roughness, i.e., depassivation or accumulation of corrosion products. In short, for chloride-induced corrosion, the slope was equal to −1 when the concentration gradient of chloride was formed; subsequently, the depassivation process led to a continuous decrease in the slope’s value. For example, a Warburg impedance in this frequency range was estimated to calculate the diffusion coefficient [38]. This may imply that the difference in the slope in the cases in which the internal and external electrodes were used was attributed to whether the concentration gradient between the working and counter electrodes was formed or not. Thus, it is notable that chloride penetration is somewhat evaluated with the change of the slope in the low-frequency range, but it should also be considered that the slope is affected by steel conditions as well as chloride ions.

4.3. EIS Analysis

Various electrical equivalent circuits have been proposed; however, one of the characteristics in these circuits is ambiguous, thus leading to interpretation difficulties. In other words, the measured impedance data can be fitted to not only to one circuit, but to several circuits. A complex circuit, e.g., a transmission line, maybe more accurate in fitting the data. Conversely, simplified circuits can easily describe mechanistic behavior, but the accuracy is sometimes low.
In this study, one simple electrical circuit proposed by the previous studies was extended instead of introducing new ones. As shown in Figure 10, the electrical circuit was thus used for all impedance spectra, irrespective of the steel condition and counter electrode types. The circuit involved four series which consisted of a parallel R-CPE combination. The physical meanings indicate the properties of bulk concrete representing RConc and CPEConc, properties of interfacial effects between the concrete and electrode representing RIF and CPEIF, properties of corrosion products or a passive film representing RCP and CEPCP, and properties of steel representing RSteel and CPESteel, respectively. First, two sets corresponded to an ohmic resistance (high-frequency arc) in the impedance spectra, and the other two sets corresponded to polarization resistance (low-frequency arc). The concrete response (high-frequency arc) was subdivided into the interfacial effect in the frequency ~1 kHz to 100 kHz and bulk concrete resistance (>~100 kHz). The steel responses (low-frequency arc) involved corrosion products or a passive film ranging up to c.a. 1 Hz, and the response regarding the charging transfer ranged from c.a. 1 Hz to a low-frequency limit.
Although it was reported that the low-frequency tail attributed to diffusion control was present in chloride-induced corrosion processes [39], the electrical response cannot be extracted directly because ‘a straight line’ response was only confirmed without a defined semicircle. Note that this electrical circuit cannot be unique, but it is believed that a simplified one can be useful to refine the understanding of the phenomenon because of accessibility. The simulated values for impedance data are tabulated in Table 5 for both passive and active states. To estimate the corrosion rate, the ohmic and polarization resistances are required. For comparison purposes, the simulated values for resistance were multiplied by the exposed area; in the case of the CPE coefficient, they were divided by the exposed area.
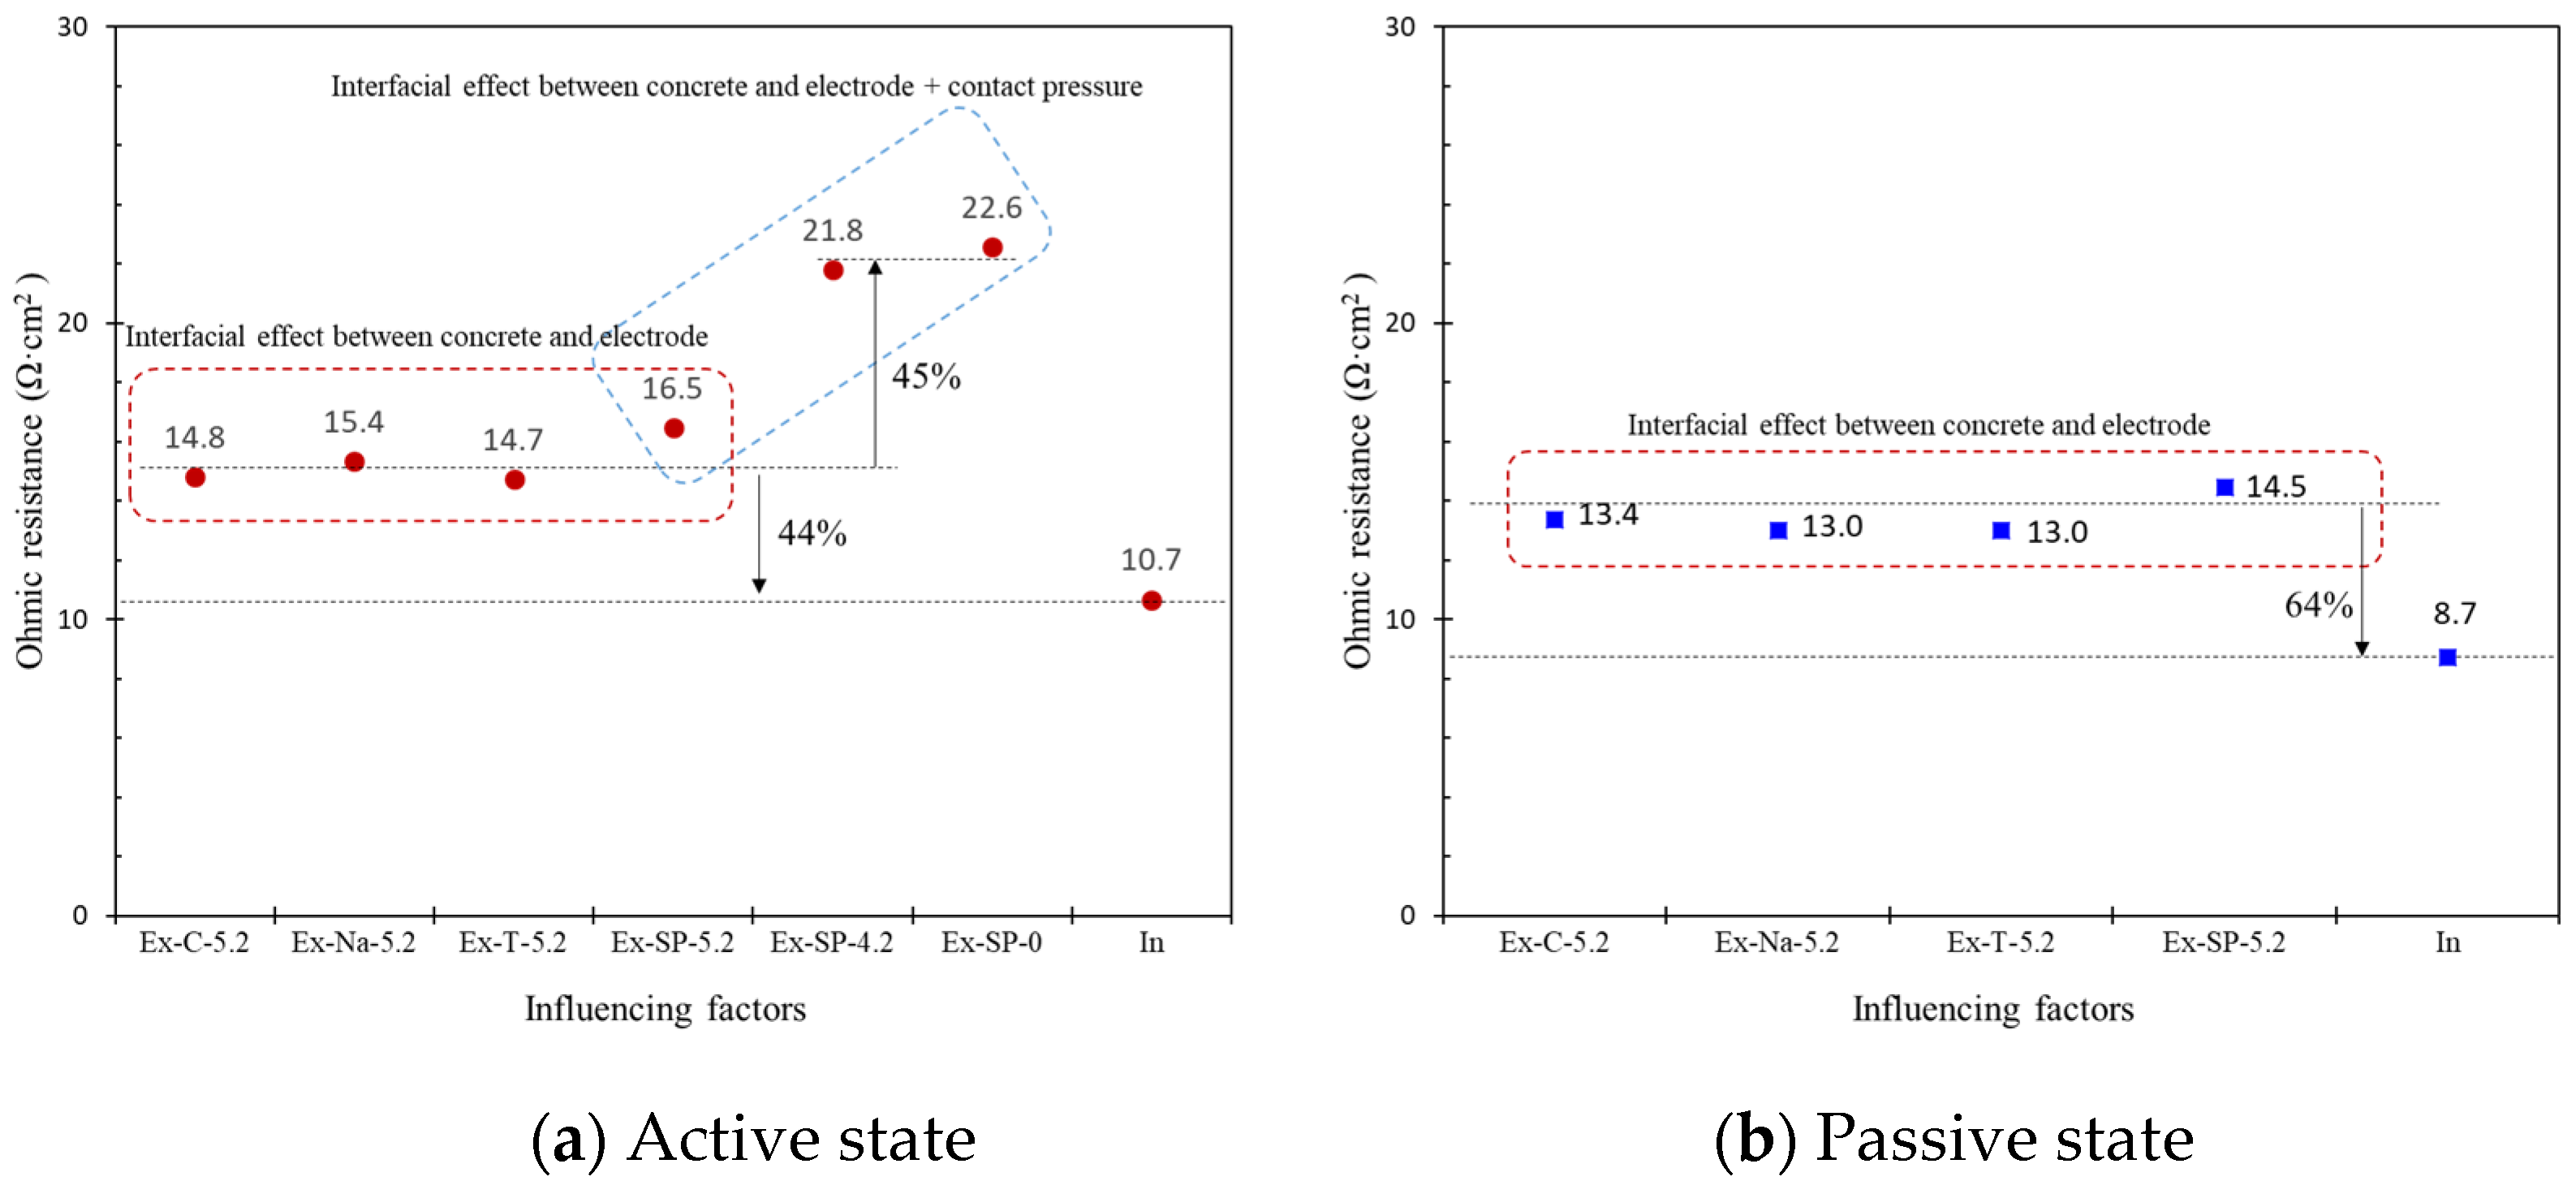
Figure 11 shows the ohmic resistance variation for different variables in the passive and active states based on considerations of the exposed area. The ohmic resistance of the SS part ranged from 8.7 to 14.5 kΩ·cm2, and was lower than that of the LS part, which ranged from 10.7 to 16.5 kΩ·cm2 except for contact pressure. The high values in the resistance of the LS part may result in the estimation of the polarized area caused by the lengthy working electrode. On the other hand, provided that ohmic resistance measured with internal counter electrodes are reference values (10.7 kΩ·cm2 and 8.7 kΩ·cm2 for active and passive states), the most important consideration is intimate contact between the concrete and electrode electrically. As shown in the results, although the various contact solutions were used for electrical connection between the concrete and the external counter electrode, the ohmic resistance in the cases of external counter electrodes were higher (>~50%) than that in the cases of internal counter electrodes. It is possible to induce additional errors when contact is not made appropriately with contact pressure. Considering the external counter electrode, the effect on the contact medium was less sensitive compared with other factors.
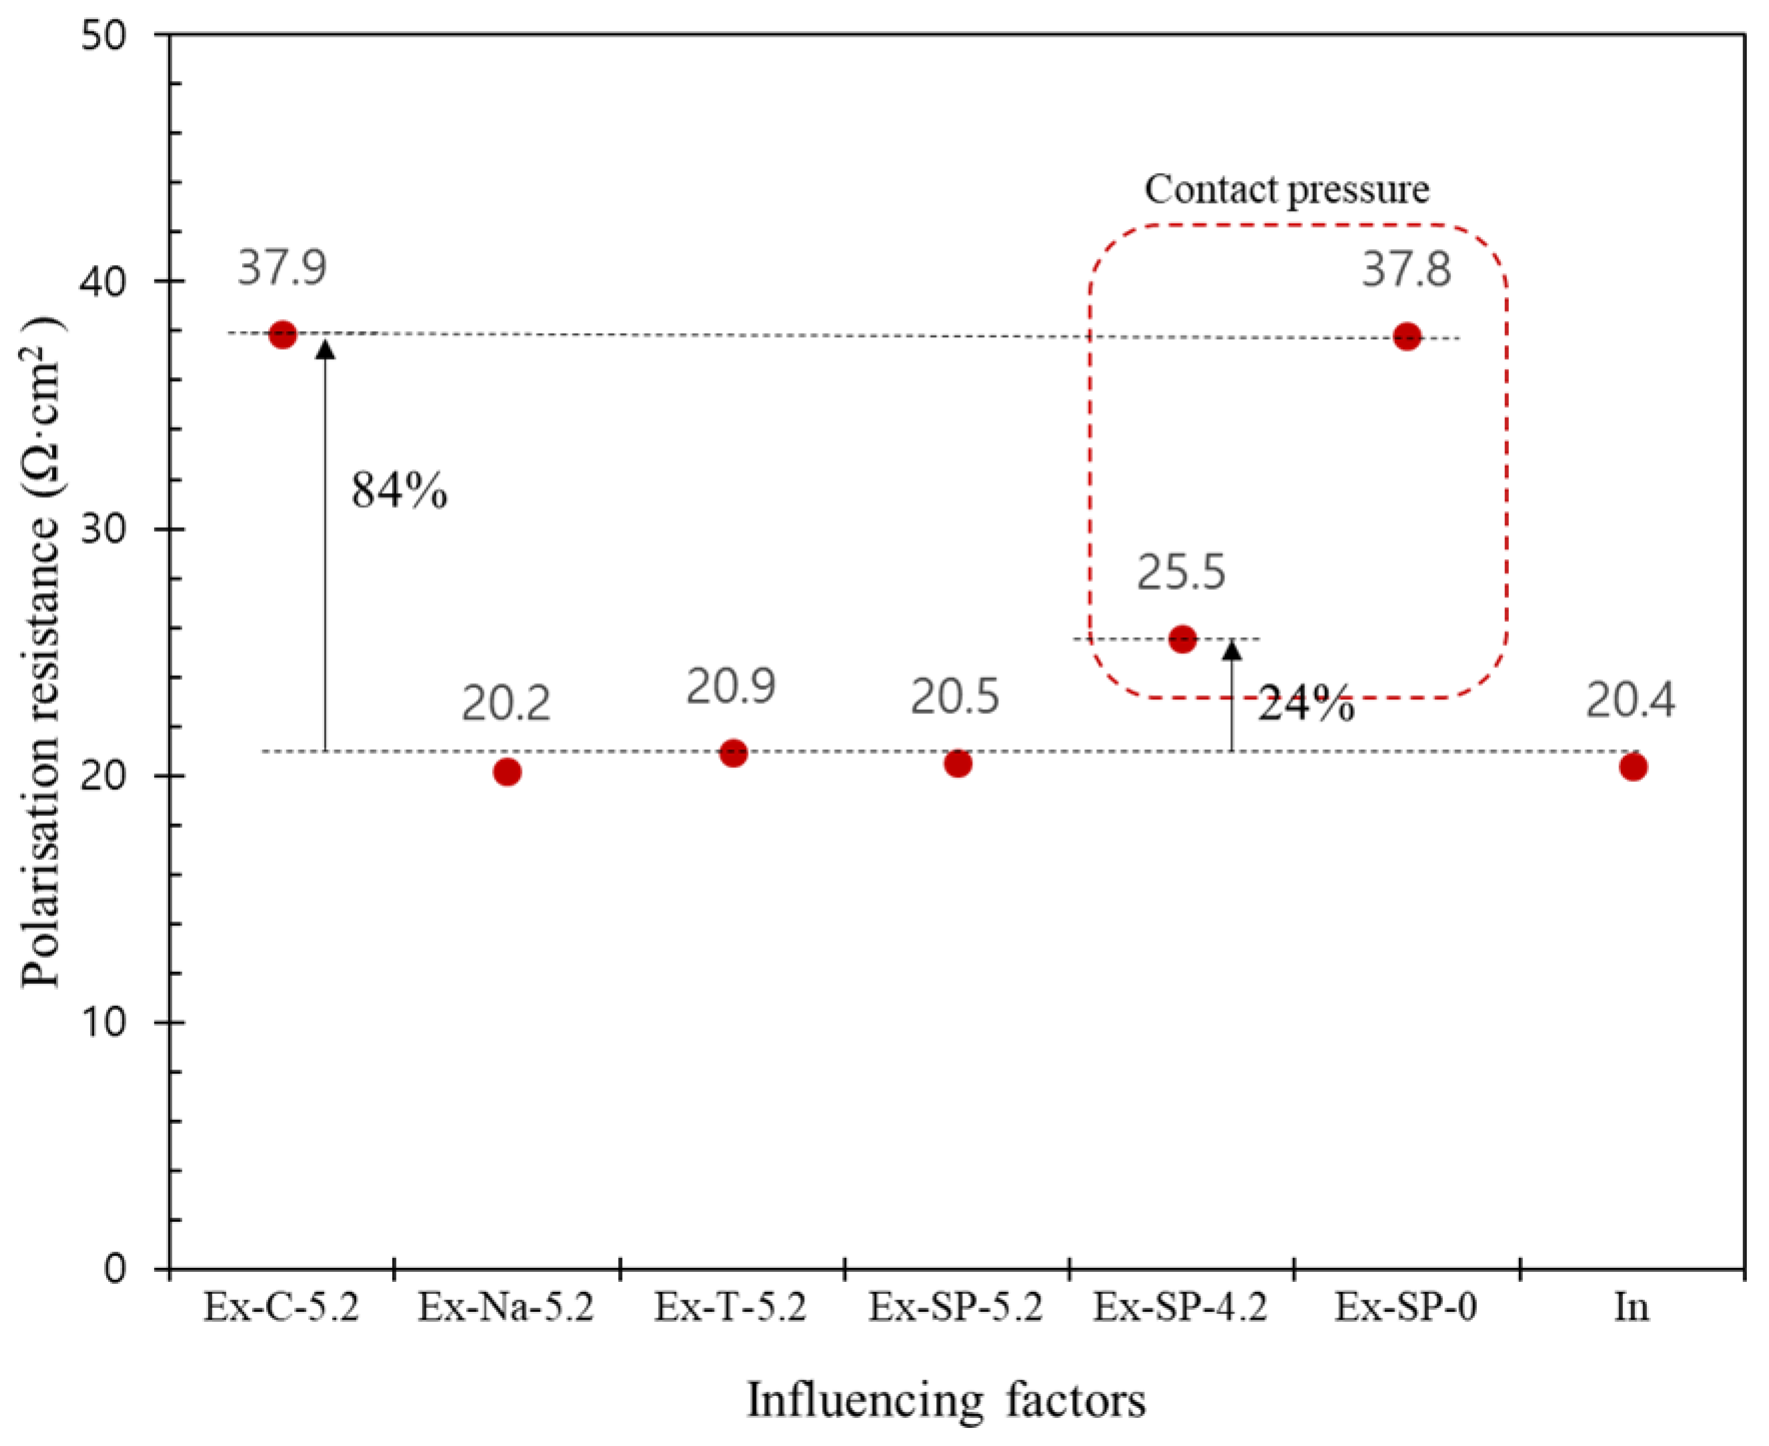
The polarization resistance was only described in the active state because the values in the passive state cannot be quantified, as shown in Figure 12. Unlike ohmic resistance, it was observed that the polarization resistances were less affected by the locations of the counter electrode. The contact pressure owing to weight is highly influential on the estimation of ohmic resistance. Among contact media, the resistance obtained from saturated Ca(OH)2 was higher than others. Although it is still unclear, it may be possible that the impedance response is not adequately low to reach the characteristic frequency. Thus, errors were involved in the simulation process.
Prior to EIS measurements, corrosion potentials were monitored with a copper–copper sulfate (CSE) electrode (refer to Figure 5). The measured potentials were −442.3 mV and −135.5 mV for the active state of steel (LS part) and the passive state of steel (SS part), respectively. According to ASTM C 876 [16], a corrosion threshold potential is −350 mV for a CSE electrode. Thereby, it was apparent that the LS part was corroded and the SS part was non-corroded with the corrosion threshold potential. The corrosion rate was estimated with the traditional B value (26 mV for the active state), ranging from 6.9 mA/m2 to 12.9 mA/m2. This indicated that corrosion of steel was severe. To reduce errors induced in corrosion measurement, an electrical connection should be made properly between the electrode and concrete. Meanwhile, it is also apparent that the polarized area, i.e., the electrode size, is of importance to estimate the corrosion rate in pitting corrosion (refer to Figure 8).
It is very difficult that time-to-corrosion initiation is estimated in reinforced concrete structures. As shown in this paper, steel states were different within the same sample due to the inhomogeneity of steel. In other words, to improve the accuracy of corrosion measurement, the errors caused by the controlled variables should be firstly minimized owing to the presence of uncontrolled factors such as steel and concrete inhomogeneities.

5. Conclusions

EIS measurements were conducted for steel embedded in concrete in a chloride environment in various conditions. First, it was confirmed that considerable variations in EIS data were involved that led to complex interpretations. Hence, it is necessary to pay attention to the analysis of the EIS results. It should be noted that this suggestion is not unique to the description of the measured data for corrosion processes. The main observations of this study are as follows:
  • The impedance response with the contact media was somewhat consistent except for a simulated pore solution. In other words, when corrosion measurements are carried out, the types of contact media are not important because the ohmic resistance included both interfacial effects and concrete resistance.
  • The ohmic and polarization resistance obtained from EIS data can be used to estimate the corrosion rate. However, it is evident that additional studies in the polarized area are still required to evaluate corrosion rate accurately. Depending on the polarized area, the polarization and ohmic resistances are affected considerably.
  • From the simulated values, the influencing factors on the impedance response were ordered as contact pressure > location of counter electrode > contact media. However, it should be noted that the main factor was the estimation of the true polarized area required for the determination of the polarization resistance.

Author Contributions

J.K., conceptualization, methodology, data curation, investigation, formal analysis, writing—original draft preparation, and writing—review and editing. K.-T.P., formal analysis, conceptualization, funding acquisition. T.H.K., methodology, visualization, writing—original draft preparation. All authors have read and agreed to the published version of the manuscript.

Funding

Research for this paper was carried out under the KICT Research Program (project no. 20220217-001, Development of DNA-based smart maintenance platform and application technologies for aging bridges) funded by the Ministry of Science and ICT.

Institutional Review Board Statement

Not applicable.

Informed Consent Statement

Not applicable.

Data Availability Statement

Not applicable.

Conflicts of Interest

The authors declare no conflict of interest.

References

  1. Taffesea, W.Z.; Sistonen, E. Service life prediction of repaired structures using concrete recasting method: State-of-the-art. Procedia Eng. 2013, 57, 1138–1144. [Google Scholar] [CrossRef]
  2. Tuutti, K. Corrosion of Steel in Concrete; CBI Betonginstitutet AB: Borås, Sweden, 1982; pp. 6–15. [Google Scholar]
  3. Austin, S.A.; Lyons, R.; Ing, M. Electrochemical behaviour of steel reinforced concrete during accelerated corrosion testing. Corrosion 2004, 60, 203–212. [Google Scholar] [CrossRef]
  4. Chang, C.W.; Tsai, C.A.; Shiau, Y.C. Inspection of steel bars corrosion in reinforced concrete structures by nondestructive ground penetrating radar. Appl. Sci. 2022, 12, 5567. [Google Scholar] [CrossRef]
  5. Feliu, V.; González, J.A.; Andrade, C.; Feliu, S. Equivalent circuit for modelling the steel-concrete interface. I. Experimental evidence and theoretical predictions. Corros. Sci. 1998, 40, 975–993. [Google Scholar] [CrossRef]
  6. Elsener, B. Macrocell corrosion of steel in concrete—Implications for corrosion monitoring. Cem. Concr. Compos. 2002, 24, 65–72. [Google Scholar] [CrossRef]
  7. Deus, J.M.; Díaz, B.; Freire, L.; Nóvoa, X.R. The electrochemical behaviour of steel rebars in concrete: An electrochemical impedance spectroscopy study of the effect of temperature. Electrochim. Acta 2014, 131, 106–115. [Google Scholar] [CrossRef]
  8. Bautista, A.; Paredes, E.C.; Velasco, F.; Alvarez, S.M. Corrugated stainless steels embedded in mortar for 9 years: Corrosion results of non-carbonated, chloride-contaminated samples. Constr. Build. Mater. 2015, 93, 350–359. [Google Scholar] [CrossRef] [Green Version]
  9. Polder, R.B.; Peelen, W.H.A. Characterisation of chloride transport and reinforcement corrosion in concrete under cyclic wetting and drying by electrical resistivity. Cem. Concr. Compos. 2002, 24, 427–435. [Google Scholar] [CrossRef]
  10. Sosa, M.; Pérez-López, T.; Reyes, J.; Corvo, F.; Camacho-Chab, R.; Quintana, P.; Aguilar, D. Influence of the marine environment on reinforced concrete degradation depending on exposure conditions. Int. J. Electrochem. Sci. 2011, 6, 6300–6318. [Google Scholar]
  11. Pereira, E.V.; Salta, M.M.; Fonseca, I.T.E. On the measurement of the polarisation resistance of reinforcing steel with embedded sensors: A comparative study. Mater. Corros. 2015, 65, 1029–1038. [Google Scholar] [CrossRef]
  12. Sánchez-Moreno, M.; Takenouti, H.; García-Jar No, J.J.; Vicente, F.; Alonso, C. A theoretical approach of impedance spectroscopy during the passivation of steel in alkaline media. Electrochim. Acta 2009, 54, 7222–7226. [Google Scholar] [CrossRef]
  13. Ghods, P.; Isgor, O.B.; Mcrae, G.A.; Gu, G.P. Electrochemical investigation of chloride-induced depassivation of black steel rebar under simulated service conditions. Corros. Sci. 2010, 52, 1649–1659. [Google Scholar] [CrossRef]
  14. Chen, Y.-M.; Orazem, M.E. Impedance analysis of ASTM A416 tendon steel corrosion in alkaline simulated pore solutions. Corros. Sci. 2016, 104, 26–35. [Google Scholar] [CrossRef]
  15. Kot, P.; Muradov, M.; Gkantou, M.; Kamaris, G.S.; Hashim, K.; Yeboah, D. Recent advancements in non-destructive testing techniques for structural health monitoring. Appl. Sci. 2021, 11, 2750. [Google Scholar] [CrossRef]
  16. ASTM C876-15; Standard Test Method for Corrosion Potentials of Uncoated Reinforcing Steel in Concrete. ASTM: West Conshohocken, PA, USA, 2015.
  17. Andrade, C.; Soler, L.; Alonso, C.; Nbvoa, X.R.; Keddamt, M. The importance of geometrical consideration in the measurement of steel corrosion in concrete by means of AC impedance. Corros. Sci. 1995, 37, 2013–2023. [Google Scholar] [CrossRef]
  18. Videm, K. Electrochemical studies of steel in cement mortar containing chloride and micro-silica. Corros. Sci. 2007, 49, 1702–1717. [Google Scholar] [CrossRef]
  19. Montemor, M.; Simões, A.M.; Ferreira, M.G. Chloride-induced corrosion on reinforcing steel: From the fundamentals to the monitoring techniques. Cem. Concr. Compos. 2003, 25, 491–502. [Google Scholar] [CrossRef] [Green Version]
  20. Barsoukov, E.; Macdonald, J.R. Impedance Spectroscopy Theory, Experiment, and Application, 3rd ed.; John Wiley & Sons: Hoboken, NJ, USA, 2018. [Google Scholar]
  21. Stern, M.; Geary, A.L. Electrochemical polarization I. A theoretical analysis of the shape of polarization curve. J. Electrochem. Soc. 1957, 104, 56–63. [Google Scholar] [CrossRef]
  22. Choi, Y.-S.; Kim, J.-G.; Lee, K.-M. Corrosion behavior of steel bar embedded in fly ash concrete. Corros. Sci. 2006, 48, 1733–1745. [Google Scholar] [CrossRef]
  23. Pech-Canul, M.A.; Castro, P. Corrosion measurements of steel reinforcement in concrete exposed to a tropical marine atmosphere. Cem. Concr. Res. 2002, 32, 491–498. [Google Scholar] [CrossRef]
  24. Park, Z.-T.; Choi, Y.-S.; Kim, J.-G.; Chung, L. Development of a galvanic sensor system for detecting the corrosion damage of the steel embedded in concrete structure. Cem. Concr. Res. 2005, 35, 1814–1819. [Google Scholar] [CrossRef]
  25. Montemor, M.; Simões, A.M.; Salta, M. Effect of fly ash on concrete reinforcement corrosion studied by EIS. Cem. Concr. Compos. 2000, 22, 175–185. [Google Scholar] [CrossRef]
  26. Morozov, Y.; Castela, A.S.; Dias, A.P.S.; Montemor, M.F. Chloride-induced corrosion behavior of reinforcing steel in spent fluid cracking catalyst modified mortars. Cem. Concr. Res. 2013, 47, 1–7. [Google Scholar] [CrossRef]
  27. Dhouibi, L.; Triki, E.; Raharinaivo, A. The application of electrochemical impedance spectroscopy to determine the long-term effectiveness of corrosion inhibitors for steel in concrete. Cem. Concr. Compos. 2002, 24, 35–43. [Google Scholar] [CrossRef]
  28. Kranc, S.C.; Sagues, A.A. Computation of corrosion macrocell current distribution and electrochemical impedance of reinforcing steel in concrete. In Computer Modeling in Corrosion; Munn, R.S., Ed.; ASTM STP 1154; ASTM International: West Conshohocken, PA, USA, 1992; pp. 95–112. [Google Scholar]
  29. Kim, J. Monitoring Concrete Performance under Simulated and Natural Chloride Environments. Ph.D. Thesis, Heriot-Watt University, Edinburgh, UK, 2018. [Google Scholar]
  30. BS EN 197-1:2000; Cement—Part 1: Composition, Specifications and Conformity Criteria for Common Cements. BSI: London, UK, 2000.
  31. Newlands, M.; Jones, R.; Kandasami, S.; Harrison, T. Sensitivity of electrode contact solutions and contact pressure in assessing electrical resistivity of concrete. Mater. Struct. 2007, 41, 621–632. [Google Scholar] [CrossRef]
  32. McCarter, W.J.; Taha, H.M.; Suryanto, B.; Starrs, G. Two-point concrete resistivity measurements: Interfacial phenomena at the electrode–concrete contact zone. Meas. Sci. Technol. 2015, 26, 085007. [Google Scholar] [CrossRef]
  33. Wang, R.; He, F.; Shi, C.; Zhang, D.; Chen, C.; Dai, L. AC impedance spectroscopy of cement—based materials: Measurement and interpretation. Cem. Concr. Compos. 2022, 131, 104591. [Google Scholar] [CrossRef]
  34. Andrade, C.; Alonso, C. Test methods for on-site corrosion rate measurement of steel reinforcement in concrete by means of the polarization resistance method. Mater. Struct. 2004, 37, 623–643. [Google Scholar] [CrossRef]
  35. Nygaard, P.V.; Geiker, M.R.; Elsener, B. Corrosion rate of steel in concrete: Evaluation of confinement techniques for on-site corrosion rate measurements. Mater. Struct. 2009, 42, 1059–1076. [Google Scholar] [CrossRef]
  36. González, J.A.; Andrade, C.; Alonso, C.; Feliu, S. Comparison of rates of general corrosion and maximum pitting penetration on concrete embedded steel reinforcement. Cem. Concr. Res. 1995, 25, 257–264. [Google Scholar] [CrossRef]
  37. Bisquert, J.; Garcia-Belmonte, G.; Bueno, P.; Longo, E.; Bulhões, L.O.S. Impedance of constant phase element (CPE)-blocked diffusion in film electrodes. J. Electroanal. Chem. 1998, 452, 229–234. [Google Scholar] [CrossRef]
  38. Vedalakshmi, R.; Saraswathy, V.; Song, H.-W.; Palaniswamy, N. Determination of diffusion coefficient of chloride in concrete using Warburg diffusion coefficient. Corros. Sci. 2009, 51, 1299–1307. [Google Scholar] [CrossRef]
  39. Nóvoa, X.R. Electrochemical aspects of the steel-concrete system. A review. J. Solid State Electrochem. 2016, 20, 2113–2125. [Google Scholar] [CrossRef]
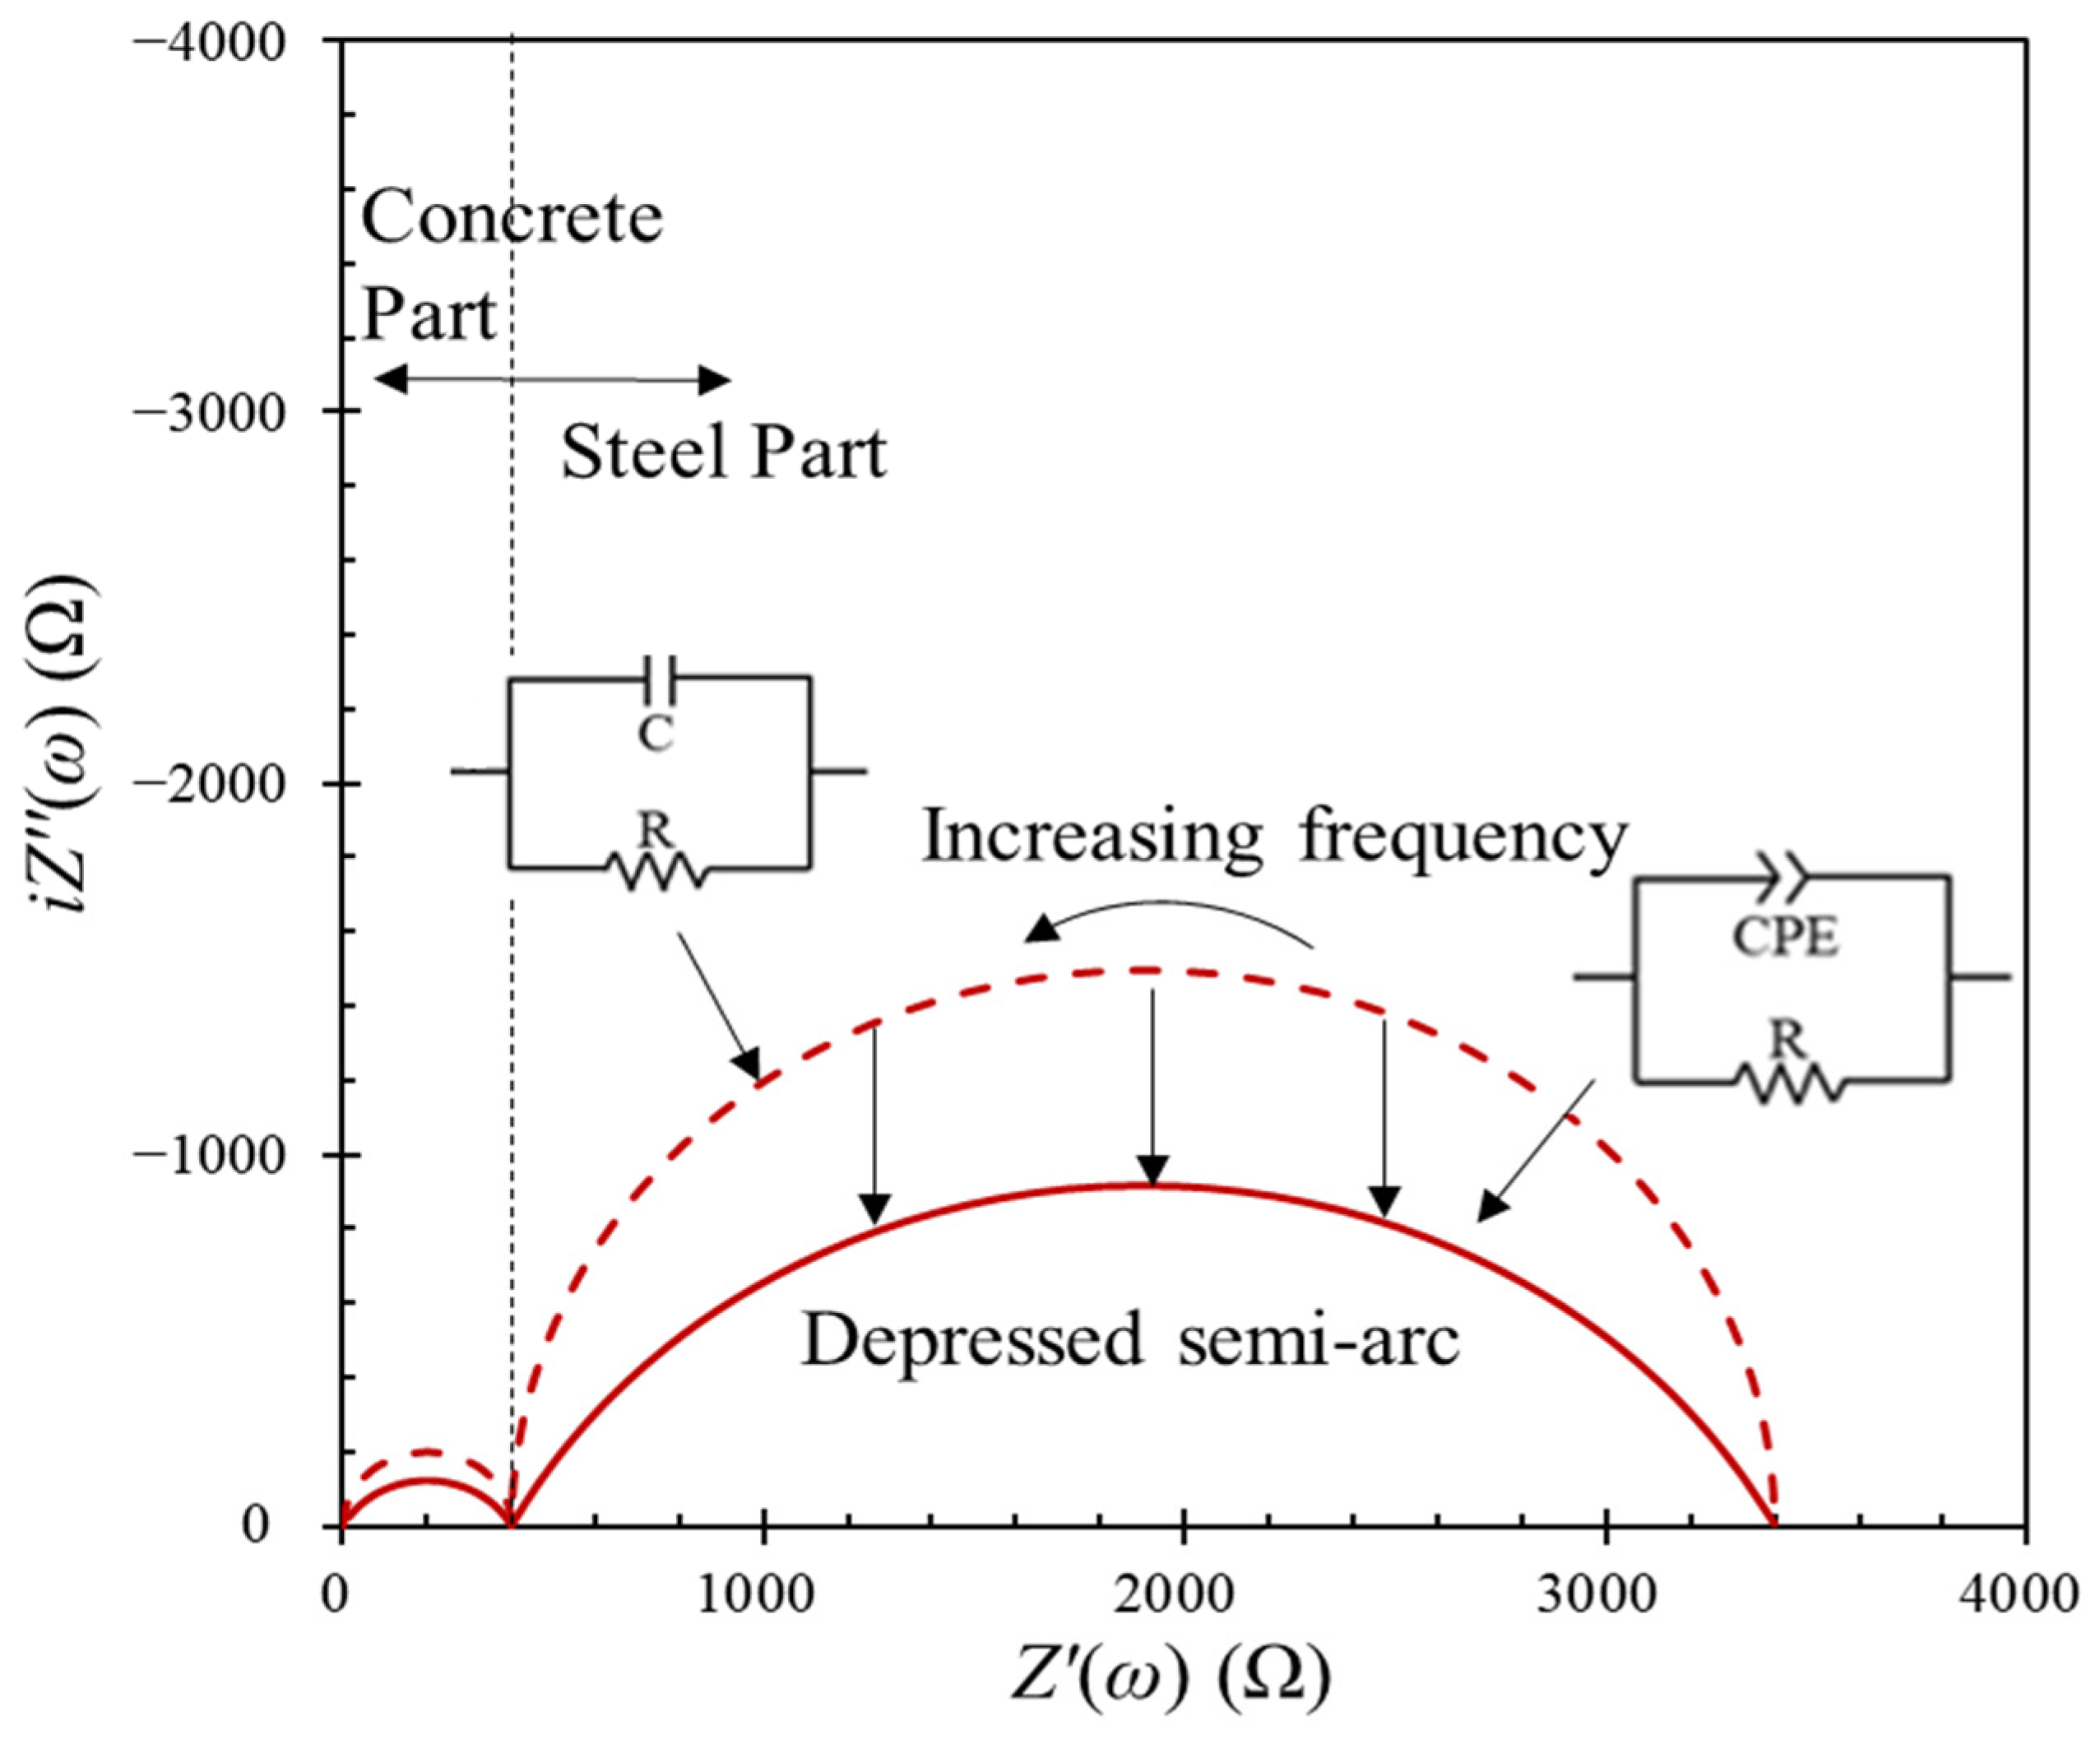
Figure 1. Example of electrochemical spectra of steel in concrete.
Applsci 12 12611 g001
Figure 2. Equivalent electrical circuits for analysis of steel corrosion in concrete/mortar: Rc, bulk concrete resistance; Rcif, resistance of concrete in intermediate frequency; CPEcif, a constant phase element of concrete in intermediate frequency; Rif, resistance in intermediate frequency; CPEif, a constant phase element in intermediate frequency; Rct, charge transfer resistance or polarization resistance; CPEdl, a constant phase element of double layer; CPEd, a constant phase element for diffusion process, and W, Warburg impedance [29].
Applsci 12 12611 g002
Figure 3. Schematics of concrete sample; steel with large exposed area, SS steel with small exposed area, CE counter electrode, and WE working electrode.
Applsci 12 12611 g003
Figure 4. Experimental setups with internal and external counter electrodes.
Applsci 12 12611 g004
Figure 5. Flow chart of the experimental procedure.
Applsci 12 12611 g005
Figure 6. Impedance spectra obtained at different contact media for active and passive states.
Applsci 12 12611 g006
Figure 7. Impedance spectra obtained by using a simulated pore solution as the contact medium depending on contact pressures.
Applsci 12 12611 g007
Figure 8. Impedance spectra obtained when counter electrodes are used at different sizes.
Applsci 12 12611 g008
Figure 9. Impedance spectra obtained at different counter electrode locations for active and passive states.
Applsci 12 12611 g009
Figure 10. Equivalent electrical circuit used for the analysis.
Applsci 12 12611 g010
Figure 11. Ohmic resistance with influencing factors for active and passive states.
Applsci 12 12611 g011
Figure 12. Polarization resistance with influencing factors for active state.
Applsci 12 12611 g012
Table 1. Experimental setup details using EIS measurements [29].
Types in Figure 2Sample TypeLocationExposure ConditionCounter
Electrode Type
Steel
Condition
Reference ElectrodeReference
A-1concretelabimmersion
(3.5% NaCl)
graphite
(Ex 1)
passiveSCE 3[22]
A-2concretefieldatmospheric zoneelastomer
(Ex)
passive/
active
activated
titanium rod
[23]
mortarlabpremixed
(3% CaCl2)
N.I. 5passive/
active
N.I[5]
B-1concretelabimmersion
(3.5% NaCl)
graphite
(Ex)
activeSCE[22]
concretelabimmersion
(3.5% NaCl)
graphite
(In 2)
passive/
active
CSE 4[24]
B-2concretelabpartial or full immersion
(3% NaCl)
steel
(In)
passive/
active
SCE[25]
B-3mortarlabwet/dry cycle
(3% NaCl)
stainless steel
(Ex)
passive/
active
SCE[11]
C-1mortarlabimmersion (sea water)/
premixed (0.1, 1.0 and 3.6% Cl)
graphite
(Ex)
passive/
active
SCE[7]
mortarlabimmersion (3.5% NaCl)/
premixed (3% CaCl2)
copper cylinder
(Ex)
passive/
active
SCE[8]
C-2mortarlabpartial immersion
(3% NaCl)
titanium
(Ex)
passive/
active
SCE[26]
C-3concretelabimmersion
(3% NaCl)
stainless steel
(Ex)
passive/
active
SCE[27]
1 Ex external counter electrode, 2 In embedded counter electrode in sample, 3 SCE standard calomel electrode, 4 CSE copper copper–sulphate electrode, 5 N.I. No information.
Table 2. Mix design and physical properties.
Type of CementW/C 1Cement (kg/m3)Aggregate (kg/m3)Sand (kg/m3)Compressive Strength (MPa)
F28 2F180 2
CEM I 52.5N0.6300110070738.34 (1.19) 346.99 (1.35)
1 W/C water-to-cement ratio, 2 F28 and F180 compressive strength at 28- and 180-days concrete age, 3 values in brackets denote single standard deviations for average compressive strength values.
Table 3. Chemical compositions of CEM I 52.5N.
SiO2Al2O3Fe2O3CaOMgOSO3K2ONa2O
% by weight20.684.833.1763.952.352.800.540.03
Table 4. Physical properties of aggregate and sand.
Bulk Density (kg/m3)Absorption (%)Fineness ModulusSpecific Gravity
Aggregate14501.026.042.63
Sand15202.02.892.63
Table 5. Fitting values based on the use of an electrical equivalent circuit.
(a) Passive State of Steel (SS)
Sample Notation 1Ex2-C3-5.2 4Ex-Na 3-5.2Ex-SP 3-5.2Ex-T 3-5.2In 2
Concrete responseRConc179.4 Ω169.2 Ω193.5 Ω154.7 Ω131.6 Ω
CPEConc (×10−12)7.0 Fs0.46.9 Fs0.417.4 Fs0.377.3 Fs0.4120.6 Fs0.38
RIF 86.2 Ω89.8 Ω94.4 Ω104.2 Ω41.5 Ω
CPEIF (×10−6)9.3 Fs−0.532.8 Fs−0.4525.5 Fs−0.622.96 Fs−0.481.9 Fs−0.33
Steel
response
RCP231.7 Ω180.4 Ω82.7 Ω161.9 Ω91.5 Ω
CPECP (×10−3)6.7 Fs −0.477.4 Fs−0.516.7 Fs−0.427.5 Fs−0.5412.0 Fs−0.47
RSteel-----
CPESteel (×10−3)7.7 Fs−0.187.5 Fs−0.176.1 Fs −0.266.3 Fs −0.247.0 Fs−0.19
(b) Active State of Steel (LS)
Sample NotationEx-C-5.2Ex-Na-5.2Ex-T-5.2Ex-SP-5.2Ex-SP-4.24Ex-SP-0 4In
Concrete
response
RConc 119.3 Ω123.7 Ω120.2 Ω113.5 Ω157.8 Ω161 Ω133.4 Ω
CPEConc (×10−12)10.4 Fs0.43 7.03 Fs0.416.98 Fs0.434.47 Fs0.3913.71 Fs0.377.25 Fs0.3150.8 Fs0.30
RIF 77.3 Ω79.9 Ω75.2 Ω105.1 Ω131.5 Ω138.5 Ω8.1 Ω
CPEIF (×10−7)4.90 Fs−0.31 17.1 Fs−0.46 15.4 Fs−0.4261.0 Fs−0.6127.8 Fs−0.6821.2 Fs−0.5520.6 Fs−0.11
Steel
response
RCP 104.1 Ω28.87 Ω30.55 Ω73.01 Ω119.3 Ω54.53 Ω44.44 Ω
CPECP (×10−7)4.33 Fs−0.70 2.96 Fs−0.641.35 Fs−0.581.56 Fs−0.611.28 Fs−0.610.836 Fs−0.66 2.97 Fs−0.58
RSteel398.1 Ω239.3 Ω247.1 Ω199.5 Ω219.3 Ω447.4 Ω226.3 Ω
CPESteel (×10−2)1.42 Fs−0.391.81 Fs−0.291.62 Fs−0.262.09 Fs−0.222.44 Fs−0.231.12 Fs−0.2912.13 Fs−0.19
1 Sample notation type of counter electrode-contact medium-contact pressure (ex. Ex-C-5.2); 2 Ex, external counter electrode; In, internal counter electrode; 3 C, saturated Ca(OH)2; Na, 0.55 NaCl; SP, simulated pore solution; T, tap water; 4 contract pressure 5.2, 4.2, and 0 kPa.
Publisher’s Note: MDPI stays neutral with regard to jurisdictional claims in published maps and institutional affiliations.