Abstract
In boiler houses, the biggest heat energy losses are caused by flue gas being released into the atmosphere. Installation of condensing heat exchangers allows reducing the temperature of the flue gas being released, condensation of water vapor, and, thus, efficient use of the waste heat. There are many investigations of average heat transfer in different types of condensing heat exchangers. They indicate also that the cooling water flow rate and its temperature are important parameters defining water vapor condensation efficiency. Investigations of local condensation heat transfer in condensing heat exchangers are very limited. Only recently experimental investigations of the flue gas temperature and Re number effect on local condensation heat transfer in the model of the condensing heat exchanger at a constant cooling water flow rate and its temperature have started being published. In this paper, for the first time, detailed experimental investigations of the cooling water flow rate and its temperature effect on local condensation heat transfer of the water vapor from the flue gas in the model of the condensing heat exchanger (long vertical tube) are presented. The results revealed that at higher flue gas Rein, the effect of the cooling water flow rate and its temperature has a stronger impact on local heat transfer distribution along the test section.
1. Introduction
In boiler houses, the biggest heat energy losses are caused by flue gas being released into the atmosphere. Installation of condensing heat exchangers in boiler houses allowed to reduce the temperature of the flue gas being released, to condensate water vapor, and thus use the waste heat efficiently [1,2]. Despite that, the condensate film formed in the condenser also serves as a precipitator of solid particles, which are the biggest environmental pollution source in the case of incinerating biofuels [3,4,5].
The design principles of condensing economizers are known rather well, but local heat transfer processes taking place in such types of heat exchangers have not been studied in detail. In general, the condensing heat exchanger is composed of a housing with many long and small diameter tubes installed in it. Flue gas leaving the furnace is directed into the tubes. The cooling water flows around the tubes, thus taking the sensible and latent heat of the flue gas. Usually the counter-current flow arrangement is used in such types of heat exchangers.
Some studies investigate water vapor condensation in tubes when the amount of non-condensable gases is small. Results of such studies [5,6,7,8,9,10,11], etc., revealed that condensation usually takes place in the initial part of the test sections where the largest quantity of water vapor is condensed, and therefore high heat and mass transfer rates are obtained there. As for flue gas, the situation is the opposite since the gas typically contains more non-condensable gas and less water vapor. Unfortunately, studies devoted to the condensation process of water vapor from flue gas and especially the impact of the cooling water flow rate and its inlet temperature are rather limited.
The analytical and experimental analyses of heat and mass transfer processes in a horizontal flue gas condensing heat exchanger, which was composed of a few sections, are presented in [12]. Rather good agreement was obtained between predicted and experimentally measured values. The authors also analyzed the influence of the cooling water inlet temperature on total condensation efficiency. The obtained results showed that the dependency of condensation efficiency on the cooling water inlet temperature is rather strong. An increase in the cooling water mass flow rate resulted in a gradual increase (up to ≈ 10%) in the condensation efficiency, which was, however, limited to a certain cooling water flow rate. After a certain cooling water mass flow rate was achieved, no further increase in it occurred because of the increased condensation efficiency. The results presented in [13] also show that among various inlet parameters, the cooling water flow rate and temperature have a pronounced effect on average heat transfer (HT) even in a short (x/d ≈ 9) finned tube with a flue gas Re number in the range of 4200–12,800.
Flue gas condensation experiments in a horizontal bundle-type heat exchanger showed that the average heat transfer increases sharply when the cooling water flow rate was increased from 3.3 L/min to about 10 L/min. However, when the cooling water flow rate exceeds 10 L/min, the increase in the total heat transfer slows down. Based on that, it was concluded that the excessive cooling water flow rate is not able to enhance HT. The influence of the cooling water flow rate on the condensate flow and average heat transfer was also determined. The cooling water temperature increase from 10 °C to 16 °C resulted in the condensate flow rate decreasing by approximately 12%, but the average heat transfer coefficient increased by about 15% [14]. The authors did not explain the reason for the heat transfer coefficient increase.
The condensation of air and vapor mixture, simulating flue gas, in a rather short vertical pipe (x/d ≈ 70) was investigated in [15]. The volumetric water vapor fraction in the experiments was ≈17%. It was obtained that condensation efficiency in such a case was only about 30%, but the determined total average HT appeared to be twice as high as the heat transfer in dry air experiments (i.e., with no condensation).
Simulated flue gas condensation results in a vertical tube of x/d ≈ 32 with a water vapor mass fraction of about 5–12% and the inlet Reynolds number of 4600–14,000 were presented in [16]. It was obtained that the average condensation heat transfer coefficient for a lower inlet Re number as well as for the water vapor mass fraction of about 5% was very similar to the sensible heat transfer coefficient. When the mass fraction was increased to 12%, the obtained average HT coefficient became five times higher than the sensible HT coefficient. Experimental and theoretical results allowed concluding that condensation heat transfer starts dominating if there is an increase in vapor mass fraction and the flue gas Re number. Similar conclusions were obtained in [17,18], etc.
Results obtained in the experimental set-up (a vertical tube as a mock-up of a condensing heat exchanger) in [19] allowed to conclude that the temperature and the humidity of inlet flue gas significantly affect local heat transfer. Experiments showed that there were regimes, when convection was prevailing in the initial part of the heat exchanger, and, hence, the heat transfer was not efficient there. The total local HT started increasing once the flue gas temperature reached the dew point temperature. The injection of water before the experimental set-up additionally moistened the flue gas, and, therefore, much better conditions were created for condensation. The water injection into the flue gas flow significantly changed the variation of temperatures in the heat exchanger [20]. The injected water caused the local total heat transfer increase by at least a few times in comparison to the case without injection. The impact from different temperatures of the injected water on the local total heat transfer was recorder only until the middle of the test section. In these studies, however, no investigations of effect of the temperature and flow rate of the cooling water on HT were performed.
The results of theoretical and experimental investigations of water vapor condensation in a vertical tube (x/d ≈ 80) from the flue gas obtained by incinerating natural gas are presented in [21]. The experiments were done at rather small Reynolds numbers, i.e., the Re number was varied from about 2500 to about 5000. The results showed that the average Nusselt number for various cooling water temperatures and flue gas Re numbers was between 35 and 70. It was also emphasized that the wall temperature was an important factor as it had a significant influence on the condensation rate and heat transfer.
Thus, the literature review shows that the investigations are mainly oriented to the estimation of the average heat transfer in relatively short flue gas condensers. But these investigations also indicate that the cooling water flow rate and its temperature are important parameters defining water vapor condensation efficiency.
The condensing heat exchangers used in the industry are rather long (usually x/d > 100) and local total HT investigations in such condensing heat exchangers are very limited. Only recently experimental investigations of the flue gas temperature and Re number effect on local condensation heat transfer in the model of the condensing heat exchanger at a constant cooling water flow rate and its temperature have started being published [19].
In this paper, for the first time, detailed experimental investigations of the cooling water flow rate and its temperature effect on local condensation heat transfer of the water vapor from the flue gas in the model of the condensing heat exchanger (long vertical tube, x/d ≈ 170) are presented.
2. Materials and Methods
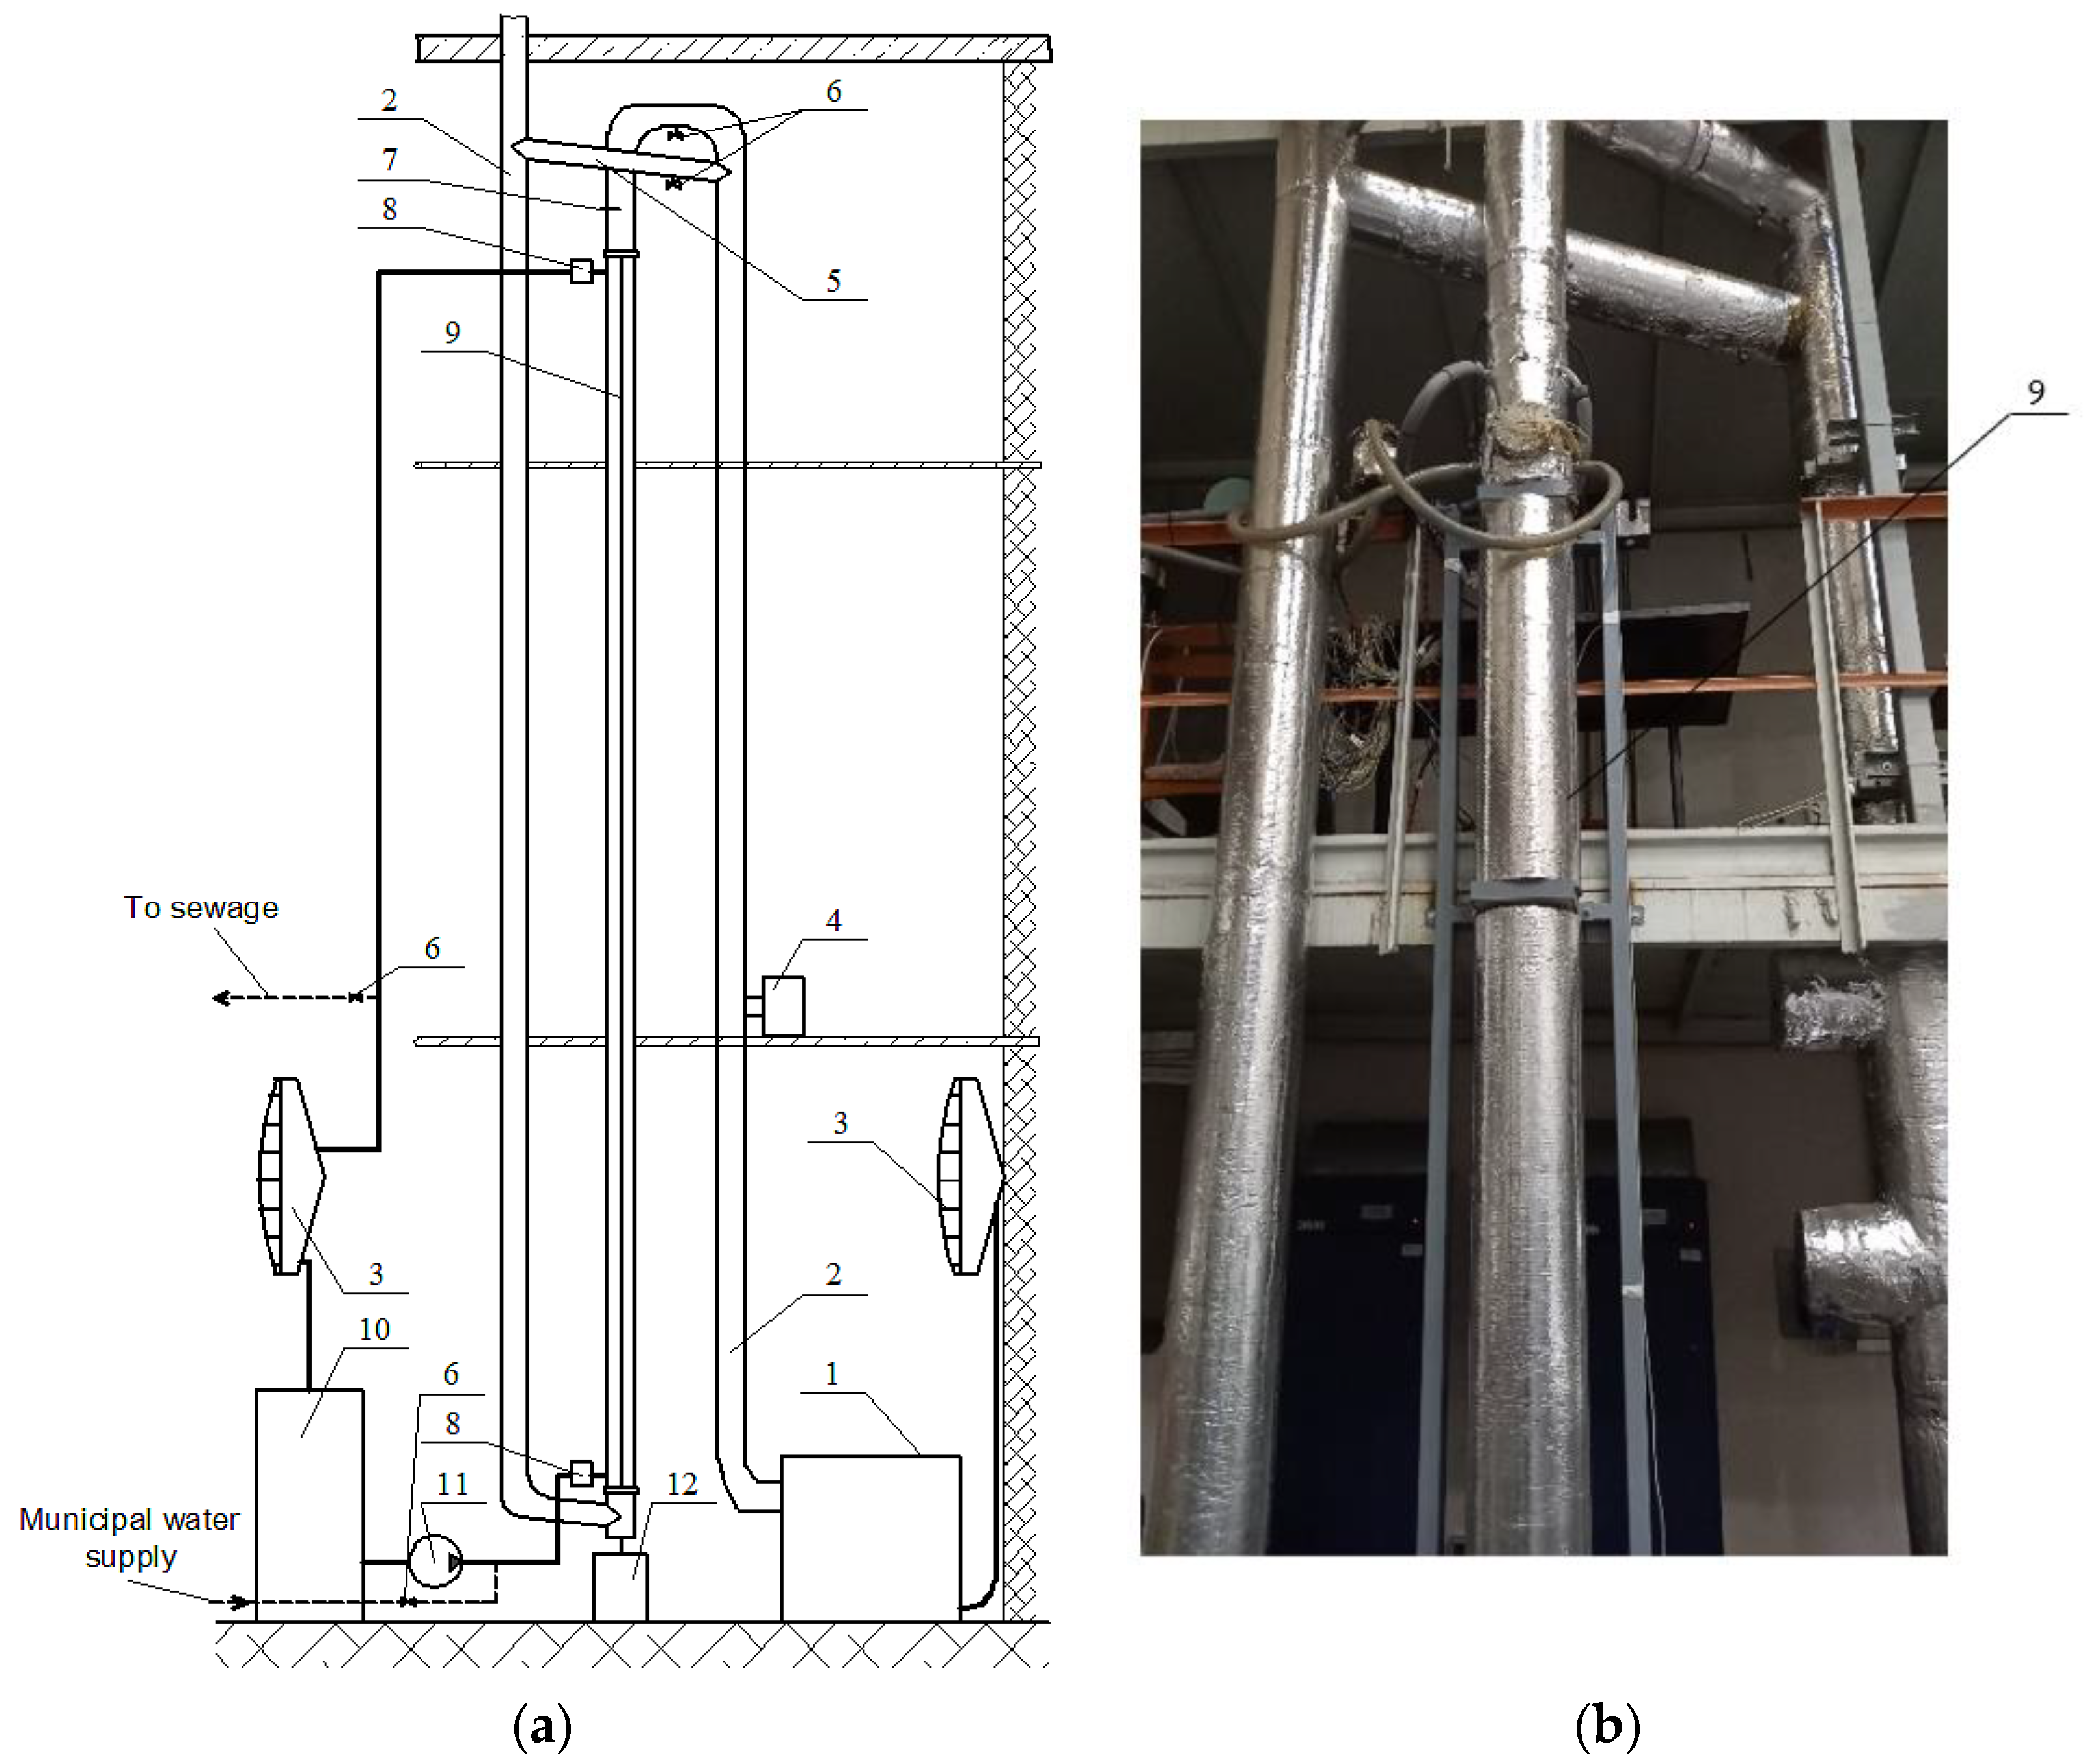
The investigations of the flue gas water vapor condensation at different inlet cooling water flow rates and temperatures were done using the experimental setup shown in Figure 1. Wood pellets were incinerated in the automatic boiler (50 kW). The incineration-generated flue gas flew from the boiler to the experimental section. To obtain different flue gas inlet temperatures at the exit from the boiler, the economizer of the boiler was used.

Figure 1.
(a) The experimental setup: (1) boiler, (2) chimney, (3) air cooled heat exchanger, (4) flue gas exhauster, (5) bypass pipe, (6) valve, (7) inlet flue gas flow rate, humidity and temperature measurement place, (8) water mixer, (9) vertical calorimetric tube, (10) distilled water tank, (11) water pump, (12) vessel for condensate collection. (b) General view of experimental test section.
The test section was composed of two long vertical stainless steel tubes. The internal calorimetric tube was about 5.8 m long, 0.034 m wide (x/d ≈ 170), with its wall thickness of 2 mm. The internal tube (in which the condensation took place) was surrounded by an outer tube, which was about 5.9 m long and 0.108 m wide.
The flue gas flow rate entering the internal vertical calorimetric tube was adjusted by valves. After passing the calorimetric tube, the flue gas was discharged to the atmosphere through the chimney.
The chimney and the test section were insulated with Rockwool insulation (50 mm thickness).
The cooling of the test section during the first series of experiments was ensured with water from the municipal network. The water was supplied into the gap between the two tubes, and was of a relatively low temperature (8–9 °C). The passed water was discharged into the sewage system.
In order to have a higher inlet cooling water temperature (14–15 °C), the second series of experiments was performed. During the second series of experiments, the water from the storage tank was supplied by the water pump. It circulated through the coil-type air-cooled heat exchanger in a closed circuit (Figure 1).
The water flow rate was measured at its discharge by weighting. The required flow rate was regulated by a corresponding valve.
To have uniform cooling water inlet (when entering test section) and outlet (when leaving test section) temperatures, the water was mixed in the mixers (see Figure 1).
The water condensed during the experiments was collected in a collection vessel.
More details of the experimental setup are presented in [19].
Experiments were performed at two Reynolds numbers (Re ≈ 9500 and Re ≈ 21,000) at the inlet into the calorimetric tube, at two different cooling water flow rates (about 60 and 120 kg/h), at two different cooling water inlet temperatures (about 8–9 °C and 14–15 °C), and at different flue gas inlet temperatures.
The water vapor mass fraction in the flue gas was between 15 and 16%. Such a fraction was achieved by water spraying into the furnace of the boiler.
About 20 calibrated chromel-copel thermocouples were mounted in the center of the calorimetric tube. These thermocouples measured the flue gas temperature along the tube. Furthermore, 20 thermocouples were also mounted along the inner wall of the calorimetric tube. Ten thermocouples were mounted in the middle between the tubes for cooling water temperature measurement. Each water mixer was installed with three thermocouples.
Keithley automatic data acquisition system was used for the data collection from the thermocouples. Measurements of inlet relative humidity (RHin, %) and inlet flue gas temperature (tin, °C) were recorded with a KIMO C310 sensor. To measure the flue gas flow rate at the inlet, a bellmouth with Pitot-Prandtl’s tubes connected to the micromanometer was used.
The cooling water flow rate was determined by weighting.
The properties of flue gas (mixture of non-condensable gas and water vapor) in the equations below were obtained using formulas for mixture properties calculation [22]. Local properties were determined using the flow temperature measured in the center of the inner tube.
The total local heat flux at wall was obtained as:
where the slope dtH2O/dx was determined as the least squares polynomial fit of the tcw as a function of the tube length.
The local total heat transfer coefficient was calculated as:
The total local Nusselt number:
Condensation efficiency (%):
Total heat quantity absorbed by the cooling water:
Heat quantity released by flue gas:
Heat quantity released due to condensation:
The uncertainty of the data was evaluated using methodology presented in [23]. The determined uncertainty of the local total Nu number was in the range of 6–14%.
The methodology is described in more detail in [19].
3. Results
3.1. Effect of the Cooling Water Flow Rate
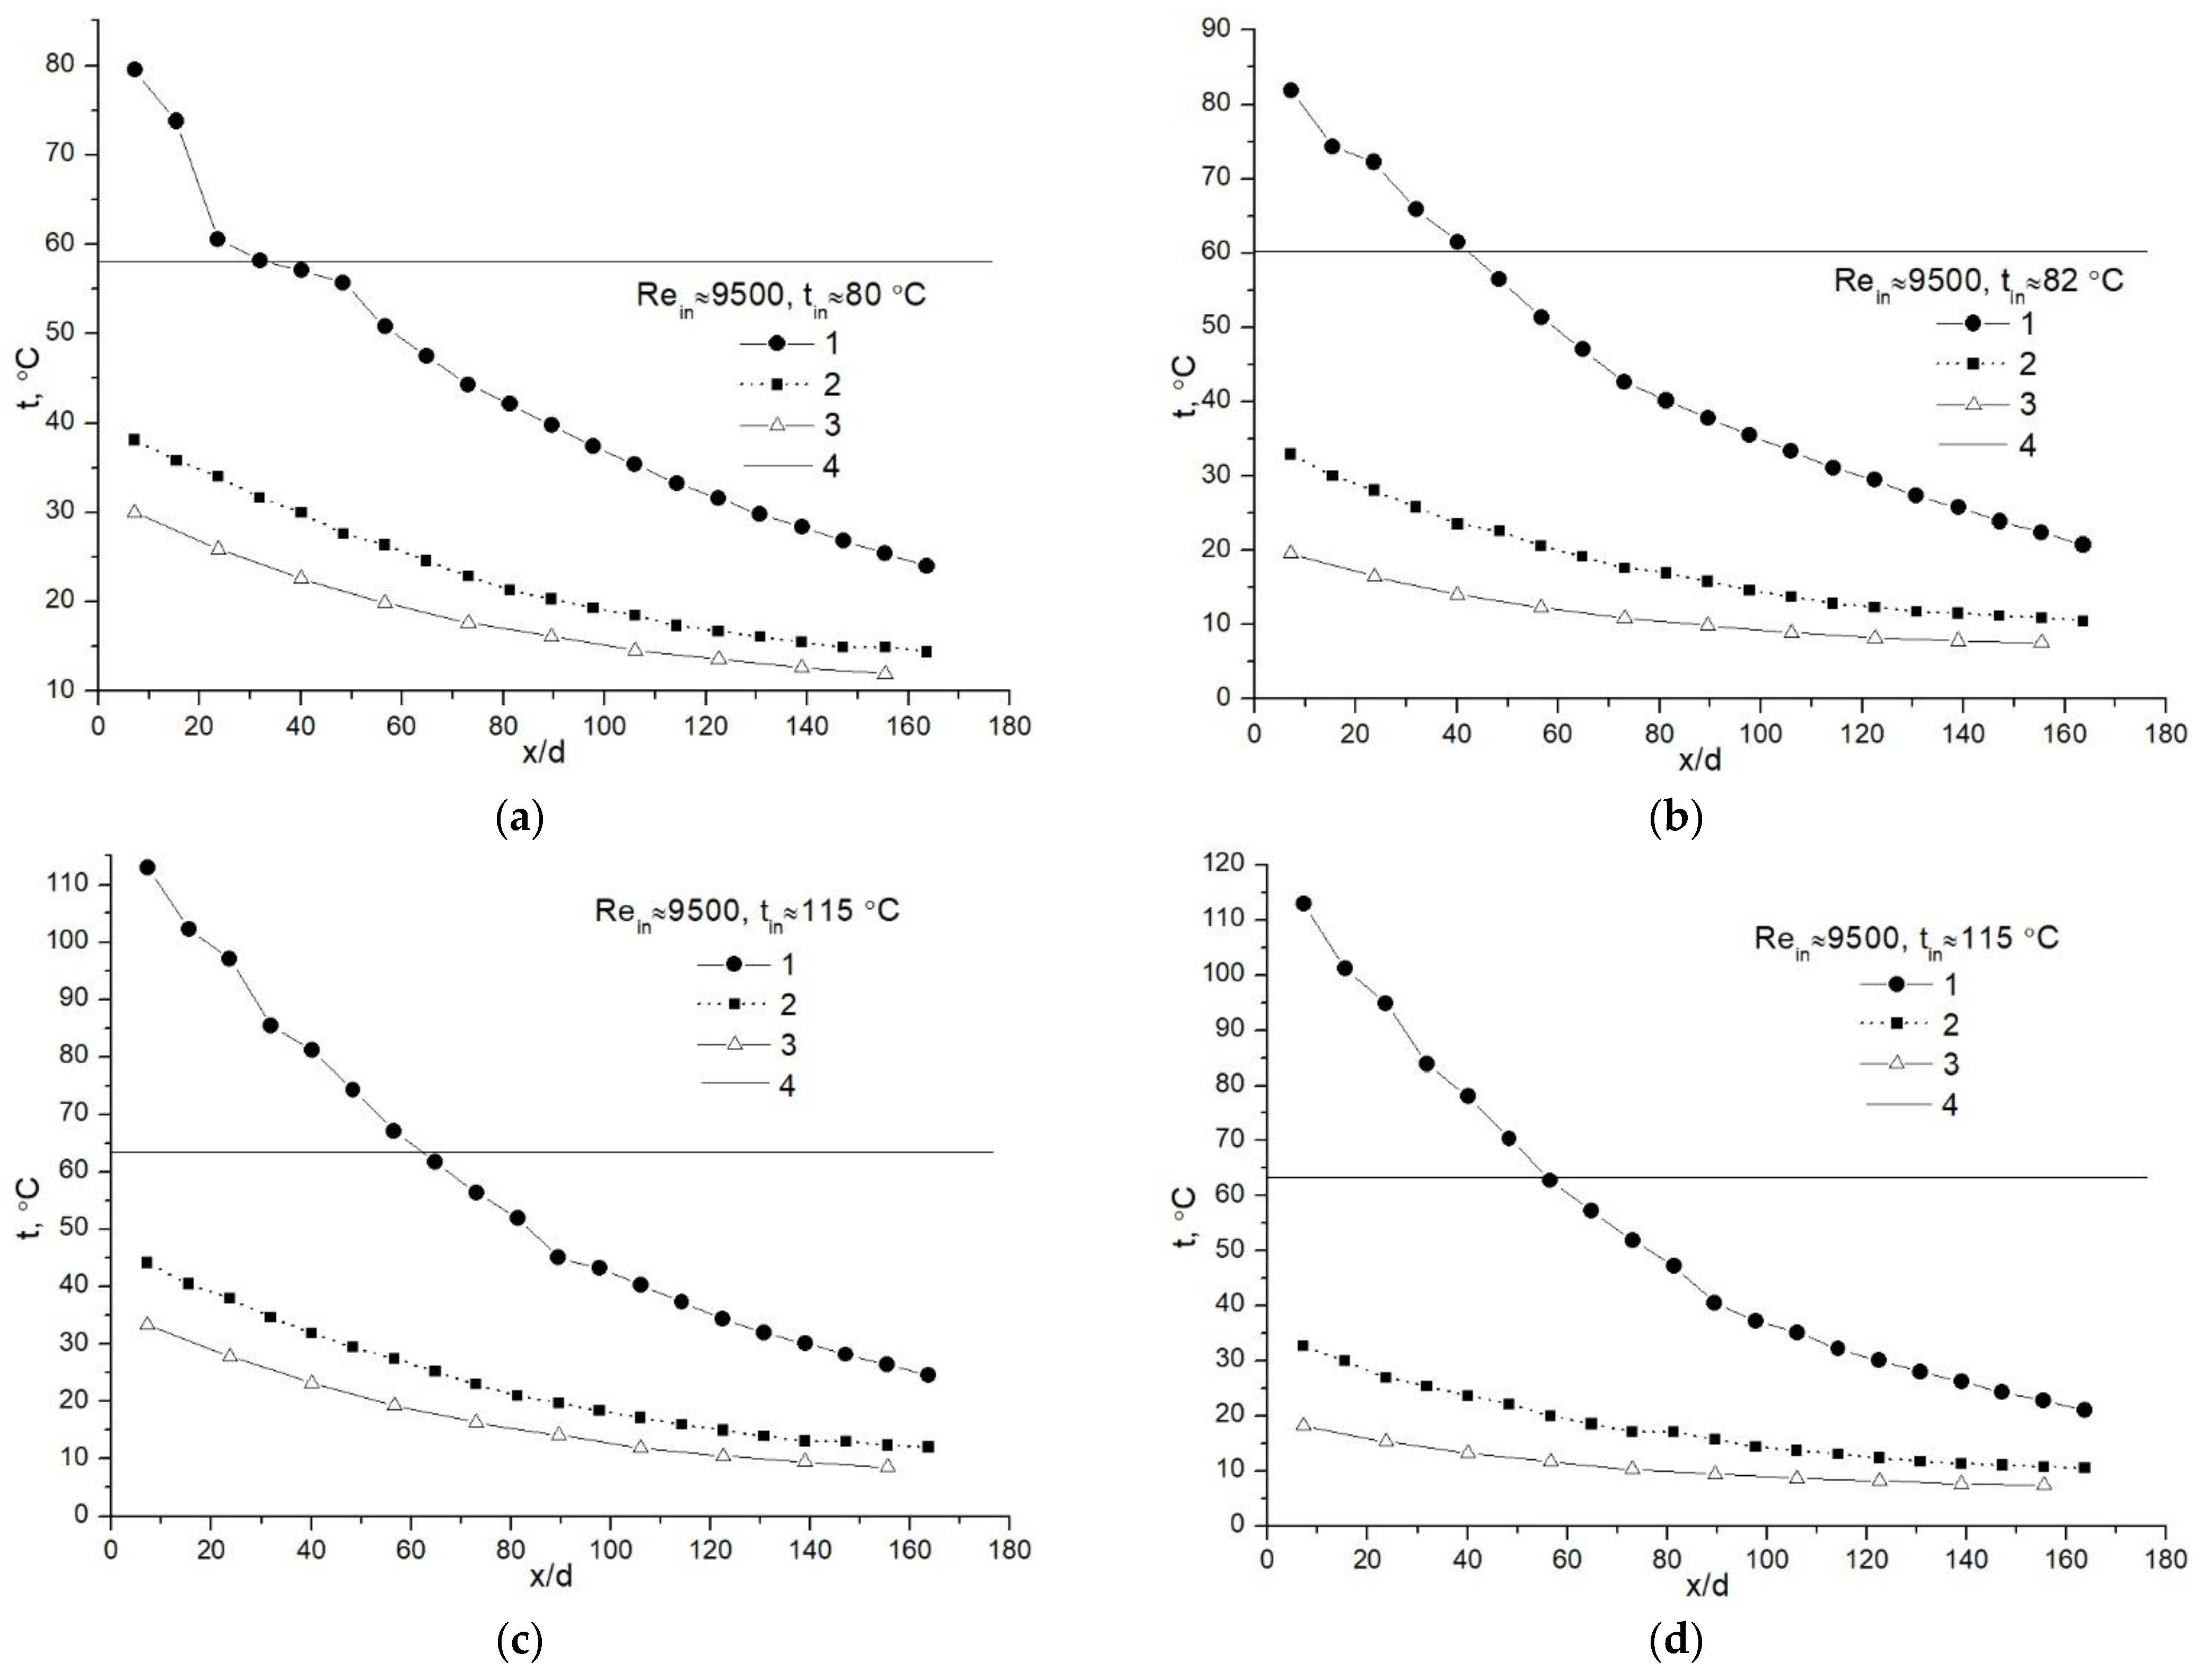
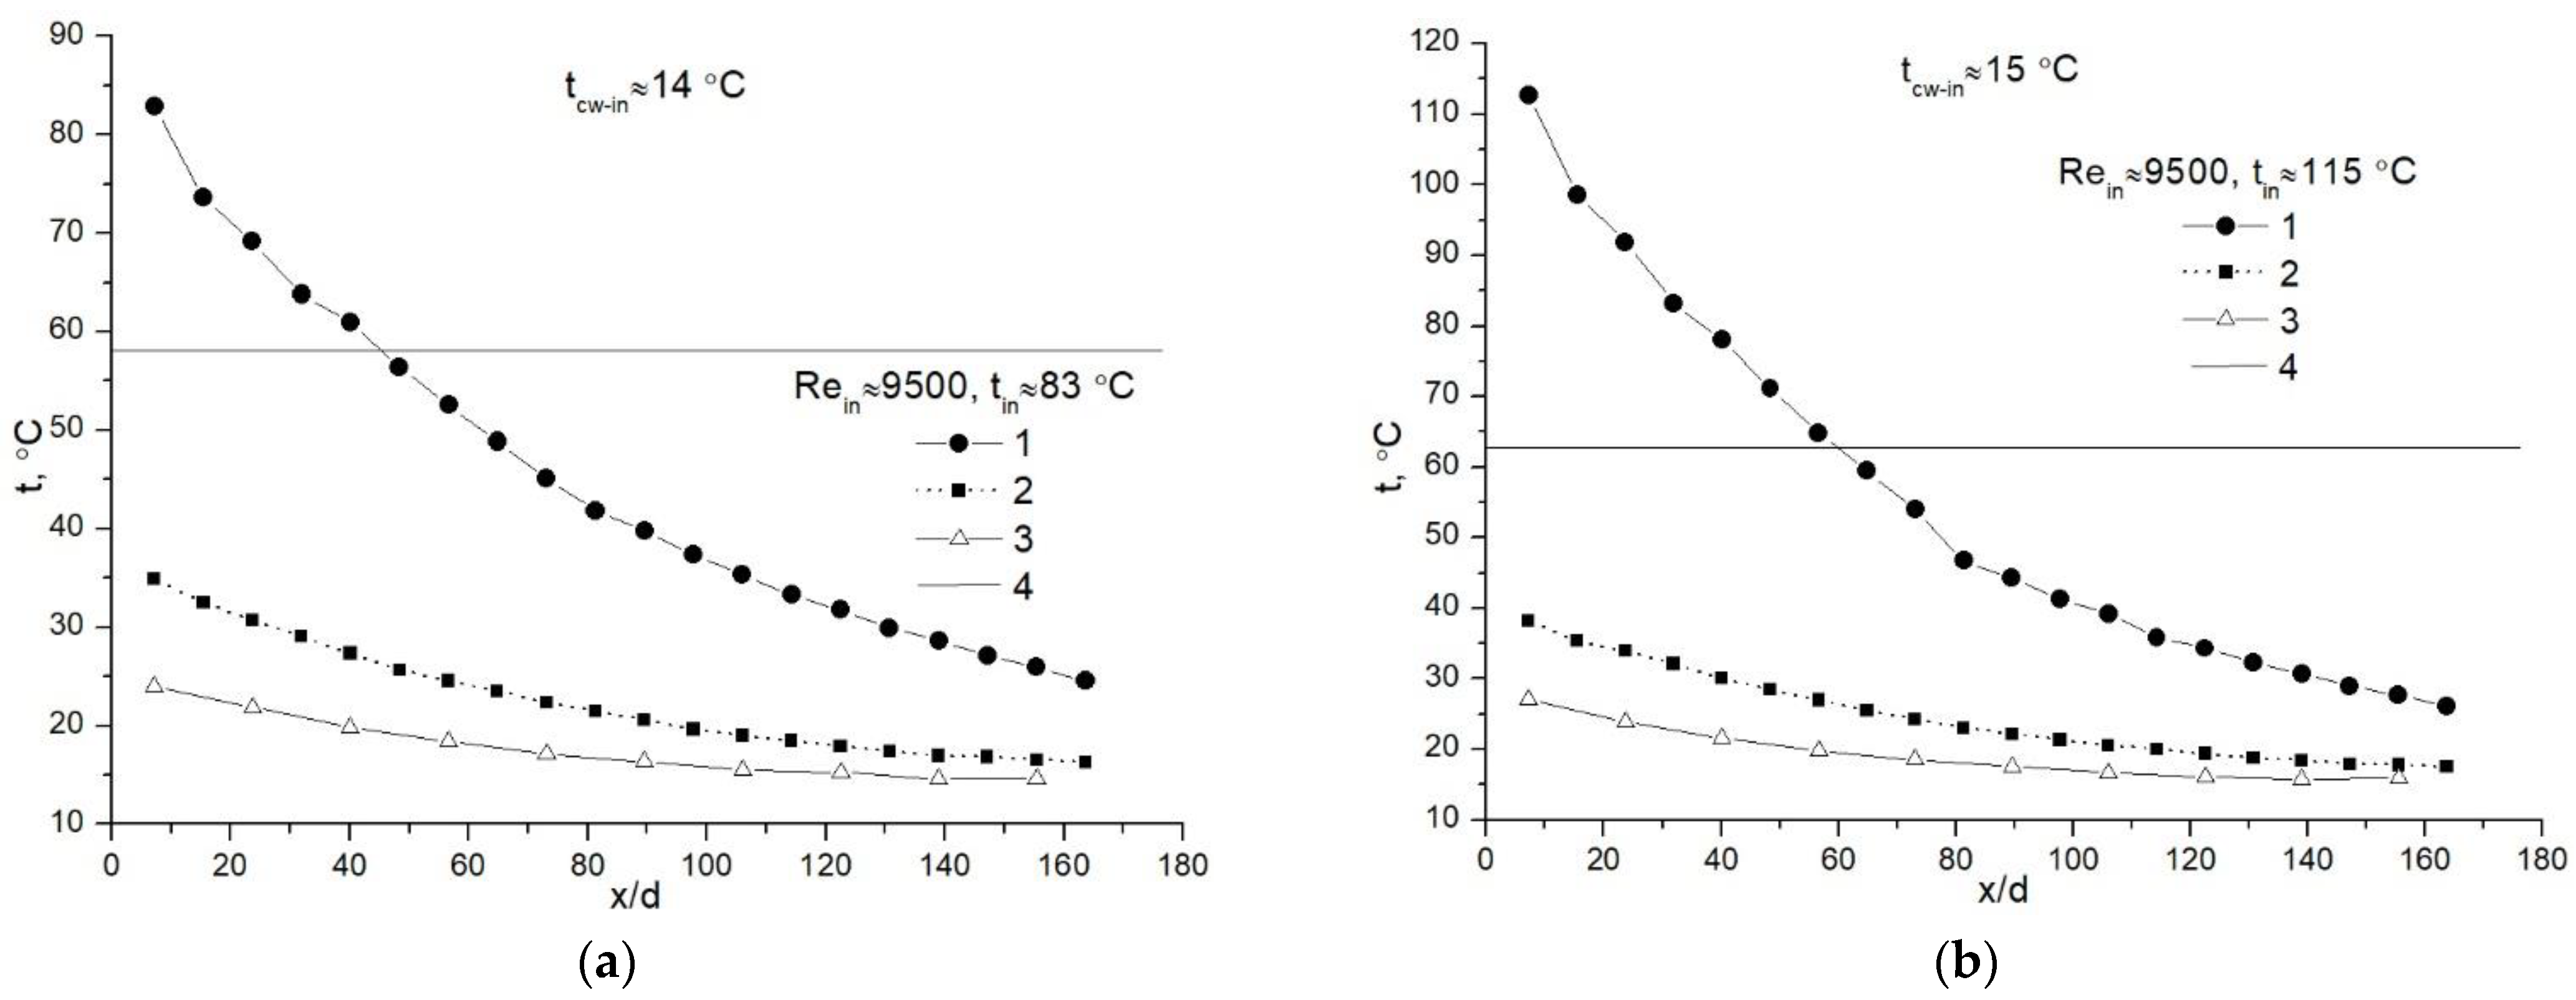
Figure 2 presents variations of temperatures along the experimental model at Rein ≈ 9500), different inlet flue gas temperatures and in cases when the cooling water flow rate was 60 kg/h and 120 kg/h. The dew point temperature (tdp-in) was calculated as indicated in [24]. The obtained tdp-in was in the range between ~59 and 63 °C. The inlet cooling water temperature (tcw-in) measured in the inlet water mixer was about 8–9 °C.
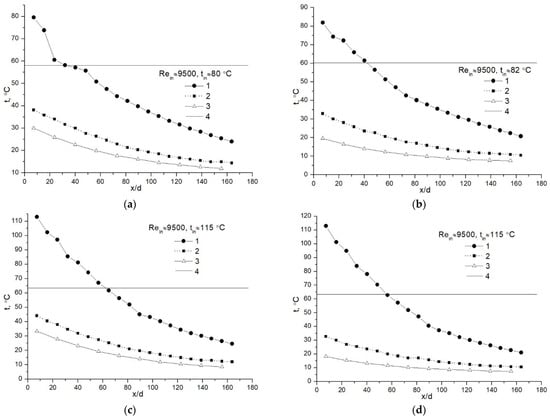
Figure 2.
Temperature variation in the heat exchanger at Rein ≈ 9500, different inlet flue gas temperatures and cooling water flow rates of 60 kg/h (a,c) and 120 kg/h (b,d): (1) flue gas in the tube center, (2) the inner wall of the tube, (3) cooling water, (4) the dew point temperature.
From the results shown in Figure 2, it is clear that the dew point temperature (curve 4) is well above tube wall temperature (curve 2), and hence water vapor condensation should start on the internal wall of the tube already from the beginning of the tube. This was confirmed by the heat transfer results (Nut, see Figure 3).
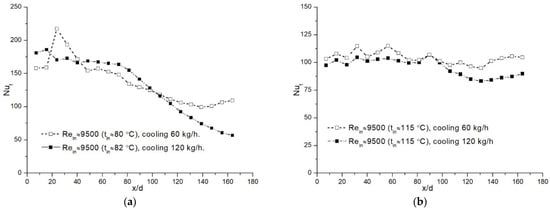
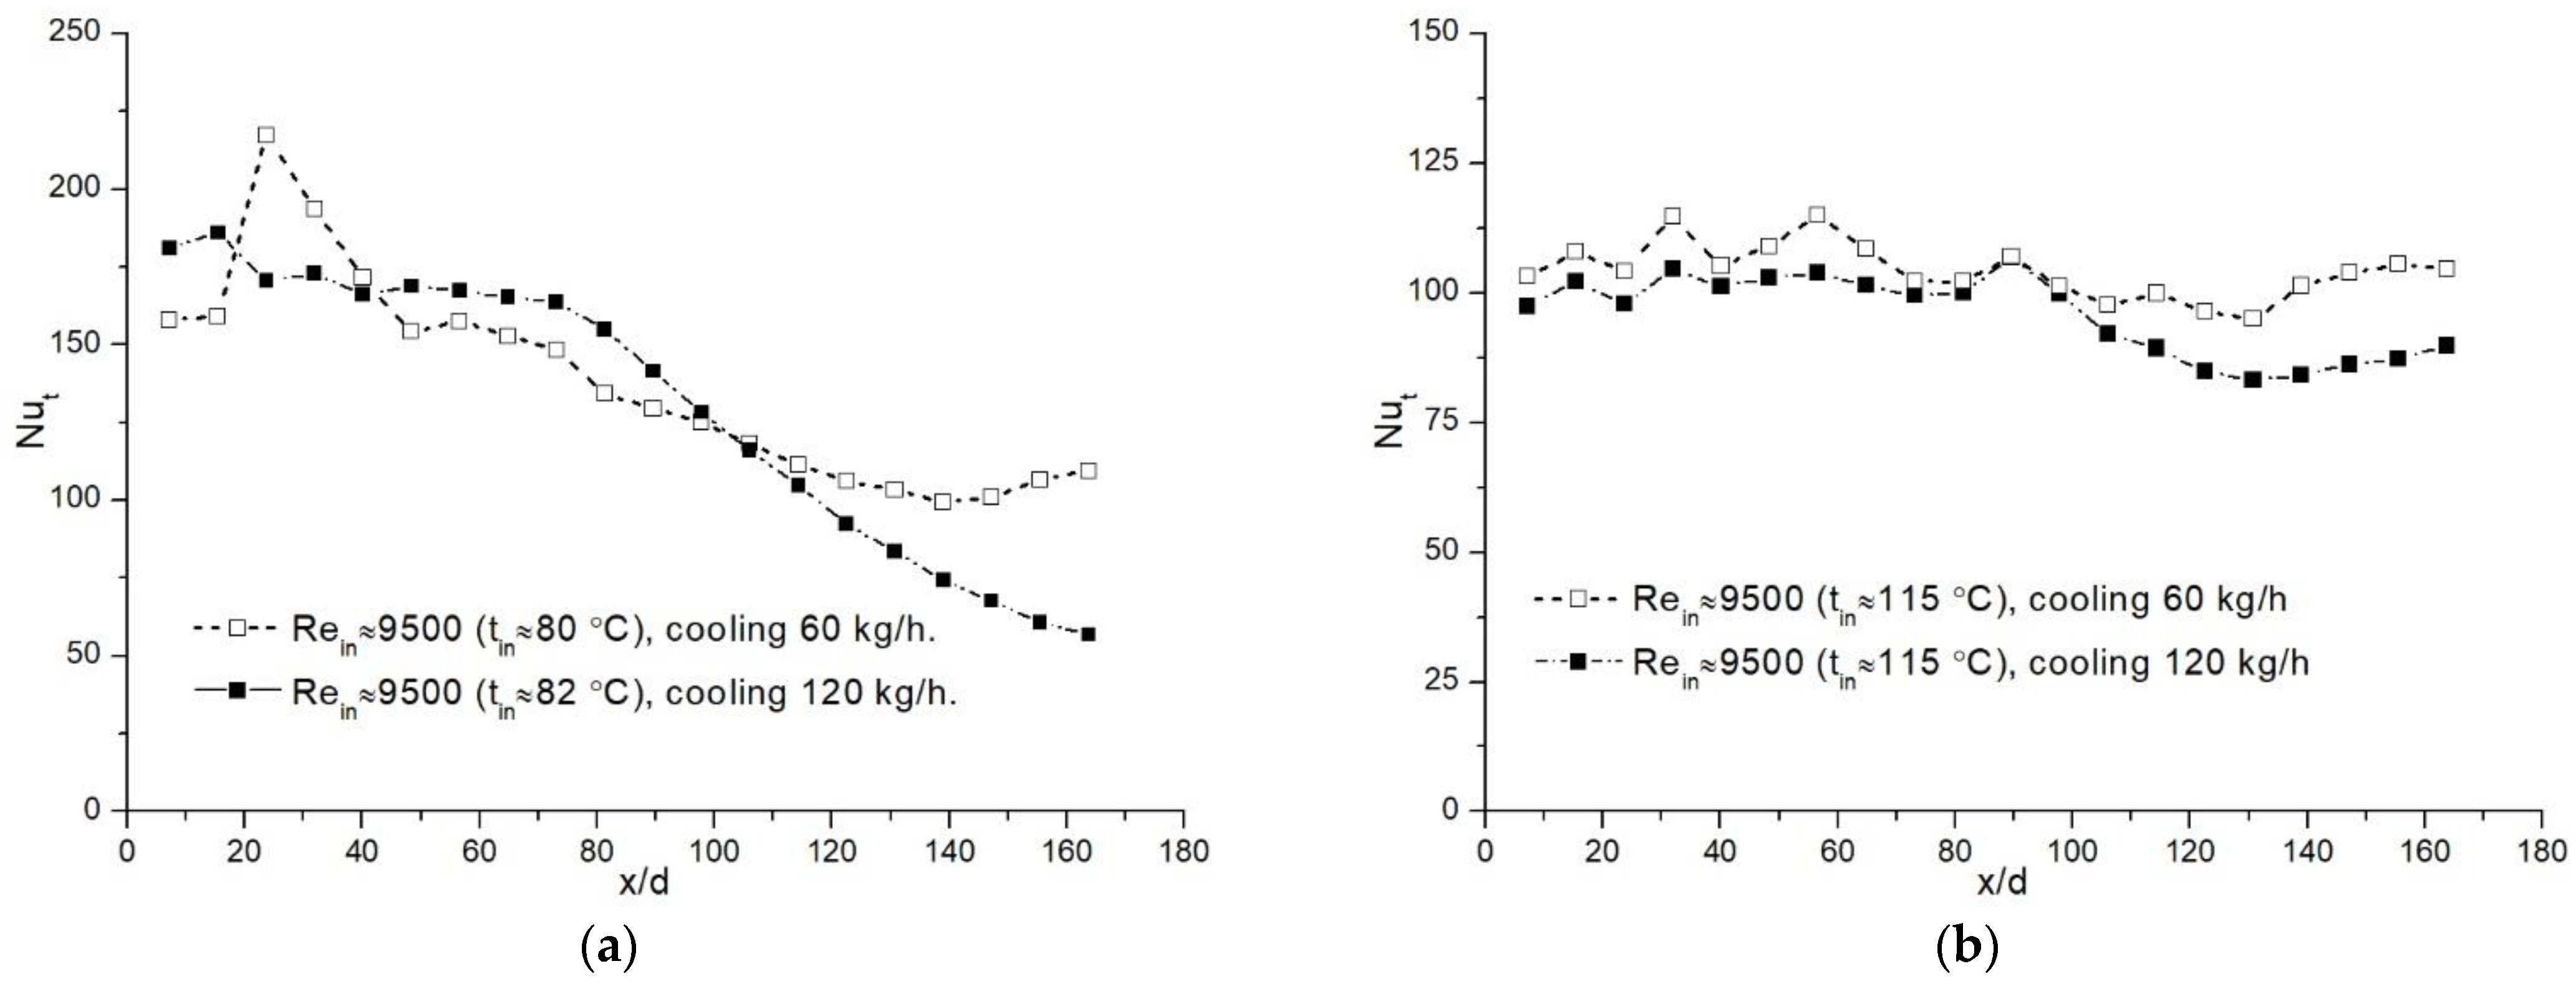
Figure 3.
Variation of the Nut along the heat exchanger at Rein ≈ 9500, different inlet temperatures (smaller (a), higher (b)) as well as cooling water flow rates.
As Figure 2a shows, the flue gas temperature (curve 1) rapidly decreased by approx. 20 °C from x/d = 0 to x/d ≈ 25, and then only a small temperature decrease between x/d ≈ 25–40 was obtained. After that, the temperature gradually decreased until the end of the tube. Then, as some amount of vapor had condensed and the temperature difference between the tube wall and flue gas had decreased (Figure 2a, curves 1 and 2), the heat transfer also started to decrease. Nonetheless, it was still high and at x/d ≈ 170 of the tube, the Nut ≈ 110 (Figure 3a).
Curve 3 (see Figure 2a) shows that the cooling water temperature was increasing from x/d ≈ 170 (inlet) until x/d = 0 (the outlet). The change in temperature until x/d ≈ 85 was not significant; however, it became more expressed from x/d ≈ 85. This means that the heat gained by the water in this part of the condensing heat exchanger was rather high due to the prevailing condensation process and high heat transfer (Figure 3a; Nut varied in the range of 110–150). In this case, the water temperature increase through all the test section was about 21 °C, i.e., from ≈ 9 °C to ≈ 30 °C.
The results of temperature distributions for almost the same flue gas inlet parameters, but at a higher cooling water flow rate are presented in Figure 2b. For the flue gas temperature (Figure 2b, curve 1), two clear zones of the linear temperature change could be distinguished: one is from x/d = 0 until x/d ≈ 70, where a steep temperature decrease is obtained, and the other from x/d ≈ 70 until x/d ≈ 170, where much less of a decrease is obtained.
Figure 2b (see curves 2 and 3) shows that the temperatures of the cooling water and tube wall have similar characters. The water temperature increase in this case (Figure 2b, curve 3) is not as clearly expressed as it was with a lower cooling water flow rate (Figure 2a, curve 3). The cooling water temperature increases from the beginning of the section, i.e., from x/d ≈ 170, and until x/d ≈ 70 the increase is only by 3–4 °C (Figure 2a, curve 3). From x/d ≈ 70 until the outlet (x/d = 0), there is even more increase, i.e., ~9–10 °C. The heat transfer (Figure 3a) in the distance between x/d = 0 and x/d ≈ 70 was high (Nut is in the range between 180–160) and confirmed the increased temperature of the cooling water, which was due to vapor condensation, and the release of latent heat. As the most amount of water vapor was condensed in the initial part of the tube, the heat transfer from x/d ≈ 70 until x/d ≈ 170 was rapidly decreasing (Figure 3a). However, at the end of the tube, it continued to be rather high (Nut ≈ 50), yet was still smaller than in the case of the water flow rate of 60 kg/h.
For both cases presented in Figure 2a and b, the condensation efficiencies were about 52% and 62%, respectively. Thus, the cooling water flow rate increased by two times, showing no substantial increase neither in heat transfer (Figure 3a), nor in condensation efficiency.
At a higher inlet flue gas temperature (Figure 2c), the flue gas temperature decreases abruptly until x/d ≈ 90, yet farther along the tube the decrease is more constant (Figure 2c, curve 1). The comparison of this case with the previous one (see Figure 2a) reveals that the distance where more sudden flue gas temperature decrease is observed extends further, i.e., from x/d ≈ 20 to x/d ≈ 90. The characteristics of the wall and cooling water temperatures are similar (Figure 2c, curves 2 and 3). The water temperature from x/d ≈ 170 increases slightly until x/d ≈ 95. From x/d ≈ 95 until the outflow, the temperature increases more, i.e., from ≈15 °C until ≈35 °C and is by about 4–5 °C higher compared to the case of a lower inlet flue gas temperature (Figure 2a).
As the dew point temperature is higher than the tube wall temperature (Figure 2c, curves 2 and 4), good conditions for condensation occur from x/d = 0 (Figure 3b) until x/d ≈ 90. Here Nut varies in the range of ≈ 100–120. Then, Nut decreases slightly but remains between ≈95 and 110 till the end of the test section.
The temperatures of the flue gas, the tube wall, and the cooling water show similar tendencies in the case when the cooling water flow rate was 120 kg/h (Figure 2d). Compared to the case presented in Figure 2c, the temperatures were slightly lower and the increase in the water temperature was not as evident as it was in the case before (cf. Figure 2c).
The characteristics of heat transfer at a higher cooling water flow rate are very similar to that of a lower flow rate (Figure 3b).
Condensation efficiencies determined for the experiments when the cooling water flow rate was 60 kg/h and 120 kg/h were in the range between 54 and 58%. The results of [13] show that even in an internally finned tube, the maximum condensation efficiency was only about 20%. But in this case, the tube was very short, only x/d ≈ 9. The tube used in our experiments was about 20 times longer, and therefore, the surface for vapor condensation was much larger, which resulted in a much higher condensation efficiency.
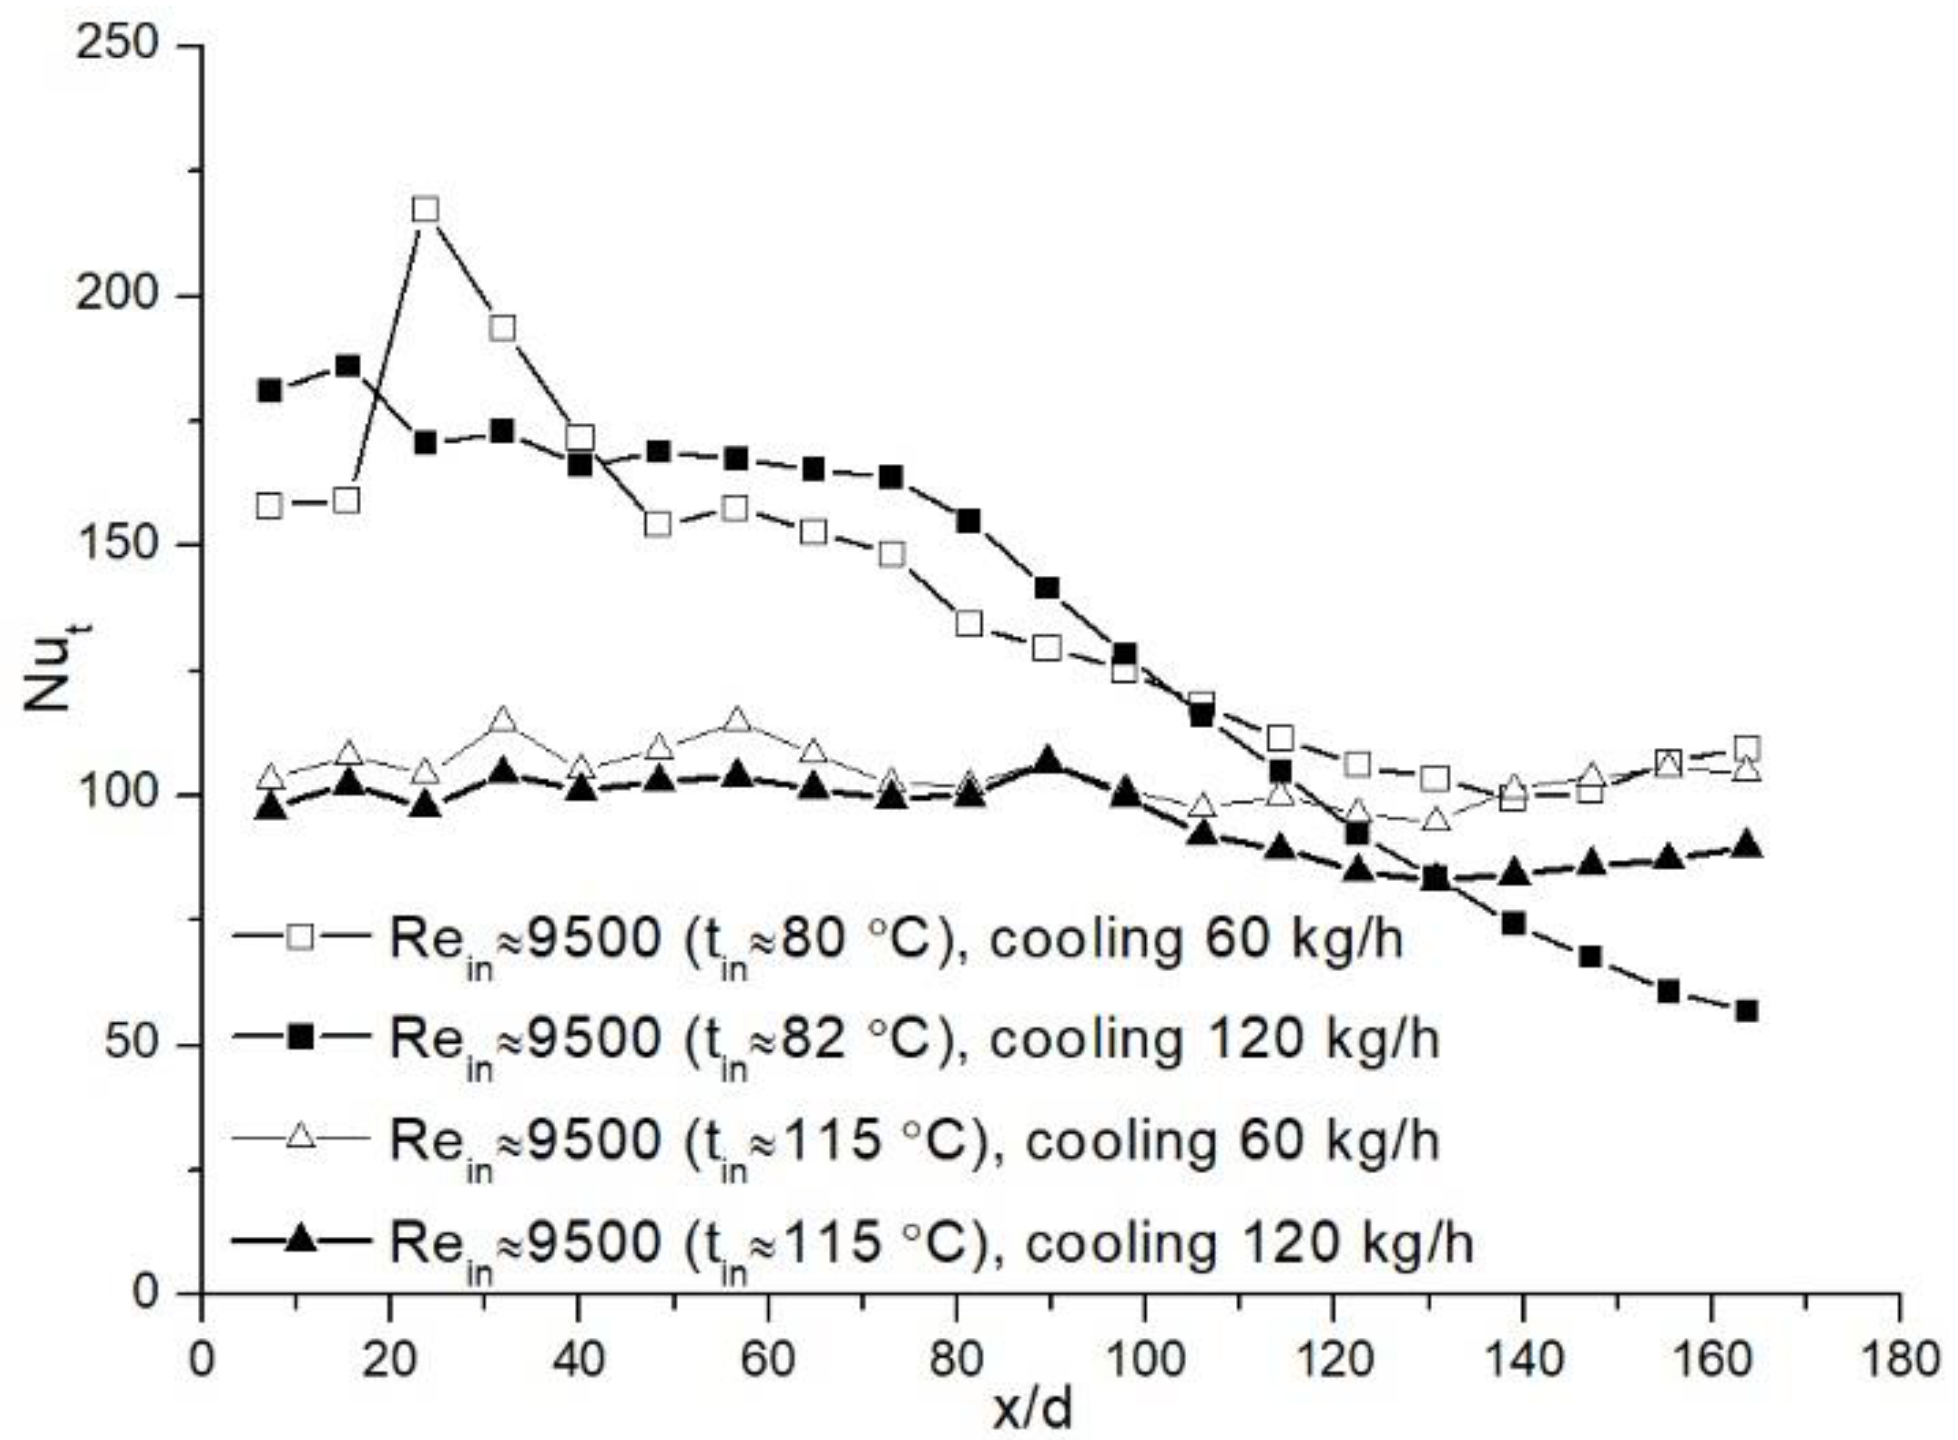
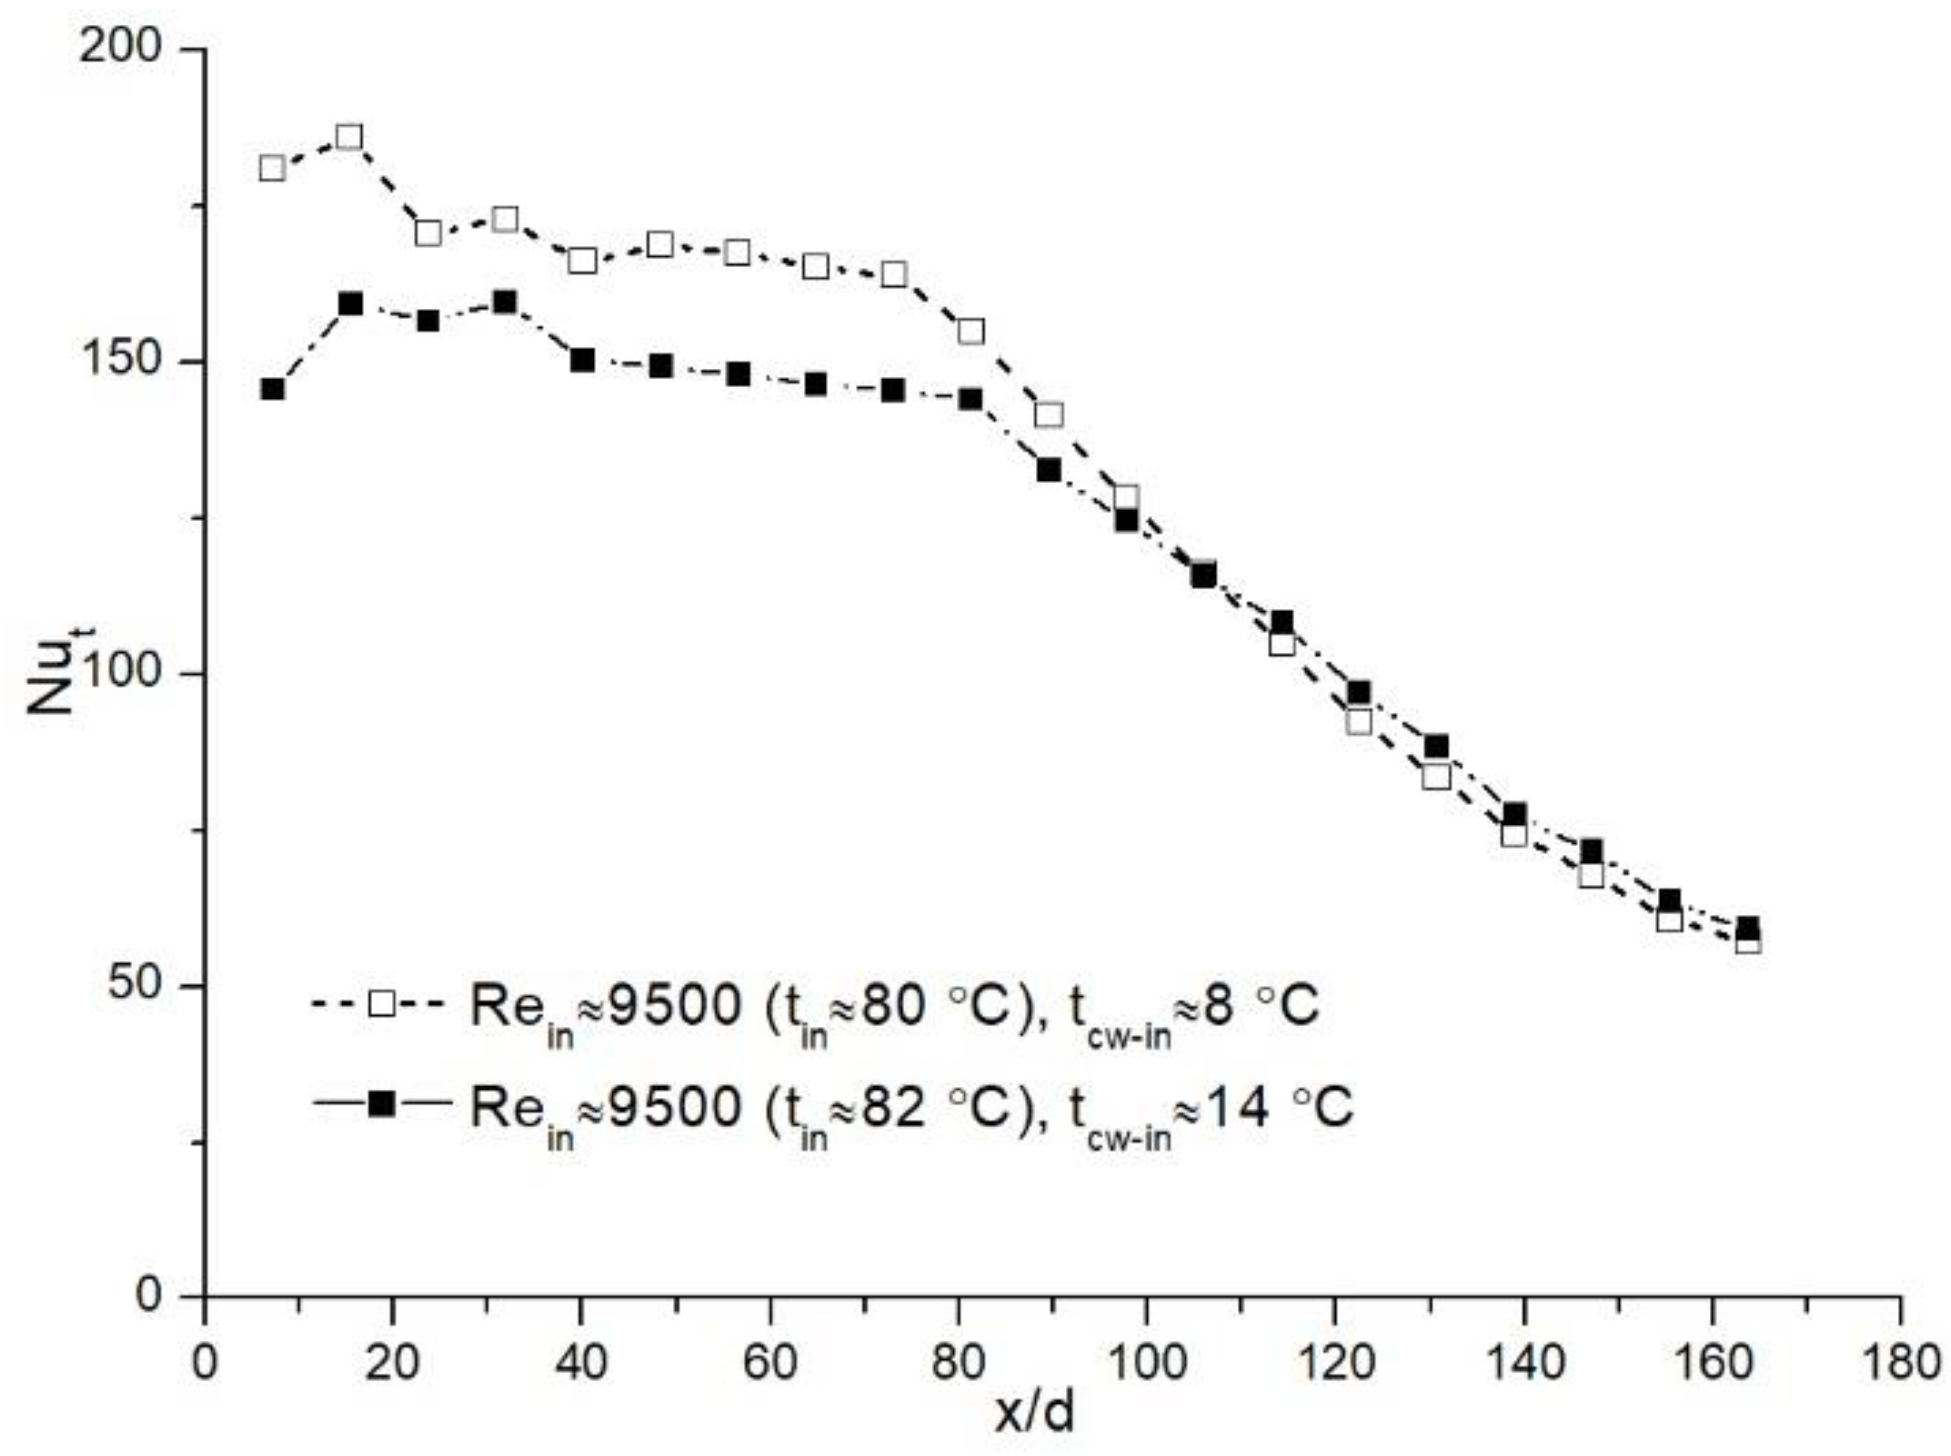
Figure 4 presents a comparison of the Nut distribution along the model for both the flue gas inlet temperatures and different cooling water flow rates. The results show that if the flue gas inlet temperature is higher, Nut remains almost constant along the tube irrespective of the cooling water flow rate.
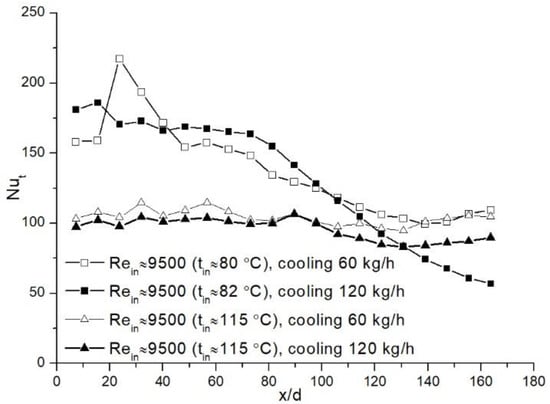
Figure 4.
Comparison of the Nut distribution along the heat exchanger at Rein ≈ 9500, at different inlet temperatures, as well as cooling water flow rates.
For lower flue gas inlet temperatures, Nut changes similarly along the tube for both water flow rates, but the results indicate that more intense condensation takes place only in a half of the test section, i.e., until x/d ≈ 80–90; farther, Nut is decreasing.
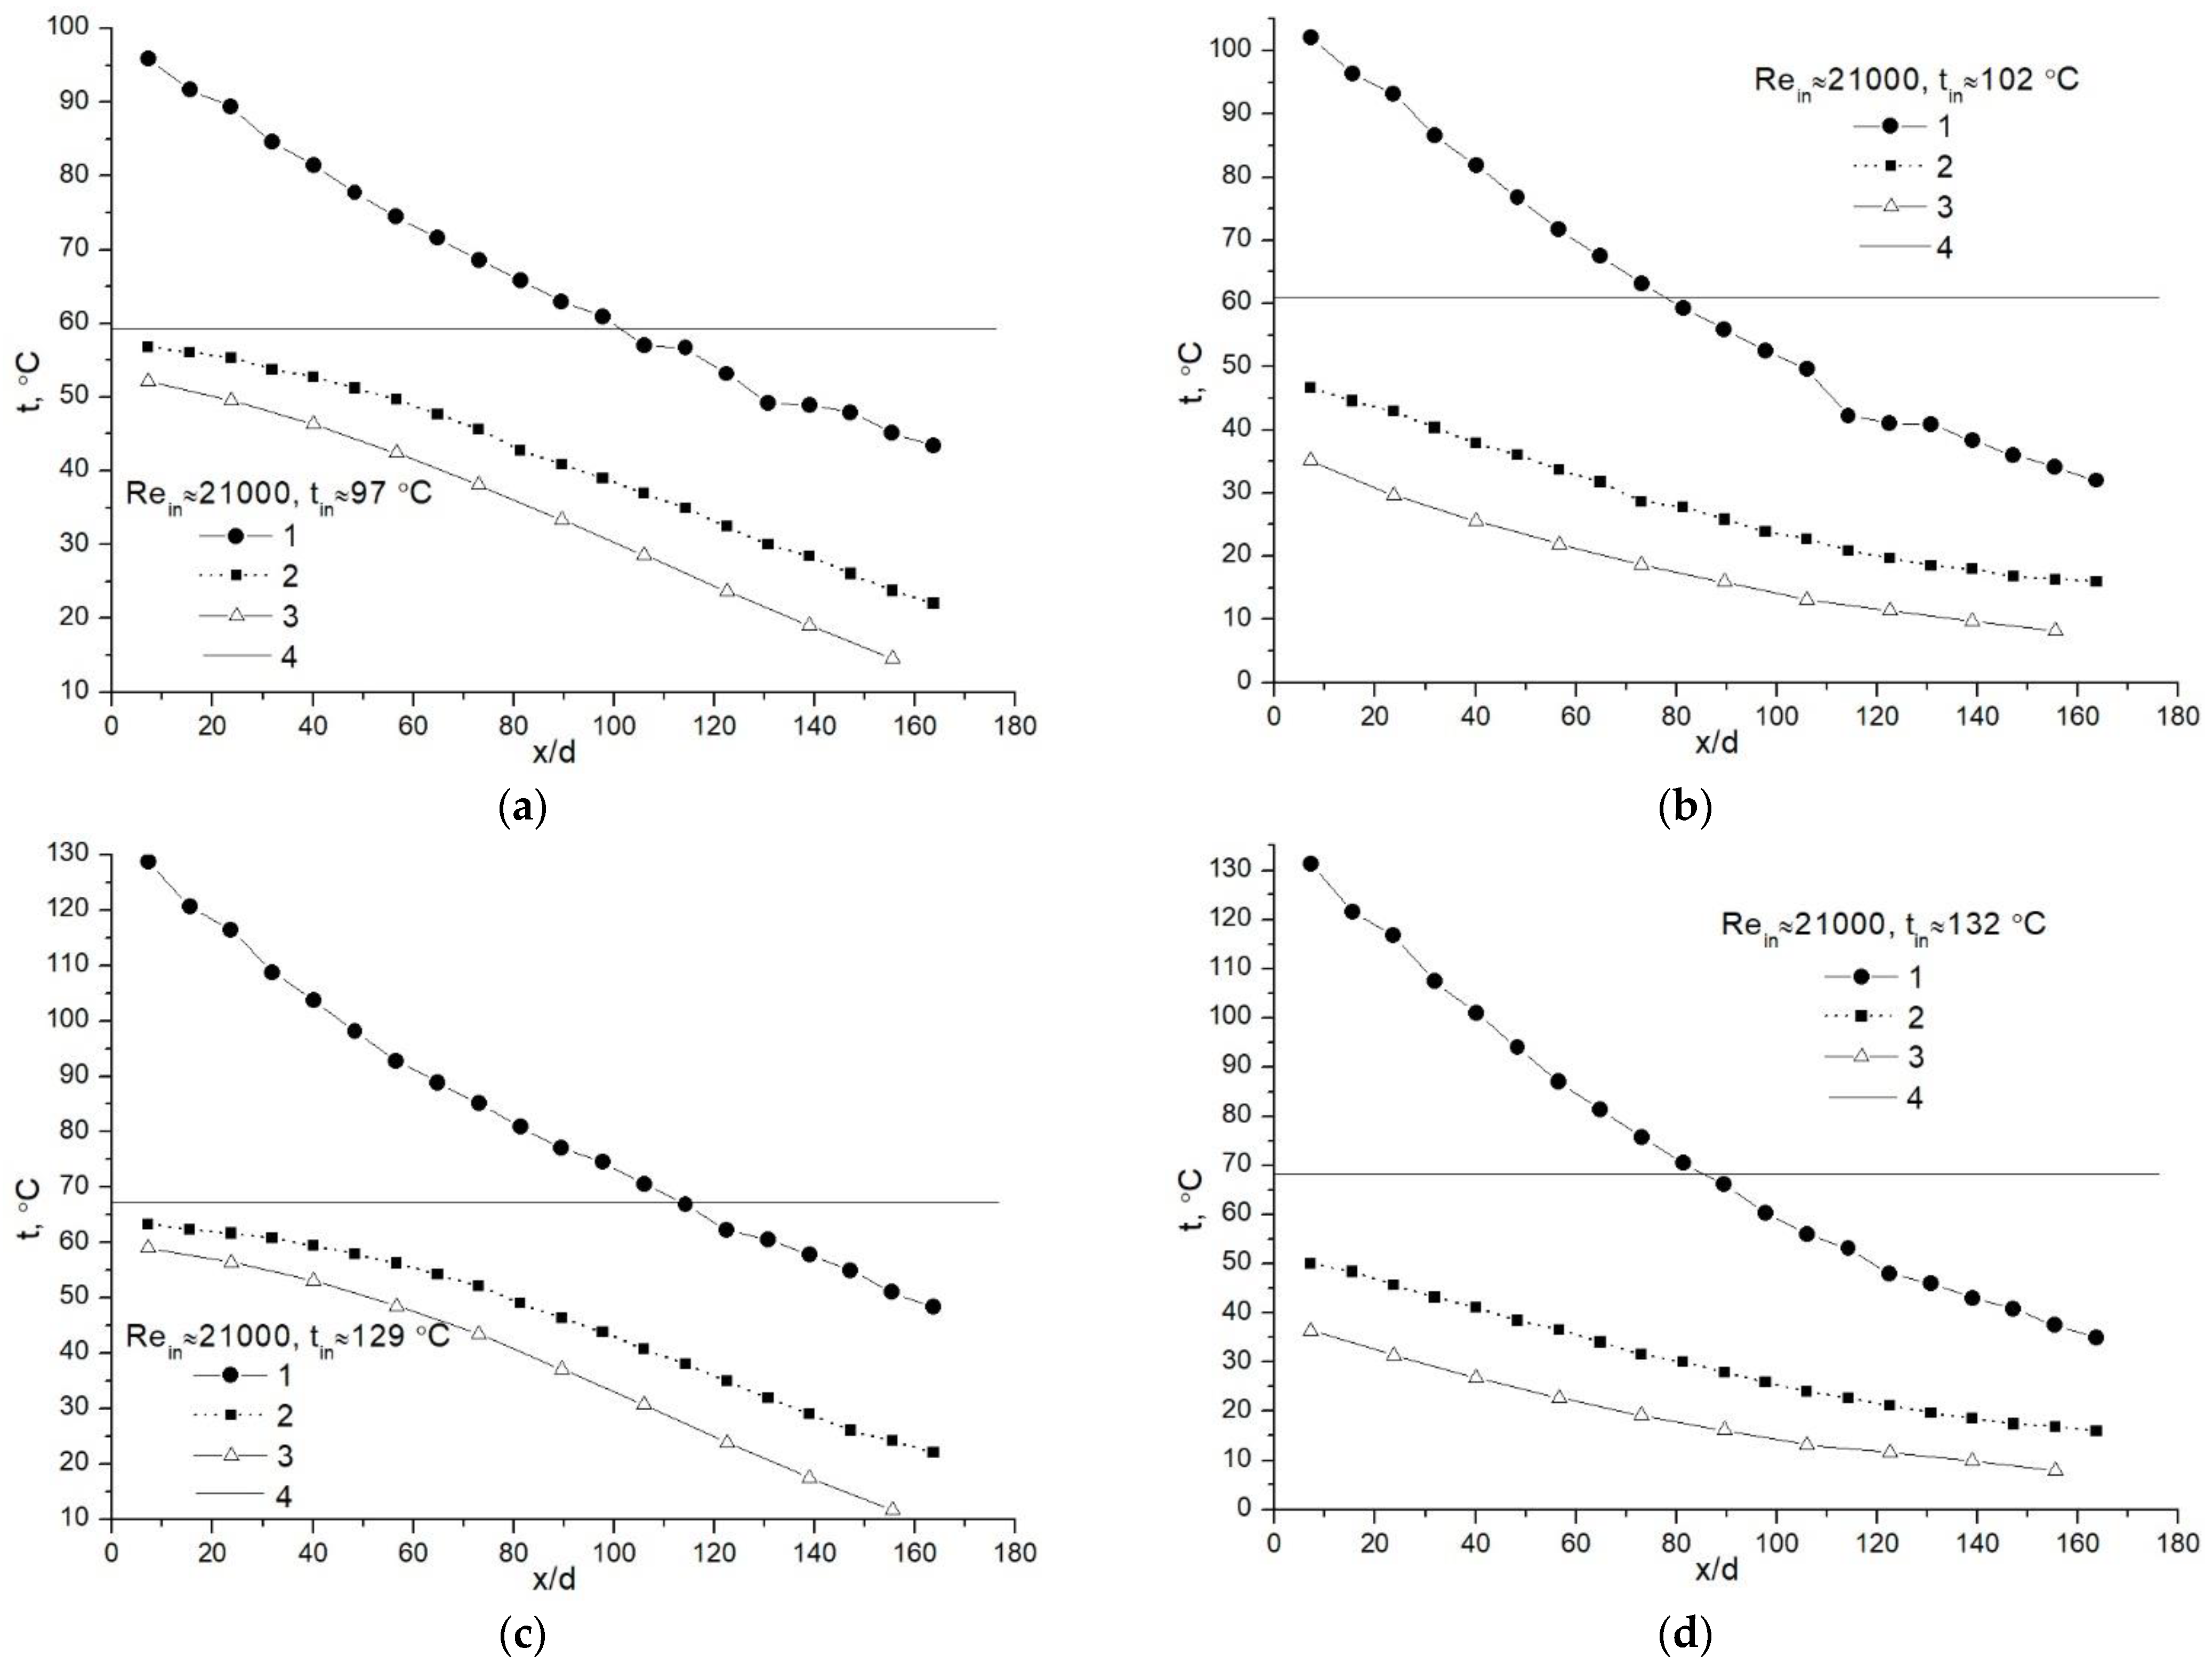
Temperature distributions at Rein ≈ 21,000 are presented in Figure 5. As the Figure shows, that the characteristics are not the same as in Figure 2 (case of lower Rein). Moreover, in Figure 5, the dew point temperature (curve 4) is higher than the wall temperature (curve 2).

Figure 5.
Temperature distribution in the heat exchanger at Rein ≈ 21,000, different flue gas inlet temperatures and the cooling water flow rates of 60 kg/h (a,c) and 120 kg/h (b,d): (1) centre of the tube, (2) the inner wall of the tube, (3) cooling water, (4) the dew point temperature.
As depicted in Figure 5a, the flue gas temperature (curve 1) is almost constantly decreasing along the tube with some small fluctuations at the end.
Temperatures of the tube wall and cooling water (Figure 5a, curves 2 and 3) change very similarly along the length of the model.
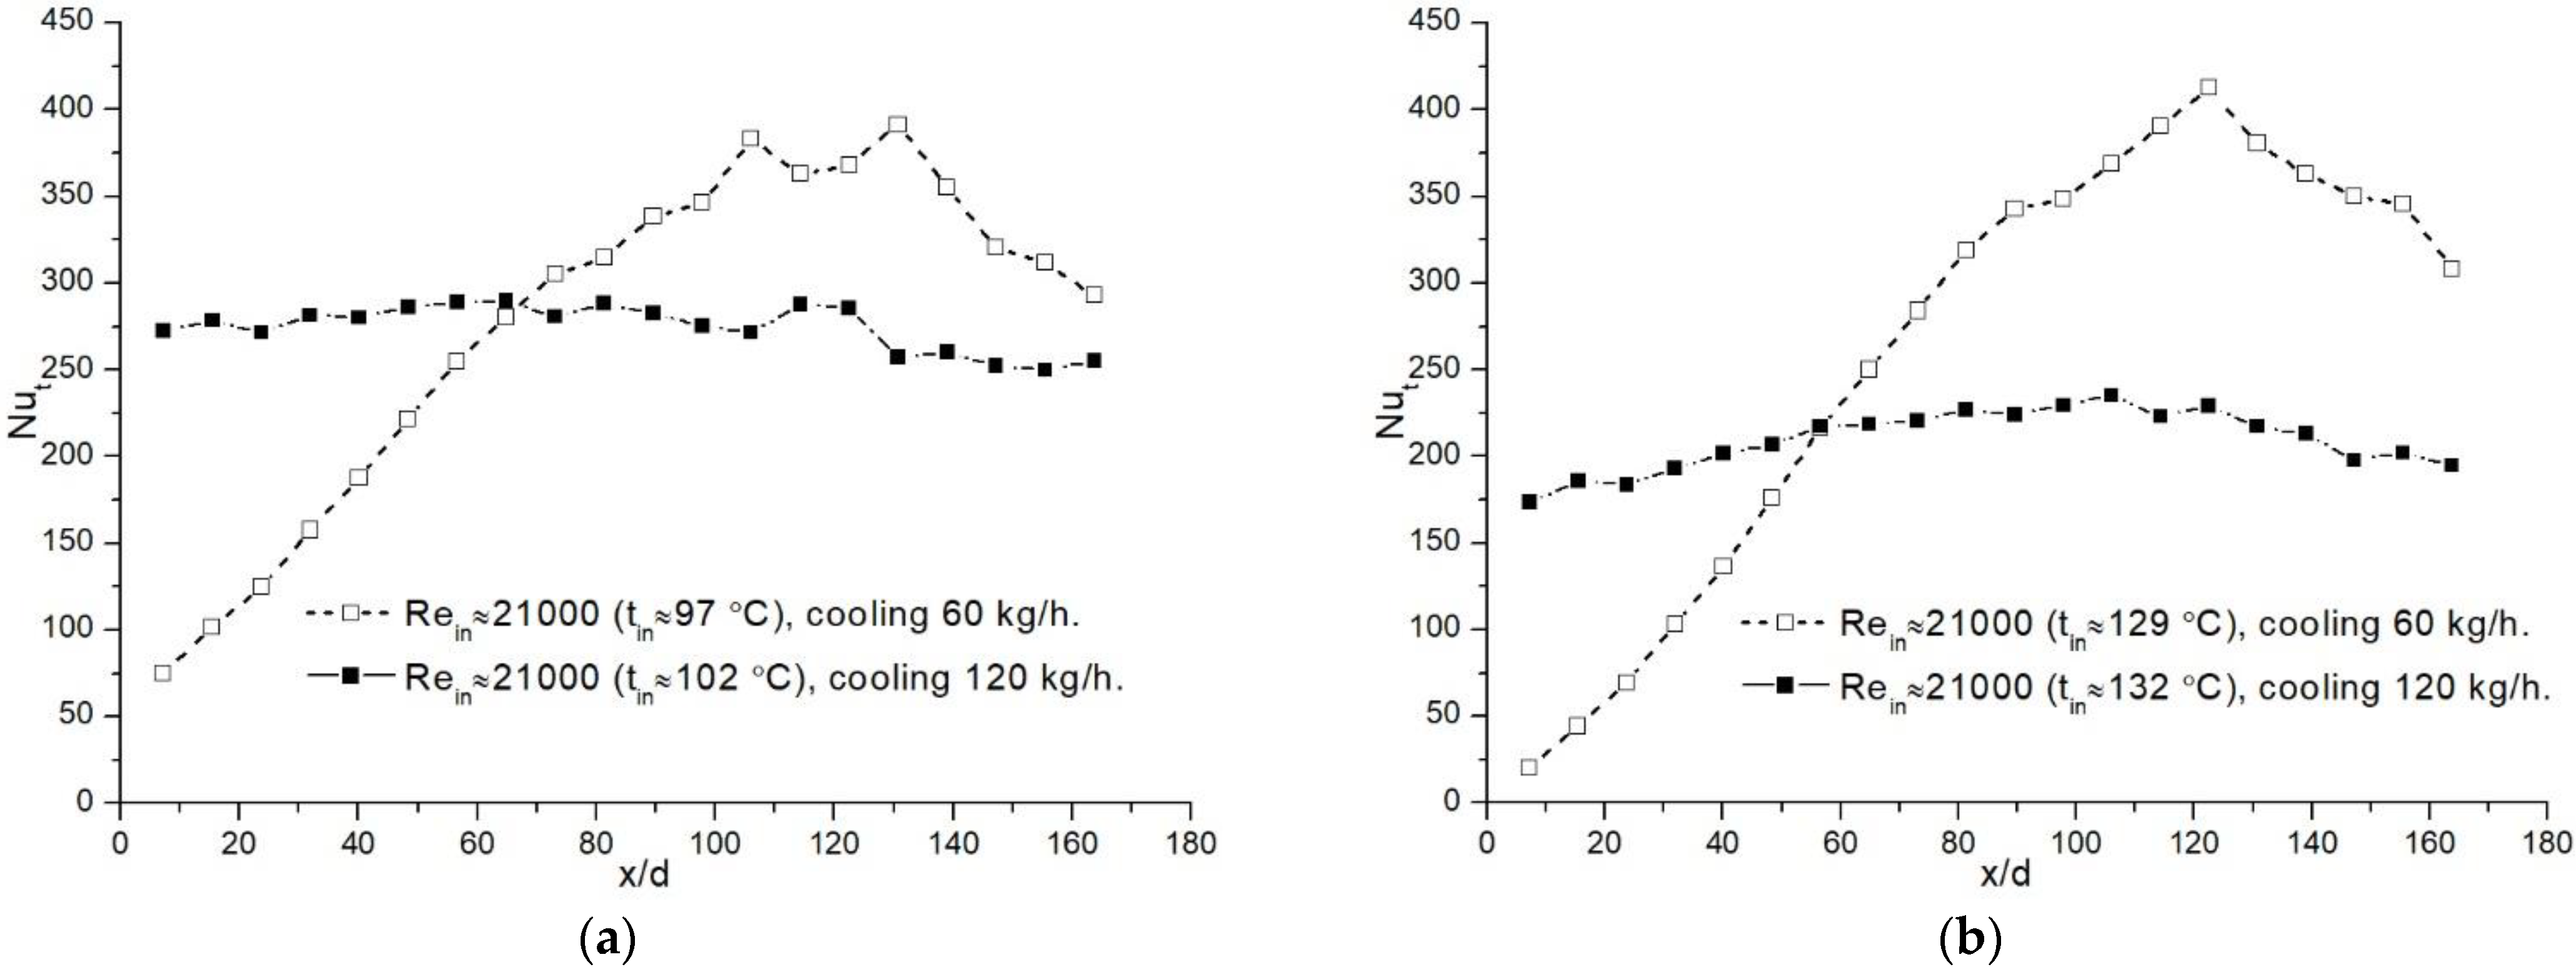
An intensive increase in the water temperature is observed from x/d ≈ 0 until x/d ≈ 30. Farther, the increase becomes less significant. Until the outlet, the cooling water temperature increases by 43 °C, i.e., from 10 °C to 53 °C (Figure 5a, curve 3). This temperature variation is almost opposite in comparison to the results presented in Figure 2a. The characteristics of the wall temperature (Figure 5a, curve 2) are similar to the water temperature. Although, the wall temperature is lower compared to the dew point temperature, the difference between them at the beginning of the tube is small, i.e., 2–3 °C (cf. Figure 5a, curves 2 and 4). That is why the condensation is not intensive at that point (Figure 6a). As the mentioned temperature difference increases with the increase of x/d (Figure 5a), the Nut also increases until x/d ≈ 100 (Figure 6a). Farther along the tube, it remains almost constant with some fluctuations and after that starts to decrease. The decrease in heat transfer happens most likely because of the decreased water vapor mass fraction in the flue gas, despite the fact that the temperature difference between the flue gas and the tube wall remains almost constant until the end of the test section.
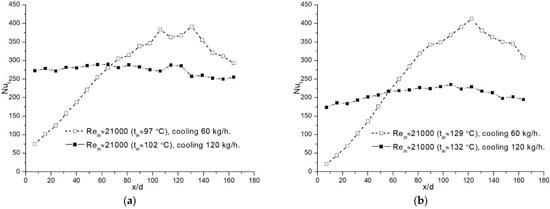
Figure 6.
Distribution of the local Nut in the heat exchanger at Rein ≈ 21,000, at different flue gas inlet temperatures (smaller (a), higher (b)) as well as cooling water flow rates.
When the cooling water flow rate was increased, the characteristics of temperatures changed (Figure 5b) in comparison to those presented in the case of a lower water flow rate (Figure 5a).
When the water flow rate was higher (Figure 5b), two zones of flue gas temperature decrease could be also distinguished: one from x/d = 0 until x/d ≈ 110 where a sharp temperature decrease was observed, and the other from x/d ≈ 110 until the end of the tube, where a much less decrease was observed.
From x/d ≈ 170 (the inlet) until x/d ≈ 110, the cooling water temperature increased slightly, by about 3 °C, i.e., from ≈9 °C to ≈12 °C. After that, the water temperature increase until the outflow was much better expressed: it increased by about 23 °C, i.e., from ≈12 °C to ≈35 °C. This suggests that water vapor condensation should result in higher heat transfer in the range x/d = 0–120, than in the range x/d ≈ 120–170; indeed, the distribution of the Nut presented in Figure 6a confirms that, although it is not very clearly pronounced. As the temperature difference between the dew point and the tube wall temperatures at the beginning of the tube (Figure 5b, curves 2 and 4) is much larger in comparison with the results presented in Figure 5a, the heat transfer in the case of a larger cooling water flow rate is also higher (Figure 6a). However, at the water flow rate of 120 kg/h, the heat transfer is nearly constant (Nut ≈ 275) until x/d ≈ 120. Farther on, till the end of the tube, there is a slight decrease in Nut.
The condensation efficiencies obtained in the cases when the cooling water flow rates were 60 kg/h and 120 kg/h were about 50%.
The temperature distributions at higher inlet flue gas temperatures and different cooling water flow rates presented in Figure 5c,d do not differ much from the cases at lower inlet flue gas temperatures (Figure 5a,b). The difference is slightly higher temperature values when the flue gas inlet temperature is increased.
In the case presented in Figure 5c, the difference between the wall and dew point temperatures at the beginning of the tube is small, and therefore the heat transfer is rather low (Figure 6b, Nut ≈ 25). However, as the difference between those two temperatures increases, the condensation heat transfer also increases rapidly and at x/d ≈ 120 the maximum value of Nut ≈ 415 is reached. As a certain part of the water vapor had condensed until x/d ≈ 120, the influence of condensation heat transfer gained a weakening character, and thus, the heat transfer from x/d ≈ 120 until x/d ≈ 170 was decreasing. Despite that, the Nut at the tube end remained high, i.e., Nut ≈ 300 (Figure 6b).
For cooling water flow rate of 120 kg/h, due to a larger temperature difference between the wall and dew point (Figure 5c), the heat transfer at the initial part of the heat exchanger was much intense (Figure 6b, Nut ≈ 175) in comparison with the water flow rate of 60 kg/h. Farther along the tube, it increased slightly up to Nut ≈ 225 at x/d ≈ 120. After that, due to previously discussed reasons, it started decreasing. At the tube end, the Nut remained high (Figure 6b, Nut ≈ 190).
The condensation efficiencies at water flow rates of 60 kg/h and 120 kg/h were determined to be almost the same, i.e., about 42%. The efficiencies in the case of Rein ≈ 21,000 were smaller than in the case of Rein ≈ 9500. This happened because the flue gas of a higher Rein number moves faster through the experimental setup, spends less time in it and, therefore, a decreased condensation efficiency is obtained.
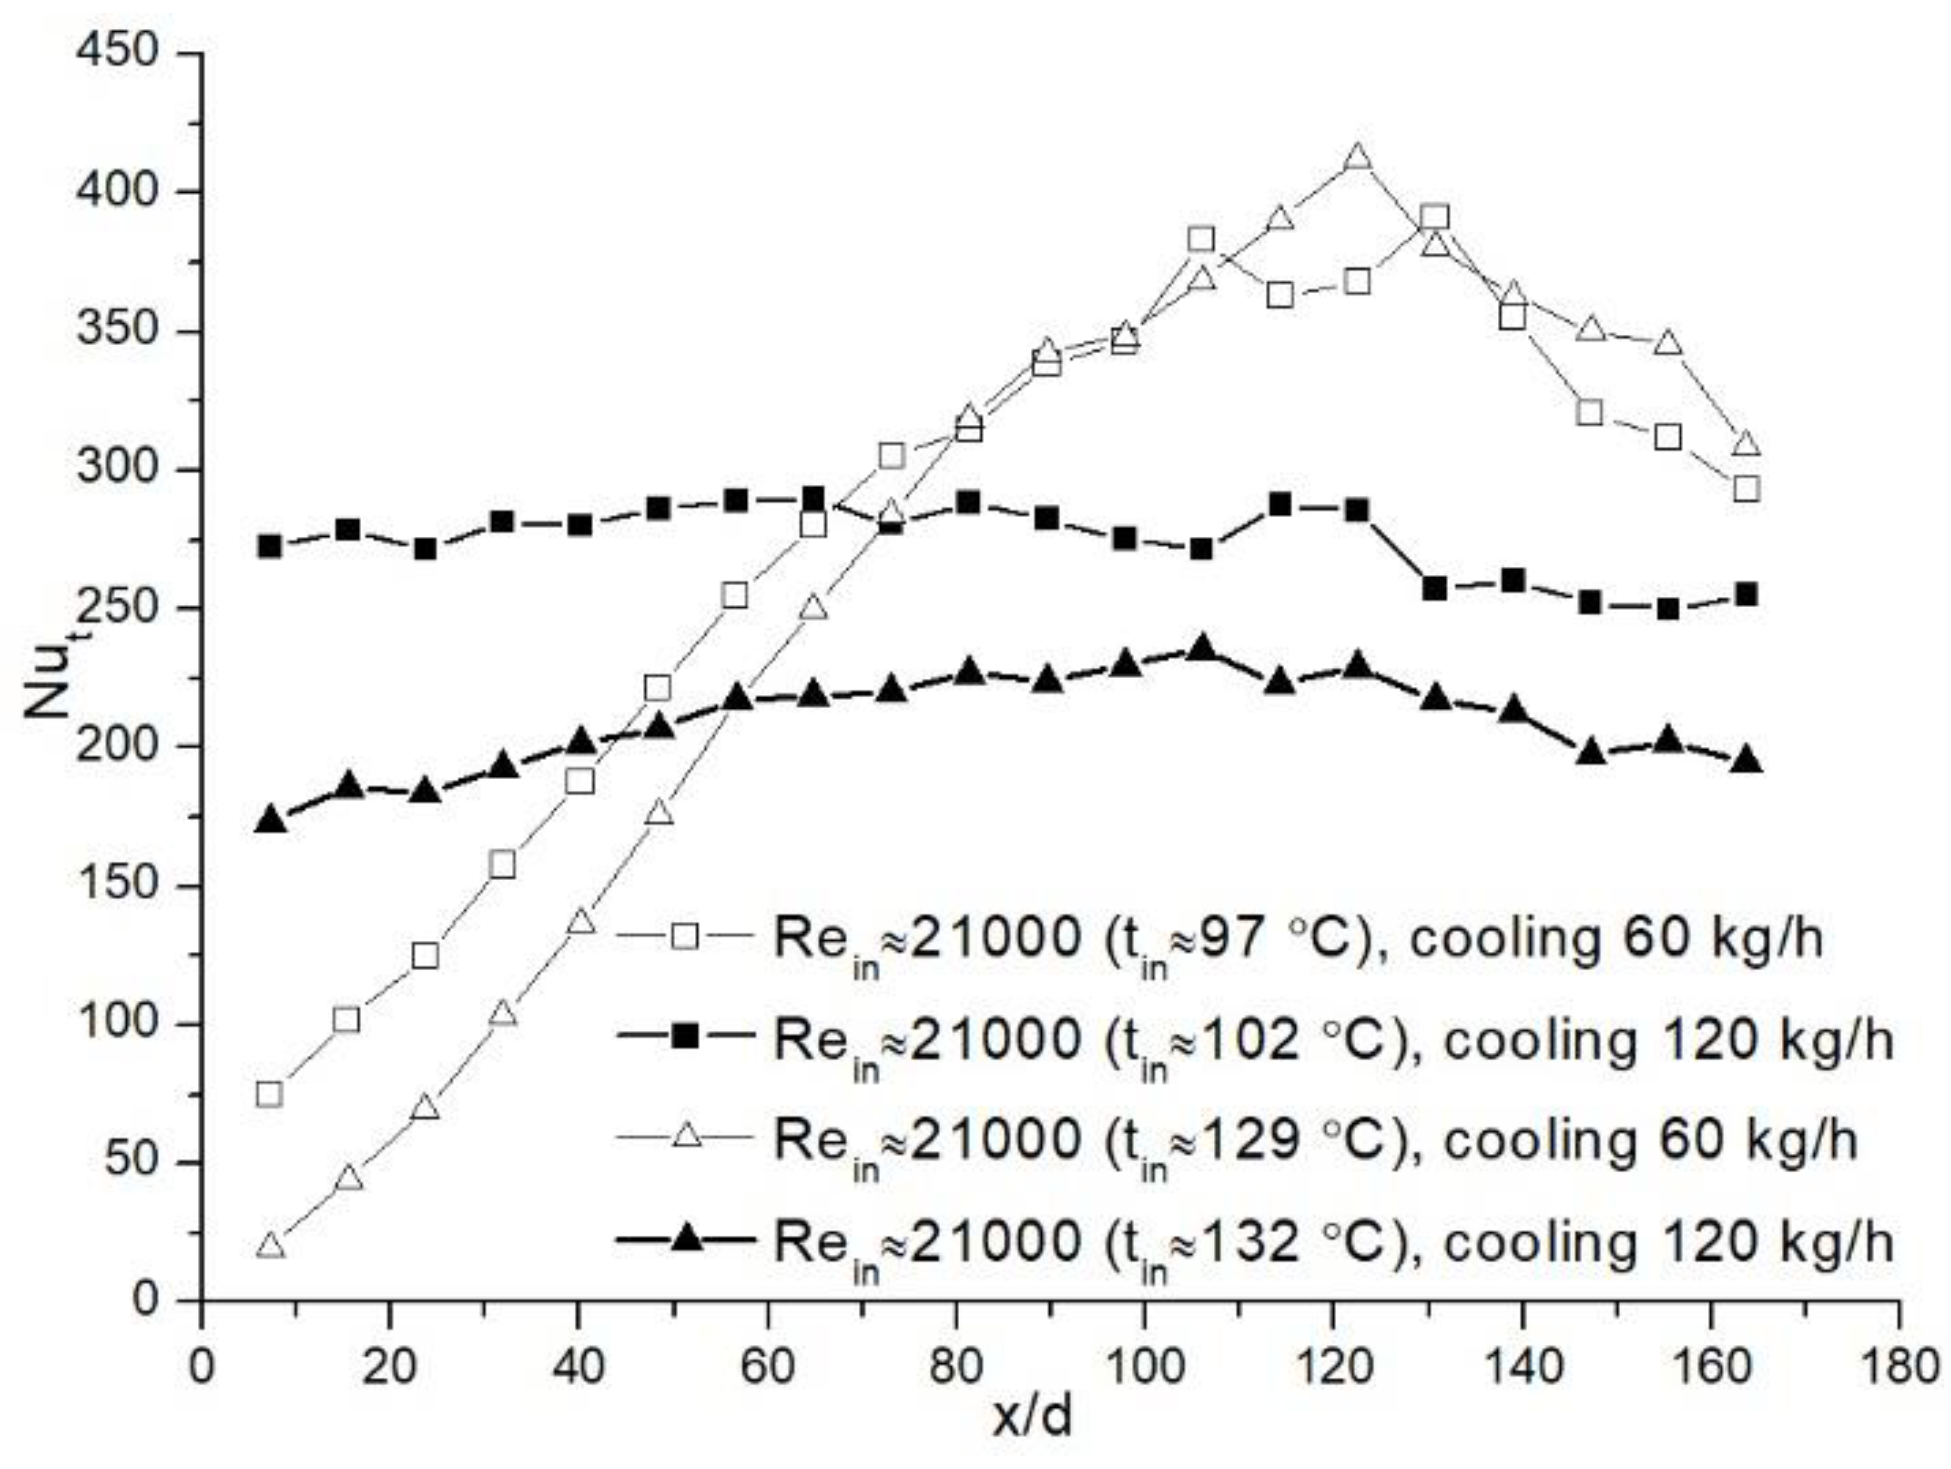
For comparison purposes, all the local Nusselt number distribution results for Rein ≈ 21,000 are presented in Figure 7. As the Figure shows, at a higher cooling water flow rate, Nut remains more constant along the tube. This leads to a conclusion that the condensation in this case is more even.
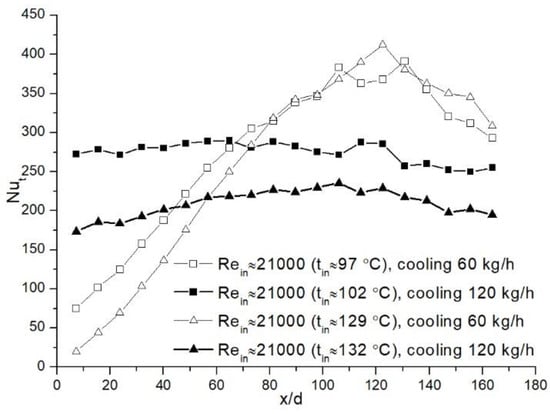
Figure 7.
Comparison of the local Nut distribution in the heat exchanger at Rein ≈ 21,000, different flue gas inlet temperatures and cooling water flow rates.
3.2. Effect of the Cooling Water Temperature
To reveal the effect of cooling water temperature on the distribution of temperatures along the tube and on the local Nut number, an additional series of experiments was performed with the cooling water inlet temperature (tcw-in) of about 14–15 °C and the flow rate of 120 kg/h (≈2 L/ min).
There are no significant differences between the results obtained for higher and lower cooling water inlet temperatures (cf. Figure 2b and Figure 8a): the temperature values are only slightly higher in Figure 8a. Moreover, the difference in the temperatures of the flue gas, the tube wall, and the water in the case of a higher cooling water inlet temperature is smaller than in the case of a lower cooling water inlet temperature.
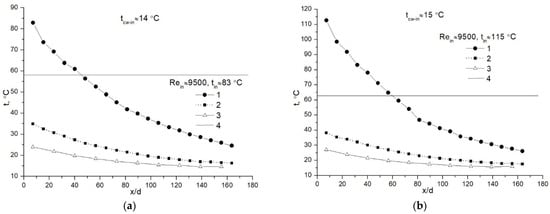
Figure 8.
Temperature distribution in the heat exchanger at Rein ≈ 9500, at flue gas temperatures (a) tin ≈ 83 °C, (b) tin ≈ 115 °C, and at similar cooling water inlet temperatures: (1) center of the tube, (2) the inner wall of the tube, (3) cooling water, (4) the dew point temperature.
Smaller temperature differences resulted in the decreased influence of condensation heat transfer, and, therefore, from x/d = 0 until about x/d = 100, the Nut was smaller in comparison to a lower cooling water inlet temperature (Figure 9). From x/d ≈ 100 until the tube end, the Nut was decreasing and was the same for both water inlet temperatures.
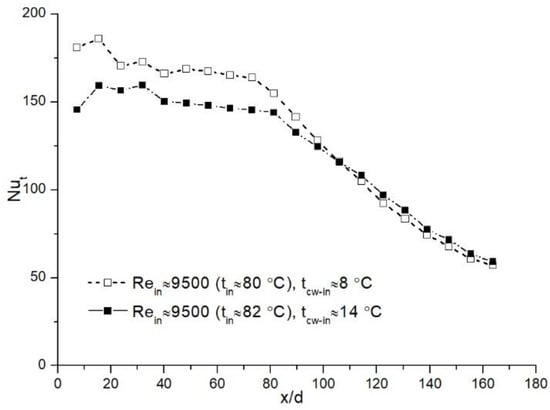
Figure 9.
Distribution of the local Nut in the heat exchanger at Rein ≈ 9500 and at different cooling water inlet temperatures.
Condensation efficiencies for the cases with water inlet temperatures of ≈8 °C and ≈14 °C did not differ significantly and were about 60 and 50%, respectively, indicating that a more intense condensation was obtained at a lower cooling water inlet temperature.
Temperature distribution results obtained for a higher flue gas inlet temperature presented in Figure 8b do not indicate any drastic changes in comparison with similar flue gas inlet temperatures, but lower cooling water temperature (Figure 2d). Here (Figure 8b) it should also be noted that the tube wall and water temperatures are by a few degrees higher than at a lower water inlet temperature (Figure 2d).
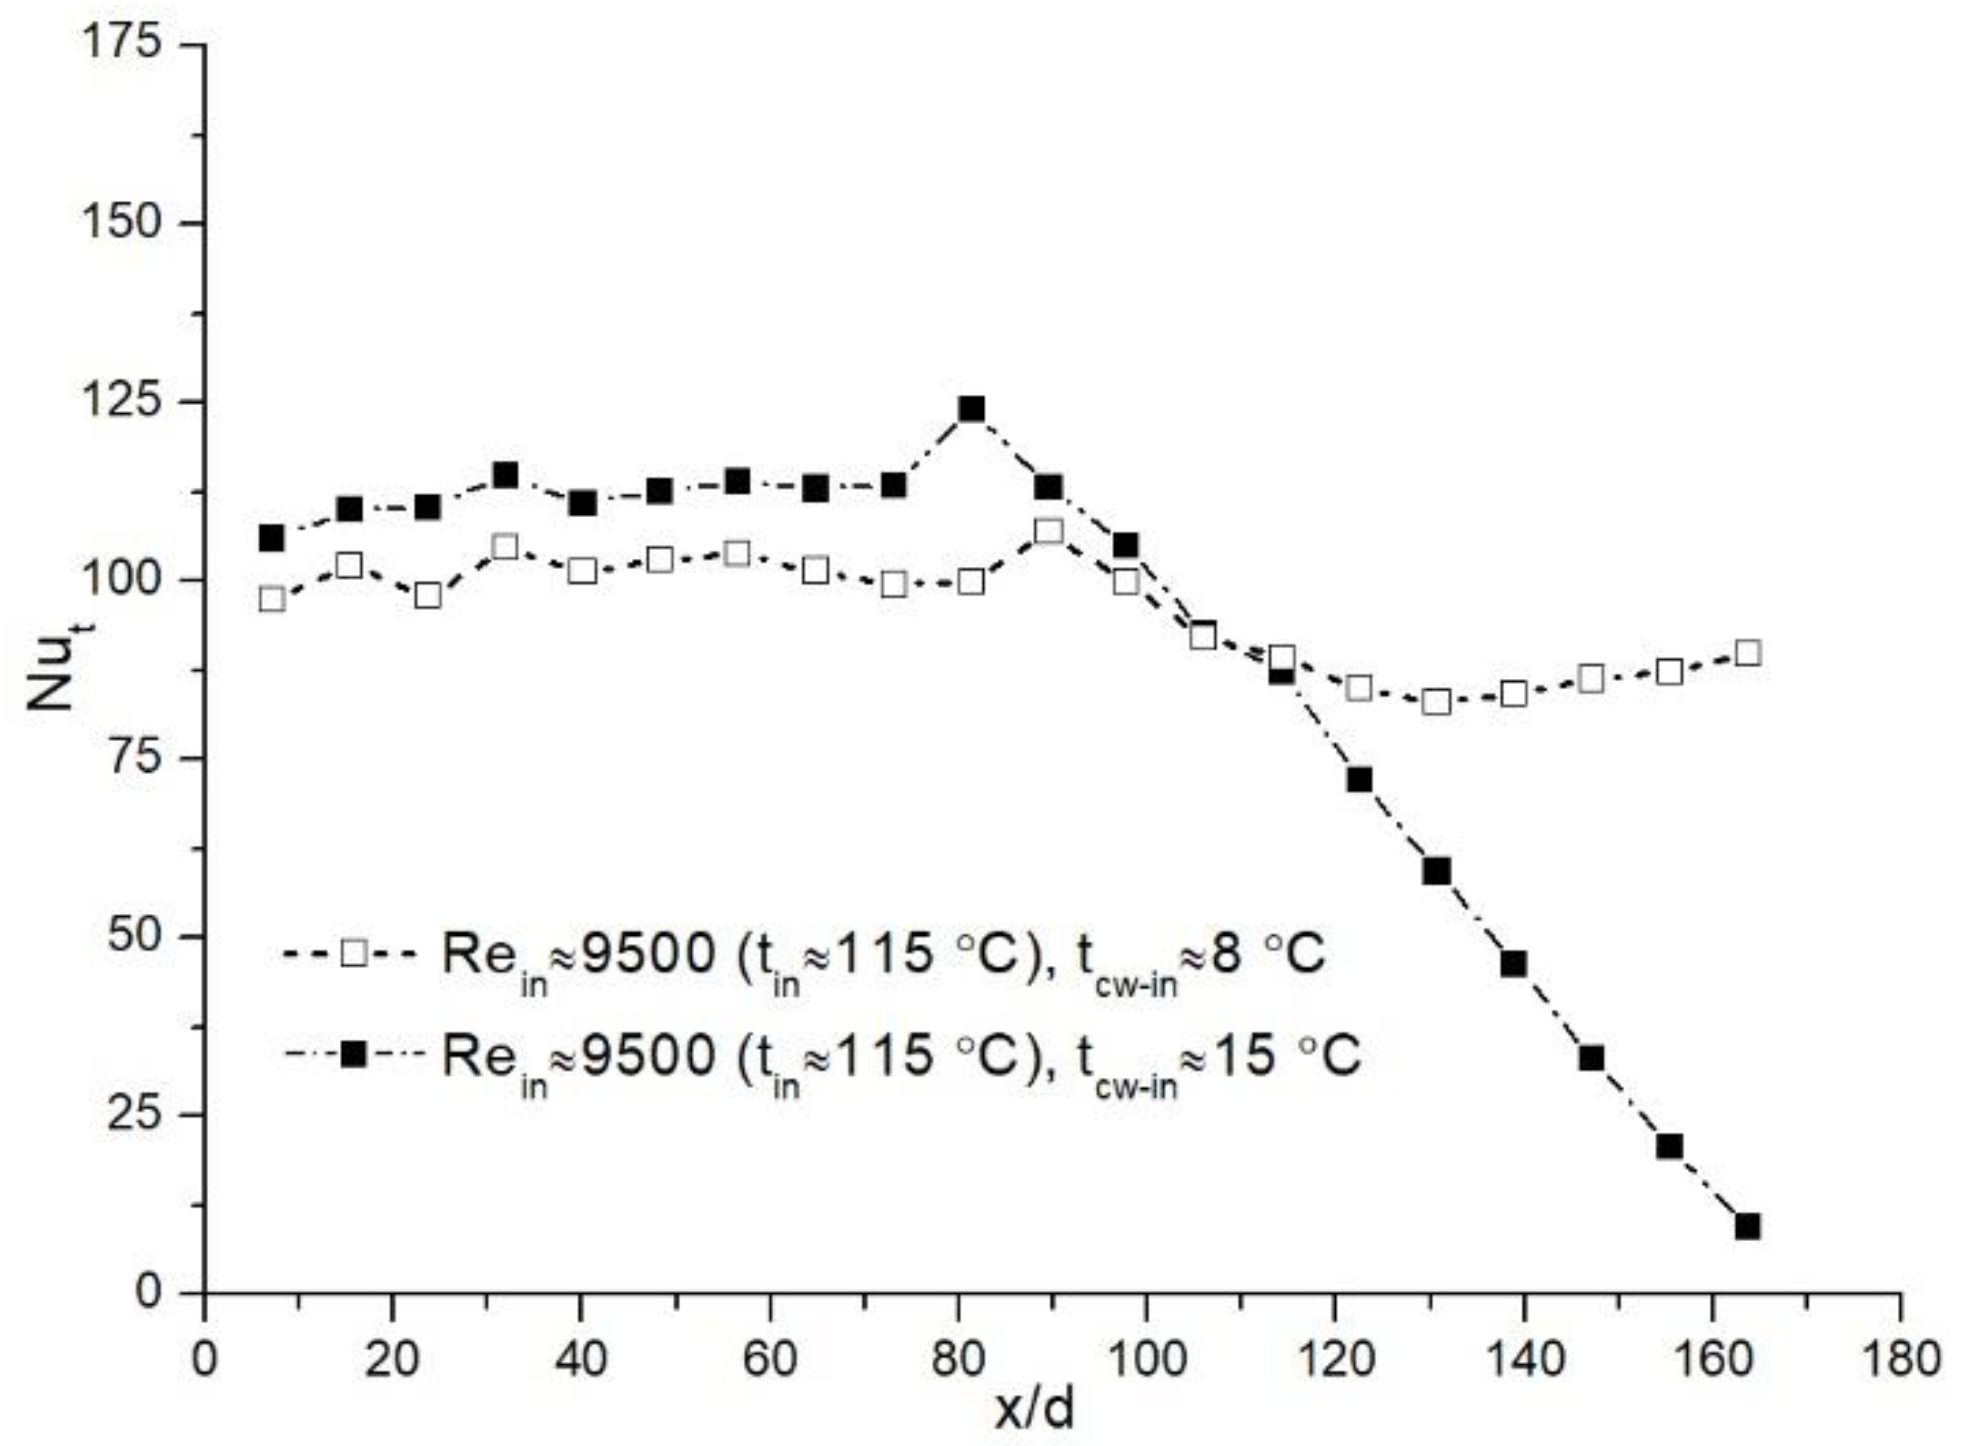
Only negligible differences in the Nut obtained in the case of a lower and a higher cooling water inlet temperatures were determined from the beginning of the tube until x/d ≈ 90–100 (Figure 10). After that, Nut was decreasing. However, when the cooling water inlet temperature was lower, the Nut stabilized and remained in the range of 78–88, while when the temperature was higher, the Nut decreased sharply until the end of the tube. Hence, the results show that only a certain length of the pipe is involved in higher condensation heat transfer. The condensation efficiencies in this case do not differ significantly and for tcw-in ≈ 8 °C, it is ≈58% and for tcw-in ≈ 15 °C it is ≈52%.
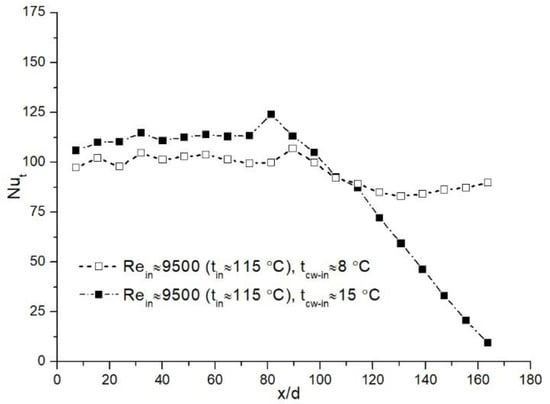
Figure 10.
Distribution of the Nut in the heat exchanger at Rein ≈ 9500 and at different cooling water inlet temperatures.
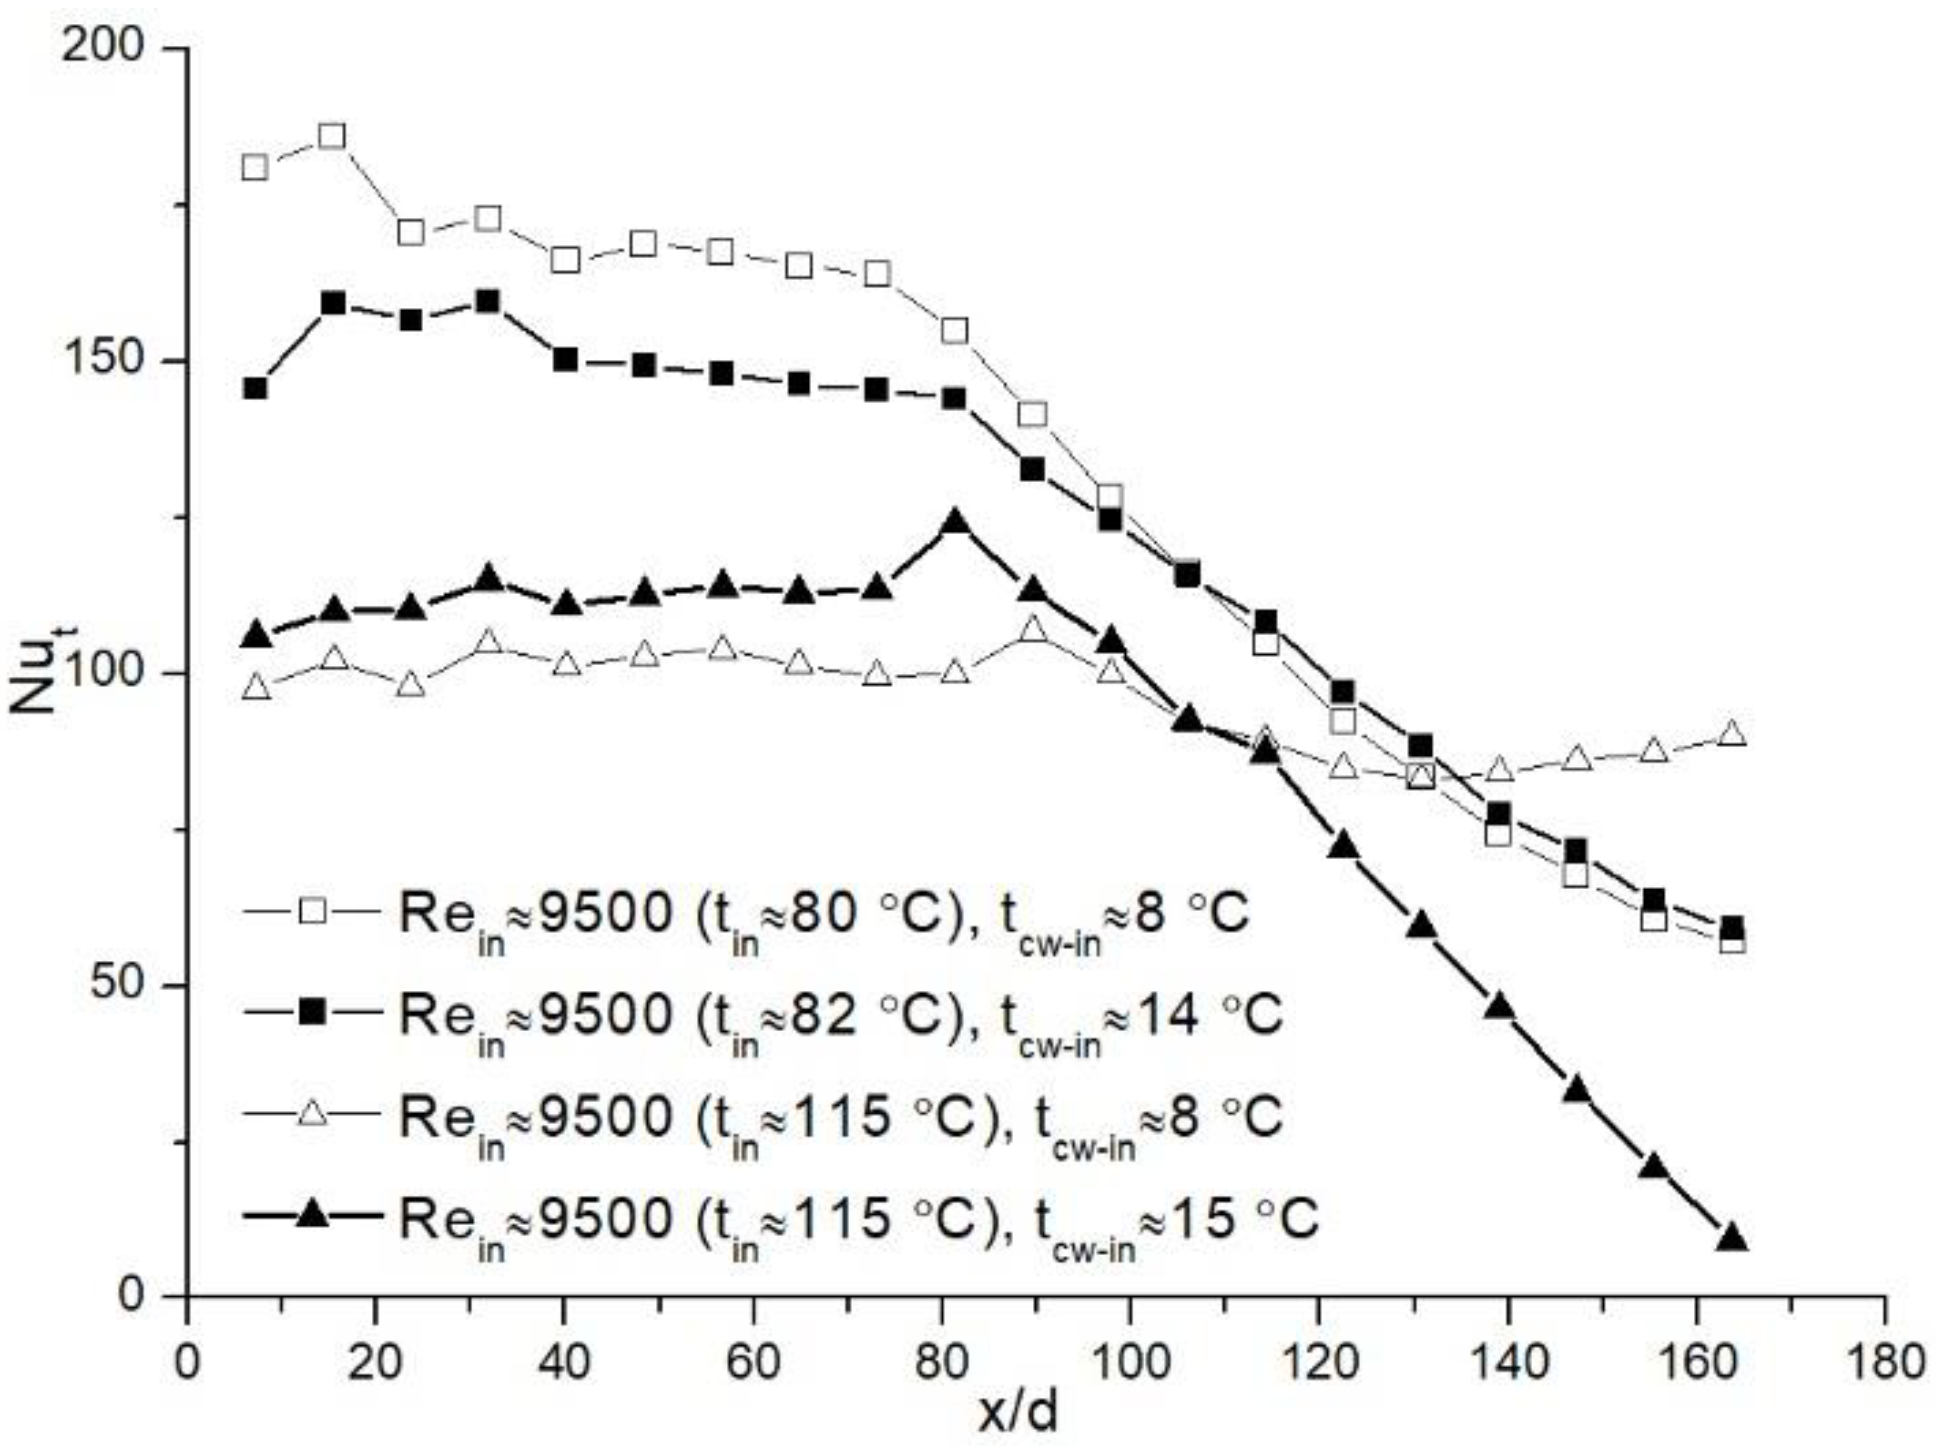
The comparison of the Nut distribution in the condensing heat exchanger (Figure 11) shows that it remains almost constant until about x/d ≈ 80–90, and starts to decrease farther on. Hence, only a certain length of the heat exchanger is efficiently used for condensation heat transfer.
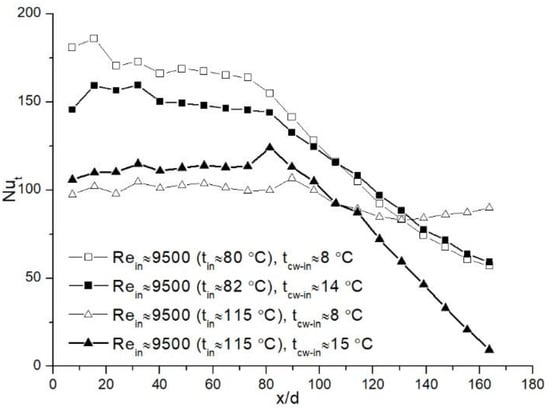
Figure 11.
Comparison of the local Nut distribution in the heat exchanger at Rein ≈ 9500, at different flue gas inlet and cooling water temperatures.
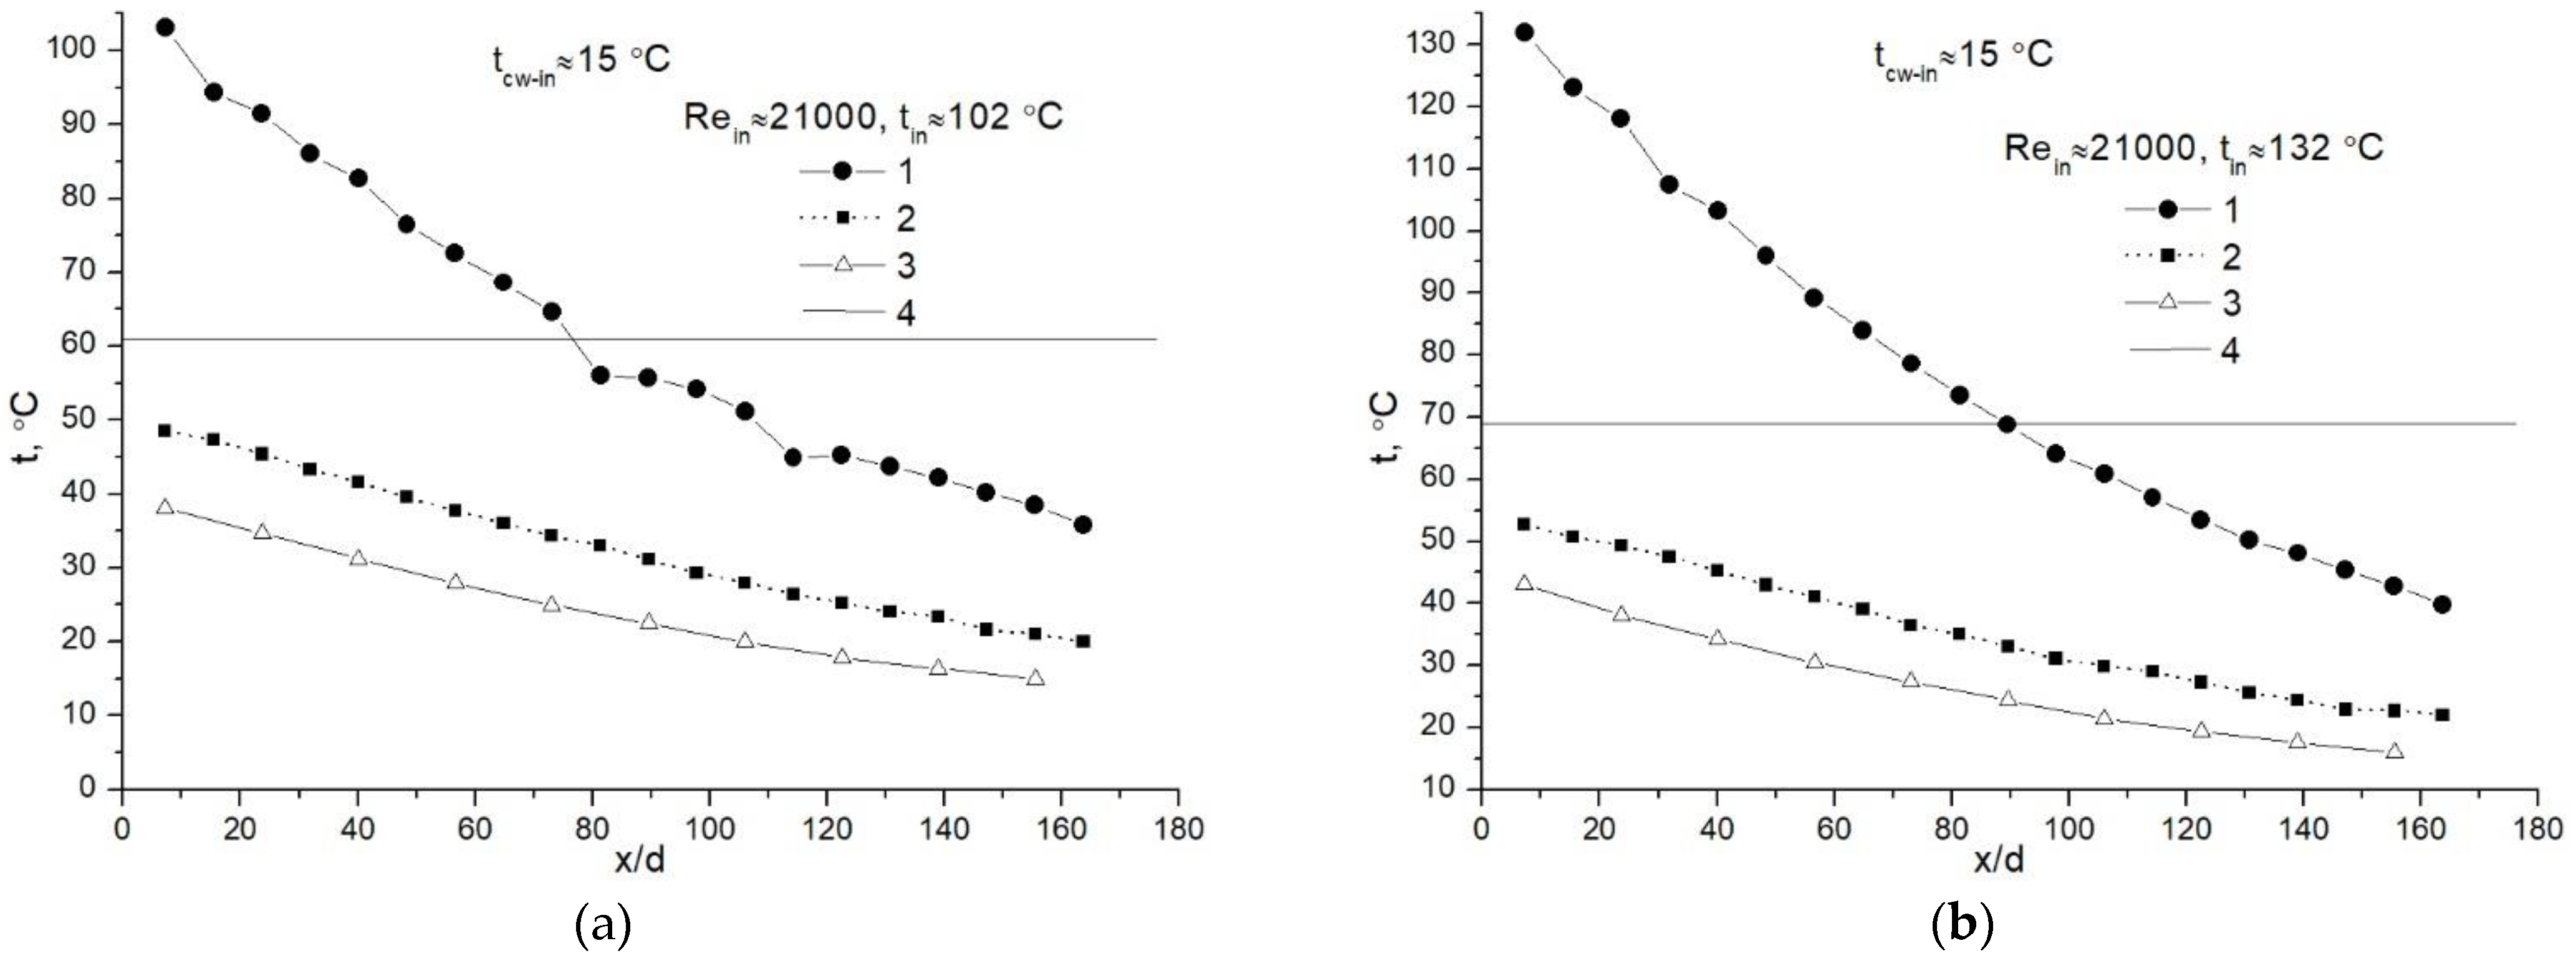
The temperature distribution results for higher Rein numbers are presented in Figure 12. The results (Figure 12a) are similar to the already discussed earlier (Figure 5b). The only difference is a little higher tube wall and cooling water temperatures for a higher inlet flue gas temperature as compared to a lower cooling water inlet temperature (Figure 5b).
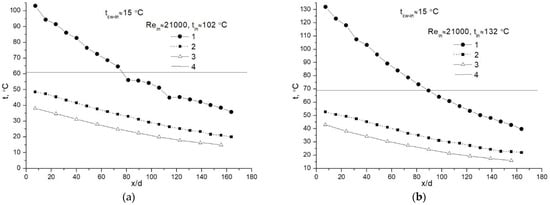
Figure 12.
Temperature distribution in heat exchanger at Rein ≈ 21,000, flue gas temperatures (a) tin ≈ 102 °C, (b) tin ≈ 132 °C, and similar cooling water inlet temperatures: (1) center of the tube, (2) the inner wall of the tube, (3) cooling water, (4) the dew point temperature.
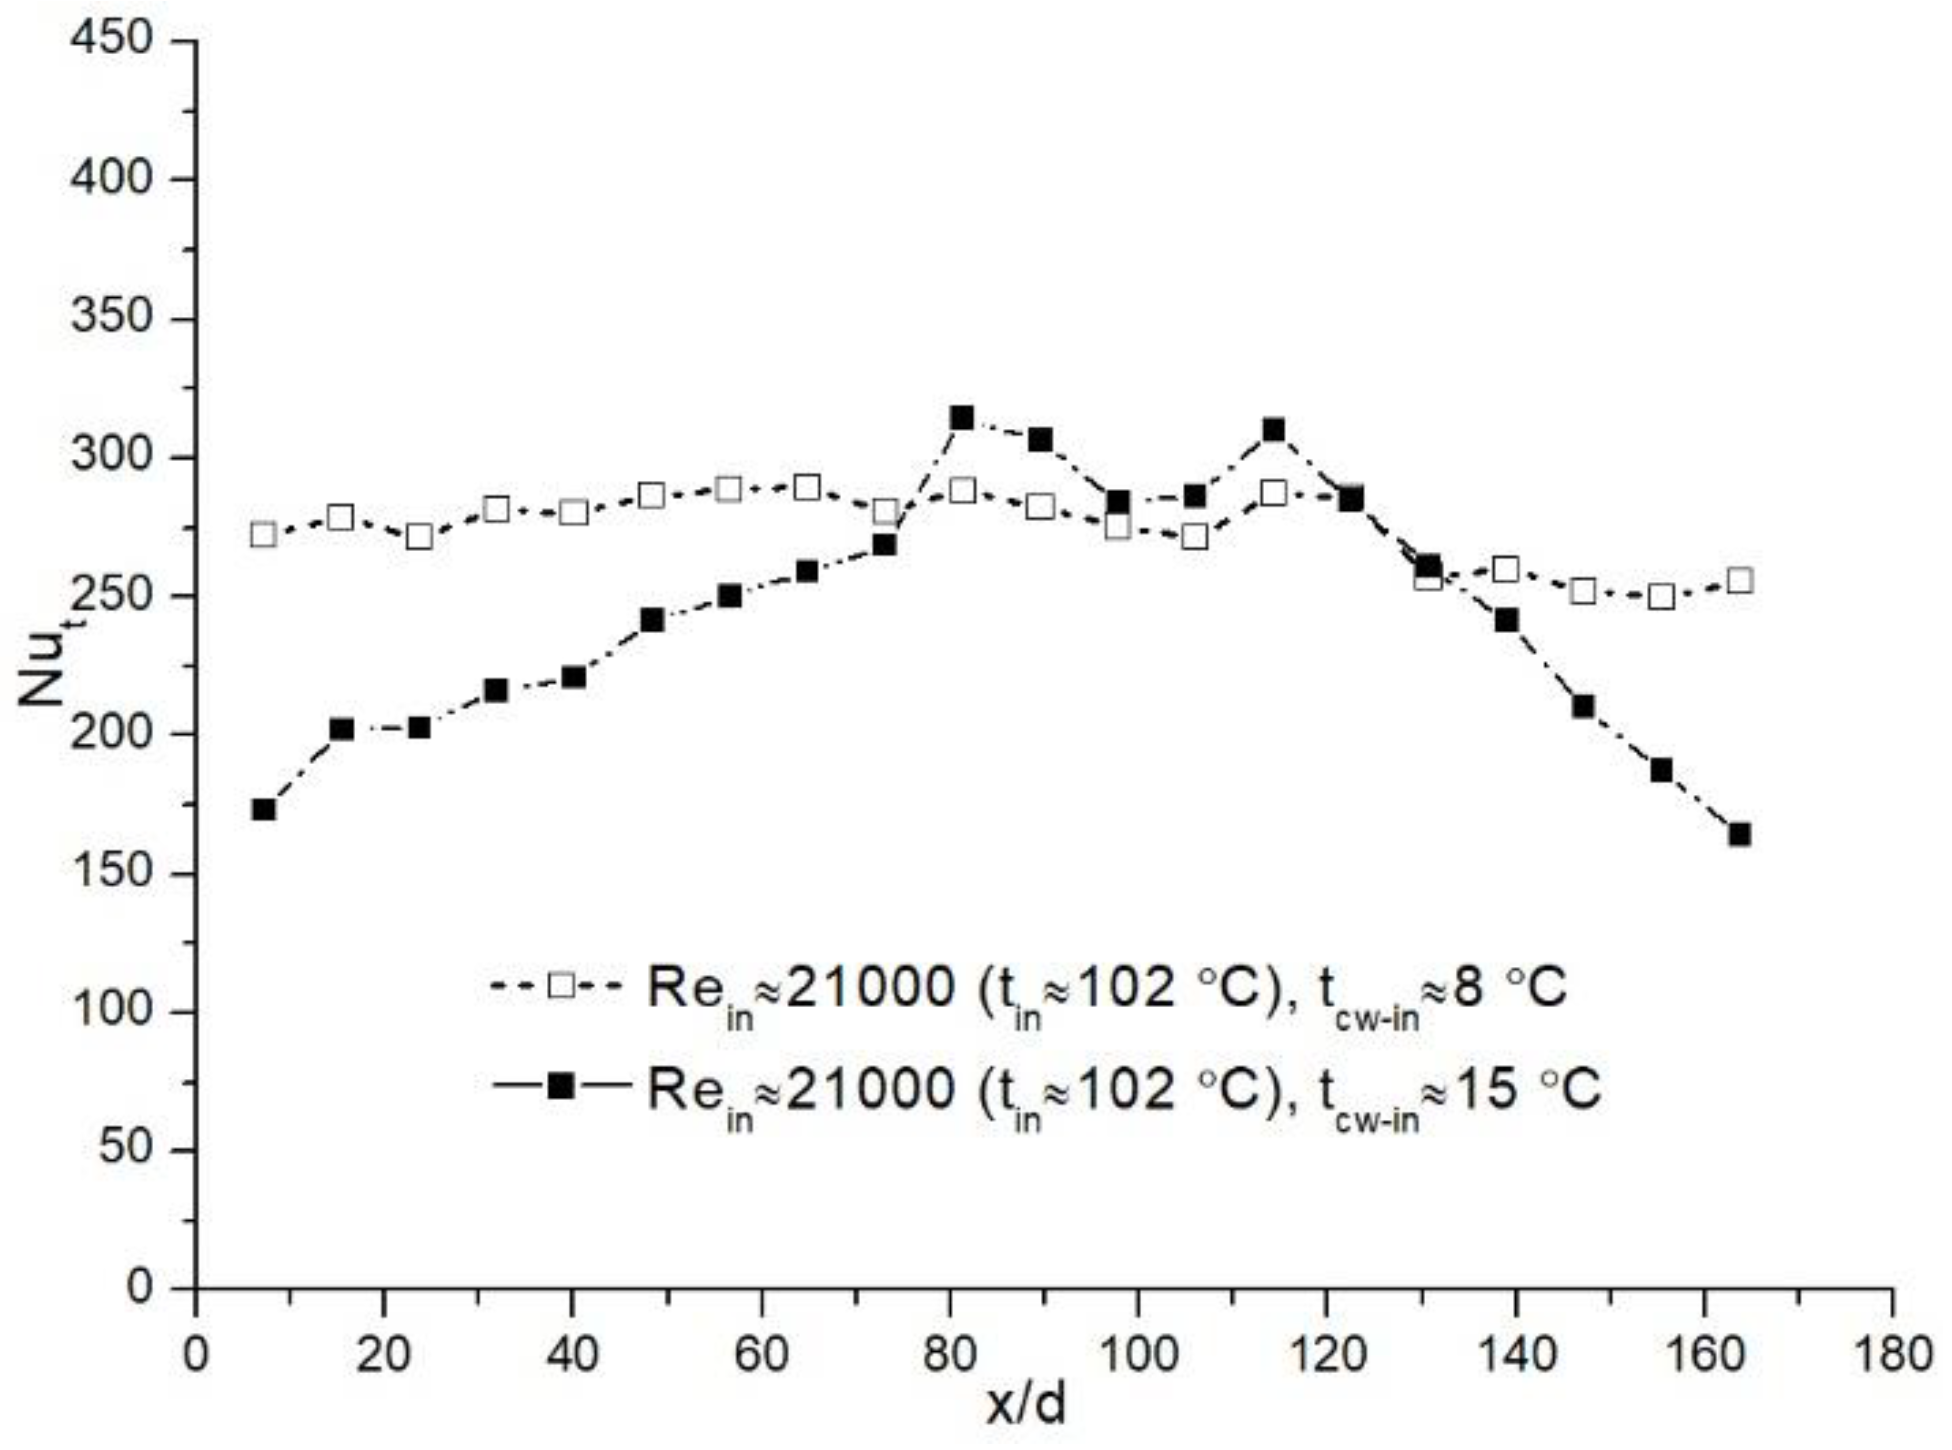
Some changes along the tube were determined in the Nut (Figure 13). When the cooling water inlet temperature was lower, the Nut remained almost constant along the tube, while at a higher water inlet temperature at the beginning of the tube, the Nut was smaller (Nut ≈ 175). But it was constantly increasing until x/d ≈ 90, where in the x/d range ≈90–130 it reached almost the same value as at a lower cooling water inlet temperature. Then, a slight decrease in Nut was noticed for both cases. However, at a lower water inlet temperature, the Nut stabilized, while at a higher temperature, the Nut was decreasing constantly. The distribution of the Nut at higher water inlet temperatures indicates that the condensation process is not even along the tube, yet it has expressed minimums and maximums.
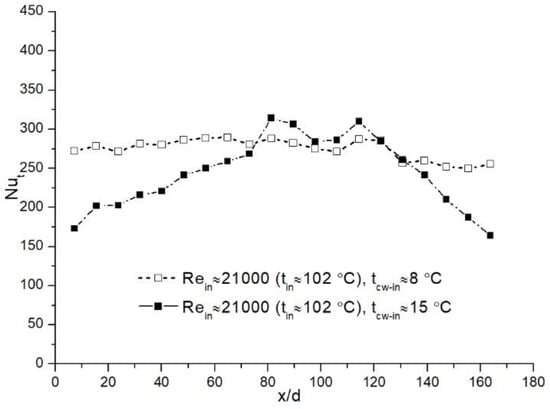
Figure 13.
Distribution of the Nut in the heat exchanger at Rein ≈ 21,000, the same flue gas inlet temperature, cooling water flow rate, and cooling water inlet temperatures.
The condensation efficiencies determined in the analyzed case were similar: 42% and 39%. Higher efficiency was obtained at a lower cooling water inlet temperature.
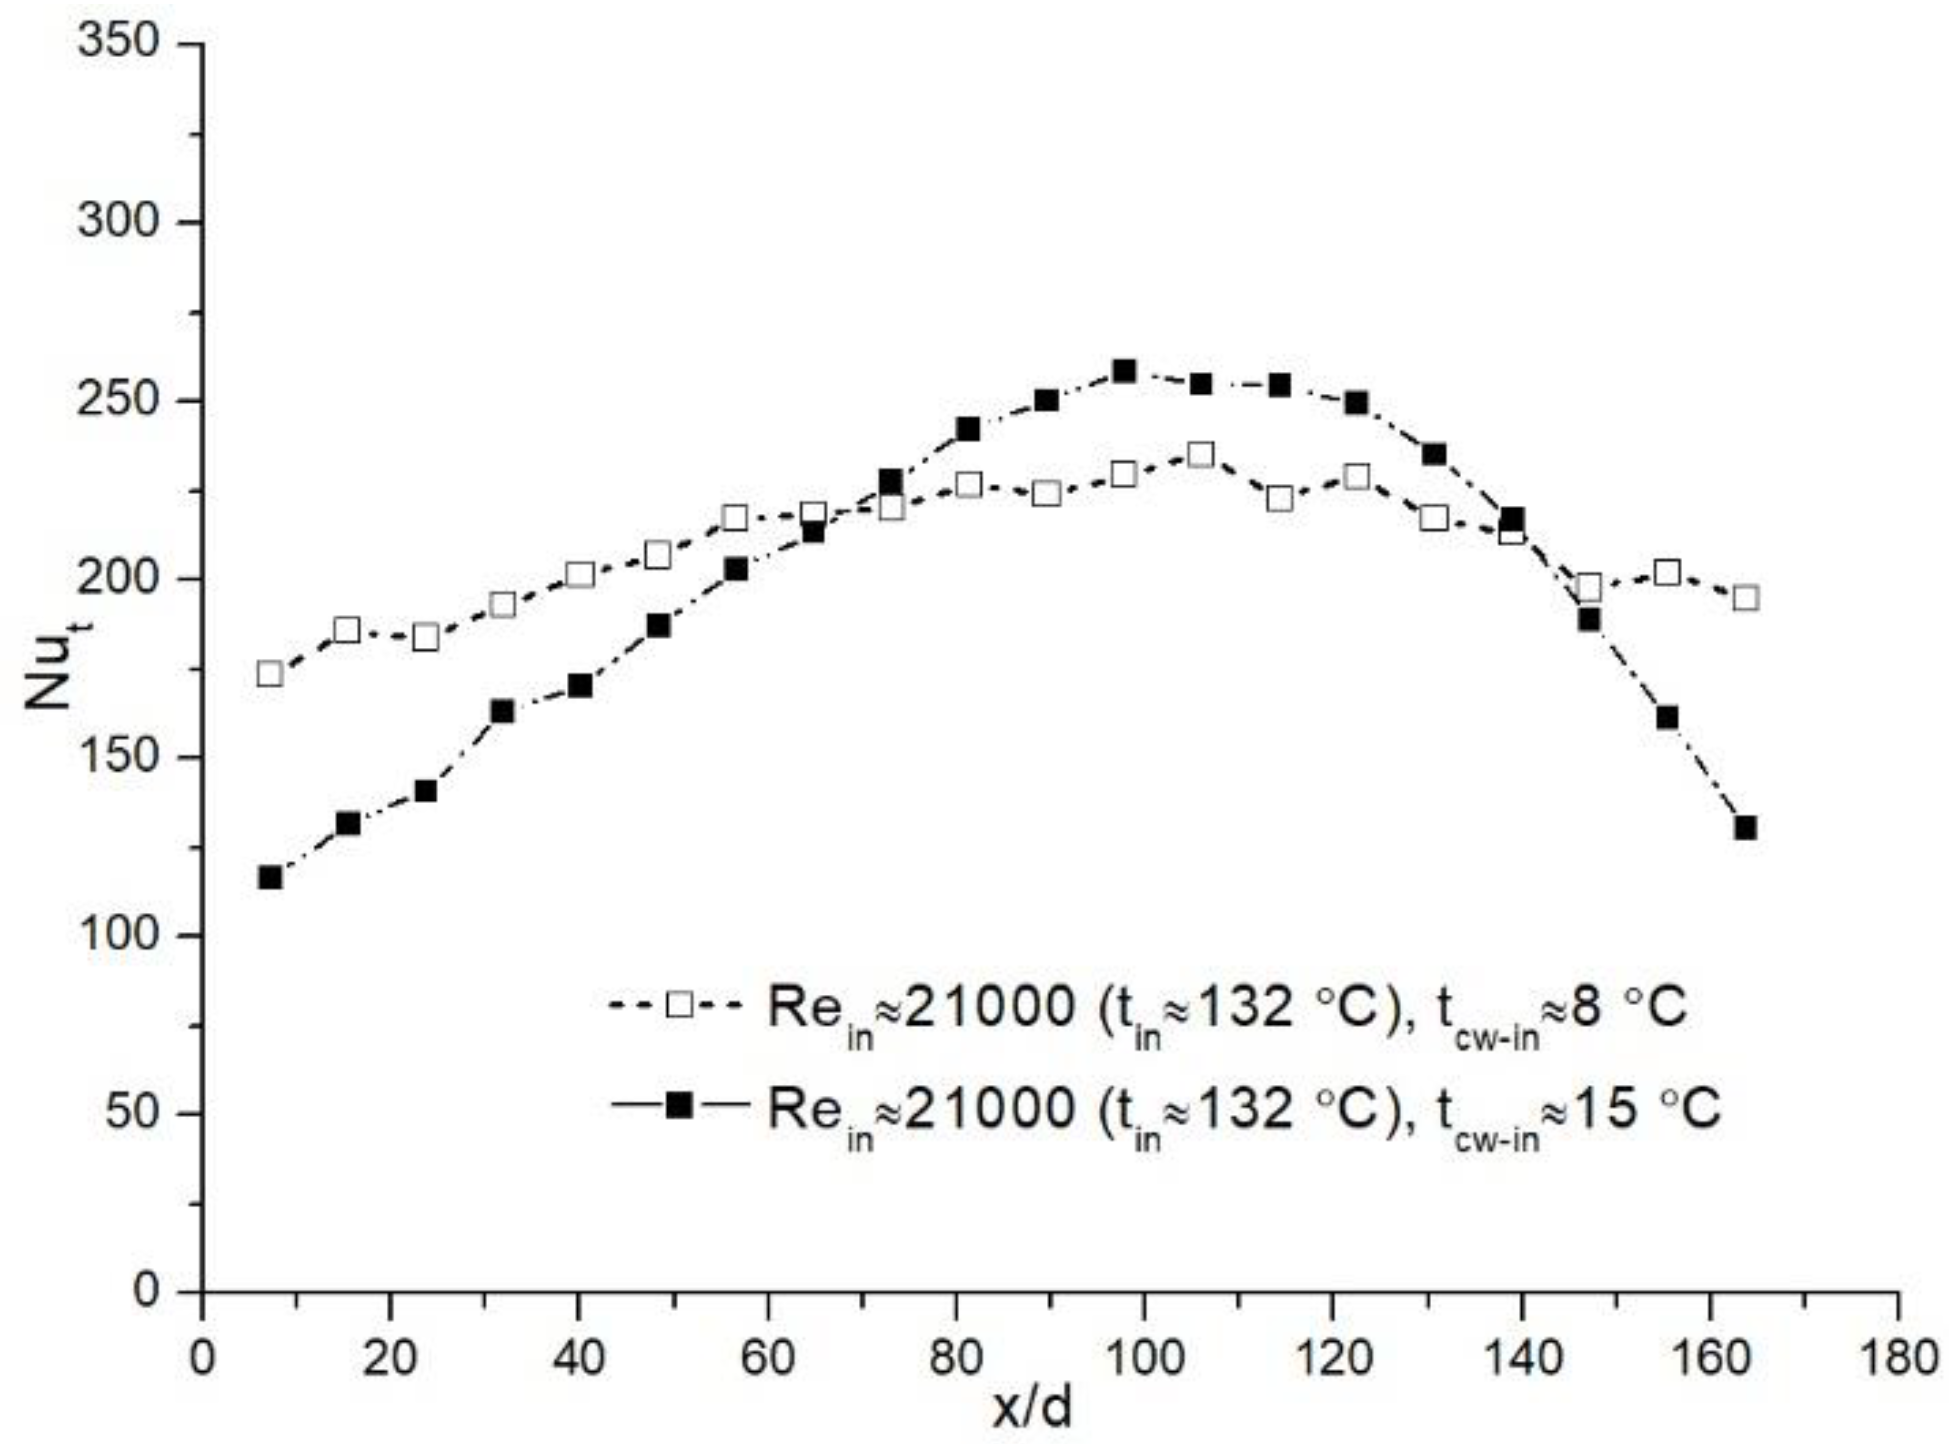
The temperature distribution results presented in Figure 12b are also typical: the flue gas temperature decreases constantly, the water temperature increases, the characteristics of the tube wall and cooling water temperatures are similar (c.f. Figure 5d). Temperature differences between the flue gas, tube wall, and cooling water are slightly smaller at a higher cooling water inlet temperature (Figure 12b).
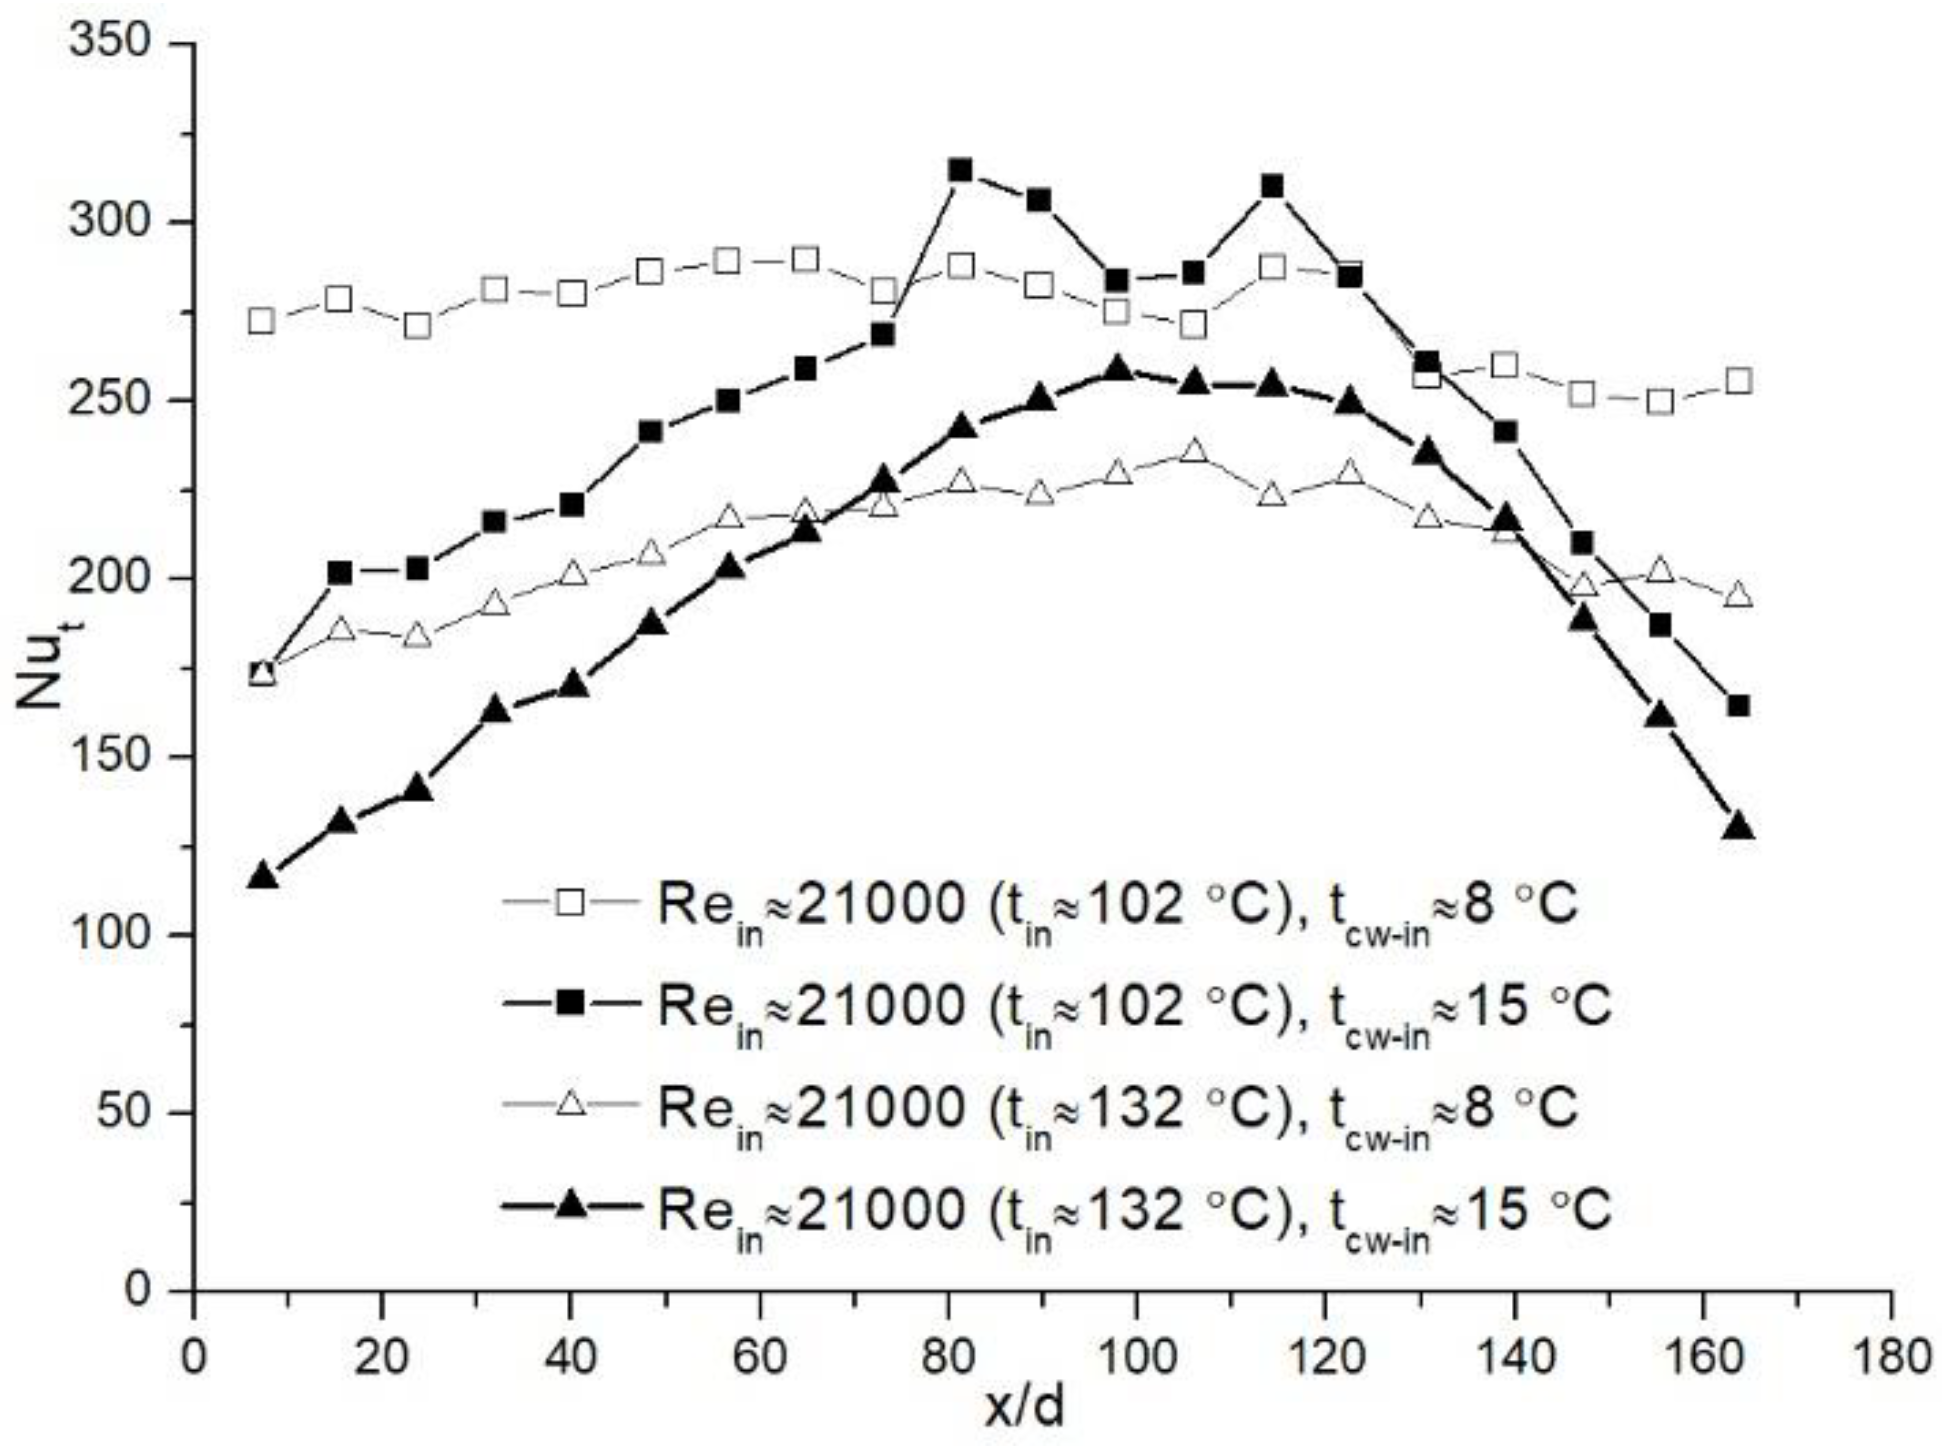
Smaller temperature differences have a certain impact on heat transfer and therefore change the distribution of the Nut along the tube (Figure 14). The comparison of the Nut for different water inlet temperatures shows that in the initial part of the tube, at the water inlet temperature of ≈8 °C, the Nut is larger than at tcw-in ≈ 15 °C. When tcw-in ≈ 8 °C, Nut increases slightly along the tube up to x/d ≈ 110, where it reaches a maximum value of ≈220 and then starts decreasing. For the case of the cooling water inlet temperature of ≈15 °C, the variation of the Nut along the tube is more expressed. From the inlet, the Nut increases intensively up to x/d ≈ 100–110, where the Nut is ≈260. After that, the Nut starts decreasing with even greater intensity until the end of the tube and reaches almost the same value as in the beginning of the tube (Nut ≈ 115).
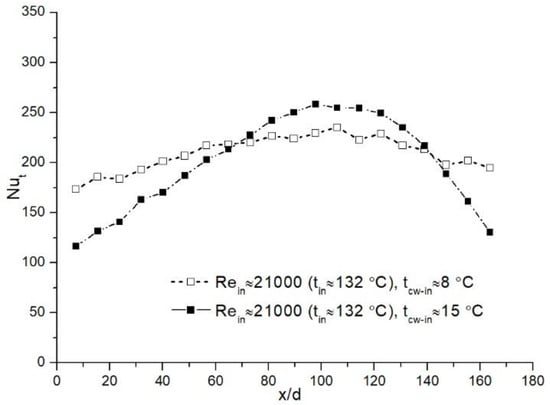
Figure 14.
Distribution of the Nut in the heat exchanger at Rein ≈ 21,000 and at different cooling water inlet temperatures.
The difference between the condensation efficiencies in this case was about 9%, i.e., ≈42% and ≈31% for the lower and higher cooling water inlet temperatures, respectively.
The comparison of Nut shows (Figure 15) that the most even Nut along the tube was obtained at a lower cooling water inlet temperature. A higher water inlet temperature causes unevenness of the Nut, and the tube length where the most effective condensation takes places becomes rather short, i.e., in the x/d range ≈80–130.
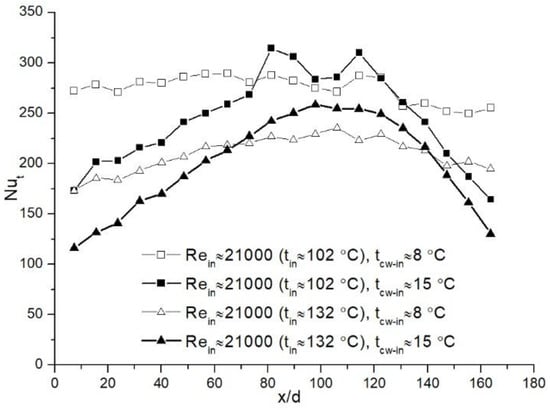
Figure 15.
Comparison of the Nut distribution in the heat exchanger at Rein ≈ 21,000, at different flue gas inlet and cooling water temperatures.
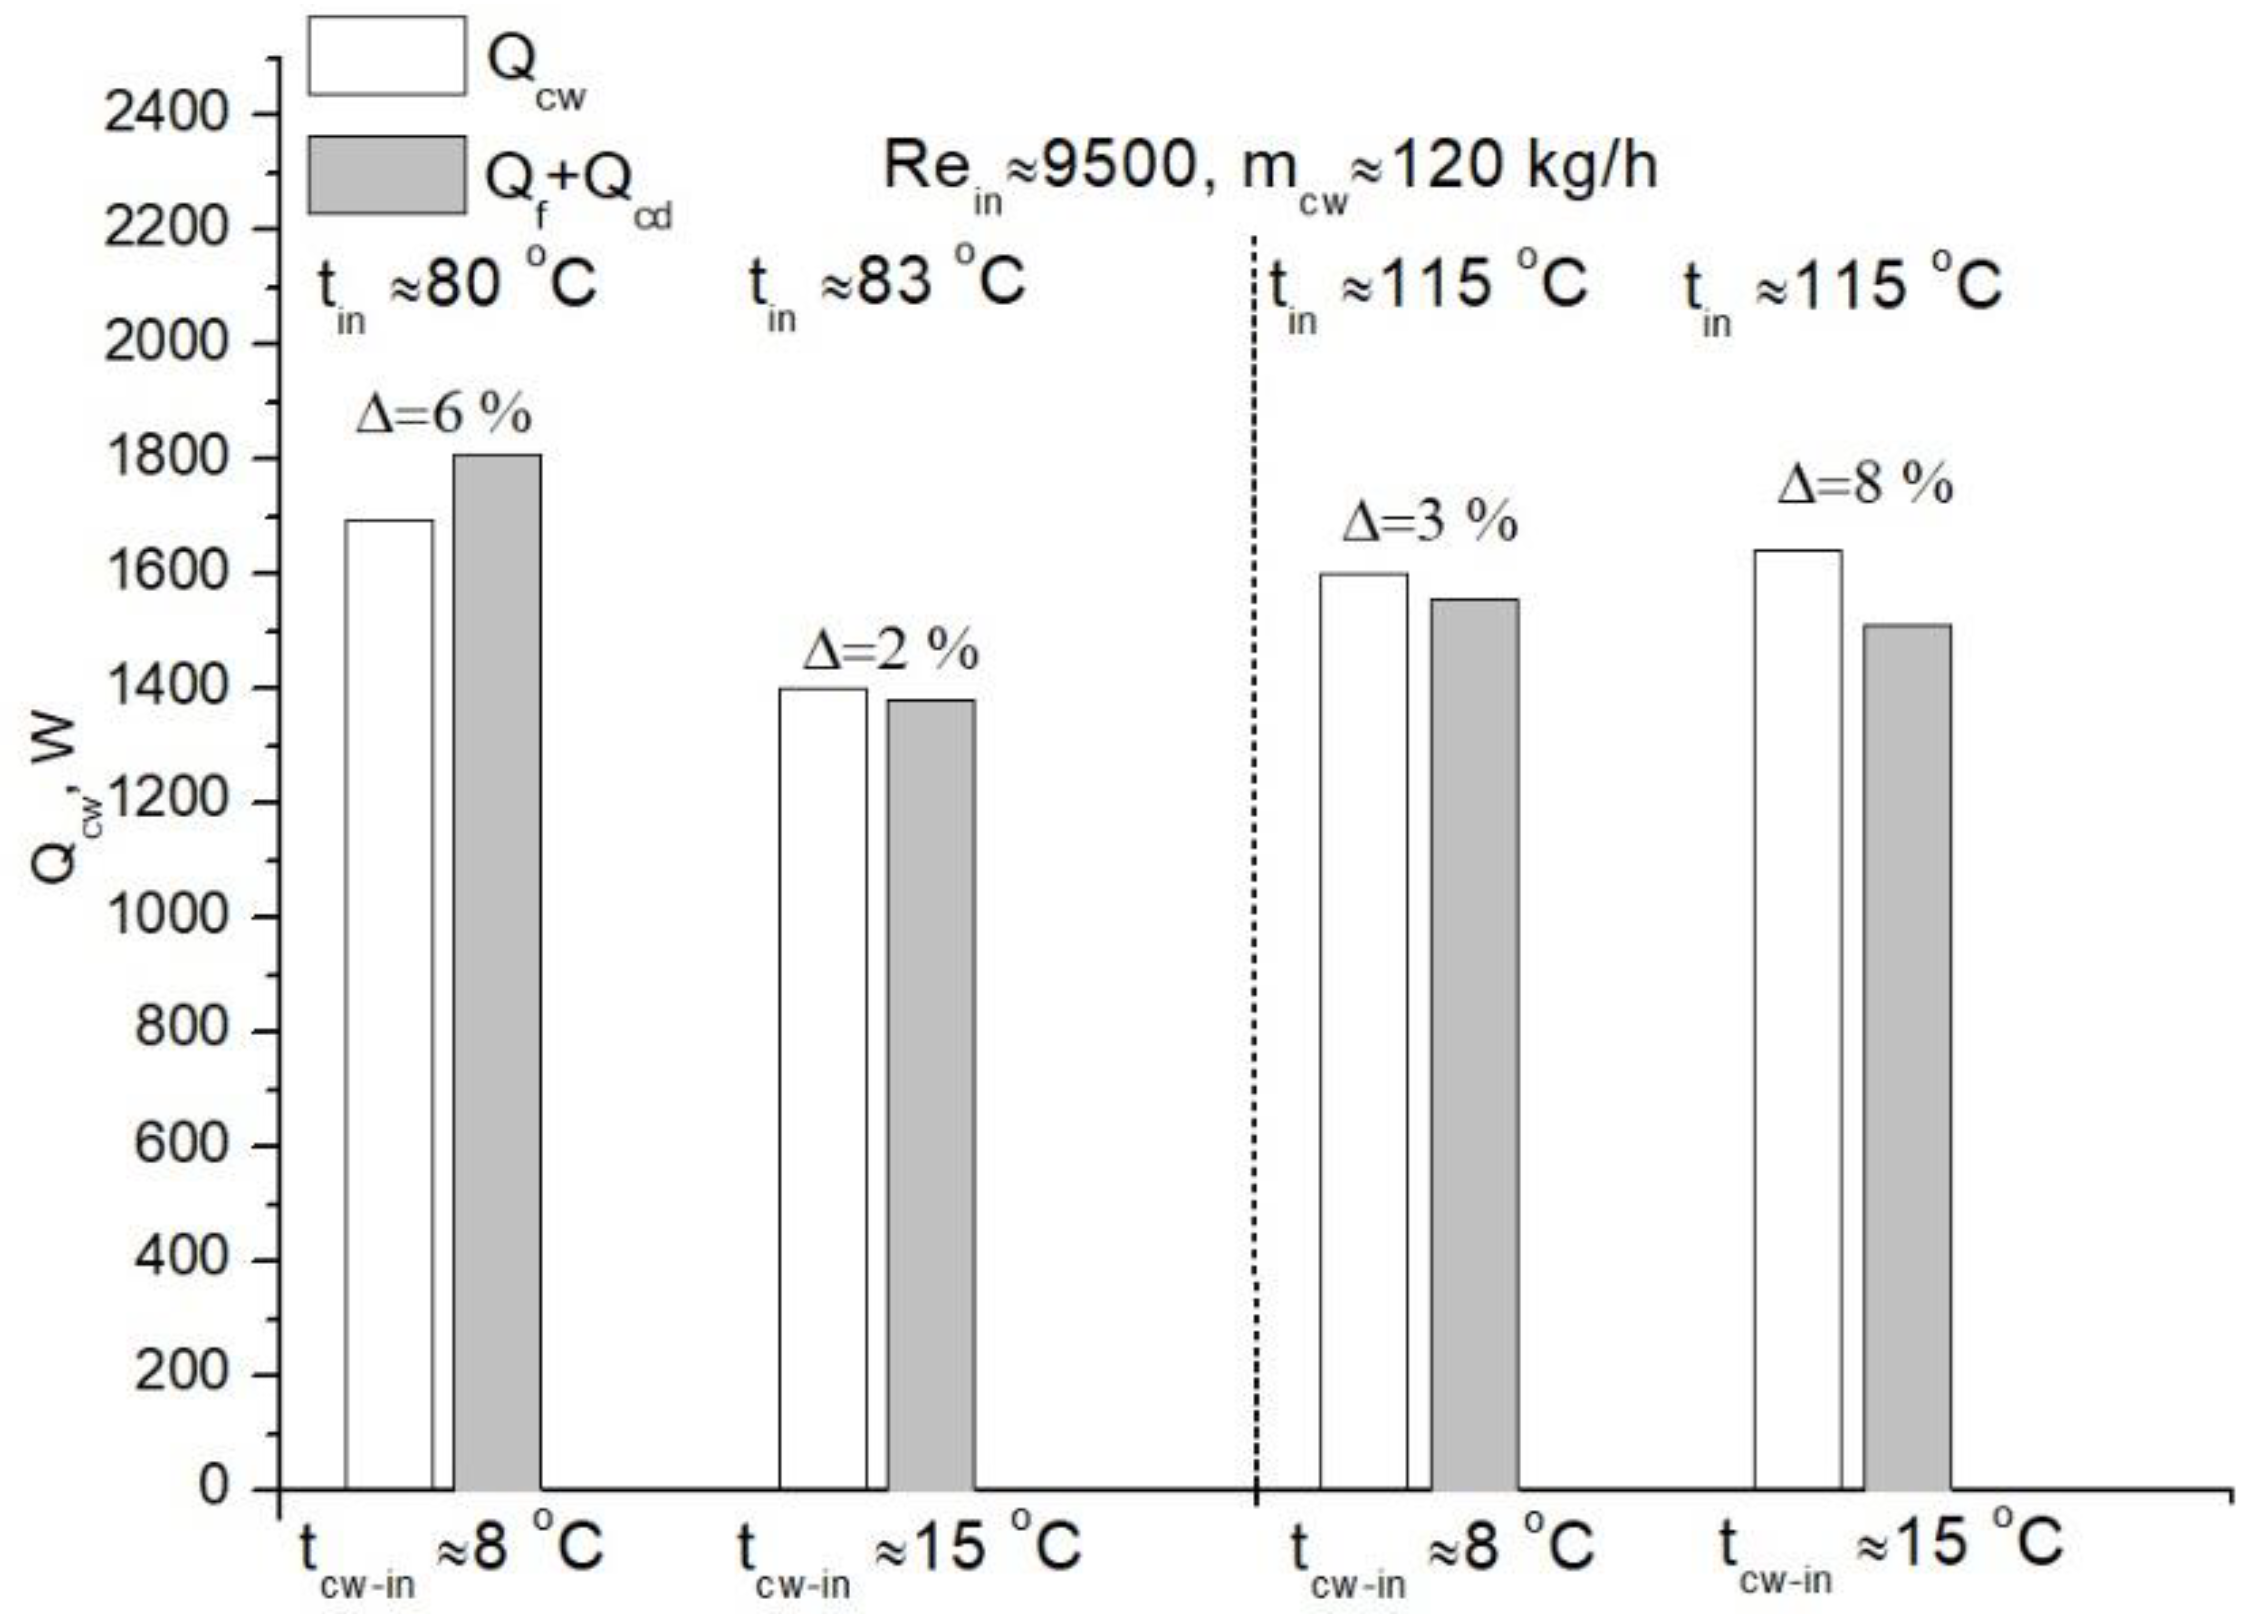
4. Heat Balance
To demonstrate the accuracy of the experiments, the heat balance was also checked. Figure 16 demonstrates typical balance for Rein = 9500 and the cooling water flow rate of 120 kg/h for different flue gas and cooling water inlet temperatures. The results show that the lowest difference of the total heat quantity obtained by cooling water (Qcw) in comparison to that released by flue gas (Qf) and latent heat of condensation (Qcd) is about 2–3%. The highest difference does not exceed 8%. Similar results are for other Rein numbers.
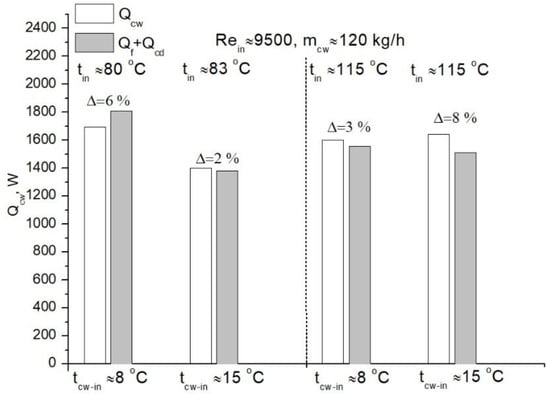
Figure 16.
Comparison of heat balance for Rein ≈ 9500 at different flue gas and cooling water inlet temperatures.
5. Conclusions
The main conclusions are summarized as follows:
- The change in the cooling water flow rate from 60 to 120 kg/h had no significant impact on the distribution of the Nut number along the tube for the analyzed inlet flue gas temperatures for Rein ≈ 9500; however, for Rein ≈ 21,000, the influence of the cooling water flow rate is more pronounced.
- For Rein ≈ 21,000 and the lower cooling water flow rate (60 kg/h), Nut was increasing along the tube and reached its maximum value almost at the end of the tube. However, at the higher cooling water flow rate (120 kg/h), the Nut remained almost even along the experimental section.
- The change in the cooling water inlet temperature from about 8–9 °C to about 14–15 °C created an insignificant impact on the Nut distribution along the tube for Rein ≈ 9500, and the results showed that stronger and almost even condensation in this case took place from the beginning until almost the middle of the test section. Further on, Nut rapidly decreased.
- The change in the cooling water inlet temperature from about 8–9 °C to about 14–15 °C had more impact on Nut along the test section for Rein ≈ 21,000. The results also showed that more even condensation along the whole test section was achieved at a lower cooling water inlet temperature.
- Condensation efficiencies for both analyzed cooling water flow rates are similar, i.e., about 54–58% for a lower flue gas Rein number and about 42% for a higher flue gas Rein number. For all analyzed regimes, at a lower cooling water inlet temperature, the condensation efficiency is about 6–10% higher than at a higher cooling water inlet temperature.
Author Contributions
Conceptualization, R.P.; methodology, A.S. and P.P.; formal analysis, A.S. and V.K.; experimental investigation, A.S. and V.K.; resources, A.S., R.P., G.M. and E.P.; writing—original draft preparation, A.S.; writing—review and editing, P.P., H.J., G.M. and E.P.; supervision, R.P. All authors have read and agreed to the published version of the manuscript.
Funding
This research was funded by Research Council of Lithuania (LMTLT), grant number S-MIP-20-30.
Institutional Review Board Statement
Not applicable.
Informed Consent Statement
Not applicable.
Data Availability Statement
Not applicable.
Conflicts of Interest
The authors declare no conflict of interest.
Nomenclature
cp is specific heat, kJ/(kg·K); d is inner diameter of the calorimetric tube, m; D is inner diameter of the outer tube, m; m is mass flow rate, kg/s; Nu is Nusselt number; n is condensation efficiency, %; Q is heat quantity, W; q is heat flux, kW/m2; t is temperature, °C; r, latent heat of condensation, J/kg; Re is Reynolds number; RH is relative humidity, %; x is length, m. Greek symbols: α is heat transfer coefficient, kW/(m2·K); δ is the wall thickness, m; λ is thermal conductivity, kW/(m·K). Subscripts: c is center; cd is condensate; cw is cooling water; dp is dew point; f is flue gas; t is total; i is local; in is inlet; out is outlet; H2O is water (water vapor); w is wall.
References
- Che, D.; Liu, Y.; Gao, C. Evaluation to retrofitting a conventional natural gas fired boiler into a condensing boiler. Energy Convers. Manag. 2004, 45, 3251–3266. [Google Scholar] [CrossRef]
- Zhang, Y.; Wei, L.; Gao, X.; Chen, H.; Li, Q.; Zhang, K.; Huang, Q. Performance analysis of a waste-to-energy system integrated with the steam–water cycle and urea hydrolysis process of a coal-fired power unit. Appl. Sci. 2022, 12, 866. [Google Scholar] [CrossRef]
- Kasurinen, S.; Jalava, P.I.; Tapanainen, M.; Uski, O.; Happo, M.S.; Paakkanen, J.M.; Lamberg, H.; Koponen, H.; Nuutinen, I.; Kortelainen, M.; et al. Toxicological effects of particulate emissions—A comparison of oil and wood fuels in small and medium scale heating systems. Atmos. Environ. 2015, 103, 321–330. [Google Scholar] [CrossRef]
- Obernberger, I.; Mandl, C. Survey of the Present State of Particle Precipitation De-Vices for Residential Biomass Combustion with a Nominal Capacity up to 50 KW in IEA Bioenergy Task32; Institute for Process and Particle Engineering, Graz University of Technology: Graz, Austria, 2011. [Google Scholar]
- Vizitiu, R.S.; Burlacu, A.; Abid, C.; Verdes, M.; Balan, M.C.; Branoaea, M. Experimental and numerical study of thermal performance of an innovative waste heat recovery system. Appl. Sci. 2021, 11, 11542. [Google Scholar] [CrossRef]
- Siddique, M.; Golay, M.W.; Kazimi, M.S. Local heat transfer coefficients for forced-convection condensation of steam in a vertical tube in the presence of a non-condensable gas. Nucl. Technol. 1993, 102, 386–402. [Google Scholar] [CrossRef]
- Park, H.S.; No, H.C. A condensation experiment in the presence of noncondensables in a vertical tube of a passive containment cooling system and its assessment with Relap5/mod3.2. Nucl. Technol. 1999, 127, 160–169. [Google Scholar] [CrossRef]
- Maheshwari, N.K.; Saha, D.; Sinha, R.K.; Aritomi, M. Investigation on condensation in presence of a noncondensable gas for a wide range of Reynolds number. Nucl. Eng. Des. 2004, 227, 219–238. [Google Scholar] [CrossRef]
- Caruso, G.; Giannetti, F.; Naviglio, A. Experimental investigation on pure steam and steam-air mixture condensation inside tubes. Int. J. Heat Technol. 2012, 30, 77–84. [Google Scholar] [CrossRef]
- Oh, S.; Revankar, S.T. Experimental and theoretical investigation of film condensation with noncondensable gas. Int. J. Heat Mass Transf. 2006, 49, 2523–2534. [Google Scholar] [CrossRef]
- Lee, K.Y.; Kim, M.H. Experimental and empirical study of steam condensation heat transfer with a noncondensable gas in a small-diameter vertical tube. Nucl. Eng. Des. 2008, 238, 207–216. [Google Scholar] [CrossRef]
- Jeong, K.; Kessen, M.; Bilirgen, H.; Levy, E.K. Analytical modeling of water condensation in condensing heat exchanger. Int. J. Heat Mass Transf. 2010, 53, 2361–2368. [Google Scholar] [CrossRef]
- Wang, Y.; Zhao, Q.; Zhou, Q.; Kang, Z.; Tao, W. Experimental and numerical studies on actual flue gas condensation heat transfer in a left–right symmetric internally finned tube. Int. J. Heat Mass Transf. 2013, 64, 10–20. [Google Scholar] [CrossRef]
- Wang, E.; Li, K.; Husnain, N.; Li, D.; Mao, J.; Wu, W.; Yang, T. Experimental study on flue gas condensate capture and heat transfer in staggered tube bundle heat exchangers. Appl. Therm. Eng. 2018, 41, 819–827. [Google Scholar] [CrossRef]
- Dedalic, N.; Džaferovic, E.; Ganic, E. Experimental and numerical study on vapor condensation of wet flue gas in chimney. Defect Diffus. Forum 2008, 273–276, 119–125. [Google Scholar] [CrossRef]
- Chantana, C.; Kumar, S. Experimental and theoretical investigation of air-steam condensation in a vertical tube at low inlet steam fractions. Appl. Therm. Eng. 2013, 54, 399–412. [Google Scholar] [CrossRef]
- Shi, X.; Che, D.; Agnew, B.; Gao, J. An investigation of the performance of compact heat exchangers for latent heat recovery from exhaust flue gases. Int. J. Heat Mass Transf. 2011, 54, 606–615. [Google Scholar] [CrossRef]
- Terhan, M.; Comakli, K. Design and economic analysis of a flue gas condenser to recover latent heat from exhaust flue gas. Appl. Therm. Eng. 2016, 100, 1007–1015. [Google Scholar] [CrossRef]
- Poskas, R.; Sirvydas, A.; Kulkovas, V.; Poskas, P. An experimental investigation of water vapor condensation from biofuel flue gas in a model of vertical condensing heat exchanger. 1. Base case: Local heat transfer in a calorimetric tube without water injection. Processes 2021, 9, 844. [Google Scholar] [CrossRef]
- Poskas, R.; Sirvydas, A.; Kulkovas, V.; Jouhara, H.; Poskas, P.; Miliauskas, G.; Puida, E. An experimental investigation of water vapor condensation from biofuel flue gas in a model of vertical condensing heat exchanger. 2. Local Heat Transfer in a Calorimetric Tube with Water Injection. Processes 2021, 9, 1310. [Google Scholar] [CrossRef]
- Jia, L.; Peng, X.F.; Yan, Y.; Sun, J.D.; Li, X.P. Effects of water vapor condensation on the convection heat transfer of wet flue gas in a vertical tube. Int. J. Heat Mass Transf. 2001, 44, 4257–4265. [Google Scholar] [CrossRef]
- Siddique, M. The Effects of Noncondensable Gases on Steam Condensation under Forced Convection Conditions. Ph.D. Thesis, Department of Nuclear Engineering, Massachusetts Institute of Technology, Cambridge, MA, USA, 1992. [Google Scholar]
- Barford, N.C. Experimental Measurements: Precision, Error and Truth, 2nd ed.; John Willey & Sons: Hoboken, NJ, USA, 1985. [Google Scholar]
- Available online: https://journals.ametsoc.org/doi/pdf/10.1175/BAMS-86-2-225 (accessed on 25 February 2022).
Publisher’s Note: MDPI stays neutral with regard to jurisdictional claims in published maps and institutional affiliations. |
© 2022 by the authors. Licensee MDPI, Basel, Switzerland. This article is an open access article distributed under the terms and conditions of the Creative Commons Attribution (CC BY) license (https://creativecommons.org/licenses/by/4.0/).