Article

Fatigue Crack Propagation Study of Bridge Steel Q345qD Based on XFEM Considering the Influence of the Stress Ratio

1
School of Civil and Transportation Engineering, Beijing University of Civil Engineering and Architecture, No. 1, Zhanlanguan Rd., Beijing 100044, China
2
School of Architecture Engineering, Nanjing Institute of Technology, Nanjing 211167, China
*
Author to whom correspondence should be addressed.
Appl. Sci. 2022, 12(24), 12782; https://doi.org/10.3390/app122412782
Submission received: 31 October 2022 / Revised: 8 December 2022 / Accepted: 9 December 2022 / Published: 13 December 2022
(This article belongs to the Special Issue Advances in Bridge Design and Structural Performance)

Abstract

:
In the past, fatigue cracks have appeared in the orthotropic steel decks of bridges shortly after they opened to traffic. Previous studies have shown that high tensile welding residual stress exists in welded joints of steel bridges, which significantly changes the average stress and stress ratio of the joints. However, traditional fatigue crack propagation (FCP) calculations based on the Paris equation do not consider the influence of the stress ratio. Steel Q345qD is a common material used in bridges. Therefore, it is meaningful to study the influence of the stress ratio on the FCP life of steel Q345qD. In this paper, an FCP equation based on the energy release rate considering the influence of the stress ratio is first derived and named the da/dN-ΔG-R equation. Next, three material parameters in the equation are determined based on the results from tests of steel Q345qD under different stress ratios. Then, a user subroutine based on the extended finite element method (XFEM) that considers the influence of the stress ratio is defined and the effects of mesh size are analyzed. Finally, the effects of the stress ratio on FCP are discussed and the adaptability of the da/dN-ΔG-R equation is verified by comparing the values obtained from the equation with experimental results. The results show that: with a 95% guarantee rate, three material parameters in the da/dN-ΔG-R equation are: log(C) = −10.71, m = 2.780, and γ = 0.957; in the numerical simulation, a mesh size of 1 mm is more appropriate than other mesh sizes as it shows better accuracy and efficiency; under the same energy release rate range, the crack growth rate decreases as the stress ratio increases; under the same loading amplitude and cycles, the fatigue life decreases as the stress ratio increases; and finally, the numerical results considering the influence of stress ratio based on the da/dN-ΔG-R equation are close to the test results, while the results without considering the stress ratio based on the Paris equation are inaccurate.

1. Introduction

Steel box girder bridges with orthotropic steel decks are widely used in long-span highway and railway bridges because of their light weight, convenient construction, and high load-carrying capacity [1,2]. However, in one case, serious fatigue cracks appeared in the steel deck shortly after the bridge opened to traffic [3,4]. The fatigue life of some steel box girder bridges is less than 10 years, which is far lower than the bridge design life [4,5]. Previous studies have shown that welding residual stresses significantly changed the mean stress level of welded joints of steel box girder bridges, that is, the stress ratio changed significantly under certain stress amplitudes. The high mean stress (or stress ratio) consequently reduced the fatigue life of the steel bridges [5]. Based on the test data regarding 14MnNbq steel used in bridges, Liu et al. found that the fatigue crack propagation (FCP) rate increased as the stress ratio under the same stress intensity factor amplitude increased [6]. However, traditional FCP calculations based on the Paris equation only reflect the relationship between FCP and the stress intensity factor amplitude, without considering the influence of the stress ratio [7].
Scholars have done extensive research regarding the influence of the stress ratio on FCP. Forman et al. [8] assumed that the crack growth rate would tend to infinity when the maximum stress intensity factor approaches the fracture toughness, and subsequently established a fatigue crack propagation equation that considered the influence of the stress ratio and fracture toughness. Walker [9] used experimental data to propose an FCP equation that considered the influence of the stress ratio. Donald and Lados [10] introduced the adjusted compliance ratio parameter into the Walker two-parameter formula and considered the influence of residual stress. Kwofie et al. [11,12] deduced the stress intensity factor under different stress ratios according to the transformation relationship between stress amplitudes and mean stresses, and created a driving force model that considered the influence of stress ratios. Li et al. [13] proposed a modified Walker equation to characterize the FCP of a cracked body under constant amplitude cyclic loading. Zhan et al. [14] presented an exponential equation that considered the stress ratio effect. Cano et al. [15] compared several different driving force models based on the energy release rate while also considering the effects of the stress ratio. The term Δ G seems to be a valid crack driving force for adhesives, composites and polymers such as copolyester polyethylene terephthalate glycol. Xin et al. [16] incorporated the mean stress effects by employing the Walker equation to fit the fatigue crack propagation rate of steel S355 and S690 based on experimental data. Ribeiro et al. [17] suggested deterministic quadratic relations based on experimental results regarding the relationship between the crack closure quantitative parameter U and the applied stress ratio R and between the effective stress ratio Reff and the applied stress ratio R in comparison with various crack closure models. An FCP model for two different stress ratios was generated based on the strain energy density approach and considering the residual stress effects [18]. Moarrefzadeh et al. [19] modified the Walker equation by considering the influence of welding residual stress on the effective stress intensity factor and effective stress ratio. Therefore, it is necessary to derive an equation considering the effect of the stress ratio to describe fatigue crack growth more accurately; experiments under different stress ratios are sometimes needed to obtain such an equation.
Several methodologies can be used for modeling FCP, including the mesh-free method [20], boundary element method [21,22], discrete element method [23], traditional finite element method (FEM) [24,25], and extended finite element method (XFEM) [26,27,28,29]. The most used numerical simulation methods are traditional FEMs, such as ANSYS [24,25], the specialized crack propagation simulation software ZENCRACK [30], and the XFEM in ABAQUS [27,28,29]. In the traditional finite element method ANSYS, a wedge singular element should be established at the crack tip because of stress singularity, as shown in Figure 1a [25]. The stress intensity factor in ANSYS can be calculated, but the energy release rate cannot be extracted directly. ZENCRACK is a specialized finite element software that is used to simulate crack propagation. A special crack block is set at the crack tip, which can move with the crack propagation, as shown in Figure 1b [30]. This software is good at crack simulation but has poor universality and often needs to be used in combination with other conventional software. The XFEM was first proposed by Belytschko in 1999 [26]. The enrichment function is introduced into the conventional finite element displacement mode to reflect the crack discontinuity, and the level set function is used to trace the crack surface. Therefore, as shown in Figure 1c [28], the crack can penetrate the element directly without the use of refined mesh at the crack tip, which is easier in terms of meshing than ANSYS and ZENCRACK. It can also clearly show the continuous crack propagation process. At present, the XFEM in ABAQUS generally uses the virtual crack closure technique (VCCT) to calculate the energy release rate, and its accuracy is higher than that of the stress intensity factor calculated by the node displacement extrapolation method. It also has a good ability to solve fatigue fracture problems involving linear, nonlinear, and even anisotropic materials [29].
In this paper, an FCP equation based on the energy release rate considering the influence of the stress ratio is first derived. Then, three material parameters in the equation are determined based on tests of bridge steel Q345qD under different stress ratios. Finally, a user subroutine based on the XFEM that considers the influence of the stress ratio is defined. The effects of the stress ratio on FCP are discussed. The numerical simulation results considering and not considering the influence of the stress ratio are compared with the experimental results.

2. Deriving an FCP Equation Considering the Stress Ratio R Based on the Energy Release Rate G

An FCP calculation based on the Paris equation without considering the stress ratio R is shown in Equation (1):
d a d N = C 0 Δ K m 0
where C0, m0 are material parameters, ΔK is the stress intensity factor range, a is the crack length, N is the number of cycles, and da/dN is the FCP rate.
Based on the Paris equation, Walker [9] proposed a fatigue crack growth equation that considered the stress ratio R based on ΔK, as shown in Equation (2):
d a d N = C ( Δ K ( 1 R ) 1 γ ) m
where C, γ, m are material parameters and R is the stress ratio.
For opening mode cracks, the relationship between the energy release rate G and stress intensity factor K is shown in Equation (3) [31]:
G = 1 E K 2
where E’ = E for plane stress, E’ = E/(1 – ν2) for plane strain, E is material elasticity modulus, and ν is Poisson’s ratio.
The stress ratio R and intensity factor range can be calculated as Equation (4):
R = K min / K max ,   Δ K = K max K min
Thus, the energy release rate range is expressed in Equation (5) based on the relationship between G and K in Equation (3).
Δ G = G max G min = K max 2 K min 2 E
Substituting Equation (4) into Equation (5), Equation (6) is obtained.
Δ G = 1 E 1 + R 1 R Δ K 2
ΔK can be solved from Equation (6) and substituted into Equation (2). Thus, as shown in Equation (7), an FCP equation considering the stress ratio R based on the energy release rate G, which is named the da/dN-ΔG-R equation, is obtained.
d a d N = C ( E Δ G ( 1 R ) 2 γ 1 ( 1 + R ) ) m 2
It can be seen from the derivation process that the material parameters C, γ, m in Equation (7) are the same as those in Equation (2). Therefore, a standard compact tensile test using the specifications outlined in [32] can be used to obtain the material parameters in the da/dN-ΔG-R equation.

3. Determining Material Parameters in the da/dN-ΔG-R Equation by FCP Tests

3.1. FCP Tests

The chemical composition of steel Q345qD is shown in Table 1 [33]. To obtain the material parameters C, γ, m of steel Q345qD, a standard FCP test was designed according to the metallic materials fatigue test specifications [32]. The size of the standard compact tensile specimen (CT specimen) is shown in Figure 2. The thickness of the specimen is 10 mm, the machining notch length an is 9 mm, and the initial crack length a0 is 10 mm to eliminate the effect of machining notch on crack growth [32]. The material is steel Q345qD. Table 2 shows the test loading scheme. FCP tests in which the loading amplitude ΔP was kept at 15kN were conducted under four different stress ratios: 0.1, 0.3, 0.5, and 0.7.
As shown in Figure 3, a QBG-100 fatigue testing machine with a maximum load of 100 kN and maximum loading frequency of 50 Hz was used as the loading equipment. The axial tensile cyclic loading mode was used and the experimental maximum load and loading frequency were 50 kN and 20 Hz, respectively. The stress-controlled constant amplitude loading method was used until the crack reached the critical value and the specimen fractured. The initial crack length was 10 mm. During the test, the crack length was measured by visual inspection. The data regarding the crack length a and the number of cycles N can be recorded every 1 mm at the beginning of crack growth and recorded every 2~3 mm when the specimen is close to being fractured. The crack length a was measured on the front and back sides of the specimen, and the average value was taken as the actual crack length. For each case, three specimens were taken to avoid experimental error. The number of cycles N is the arithmetic mean value of the three specimens under the same crack length a. Figure 4 shows the FCP process of the CT specimen.

3.2. Analysis of Test Results

The a-N curves under different stress ratios measured in the tests are shown in Figure 5a, indicating that the specimen crack propagates faster as the stress ratio increases. For example, at N = 6 × 10⁴, the crack lengths are about 12 mm, 13 mm, 16 mm and 26 mm when R equals to 0.1, 0.3, 0.5 and 0.7, respectively. In order to obtain the FCP rate da/dN-ΔK curve, a seven-point incremental polynomial method recommended by GB/T6398-2017 is used to process the data [32]. That is, for each data point (ai, Ni), the previous three points and next three points are taken, and these seven data points are used to fit a quadratic polynomial. The slope of the fitted curve at this data point is regarded as the FCP rate da/dN. ΔK under different crack lengths can be calculated using Equation (8). The FCP rate curves in Figure 5b show that the FCP rate increases as the stress ratio increases. Since the slopes and intercepts of these fitted curves vary with the stress ratio, this means that the Paris equation including only two material parameters and without considering the influence of the stress ratio is inaccurate. Equation (8) is shown below:
Δ K = Δ P B W 2 + α ( 1 α ) 3 / 2 ( 0.886 + 4.64 α 13.32 α 2 + 14.72 α 3 5.6 α 4 )
where ΔP is the load amplitude, B is the specimen thickness, W is the horizontal distance from the loading point to the edge of the specimen (as shown in Figure 2), a′ is the calculated crack length which is the horizontal distance from the loading point to the crack tip, and α = a′/W.
Equations (1) and (2) are expressed in logarithmic form, as shown in Equations (9) and (10), respectively. The material parameters C0, m0 in the Paris Equation (9) and C, γ, m in the Walker Equation (10) of steel Q345qD can be obtained by experimental data fitting, as shown in Figure 6. The material parameters in the da/dN-ΔG-R equation are the same as those in the Walker Equation (10) and are obtained according to the derivation process described in the last section. The material parameters of steel Q345 are shown in Table 3.
Paris :   log ( d a / d N ) = log C 0 + m 0 log ( Δ K )
Walker :   log ( d a / d N ) = log C + m log ( Δ K ) + m ( γ 1 ) log ( 1 R )

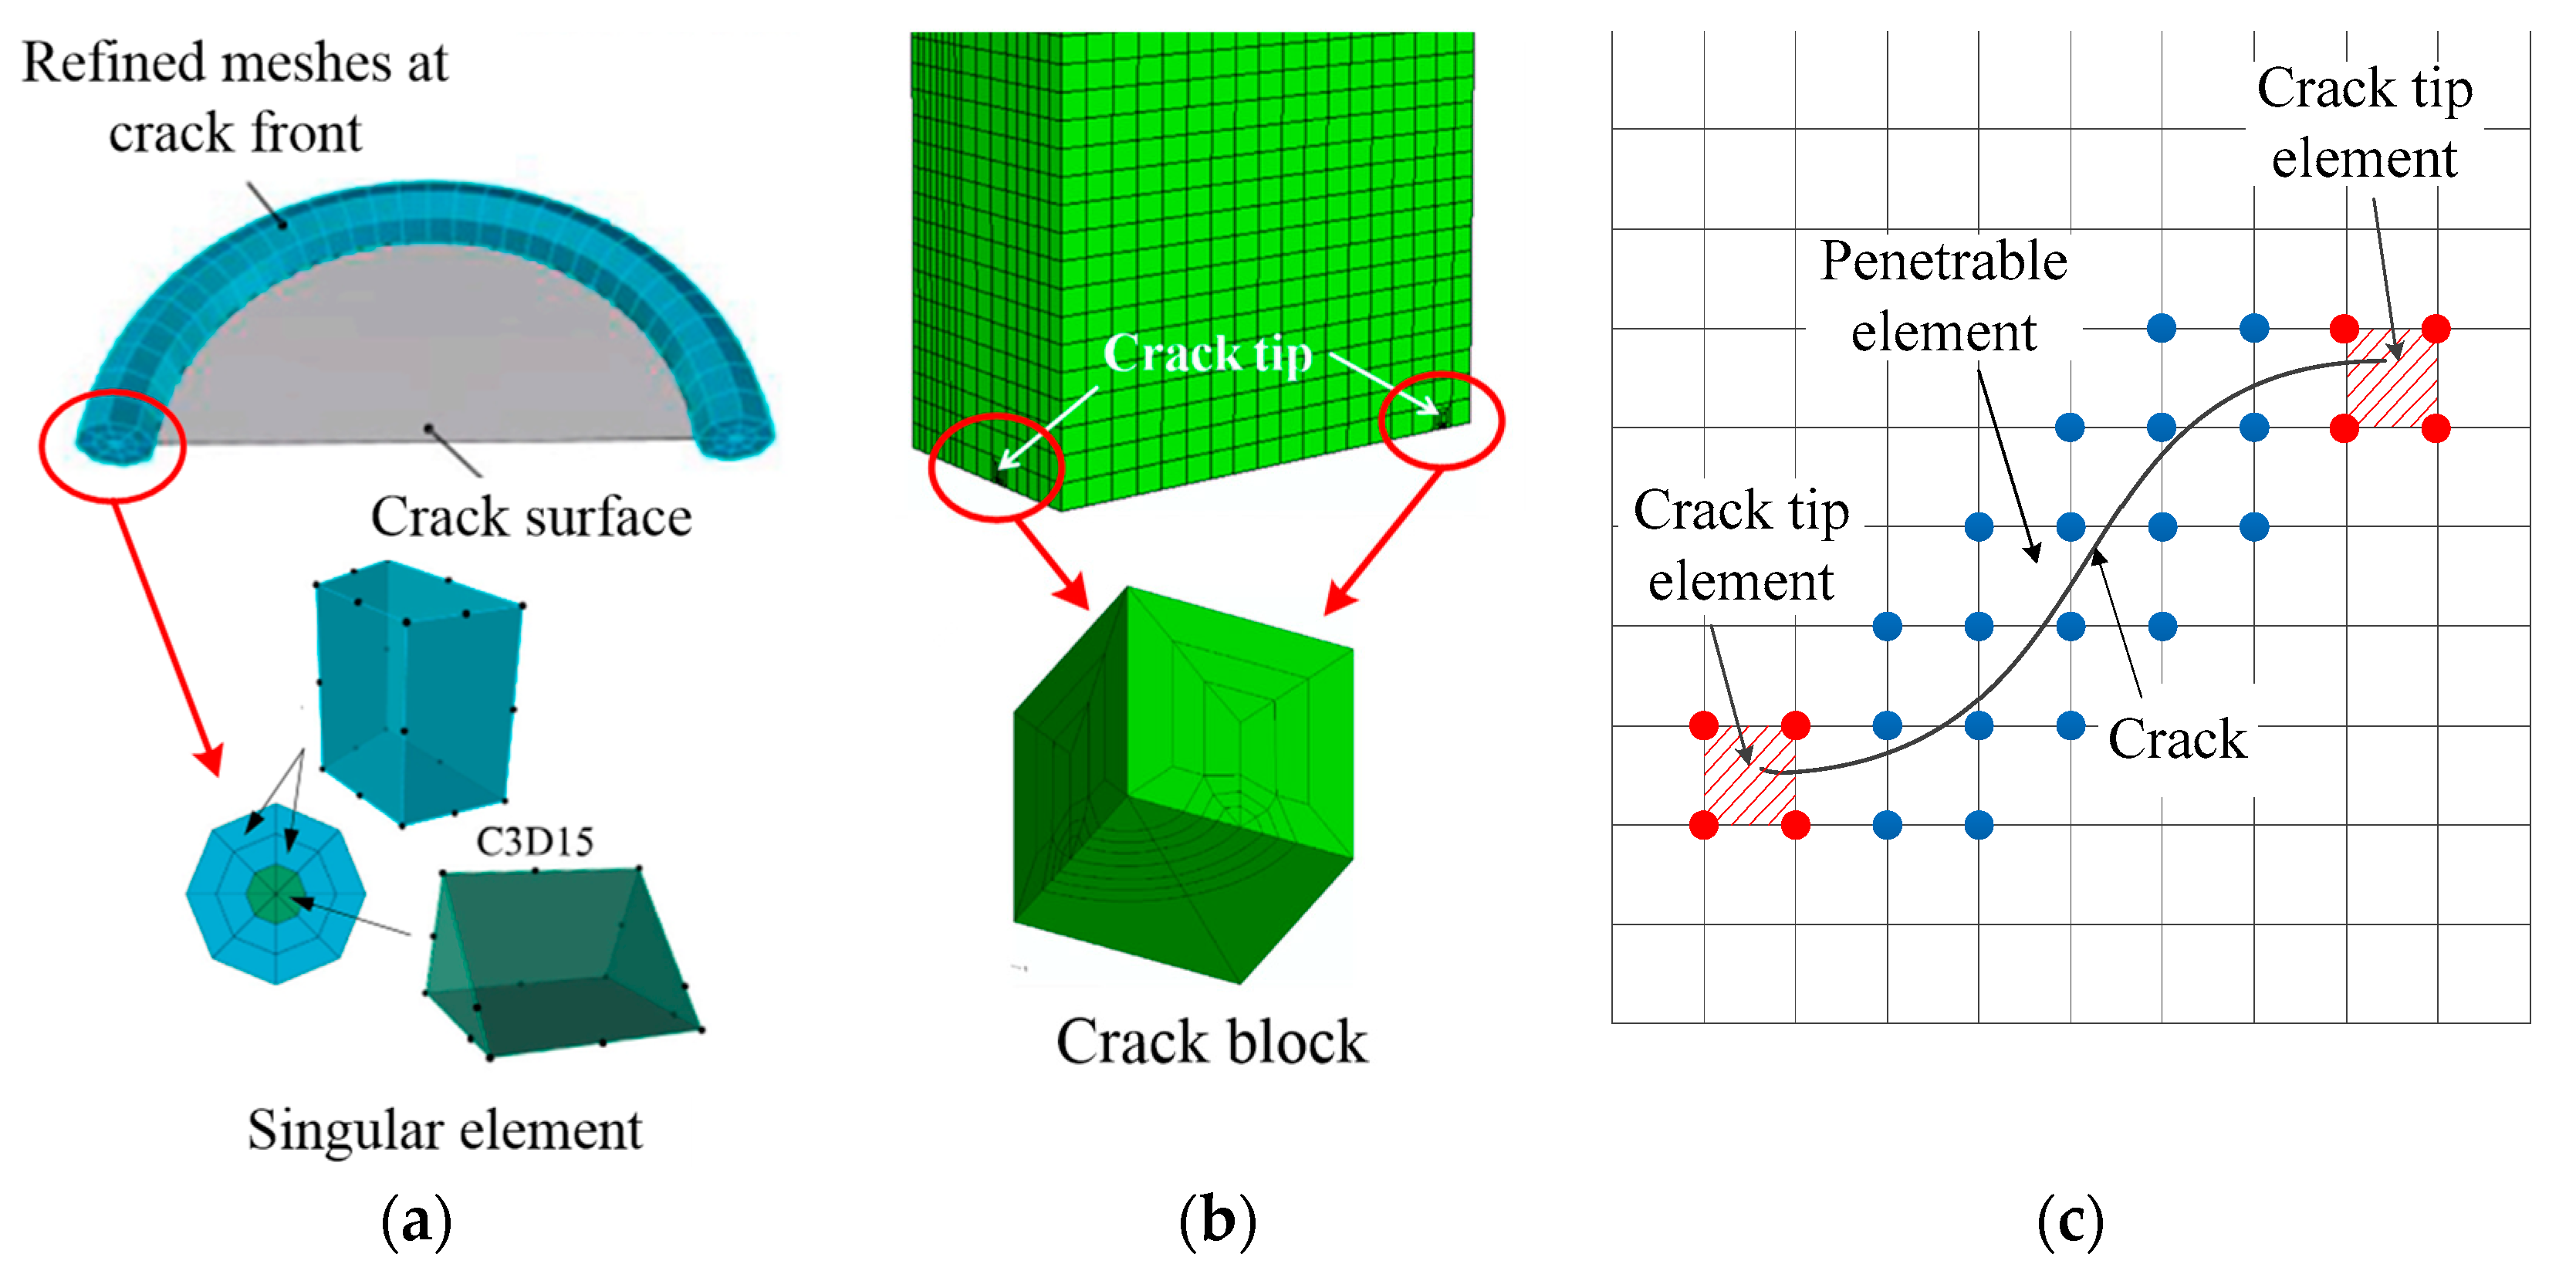
4. Numerical Simulation Considering the Stress Ratio R Based on the XFEM

4.1. FEM of the CT Specimen

Figure 7 shows the FEM of the CT specimen and the model size that is consistent with the test. The mesh is fine near the crack and coarser away from the crack. Two reference points are defined such that they are coupled to the inner surface of the circular hole. This is done so that the boundary conditions and loads can be applied directly to the reference points. Reference point (RP)-1 constrains translation in the x, y, and z directions and rotation in the x and z directions. Translation and rotation in the x, y and z directions of RP-2 are constrained. The cyclic load P is applied on RP-1 according to the loading scheme in Table 2. The elastic modulus and Poisson′s ratio of steel Q345qD are 2.06 × 10⁵ MPa and 0.3, respectively [34]. As shown in Figure 7, the cyclic load P is only in the XY plane. Therefore, the CT specimen under the cyclic load P experiences plane stress because the stress is only in the XY plane and the stress perpendicular to the XY plane can be ignored. Under these conditions, E’ in Equations (3) and (7) equals to E, that is 2.06 × 10⁵ MPa.

4.2. FCP User-Defined Subroutine Considering R Based on the XFEM

When the energy release rate of a crack tip satisfies Gth < ΔG < Gpl, a fatigue crack begins to grow. Gpl is the upper threshold value of the energy release rate, which is close to the steel fracture toughness GC. Gth is the lower threshold value of the energy release rate. The stress intensity factor Kth of steel Q345qD is 92 MPa·mm1/2 [35]. The energy release rate threshold Gth can be obtained through Equation (3). When the maximum energy release rate of a crack tip is greater than the lower threshold value Gth, a fatigue crack propagates along the direction of the maximum principal stress in ABAQUS. Assuming that the ith element at the crack tip is the crack growth direction, the virtual crack closure technique (VCCT) is used to calculate the energy release rate ΔGi. ΔNi is calculated using Equation (7). The element with the lowest number of cycles is the final fracture element, and the number of cycles increment ΔN and crack propagation increment Δɑ are obtained. The cycle continues until the crack length reaches the final crack length ɑf. To consider the influence of the stress ratio R, a user-defined subroutine is used in the simulation. A flow chart of FCP considering R effects based on the XFEM is shown in Figure 8.

4.3. Effect of Mesh Size

Figure 9a shows four different mesh sizes: 0.5 mm, 1 mm, 1.5 mm, and 2 mm. Calculation results of these four different meshing models under ΔP = 15 kN and R = 0.1 are shown in Figure 9b. Under the same cycles, the crack length decreases as the mesh size increases. For example, under N = 2 × 10⁵, the crack lengths are 22.5 mm, 22.3 mm, 19 mm, and 18 mm for mesh sizes of 0.5 mm, 1 mm, 1.5 mm and 2 mm, respectively. The results are towards insecurity with the increase of mesh size. However, the calculation results obtained when using a mesh size of 1mm are close to those obtained when using a mesh size of 0.5 mm, while the calculation efficiency is obviously improved. Therefore, a 1 mm mesh size is more appropriate to use in the simulation.
The maximum principal stress distributions of the FCP process with a mesh size of 1mm under ΔP = 15 kN and R = 0.1 are shown in Figure 10. The stress is large near the crack tip and decreases rapidly away from it. The stress at the crack tip increases with the degree of crack propagation. As shown in Figure 10b–d, the stress at the crack tip is about 500~2200 MPa at the steady crack propagation stage. When the model is approaching the fracture point, the stress reaches 1.2 × 10⁵ MPa, as shown in Figure 10f. The increment number of cycles decreases while the crack propagation length remains constant, indicating that the growth rate of the fatigue crack increases.

4.4. Effect of the Stress Ratio R

Fatigue crack propagation da/dN-ΔG curves at R ratios of 0.1, 0.3, 0.5 and 0.7 are shown in Figure 11. The simulation results were calculated based on the XFEM using the da/dN-ΔG-R equation, as shown in Figure 8, and were close to the experimental results. Figure 11 shows that under the same energy release rate range ΔG, the crack growth rate da/dN decreases as the stress ratio R increases. However, under the same number of cycles N, the crack length a increases along with R, as shown in Figure 5a. This means that in the experiment, the fatigue crack growth rate increases as R increases, which seems to contradict the results in Figure 11. The reason for this is that ΔG is not a constant value under the same load amplitude ΔP and crack length a, and instead increases along with R, as shown in Equation (6). ΔK is a constant value under the same ΔP and crack length a according to Equation (8). For example, when a = 20 mm, ΔG is 8334 N/m, 12,664 N/m, 20,458 N/m, and 38,642 N/m and da/dN is 2.45 × 10⁻⁷, 2.54 × 10⁻⁷, 2.67 × 10⁻⁷, and 2.87 × 10⁻⁷ for R = 0.1, 0.3, 0.5, and 0.7, respectively, as shown in the Figure 11. Therefore, under the same crack length a and load amplitude ΔP, the fatigue crack growth rate increases as R increases. In the experiment, under the same number of cycles N, the crack length a increases as R increases.
Figure 12 compares the experimental and numerical simulation results under different stress ratios. In Figure 12, the initial crack length a0 is 10 mm, which is given in Section 3.1. Numerical simulation results considering the stress ratio R were calculated based on the XFEM using the da/dN-ΔG-R equation, as shown in Figure 8. The simulation results without considering R were calculated using the Paris equation. Figure 11 shows that the simulation results considering R from this paper are closer to the experimental data. However, the simulation crack length a considering R is slightly smaller than the test results obtained under the same number of cycles N. This may be because in the tests, the fixture and specimen are not completely fixed constraints, which is slightly different from the simulation. The simulation results without considering R calculated by the Paris equation, which are close to the mean values of different stress ratios, are inaccurate; when R is equal to 0.1 or 0.3, the crack length without considering R is larger than the test value, while it is smaller than the test value when R is equal to 0.5 or 0.7. Therefore, these findings suggest that the method based on the da/dN-ΔG-R equation proposed in this paper should be used to calculate the FCP life of steel Q345qD.

5. Conclusions

In this paper, an energy release rate-based fatigue crack propagation equation was derived and used to describe the FCP rate of bridge steel Q345qD using the experimental data obtained from various stress ratio tests. Then, a user subroutine based on the XFEM that considers the influence of the stress ratio was defined and the effects of mesh size were analyzed. Finally, the effects of the stress ratio were discussed and the adaptability of the equation was verified by comparing the values obtained from the equation with the experimental results. The main conclusions of this research are the following:
  • A fatigue crack propagation equation based on the energy release rate considering the influence of the stress ratio was derived and named the da/dN-ΔG-R equation.
  • Three material parameters in the da/dN-ΔG-R equation were determined with a 95% guarantee rate based on the standard compact tensile tests of steel Q345qD under different stress ratios. These parameters are log(C) = −10.71, m = 2.780, and γ = 0.957, respectively.
  • A fatigue crack propagation subroutine using the da/dN-ΔG-R equation based on the XFEM was defined. In the numerical simulation, a CT specimen mesh size of 1 mm showed better accuracy and efficiency than other mesh sizes.
  • The effects of the stress ratio on fatigue crack propagation were discussed. The results showed that under the same energy release rate range, the fatigue crack growth rate decreases as the stress ratio increases.
  • Under the same loading amplitude and number of cycles, the fatigue life decreases as the stress ratio increases. The numerical results considering the influence of stress ratio using the da/dN-ΔG-R equation based on the XFEM were close to the test results, while the results without considering the stress ratio based on the Paris equation were inaccurate.

6. Future Work

  • ∙ When considering the deck-rib welding joints of steel bridges, the residual stress is much greater than the external vehicle load stress [5]. Therefore, the real effective stress ratio will change significantly and not be equal to the external load stress ratio. The method proposed in this paper that considers the influence of the stress ratio will help guide future studies regarding the effects of welding residual stress on the fatigue life of steel bridges.
  • ∙ In practical engineering, the load forms, such as tension, bending, shearing, and some combination forms, are complicated than those used in this study. Thus, the influence of load forms on FCP should be studied further.
  • ∙ In practical engineering, the initial crack forms are random and require special flaw detection equipment to be detected. Two-dimensional surface cracks are also common. Therefore, further research regarding methods for describing the propagation of two-dimensional surface cracks is also needed.

Author Contributions

Formal analysis, B.C.; Investigation, S.C. and Z.F.; Methodology, B.C.; Project administration, A.L.; Software, S.C.; Supervision, A.L.; Writing—original draft, B.C.; Writing—review & editing, Y.D. All authors have read and agreed to the published version of the manuscript.

Funding

This research was funded by the Program of National Natural Science Foundation of China (no. 52108108, 51878027, 52008202), Beijing Postdoctoral Scientific Research Funding Project (no. 2021-zz-105), the Pyramid Talent Training Project of Beijing University of Civil Engineering and Architecture (no. JDYC20220809), and the Research Ability Improvement Program for Young teachers of Beijing University of Civil Engineering and Architecture (no. X21073).

Institutional Review Board Statement

Not applicable.

Informed Consent Statement

Not applicable.

Data Availability Statement

Not applicable.

Acknowledgments

The authors gratefully acknowledge the Program of National Natural Science Foundation of China (no. 52108108, 51878027, 52008202), Beijing Postdoctoral Scientific Research Funding Project (no. 2021-zz-105), the Pyramid Talent Training Project of Beijing University of Civil Engineering and Architecture (no. JDYC20220809), and the Research Ability Improvement Program for Young teachers of Beijing University of Civil Engineering and Architecture (no. X21073).

Conflicts of Interest

The authors declare no conflict of interest.

References

  1. Xiao, Z.G.; Yamada, K.; Inoue, J.; Yamaguchi, K. Fatigue cracks in longitudinal ribs of steel orthotropic deck. Int. J. Fatigue 2006, 28, 409–416. [Google Scholar] [CrossRef]
  2. Ya, S.; Yamada, K.; Ishikawa, T. Fatigue evaluation of rib-to-deck welded joints of orthotropic steel bridge deck. J. Bridge Eng. 2011, 16, 492–499. [Google Scholar] [CrossRef]
  3. Xiao, Z.G.; Yamada, K.; Ya, S.; Zhao, X.L. Stress analyses and fatigue evaluation of rib-to-deck joints in steel orthotropic decks. Int. J. Fatigue 2008, 30, 1387–1397. [Google Scholar] [CrossRef]
  4. Fisher, J.; Barsom, J. Evaluation of cracking in the rib-to-deck welds of the Bronx-Whitestone Bridge. J. Bridge Eng. 2016, 21, 04015065. [Google Scholar] [CrossRef]
  5. Cao, B.Y.; Ding, Y.L.; Song, Y.S.; Zhong, W. Fatigue life evaluation for deck-rib welding details of orthotropic steel deck integrating mean stress effects. J. Bridge Eng. 2019, 24, 04018114. [Google Scholar] [CrossRef]
  6. Liu, Y.P.; Chen, C.Y.; Li, G.Q.; Li, J.B. Fatigue life prediction of semi-elliptical surface crack in 14MnNbq bridge steel. Eng. Fail. Anal. 2010, 17, 1413–1423. [Google Scholar] [CrossRef]
  7. Paris, P.C.; Gomez, M.P.; Anderson, W.E. A rational analytic theory of fatigue. Trend Eng. 1961, 13, 9–14. [Google Scholar]
  8. Forman, R.G.; Kearney, V.E.; Engle, R.M. Numerical analysis of crack propagation in cyclic-loaded structures. J. Basic Eng. 1967, 9, 459–463. [Google Scholar] [CrossRef]
  9. Walker, K. The effect of stress ratio during crack propagation and fatigue for 2024-T3 and 7075-T6 aluminum. ASTM STP 1970, 462, 1–14. [Google Scholar]
  10. Donald, J.K.; Lados, D.A. An integrated methodology for separating closure and residual stress effects from fatigue crack growth rate data. Fatigue Fract. Eng. Mater. Struct. 2007, 30, 223–230. [Google Scholar] [CrossRef]
  11. Kwofie, S.; Rahbar, N. An equivalent driving force model for crack growth prediction under different stress ratios. Int. J. Fatigue 2011, 33, 1199–1204. [Google Scholar] [CrossRef]
  12. Kwofie, S.; Zhu, M.L. Modeling R-dependence of near-threshold fatigue crack growth by combining crack closure and exponential mean stress model. Int. J. Fatigue 2019, 122, 93–105. [Google Scholar] [CrossRef]
  13. Li, Y.; Wang, H.; Gong, D. The interrelation of the parameters in the Paris equation of fatigue crack growth. Eng. Fract. Mech. 2012, 96, 500–509. [Google Scholar] [CrossRef]
  14. Zhan, W.; Lu, N.; Zhang, C. A new approximate model for the R-ratio effect on fatigue crack growth rate. Eng. Fract. Mech. 2014, 119, 85–96. [Google Scholar] [CrossRef]
  15. Cano, A.J.; Salazar, A.; Rodriguez, J. Evaluation of different crack driving forces for describing the fatigue crack growth behaviour of PET-G. Int. J. Fatigue 2018, 107, 27–32. [Google Scholar] [CrossRef]
  16. Xin, H.H.; Correia, J.A.F.O.; Veljkovic, M. Three-dimensional fatigue crack propagation simulation using extended finite element methods for steel grades S355 and S690 considering mean stress effects. Eng. Struct. 2021, 227, 111414. [Google Scholar] [CrossRef]
  17. Ribeiro, V.; Correia, J.; Lesiuk, G.; Goncalves, A.; De Jesus, A.; Berto, F. Application and discussion of various crack closure models to predict fatigue crack growth in 6061-T651 aluminium alloy. Int. J. Fatigue 2021, 153, 106472. [Google Scholar] [CrossRef]
  18. Ribeiro, V.; Correia, J.; Mourao, A.; Lesiuk, G.; Goncalves, A.; De, J.A.; Berto, F. Fatigue crack growth modelling by means of the strain energy density-based Huffman model considering the residual stress effect. Eng. Fail. Anal. 2022, 140, 106543. [Google Scholar] [CrossRef]
  19. Moarrefzadeh, A.; Shahrooi, S.; Azizpour, M.J. Predicting fatigue crack propagation in residual stress field due to welding by meshless local Petrov-Galerkin method. J. Manuf. Process. 2019, 45, 379–391. [Google Scholar] [CrossRef]
  20. Anaei, M.M.; Khosravifard, A.; Bui, T. Analysis of fracture mechanics and fatigue crack growth in moderately thick plates using an efficient mesh free approach. Theor. Appl. Fract. Mech. 2021, 113, 102943. [Google Scholar] [CrossRef]
  21. Giannella, V.; Dhondt, G.; Kontermann, C.; Citarella, R. Combined static-cyclic multi-axial crack propagation in cruciform specimens. Int. J. Fatigue 2019, 123, 296–307. [Google Scholar] [CrossRef]
  22. Huynh, H.D.; Nguyen, M.N.; Cusatis, G.; Tanaka, S.; Bui, T.Q. A polygonal XFEM with new numerical integration for linear elastic fracture mechanics. Eng. Fract. Mech. 2019, 213, 241–263. [Google Scholar] [CrossRef]
  23. Xin, H.; Sun, W.C.; Fish, J. Discrete element simulations of powder-bed sintering-based additive manufacturing. Int. J. Mech. Sci. 2018, 149, 373–392. [Google Scholar] [CrossRef]
  24. Zhang, X.; Li, L.; Qi, X.; Zheng, J.; Chen, B.; Feng, J.; Duan, S. Experimental and numerical investigation of fatigue crack growth in the cracked gear tooth. Fatigue Fract. Eng. Mater. Struct. 2017, 40, 1037–1047. [Google Scholar] [CrossRef]
  25. Cui, C.; Ma, Y.; Zhang, Q.-h.; Da, L.-t.; Han, S.-h. Fatigue strength and crack growth of double-side welded rib-to-deck joint in orthotropic steel decks. J. Constr. Steel Res. 2022, 196, 107444. [Google Scholar] [CrossRef]
  26. Belytschko, T.; Black, T. Elastic crack growth in finite elements with minimal remeshing. Int. J. Numer. Method Eng. 1999, 45, 601–620. [Google Scholar] [CrossRef]
  27. Nikfam, M.R.; Zeinoddini, M.; Aghebati, F.; Arghae, A.A. Experimental and XFEM modeling of high cycle fatigue crack growth in steel welded T-joints. Int. J. Mech. Sci. 2019, 153, 178–193. [Google Scholar] [CrossRef]
  28. Wang, C.S.; Wang, Y.Z.; Cui, B.; Duan, L.; Ma, N.X.; Feng, J.Q. Numerical simulation of distortion-induced fatigue crack growth using extended finite element method. Struct. Infrastruct. Eng. 2020, 16, 106–122. [Google Scholar] [CrossRef]
  29. Jie, Z.Y.; Wang, W.J.; Chen, C.; Wang, K.N. Local approaches and XFEM used to estimate life of CFRP repaired cracked welded joints under fatigue loading. Compos. Struct. 2021, 241, 113251. [Google Scholar] [CrossRef]
  30. Nie, D.; Chen, X.; Wu, Q.; Liu, Y. Stress corrosion cracking behaviors of FV520B stainless steel used in a failed compressor impeller. Eng. Fail. Anal. 2020, 116, 104701. [Google Scholar] [CrossRef]
  31. Li, Z.N.; Zhang, J.K. Engineering Fracture Mechanics; Beihang University Press: Beijing, China, 2012. [Google Scholar]
  32. Standardization Administration of the People’s Republic of China. Metallic Materials Fatigue Testing Fatigue Crack Growth Method (GBT 6398-2017); China Standards Press: Beijing, China, 2017.
  33. Standardization Administration of the People’s Republic of China. Structural Steel for Bridge (GBT 714-2015); China Standards Press: Beijing, China, 2015.
  34. Ministry of Housing and Urban-Rural Development of the People’s Republic of China. Standard for Design of Steel Structures (GB 50017-2017); China Architecture and Building Press: Beijing, China, 2017.
  35. Japan Society of Steel Construction (JSSC). Fatigue Design Recommendations for Steel Structures and Commentary; Gihodo Publishing: Tokyo, Japan, 1993. [Google Scholar]
Figure 1. Meshing at the crack tip in different numerical simulation methods. (a) ANSYS [25]; (b) ZENCRACK [30]; (c) XFEM [28].
Applsci 12 12782 g001
Figure 2. Size of CT specimen (unit: mm).
Applsci 12 12782 g002
Figure 3. CT specimen installed on the fatigue test equipment. (a) QBG-100 fatigue testing machine; (b) CT specimen.
Applsci 12 12782 g003
Figure 4. Fatigue crack propagation process. (a) Crack propagation initial stage; (b) Crack propagation close to fracture.
Applsci 12 12782 g004
Figure 5. Fatigue crack growth curve under different stress ratios. (a) a−N curve; (b) FCP rate curve.
Applsci 12 12782 g005
Figure 6. Experimental data fitting of steel Q345qD. (a) Paris; (b) Walker and da/dN−ΔG−R.
Applsci 12 12782 g006
Figure 7. FEM of CT specimen.
Applsci 12 12782 g007
Figure 8. Flow chart of FCP considering R effects based on the XFEM.
Applsci 12 12782 g008
Figure 9. Effect of mesh size. (a) Mesh size; (b) a-N curve under different mesh sizes.
Applsci 12 12782 g009
Figure 10. Stress distribution of the FCP process. (a) a = 10 mm, N = 1; (b) a = 18 mm, N = 1.59E5; (c) a = 26 mm, N = 2.21E5; (d) a = 34 mm, N = 2.7E5; (e) a = 42 mm, N = 3.04E5; (f) a = 50 mm, N = 3.49E5.
Applsci 12 12782 g010
Figure 11. da/dN−ΔG curves at R ratios of 0.1, 0.3, 0.5 and 0.7.
Applsci 12 12782 g011
Figure 12. Comparison of experimental and simulation results under different stress ratios. (a) R = 0.1; (b) R = 0.3; (c) R = 0.5; (d) R = 0.7.
Applsci 12 12782 g012
Table 1. Chemical composition of steel Q345qD [33].
Chemical CompositionCSiMnPSNbV
Mass proportion (%)≤0.18≤0.550.90~1.70≤0.025≤0.020≤0.06≤0.08
Chemical compositionTiCrNiCuMoNAls
Mass proportion (%)≤0.03≤0.80≤0.50≤0.55≤0.20≤0.012≥0.015
Table 2. Test loading scheme.
Specimen CaseStress Ratio RMinimum Load Pmin (kN)Maximum Load Pmax (kN)
CT-10.11.6716.67
CT-20.36.4321.43
CT-30.51530
CT-40.73550
Table 3. Material parameters of steel Q345qD.
FCP EquationGuarantee RateMaterial Parameters
log(C0) or log©m0 or mγ
ParisMean−10.802.687
With 95% guarantee−10.542.847
Walker, da/dN-ΔG-RMean−10.852.6960.947
With 95% guarantee−10.712.7800.957
Publisher’s Note: MDPI stays neutral with regard to jurisdictional claims in published maps and institutional affiliations.

