Article

Dark Current Noise Correction Method Based on Dark Pixels for LWIR QWIP Detection Systems

1
Key Laboratory of Infrared System Detection and Imaging Technology, Shanghai Institute of Technical Physics, Chinese Academy of Sciences, Shanghai 200083, China
2
University of Chinese Academy of Sciences, Beijing 100049, China
3
Key Laboratory of Infrared Imaging Materials and Detectors, Shanghai Institute of Technical Physics, Chinese Academy of Sciences, Shanghai 200083, China
*
Author to whom correspondence should be addressed.
Appl. Sci. 2022, 12(24), 12967; https://doi.org/10.3390/app122412967 (registering DOI)
Submission received: 7 November 2022 / Revised: 29 November 2022 / Accepted: 14 December 2022 / Published: 16 December 2022

Abstract

:
The long-wave infrared (LWIR) quantum-well photodetector (QWIP) operates at low temperatures, but is prone to focal plane temperature changes when imaging in complex thermal environments. This causes dark current changes and generates low-frequency temporal dark current noise. To address this, a dark current noise correction method based on dark pixels is proposed. First, dark pixels were constructed in a QWIP system and the response components of imaging pixels and dark pixels were analyzed. Next, the feature data of dark pixels and imaging pixels were collected and preprocessed, after which a recurrent neural network (RNN) was used to fit the dark current response model. Target data were collected and input into the dark current response model to obtain dark level correction values and correct the original data. Finally, after calculation and correction, temporal noise was reduced by 49.02% on average. The proposed method uses the characteristics of dark pixels to reduce dark current temporal noise, which is difficult using conventional radiation calibrations; this is helpful in promoting the application of QWIPs in LWIR remote sensing.

1. Introduction

The temperature of the body of the long-wave infrared (wavelength 8~12 μm) detection system is close to the temperature of the detection target, so it is seriously affected by its own thermal radiation [1,2]. A high-performance LWIR detector is usually equipped with an integrated cooler. The dewar usually sets the target cooling temperature below the temperature of liquid nitrogen; as the package is outside, the temperature difference is significant [3]. Long-term operation in the orbit load shield, external body materials, and surface coating degradation can lead to cooler operating temperatures in a poor thermal environment, resulting in irregular temperature fluctuations in the focal plane [4,5,6,7,8]. The dark current and its response both change, resulting in low-frequency time noise.
Recently, the QWIP has become an important research area in the study of LWIR detection; the QWIP has advantages compared to the dominant mercury cadmium telluride (HgCdTe) detector [9,10]. An LWIR QWIP’s semiconductor is primarily composed of GaAs, using a mature fabrication process [11]. Compared with the widely used HgCdTe detector, it operates at lower temperatures, has lower dark current values, has better uniformity, and realizes the development of large surface arrays more easily [12,13]. Dark current is generated in the focal plane under bias when no external radiation is received from the target; this directly impacts the noise level of the device [14]. Although the QWIP’s dark current is low, it is subject to quantum efficiency. When the target is an object with a normal temperature, photocurrent and dark current size are of an order of magnitude larger. Dark current’s impact cannot be ignored. Levine’s research shows that temperature directly influences dark current and that the relationship between the two is non-linear [15]. When the focal plane temperature fluctuates, dark current’s magnitude and response both change; the effective area, etching process, electron transfer efficiency, and readout circuit performance of each area array detector pixel are different [16], as is the instantaneous dark current response value. In a study conducted by the Shanghai Institute of Technical Physics of the Chinese Academy of Sciences, the QWIP’s dark current was greatly affected by temperature fluctuation, which led to anomalies in the detector’s light field uniformity experiment [17].
It is not possible to directly measure the time-continuous dark current response in engineering applications. It is not accurate to infer fluctuations in the dark current level by calculating the response of all pixels in the focal plane, as changes in the target’s background radiation also cause the overall level to fluctuate significantly. Conventional methods of radiation calibration also make it difficult to eliminate temporal noise caused by dark current. Correction by measuring the overall temperature of the focal plane, as well as factors such as uneven temperature distribution and measurement errors, can introduce other noise. Suppressing dark current noise using a readout circuit is highly accurate [18]; however, the presence of a readout circuit increases the overall detector size and power consumption, the fabrication process is difficult, and it has not been verified in large surface array detectors at temperatures below that of liquid nitrogen. Multiple radiometric calibrations in a short period can reduce the effect of dark current noise but compresses the continuous imaging time. As a result, some momentary key image information is missed, especially during gaze-type imaging [19,20]. Designing reference pixels such as dark pixels in the focal plane is a general method. The QWIPs in the LWIR payload of Landsat 8 and Landsat 9 have dark pixels that cannot receive external radiation and are used to monitor the dark current level in the focal plane [21,22,23]. However, the dark pixels’ raw data are not publicly available and there is no research regarding the correction method based on the QWIP’s dark pixels data. In the detection of visible light and infrared bands, there are methods such as using numerical methods for dark current correction, using devices with low dark current, suppressing dark current by lowering the cooling temperature, and changing the driving method of the detector to reduce dark current. However, none of them apply to the reduction of dark current noise.
We propose a method to correct the temporal noise of dark currents based on setting dark pixels in the detector. We define dark pixels, describe the preparation of the QWIP used in the study, introduce the detection system’s design, and analyze the method’s principles. In the experiment, the method continuously acquired feature data in the laboratory and fitted the mapping relationship between dark pixels and imaging pixels using an RNN. The acquired target data and the dark pixels’ response were used to obtain the dark level correction value of the imaging pixels, and the imaging pixels’ response was corrected. The effectiveness of this method was verified by comparing the data’s temporal noise values before and after correction.

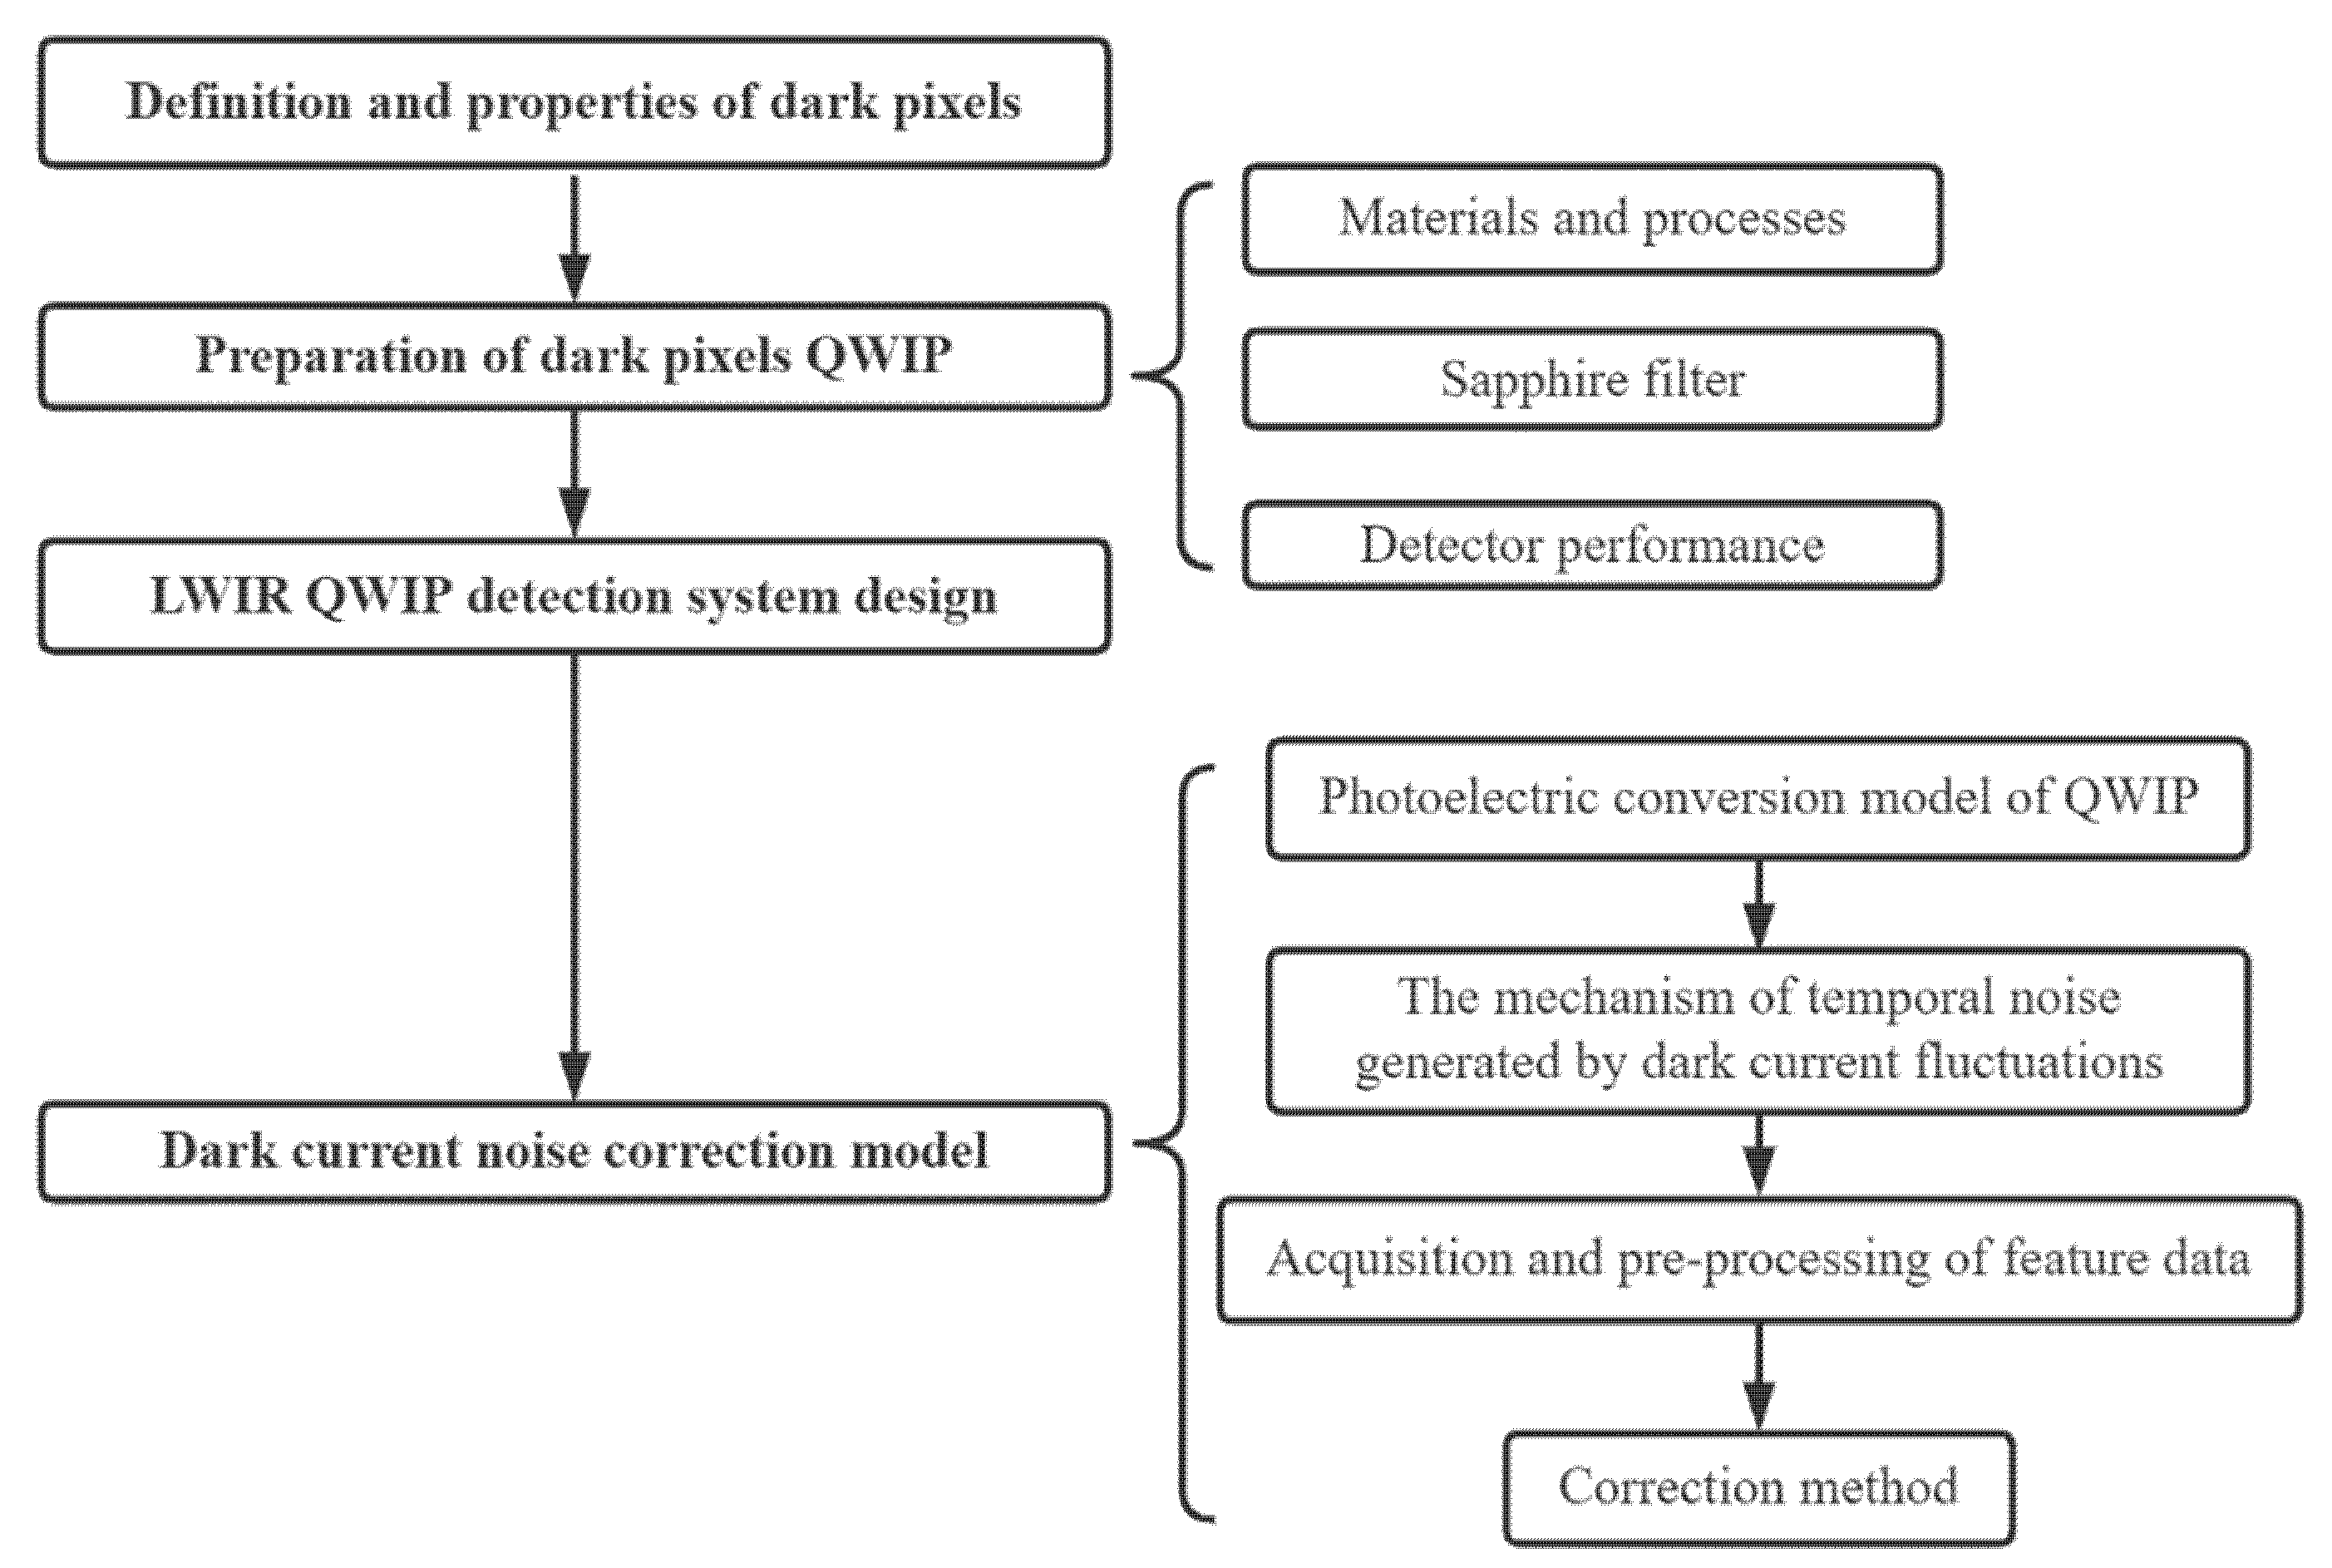
2. Dark Current Noise Correction Method Based on Dark Pixels

A schematic diagram of this section’s discussion is presented in Figure 1. First, we introduce the definition and characteristics of dark pixels. Next, we present the dark pixels’ QWIP preparation process and the information acquisition system’s design. Finally, we explain the dark current noise correction method in detail.

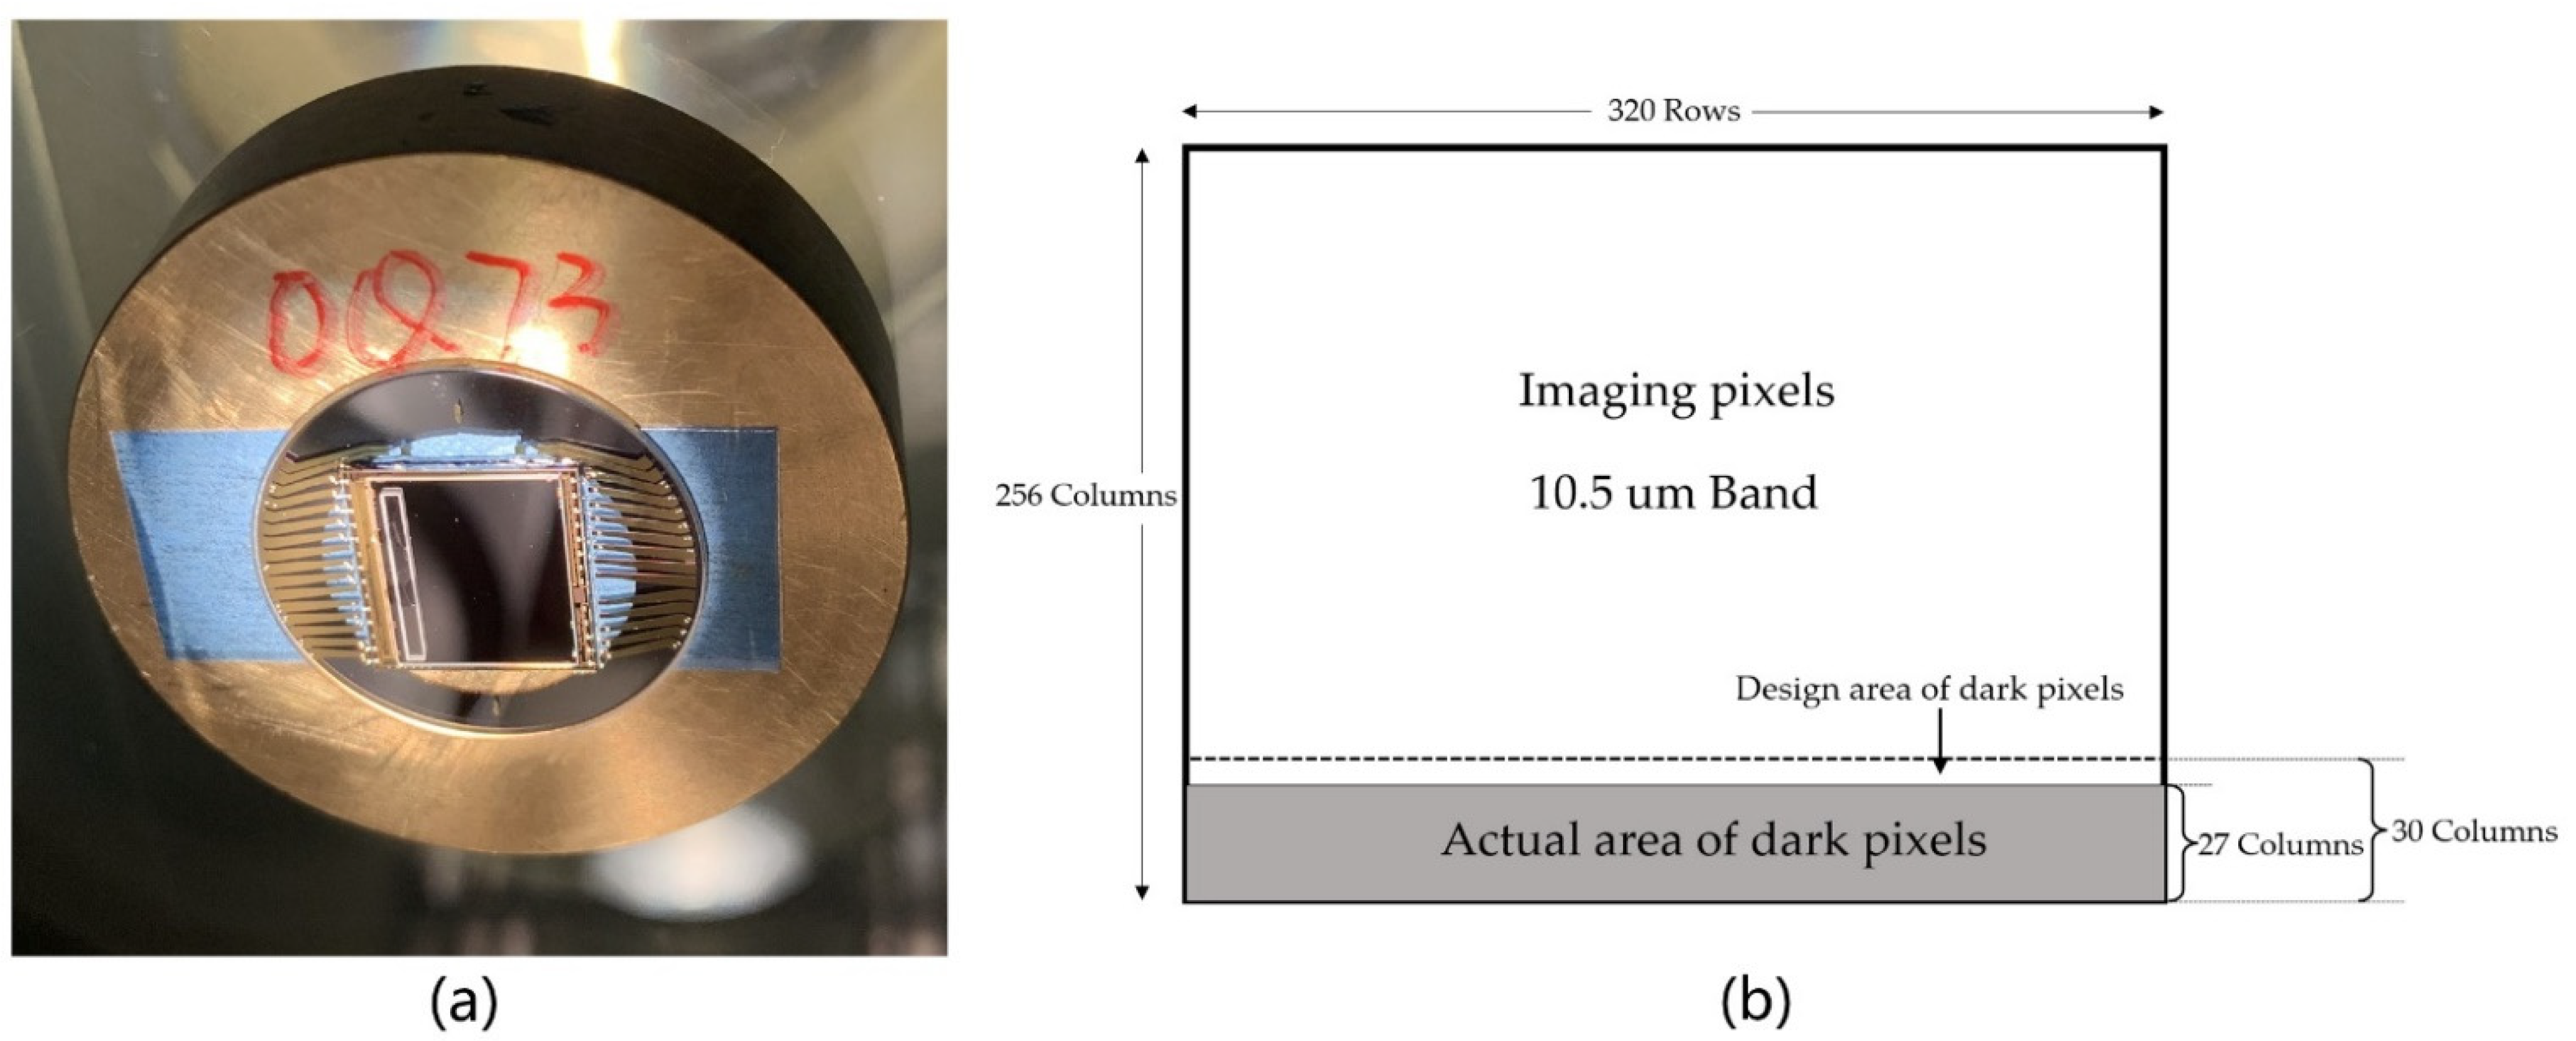
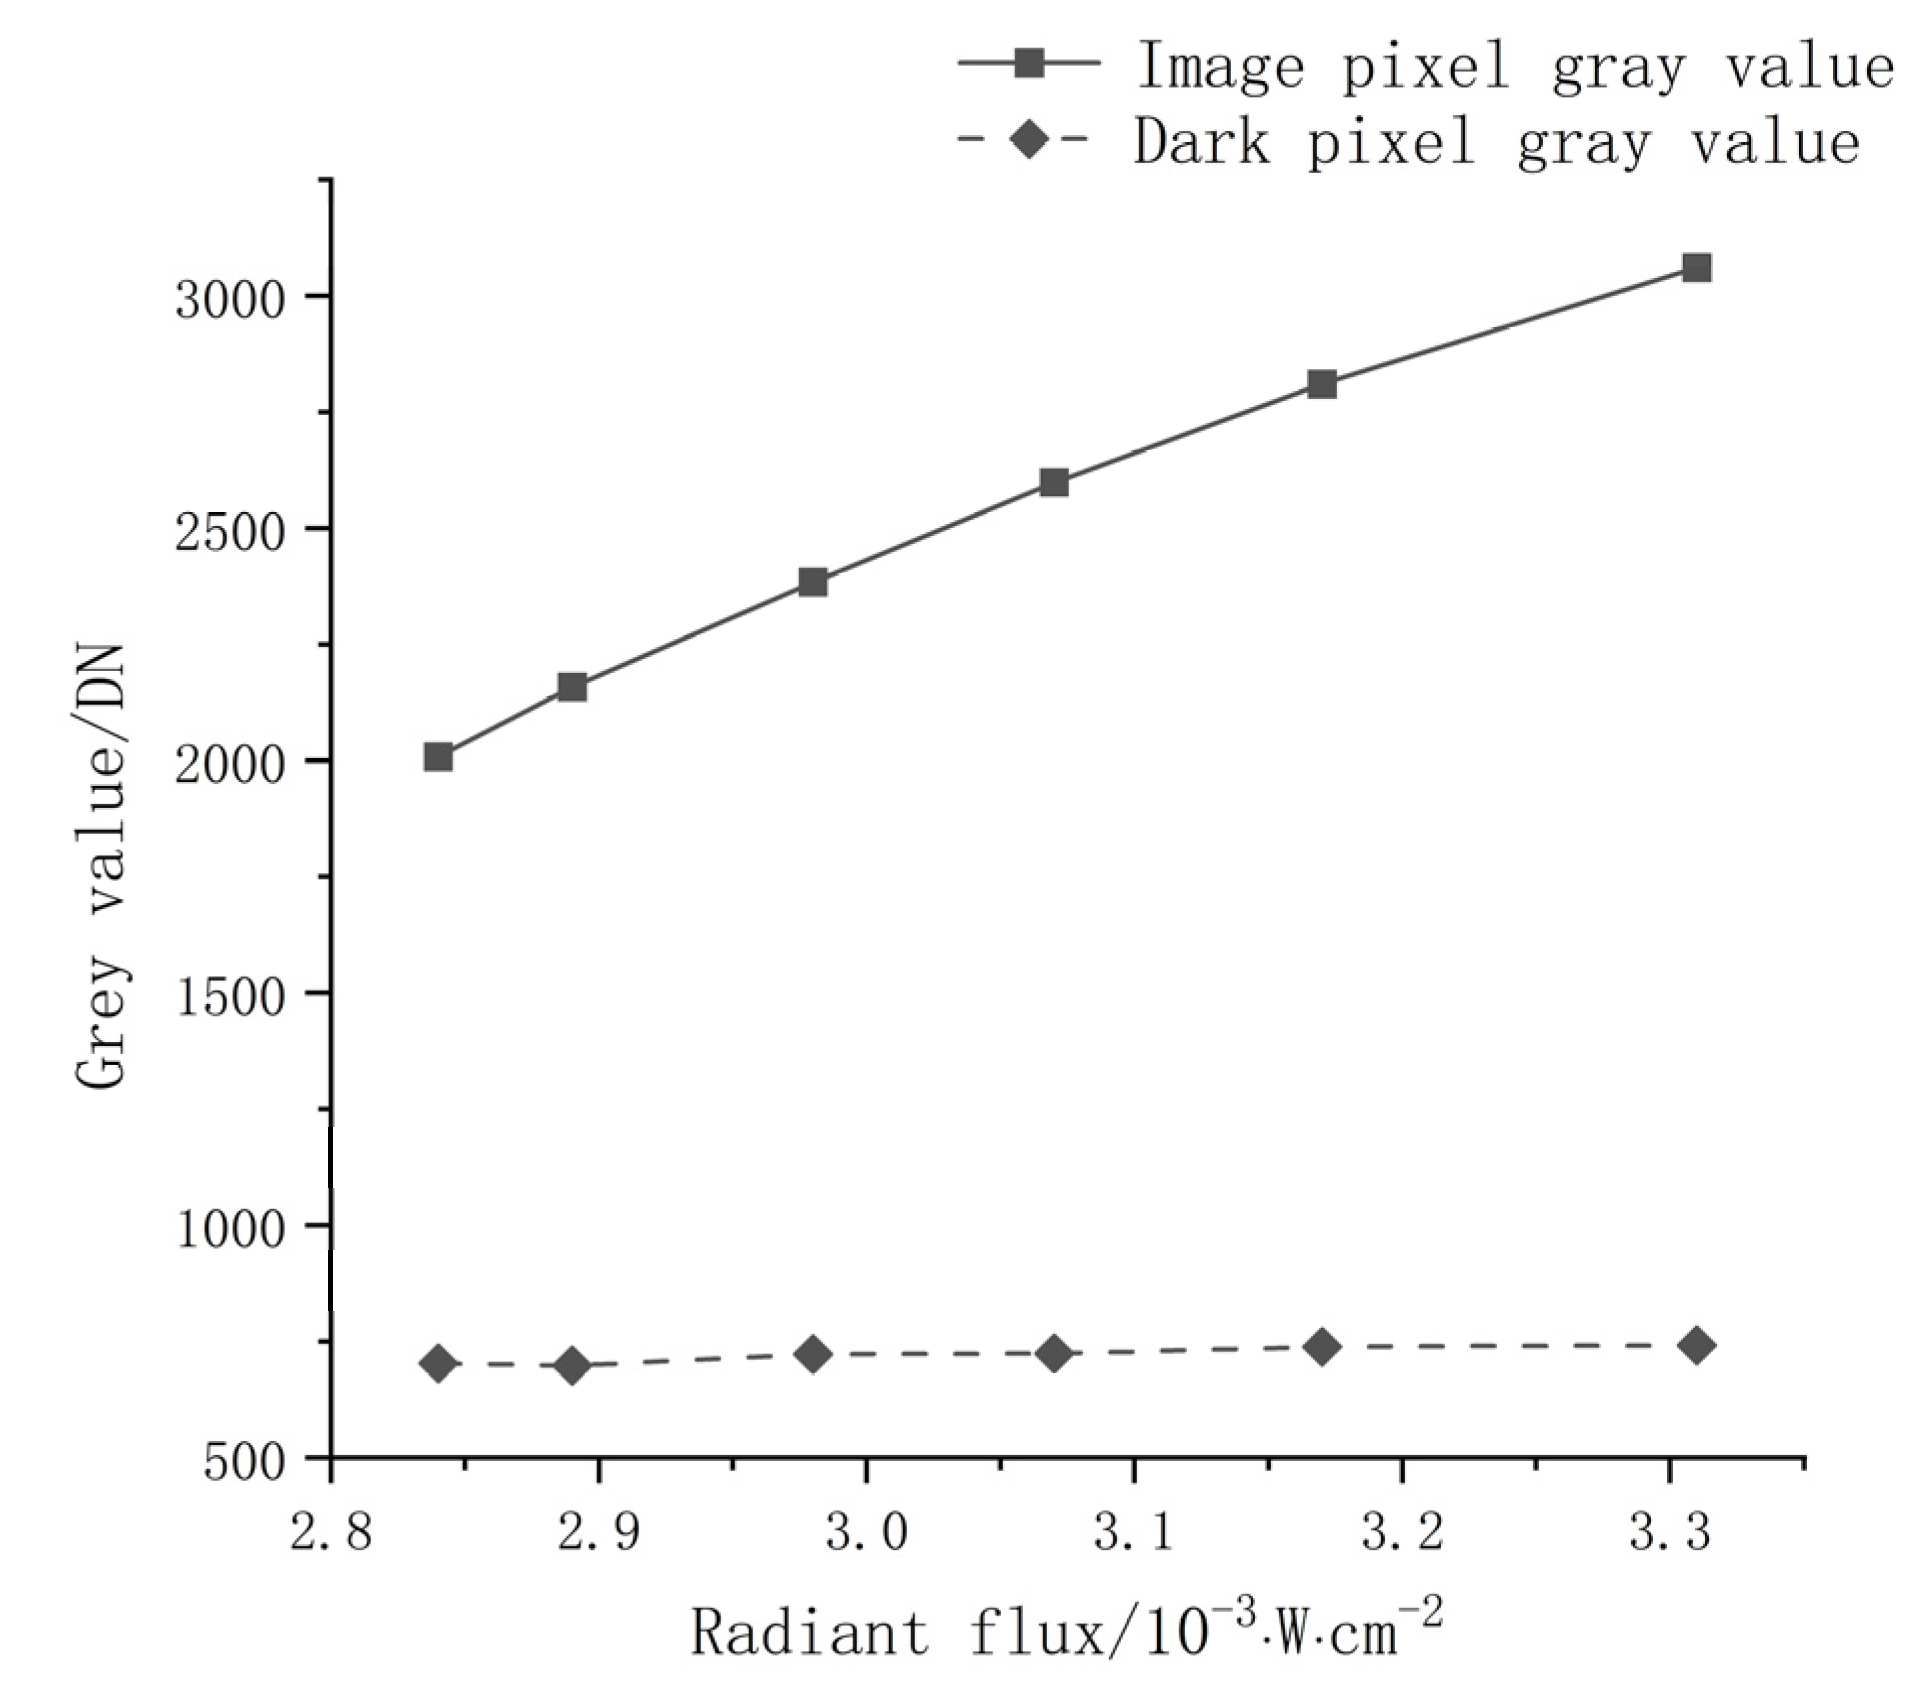
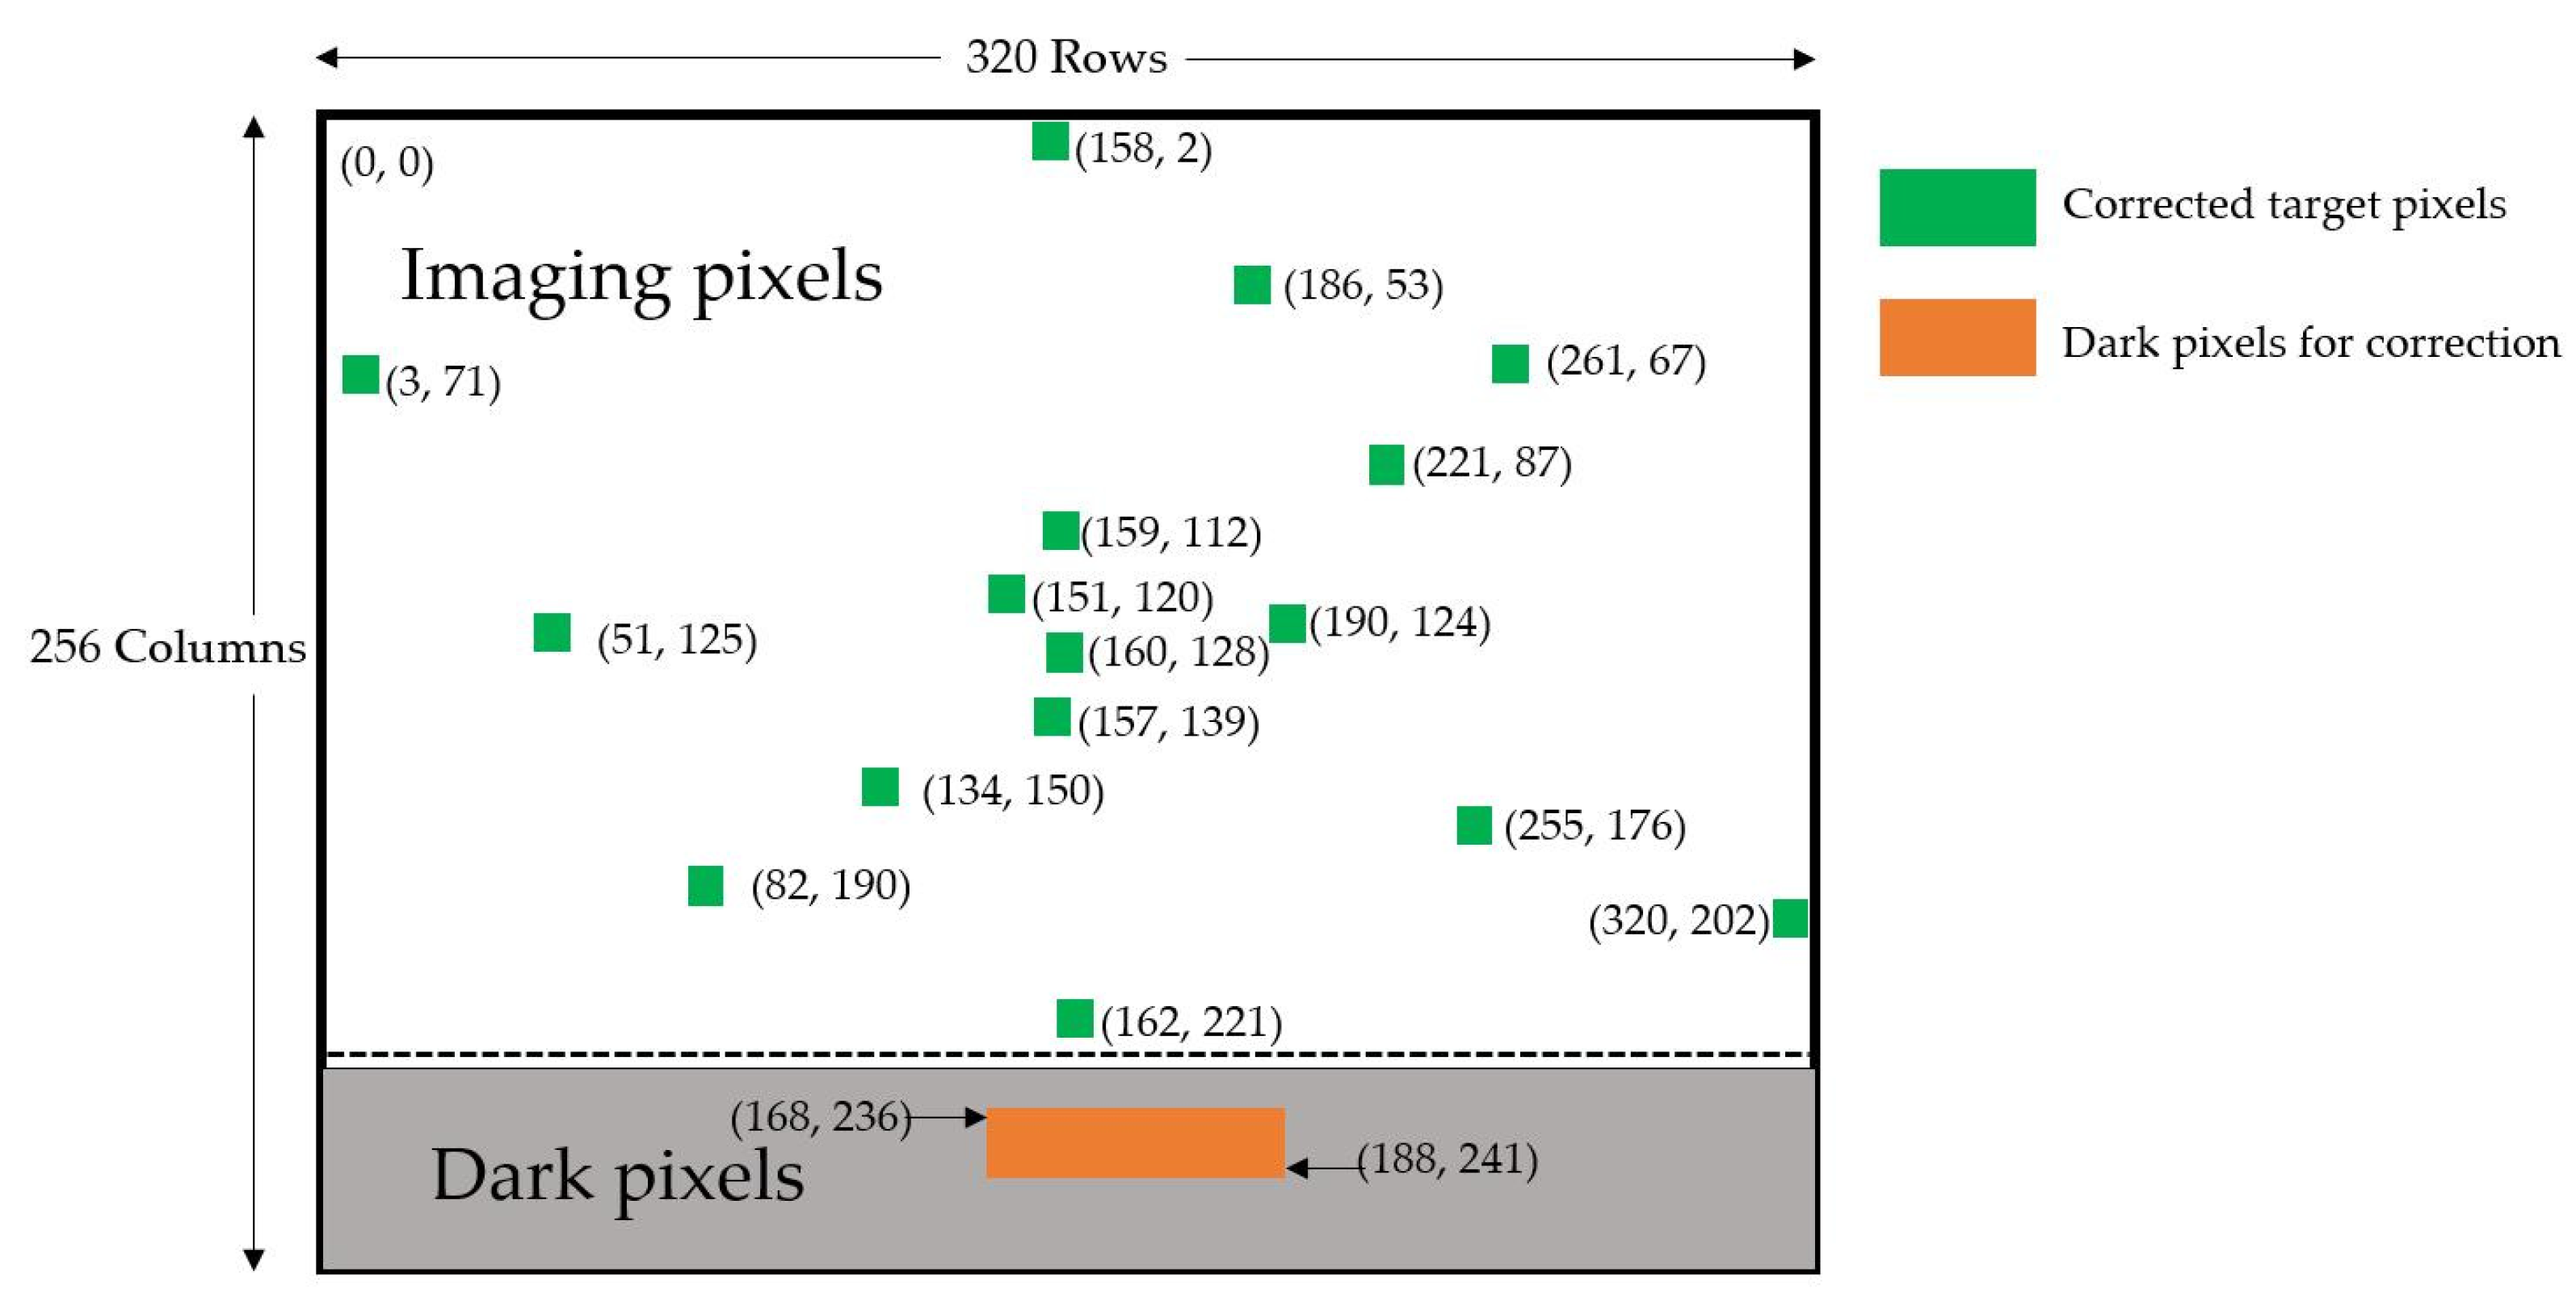
2.1. Definition and Properties of Dark Pixels

Dark pixels with functionally intact readout circuits were constructed as follows: a material filter was laminated to normal imaging pixels’ surfaces so that the pixels could not receive radiation from outside the window, the target, or the dewar. Dark pixels’ and imaging pixels’ response characteristics do not differ; external factors lead to dark pixels not registering a target response. The LWIR QWIP’s cooling temperature is lower than that of liquid nitrogen; as a result, the background radiation of the filter on the dark pixels’ surface is very low.
Although some naturally formed blind pixels cannot receive external radiation, dead pixels cannot effectively replace dark pixels because (1) there are uncertainties in the formation of dead pixels; (2) there is no guarantee that their function will be effective in the long term; (3) the dark current characteristics of dead pixels and normal pixels are not necessarily the same; and (4) the response characteristics of different dead pixels vary [24,25].

2.2. Preparation of the Dark Pixels QWIP

This study used a GaAs/AlGaAs area array LWIR QWIP developed by the Shanghai Institute of Technology of the Chinese Academy of Sciences. The QWIP fabrication process used is as follows. Using a GaAs/AlGaAs material system [26], a 50-cycle quantum-well infrared detector structure was grown on a GaAs substrate using Molecular Beam Epitaxy (MBE) [27]. The grown material was tested in advance for optical parameters and single-component flow. The peak response was confirmed to be approximately 10.5 μm. Next, a focal plane chip process was used; a SenTech ICPRIE SI500 (SenTech, Berlin, Germany) inductively-coupled plasma etching system grated the material. Ohmic electrodes were prepared via electron beam evaporation and alloyed using a rapid thermal annealing process to improve ohmic contact properties. Next, the reflective layer was prepared using ion-beam sputtering. Finally, the Inductively-Coupled Plasma (ICP) etching method was used to etch the pixels’ isolation [28]. An Under-Bump Metallization (UBM) layer was grown and then chip cells were prepared in columns via a thermal evaporation of approximately 8 μm [29]. After scribing, individual chips were interconnected with the readout circuit using hybrid inverted soldering; after interconnection, indium columns were reinforced with glue and then the GaAs substrate was thinned. As shown in Figure 2, it is a cross-sectional figure of the QWIP. The QWIP was equipped with a DI-type readout circuit [30], ISC9705 (with a response spectrum of 10–11 μm), packaged inside a metal dewar with an integrated Stirling cooler RS058 (with a target cooling temperature of 50 K) developed by Wuhan Global Sensor Technology Company (Wuhan, China) [31]. After testing, the focal plane temperature control accuracy was within 0.3 K. Table 1 shows the QWIP’s primary performance indicators.
Sapphire was chosen as the patch material; its spectral properties dictate that it cuts off at a 6 um wavelength, eliminating the need for an optical film on the surface [32,33]. Sapphire filters do not transmit LWIR radiation, are very chemically stable, have a Mohs hardness of 9, and are not easily deformed by vibration, making them suitable for designs oriented to complex scenario work. Therefore, a single-sided polished sapphire chip with a thickness of 430 μm was selected. The schematic diagram of the QWIP used in this study is shown in Figure 3b; a sapphire patch of 30 pixel sized rows was laser cut and placed precisely on top of the target pixels. There was an error in the laser cutting process; 27 rows of dark pixels actually formed. The photoresist was dropped into both sides of the patch and the package was tested after complete solidification; the completed focal plane is shown in Figure 3a. The laser cutting edge shape was not regular and the influence of photoresist should be excluded. The actual use should be discarded as partial performance is not sufficient to meet the design requirements of the image data.

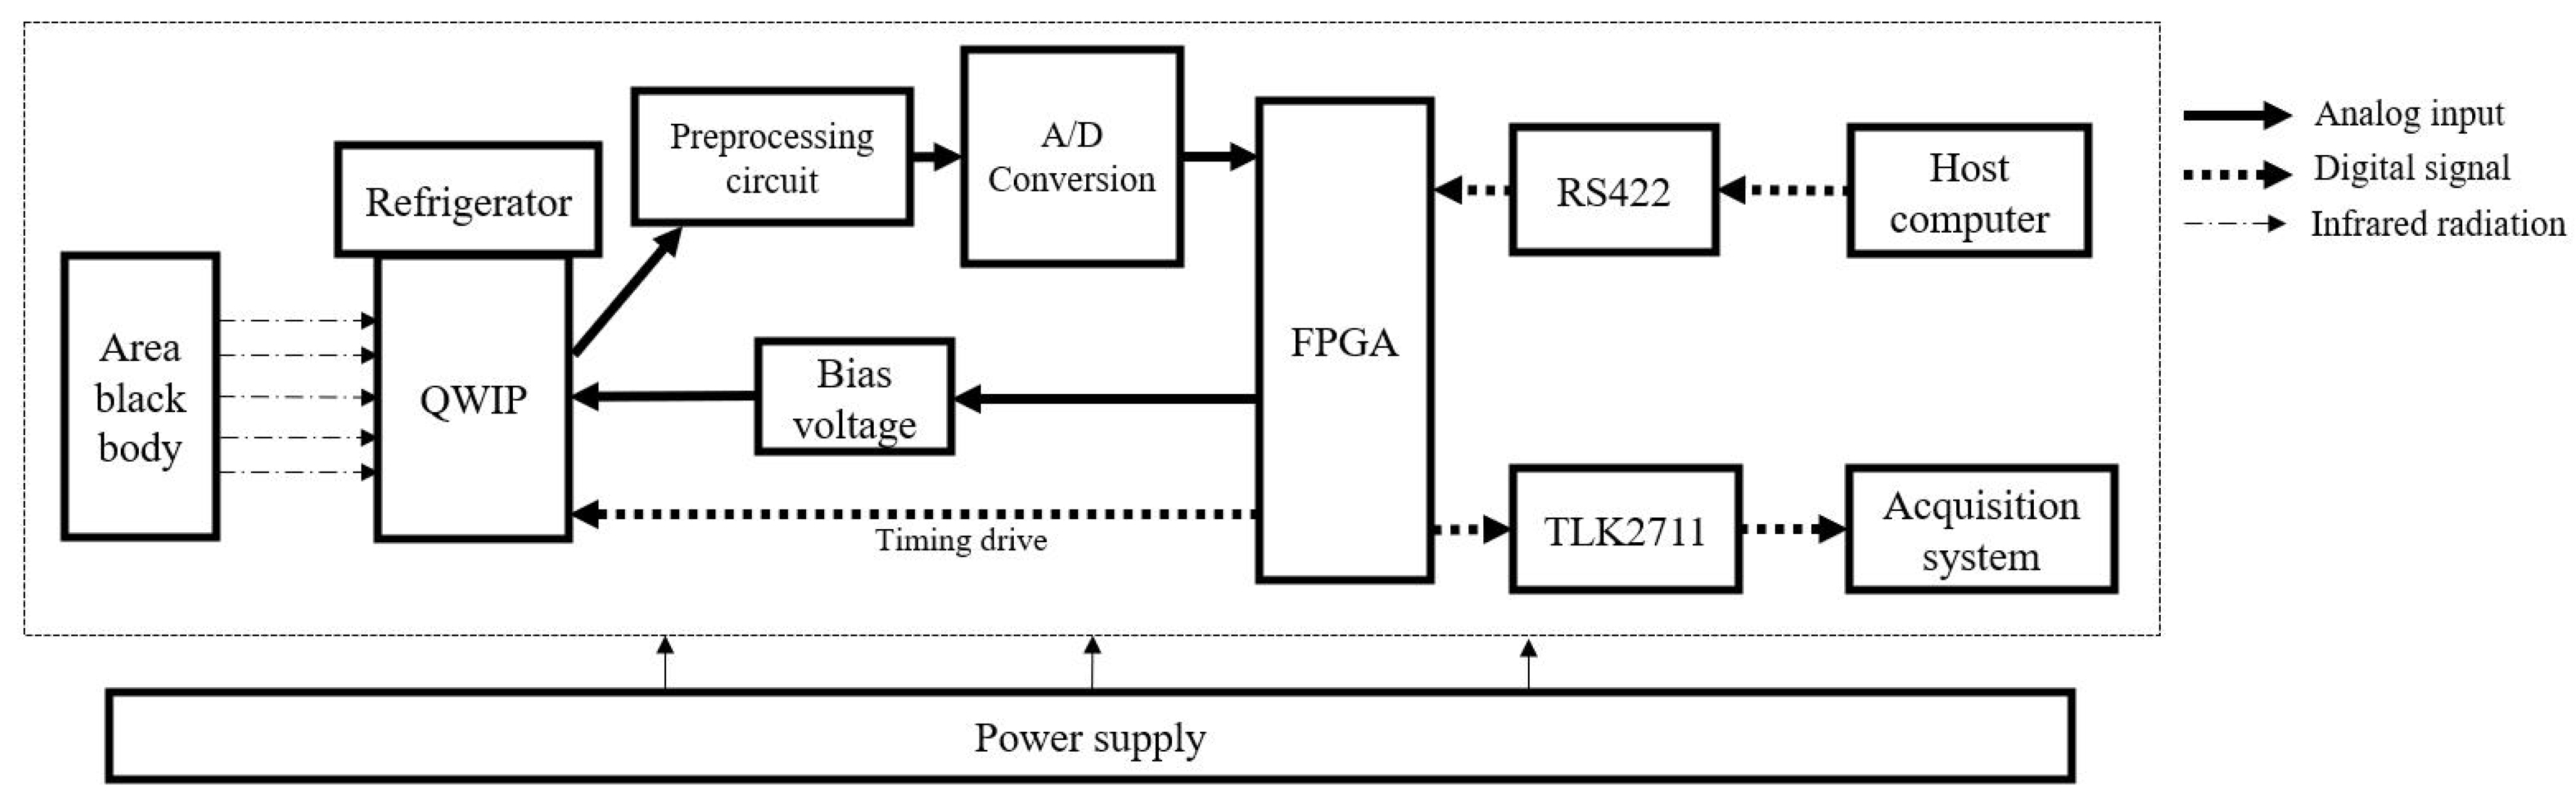
2.3. LWIR QWIP Detection System Design

The main components of the LWIR QWIP detection system are shown in Figure 4. The blackbody model HFY300 for small surfaces was manufactured by the Shanghai Fuyuan Photoelectric Company (Shanghai, China). The blackbody’s surface diameter is 100 mm, its operational range is 20–70 °C and its temperature controlling accuracy is 0.01 °C. The LWIR QWIP detection system operates as follows. Radiation emitted from the blackbody is transmitted through the detector window to the image pixel; photons interact with electrons to produce the current signal, which is collected and processed by the readout circuit and output as an analog signal. Next, the information acquisition system proportionally amplifies and uses a low-pass filter for the analog signal output from the detector, performs an analog-to-digital conversion with 12 quantization bits, generates the digital signal, and transmits it to the Field Programmable Gate Array (FPGA). Finally, the FPGA transmits the processed digital signals to the data acquisition system via TLK2711 and stores them as image data. The quantized data stored in the system are called Grey value or Response value and their units are DN.

2.4. Dark Current Noise Correction Model

2.4.1. QWIP Photoelectric Conversion Model

The detector’s total response voltage consists of the response of the target object’s photocurrent, the dewar’s internal background radiation, the optical system’s background radiation, the dark current, the readout circuit’s bias voltage, and the information acquisition circuit, as shown in Figure 5. The total response voltage of the detector is expressed as:
V detector = V target + V target _ bg + V dewar _ bg + V optical + V dark + V bias
where V detector is the total detector response voltage; V target is the response of the target object; V target _ bg is the response of the background outside the target; V dewar _ bg is the background light response inside the dewar; V optical is the background response of the optical system; V dark is the dark current response; and V bias is the bias response of the readout and information acquisition circuits [34]. In the case of a constant detection target, acquisition environment, and operating mode, only changes in dark current response ( V dark ) can cause the total detector response ( V detector ) to change. The dark current response is expressed as:
V dark = T int I dark / C int
where T int is the integration time; C int is the integration capacitance; and I dark is the dark current. T int and C int were constants in this study and were part of the operating mode.
In the experiment, dark pixels could not pick up background radiation from the target outside the window or inside the dewar. As surface filters on dark pixels were in the low-temperature region, its background radiation was ignored. Dark pixels were set on the focal plane to exclude the influence of noise from other radiation sources; they could directly respond to the dark current level in the focal plane instead of being estimated by mathematical methods. The response of dark pixels is expressed as:
V pe _ dark = V dark + V bias
where V bias is the bias response of the readout circuit, the information acquisition circuit, pixel non-uniformity, and external bias. In this study, the detector signal was read from the same channel and the bias response of each pixel did not vary with time.

2.4.2. The Mechanism of Temporal Noise Generated by Dark Current Fluctuations

What follows is an analysis of the mechanism of temporal noise generated by temperature fluctuations in the focal plane. Engineering applications will regard the operating temperature of the cooled detector as an ideal constant condition. In practice, when the temperature difference inside and outside the dewar is large and varied, the cooler cannot maintain ideal operating conditions [35]. A cooler temperature with 0.2 K variation is considered a stable state; although even when the cooler operates normally, the temperature of the cold end still fluctuates slightly. Dark current is very sensitive to temperature. In Levine’s research regarding the QWIP’s operating temperature (of approximately 50 K), a 0.1 K temperature change resulted in a dark current change of more than 10% [15]. The colder end of cooler temperature changes results in dark current fluctuations that produce temporal noise when the detection system operates.
Next, the temperature uniformity between the pixels of the focal plane is discussed. The size of this focal plane is microscale, about 1 cm2. The cold head of the cooler can completely cover the area of the focal plane. The inner wall of the Dewar has a good isolation function. Therefore, the temperature uniformity of the focal plane is considered to be in an acceptable level. That is, the temperature variation of the dark pixels and the imaging pixels are almost the same. In addition, for the focal plane which has a large focal plane size, a large number of pixels, and long line columns, a more precise cooling scheme should be used.
The premise of correcting the dark current noise of the imaging pixels using the response of dark pixels is as follows. First, when the temperature inside the dewar is below liquid nitrogen temperature, the QWIP’s characteristics determine that the photocurrent changes negligibly with temperature, excluding the temperature change photoelectric effect [15]. Second, in the method’s conversion to response changes, it is difficult to achieve real-time temperature measurements inside the dewar to substitute into the dark current model to calculate the dark current in engineering applications. As the dark current model needs to fit numerous parameters, any inaccurate parameter will produce errors. Third, in continuous normal power-on imaging, the response characteristics of the pixels remain unchanged and the mapping relationship of the fitted dark pixels’ response to the imaging pixels’ correction value always holds.

2.4.3. Acquisition and Pre-Processing of Feature Data

The acquisition and pre-processing of feature data was achieved as follows. The detection system was powered on and the detector was oriented to collect feature data from the blackbody at the same temperature. As dark pixels’ processing and other temporal noise in the system are non-uniform, when processing the feature data the mean value of multiple valid dark pixels’ responses was taken to eliminate the non-uniformity of the dark current response; the mean value of multiple frames of dark pixels’ responses was taken to reduce the effect of other temporal noise. The feature data of dark pixels are calculated as:
g dark _ average t = k = 0 N frame j = 0 m 1   i = 0 n 1 g dark i , j , k N frame m 1 n 1
where g dark i , j , k is the response value of the dark pixel; i , j , k refer to the serial numbers of rows, columns, and frames, respectively; m 1 , n 1 , and N frame are the number of rows, columns, and frames in the dark pixel area, respectively; and t is the number of the feature data in time order. N frame needs to be selected according to the detector imaging pixel output frequency and frame frequency. When the number of feature data is small, the N frame should be low (1 to 10). When the number of feature data is large, N f r a m e should be chosen according to the frequency of the pixel response fluctuations. Choosing an appropriate N frame allows for the acquisition of sufficient features and reduces the amount of data processing. The mean frame ( N frame ) response of each single imaging pixel is obtained by calculating:
g pe _ average i , j , t = k = 0 N frame g pixel i , j , k N frame
where g pixel i , j , k is the response value of the imaging pixel.
The magnitudes of g dark _ average t and g pe _ average i , j , t are randomly distributed in time, and the relationship between these two types of characteristic data is nonlinear. When the value interval of the feature data is wide, the least-squares method and segmented best-slope-averaging method have large fitting errors [36,37]. The RNN has a strong nonlinear fitting ability and is suitable for solving the regression problem of nonlinear functions [38]. As shown in Figure 6, to construct the mapping relationship from g dark _ average t to g pe _ average i , j , t , the RNN was selected to build the model so that the feature data at each moment occupied the weight in the model and the number of input layers was reduced. The calculation process from the input layer to the output layer is shown in Equation (6).
g pe _ average i , j t = U g dark _ average t t + W a t 1 + b
where U represents the weight matrix from the input layer to the hidden layer; W represents the weight matrix from the hidden layer to the hidden layer; a t 1 represents the output vector of the hidden layer at moment t−1; and b represents the deviation matrix from the input layer to the hidden layer [39]. In this model, U represents the weight of the feature data of a certain group t of dark pixels arriving at the intermediate hidden layer. V represents the weight of the feature data of the central hidden layer arriving at a certain imaging pixel of the same group t. W represents the weight from the feature data hiding layer of the previous group to the feature data hiding layer of the next group t. As the ordinal number t of the group increases, the closer the W of the intergroup weights comes to the final result.
After training, a model of the regional dark pixels’ mean response, g RNN _ dark k , with the dark level correction value g RNN _ img i , j , k of the imaging pixel, was obtained. The regional dark pixel mean response is calculated as:
g RNN _ dark k = j = 0 m 1   i = 0 n 1 g dark i , j , k m 1 n 1  

2.4.4. Correction Method

At every temperature the blackbody’s target imaging data F frames were acquired to verify the correction effect; these data should be replaced by the imaging data of the corresponding scene in practical applications. To accomplish this, g RNN _ dark k was input into the model; the obtained output value, g RNN _ img i , j , k , reflects the dark current response of the imaging pixel in a specific moment. Finally, target data were corrected as follows:
g pixel i , j , k = g pixel i , j , k g RNN _ img i , j , k g ¯ RNN _ img i , j g ¯ RNN _ dark  
where g p i x e l i , j , k is the imaging response after correction using this method; g ¯ RNN _ img i , j is the mean value of g RNN _ img i , j , k at F frames; and g ¯ RNN _ dark is the mean value of g RNN _ dark k at F frames. The significance of the correction parameter is as follows. g RNN _ img i , j , k g ¯ RNN _ img i , j represents the increase in the response value of the imaging pixel in the kth frame due to dark current fluctuations; g ¯ RNN _ dark represents the focal plane’s overall dark level response value in the cycle of acquiring target imaging data. Data unaffected by the dark current can be restored after correction using Equation (8). It should be noted that except for g RNN _ img i , j , k , the other correction values did not affect temporal noise.

3. Dark Current Noise Correction Experiment for the LWIR QWIP System

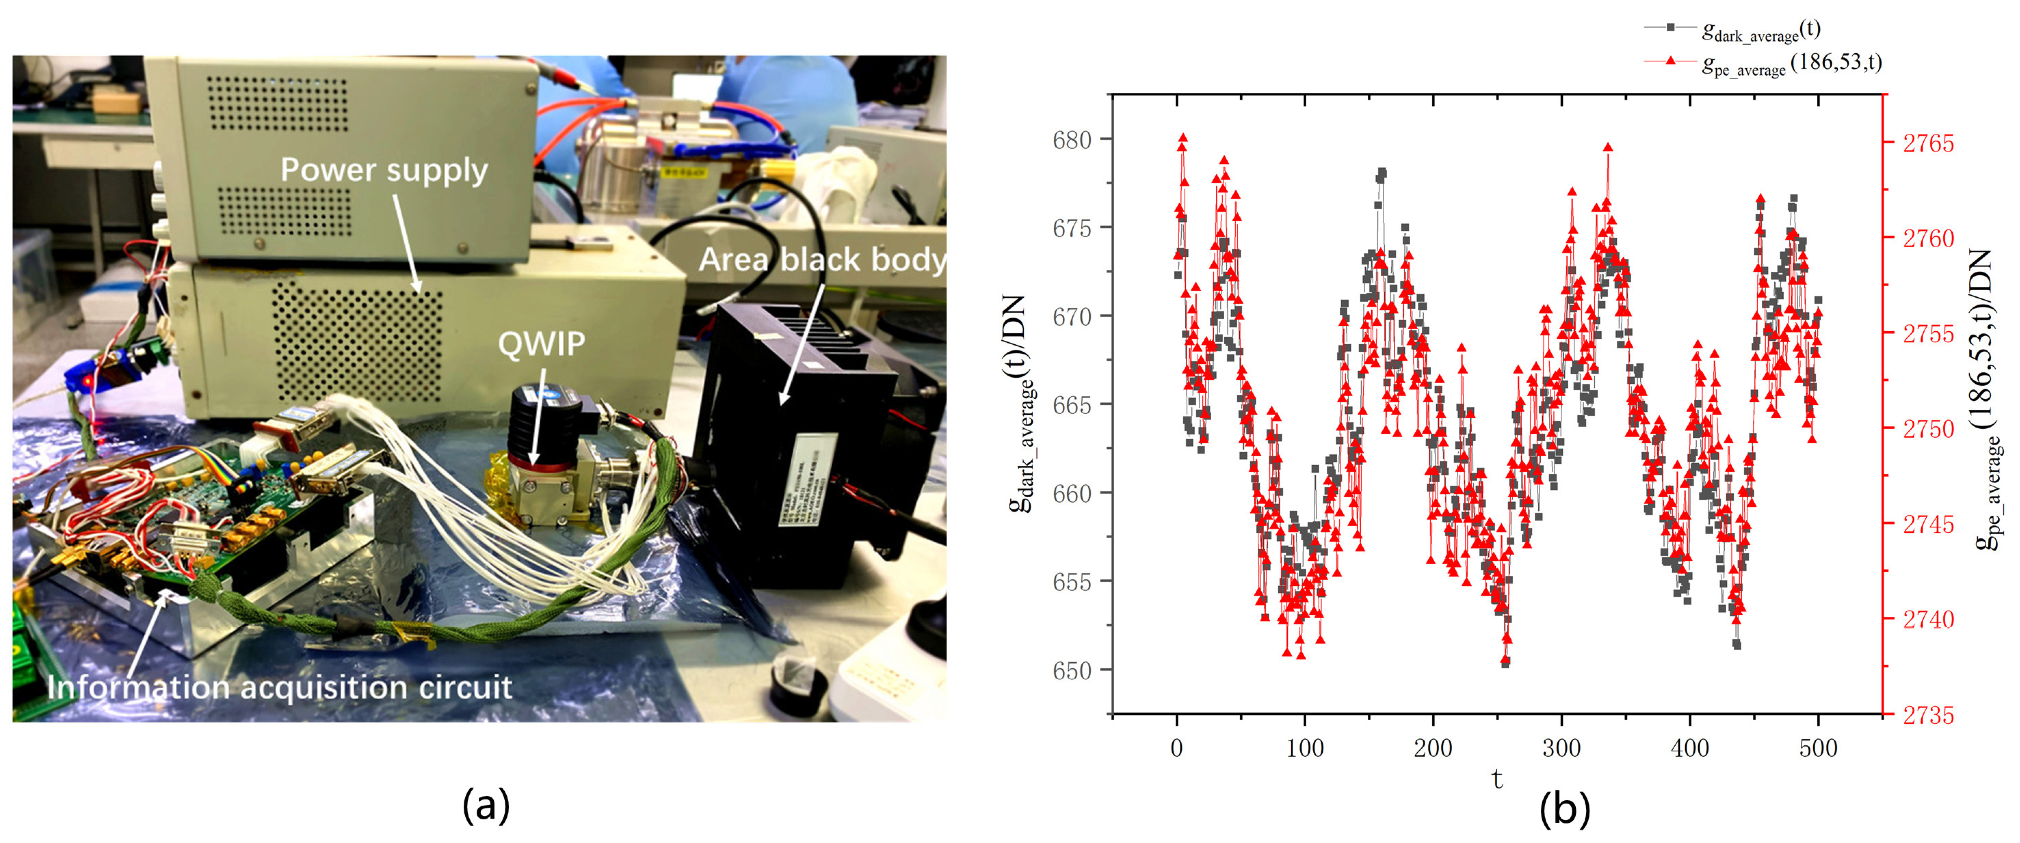
3.1. The Validity of Dark Pixels

In the experiment, the detection system was placed on the platform at an approximate 5 cm distance from the blackbody, with the window parallel to the blackbody’s emission surface. The cooler was powered on and the blackbody’s temperature was adjusted when the focal plane reached the target temperature. The system acquired data at each blackbody temperature. The calibration relationship between imaging pixels and dark pixels was calculated and is shown in Figure 7; the vertical coordinate Grey value is the regional pixel mean response of dark pixels and imaging pixels and the horizontal coordinate is the blackbody’s radiation flux. Imaging pixels had good sensitivity; the dark pixels’ response was negligibly related to the target temperature. Experimental results verify the functional validity of dark pixels; their response can be used as a reference value for the real-time dark current level at the focal plane.

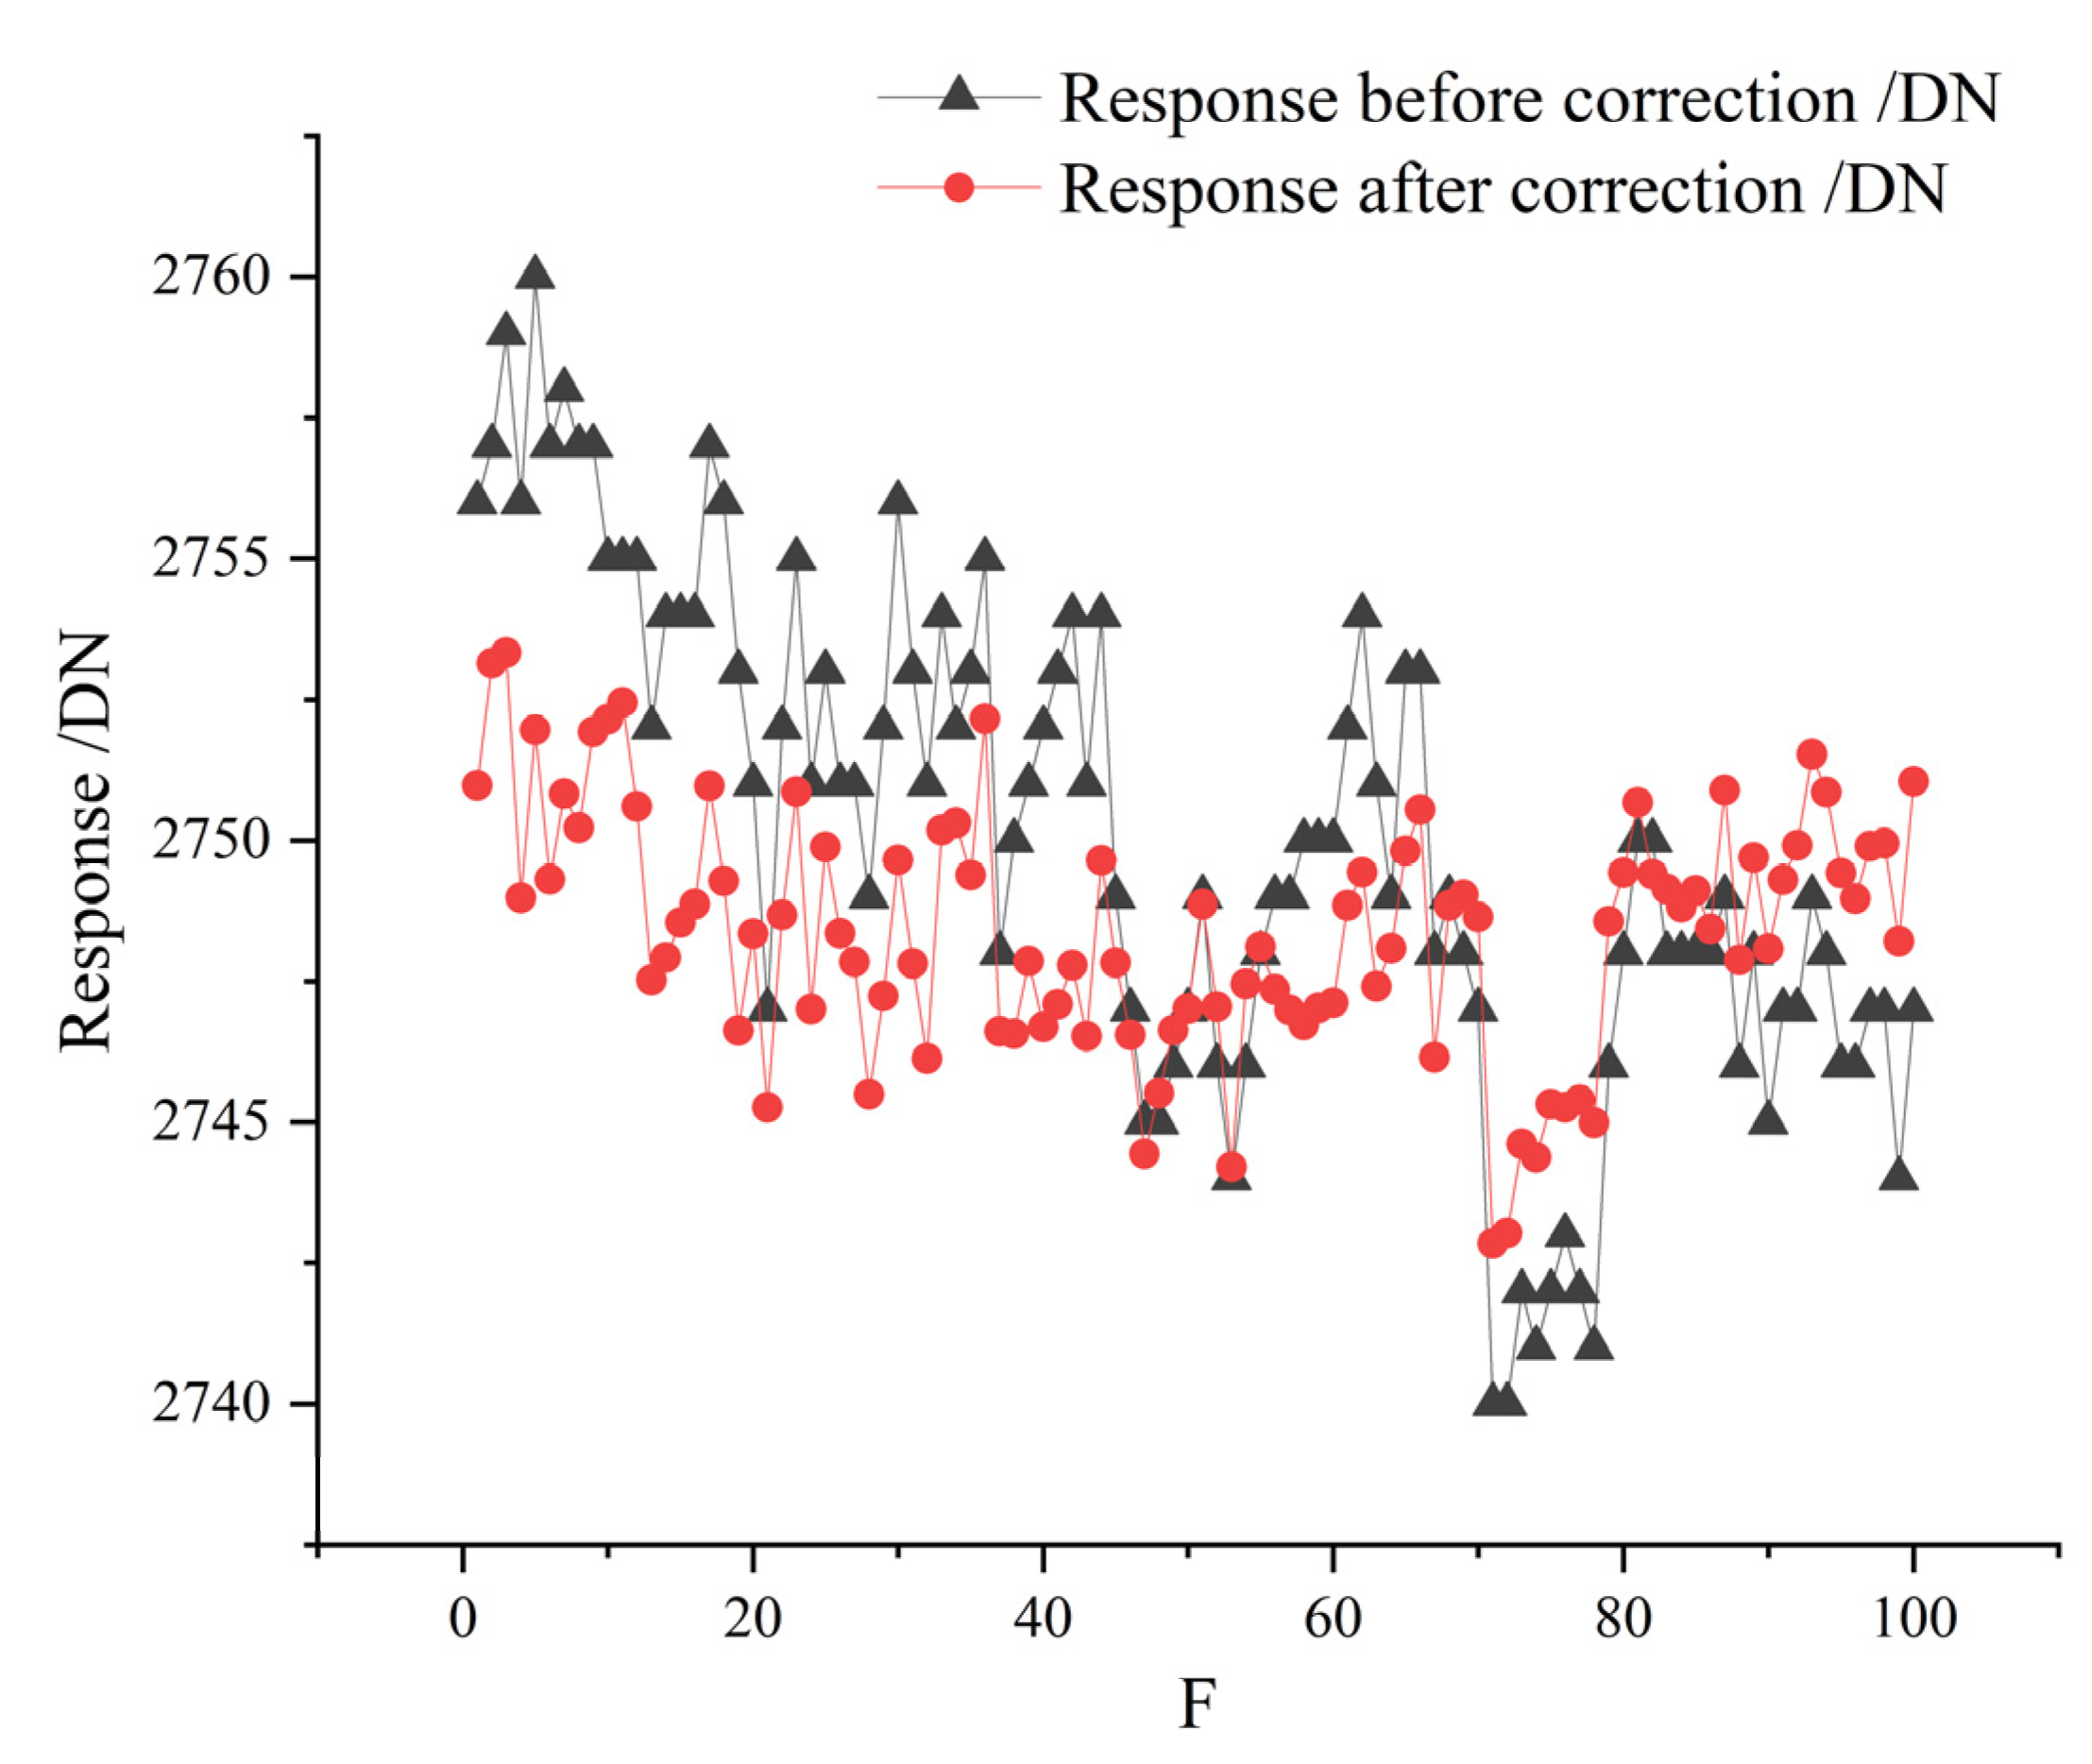
3.2. Dark Current Noise Correction Experiment

The feature data acquisition area was defined as 126 well-performing dark pixels; 16 imaging pixels which are located in the center, edge, and other areas, were selected as correction target pixels. Figure 8 shows the location of the selected pixels. The data acquisition experiment device is shown in Figure 9a; the blackbody temperature is being adjusted to maintain 298 K. The detection system is oriented to the effective area of the blackbody. In the experiment, the system was powered on and continuously acquired 3000 frames of imaging data; each dataset’s number of frames ( N frame ) was set to five. A total of 500 datasets were generated in training, followed by 100 datasets for the experiment.
As shown in Figure 9b, the feature data of dark pixels and imaging pixels (186, 53) correlated; the overall dark current also changed when there was a slight focal plane temperature change in a specific moment, leading to fluctuations in response values. It is not possible to obtain the dark current response change value of a single imaging pixel when using target-oriented imaging.
The RNN algorithm was used to train the feature data of dark pixels and imaging pixels to obtain the mapping relationship between them. The prediction model’s evaluation indices include the average absolute error, root mean square error, and average prediction accuracy. The correction effect of the imaging pixels (186, 53) was assessed. The conventional evaluation metrics of prediction models include the following three parameters: Mean Absolute Error (MAE), Root Mean Square Error (RMSE), and Mean Prediction Accuracy (MPA). MAE is the predicted value minus the true value, and the mean value after finding the absolute value. RMSE is the mean squared error squared. MPA is the mean true value minus the mean error, divided by the mean true value. After calculation, MAE was 1.93, RMSE was 2.28, and MPA was 99.93%. This is sufficient to demonstrate the RNN’s excellent performance in the prediction of this model. A comparison of the model’s predicted and actual experimental values is shown in Figure 10. Horizontal coordinates indicate the serial number of the experiment set; the left vertical coordinate, Response, indicates the dark level correction value, g RNN _ img i , j , k ; Predict output represents the predicted value; Real output represents the actual value; and the right vertical coordinate, Error, indicates the error value.
In the experiment, 100 frames of target data were acquired. After inputting g RNN _ dark k into the model, g RNN _ img i , j , k was obtained and corrected using Equation (8). The responses before and after the correction of the imaging pixels (186, 53) are shown in Figure 11, which shows that the response’s fluctuation was reduced after correction. The horizontal axis indicates frame numbers F.
The noise reduction effect of this method was examined by comparing the temporal noise before and after the correction of imaging pixels [40]. The noise values before and after correction are calculated as:
g noise i , j = 1 F 1 k = 1 F g pixel i , j , k g ¯ pixel i , j 2
g ¯ pixel i , j = 1 F k = 1 F g pixel i , j , k
In this experiment, F was 100; g ¯ pixel i , j is the multi-frame mean response of the imaging pixel.
Noise values before and after correction of the target imaging pixels were calculated using Equations (9) and (10), as shown in Table 2; after correction, noise was reduced by 49.17% on average.
As a comparison, a conventional dark currents noise correction method is introduced: the response value in the imaging is subtracted from the mean response of dark pixels. The method is shown in Equation (11):
g pixel _ method 2 i , j , k = g pixel i , j , k j = 0 m 1   i = 0 n 1 g dark i , j , k m 1 n 1
where g pixel _ method 2 is the data corrected by this method. The correction effect was verified using Equations (9) and (10) for the same imaging pixels. Their noise was reduced by 37.30% on average. It is obvious that the method mainly described in the article works better.
In the next experiment, four sets of target data at different target temperatures were collected and used to verify the calibration effect at different target temperatures. The calibration effect is shown in Table 3. The average correction effect for the four different sets of target temperature data was 49.02%. Therefore, the method is oriented to targets of different temperatures and the correction is stable.
There was residual noise in the corrected imaging pixels, including photon noise from the target and the background, sampling noise from the information acquisition circuit, and readout circuit noise. There were also errors, including the RNN’s prediction error and crosstalk between imaging pixels and dark pixels.

4. Conclusions

We propose a correction method (based on dark pixels) to reduce the dark current noise of a QWIP, analyze the dark current correction model, and introduce the fabrication method for a dark pixels QWIP system. Training data were experimentally collected. The feature data of dark pixels and imaging pixels were obtained after processing. RNN was used to fit the model of the two types of feature data. The target data were collected for validation. The mean response of the processed dark pixels was input into the model, the output was obtained as the dark level correction value and then corrected for the target data. After correction, noise was reduced by 49.02% on average and the effect was significant. This method reduces the effect of dark current noise caused by QWIP temperature fluctuations and only needs to collect training data once to correct all subsequent imaging data; this supports continued use of a QWIP in LWIR remote sensing detection for complex thermal environments.

Author Contributions

Conceptualization, H.D. and J.X.; methodology, H.D.; software, Z.Y.; validation, J.X.; formal analysis, H.D.; investigation, H.D. and M.C.; resources, M.C.; data curation, H.D.; writing—original draft preparation, H.D.; writing—review and editing, J.X. and D.S.; supervision, Z.Y.; funding acquisition, D.S. All authors have read and agreed to the published version of the manuscript.

Funding

This research was funded by the Major Program of National Natural Science Foundation of China, grant number 42192582, and the National Key Research and Development Program of China, grant number 2016YFB0500400.

Institutional Review Board Statement

Not applicable.

Informed Consent Statement

Not applicable.

Data Availability Statement

Not applicable.

Conflicts of Interest

The authors declare no conflict of interest.

References

  1. Liu, J.; Xiao, L.; Liu, Y.; Cao, L.; Shen, Z. Development of long-wavelength infrared detector and its space-based application requirements. Chin. Phys. B 2019, 28, 028504. [Google Scholar] [CrossRef]
  2. Huang, W.; Ji, H. Effect of environmental radiation on the long-wave infrared signature of cruise aircraft. Aerosp. Sci. Technol. 2016, 56, 125–134. [Google Scholar] [CrossRef]
  3. Lu, Y.; Shao, Q.; Yue, H.; Yang, F. A review of the space environment effects on spacecraft in different orbits. IEEE Access 2019, 7, 93473–93488. [Google Scholar] [CrossRef]
  4. Hołyńska, M.; Tighe, A.; Semprimoschnig, C. Coatings and thin films for spacecraft thermo-optical and related functional applications. Adv. Mater. Interfaces 2018, 5, 1701644. [Google Scholar] [CrossRef]
  5. Bonnici, M.; Mollicone, P.; Fenech, M.; Azzopardi, M.A. Analytical and numerical models for thermal related design of a new pico-satellite. Appl. Therm. Eng. 2019, 159, 113908. [Google Scholar] [CrossRef]
  6. Sharma, A.; Sridhara, N. Degradation of thermal control materials under a simulated radiative space environment. Adv. Space Res. 2012, 50, 1411–1424. [Google Scholar] [CrossRef]
  7. Chi, G.C.; Liu, X.D.; Wen, J.G.; Lu, X.C. Dynomic environment adaptability analysis and verification for a rotary and integral Stirling cryocooler. Cryog. Supercond. 2017, 45, 20–24. [Google Scholar]
  8. Huang, F.; Shen, X.; Li, G.; Wang, G.; Zhao, Z. Influence of background radiation on space target detection in the long wave infrared range. Opt. Eng. 2012, 51, 086402. [Google Scholar] [CrossRef]
  9. Ye, Z.; Li, F.H.; Wang, J.D.; Chen, X.; Sun, S.H.; Liao, Q.J.; Huang, A.B.; Li, F.; Zhou, S.M.; Lin, J.M.; et al. Recent hotspots and innovative trends of infrared photon detectors. J. Infrared Millim. Waves 2022, 41, 15–39. [Google Scholar]
  10. Bhan, R.K.; Dhar, V. Recent infrared detector technologies, applications, trends and development of HgCdTe based cooled infrared focal plane arrays and their characterization. Opto-Electron. Rev. 2019, 27, 174–193. [Google Scholar] [CrossRef]
  11. Gunapala, S.; Bandara, S. Quantum Well Infrared Photodetector (QWIP) Focal Plane Arrays. In Semiconductors and Semimetals; Elsevier: San Diego, CA, USA, 1999; Volume 62, pp. 197–282. [Google Scholar]
  12. Rogalski, A. Quantum well photoconductors in infrared detector technology. J. Appl. Phys. 2003, 93, 4355–4391. [Google Scholar] [CrossRef] [Green Version]
  13. Tidrow, M.Z.; Beck, W.A.; Clark, W.W., III; Pollehn, H.K.; Little, J.W.; Dhar, N.K.; Leavitt, R.P.; Kennerly, S.W.; Beekman, D.W.; Goldberg, A.C. Device physics and focal plane array applications of QWIP and MCT. In Proceedings of the Photodetectors: Materials and Devices IV, San Jose, CA, USA, 27–29 January 1999; SPIE: Bellingham, WA, USA, 1999; pp. 100–113. [Google Scholar]
  14. Ryzhii, V.; Khmyrova, I.; Ryzhii, M.; Mitin, V. Comparison of dark current, responsivity and detectivity in different intersubband infrared photodetectors. Semicond. Sci. Technol. 2003, 19, 8. [Google Scholar] [CrossRef]
  15. Levine, B.F. Quantum-well infrared photodetectors. J. Appl. Phys. 1993, 74, R1–R81. [Google Scholar] [CrossRef]
  16. Ohnakado, T.; Ueno, M.; Ohta, Y.; Kosasayama, Y.; Hata, H.; Sugino, T.; Ohno, T.; Kama, K.; Tsugai, M.; Fukumoto, H. Novel Readout Circuit Architecture Realizing TEC-Less Operation for SOI Diode Uncooled IRFPA. In Infrared Technology and Applications XXXV; SPIE: Bellingham, WA, USA, 2009; pp. 302–311. [Google Scholar]
  17. Li, X.Y.; Li, N.; Xu, J.T.; Chu, K.H.; Xu, G.Q.; Wang, L.; Zhang, Y.; Zhu, L.Y.; Wang, J.Q.; Lu, W. GaAs/AlGaAs QWIP IRFPA for 10.55 μm long wavelength. Infrared Laser Eng. 2020, 49, 77–82. [Google Scholar]
  18. Zhang, W.K.; Chen, H.L.; Ding, R.J. Long wavelength infrared readout circuit with background suppression function. Infrared Laser Eng. 2021, 50, 20200266. [Google Scholar] [CrossRef]
  19. Zhang, C.J.; Zhang, H.; Chang, Y.G.; Chen, C.C. A review of radiometric calibration methods for optical remote sensors of Landsat series satellites. J. Remote Sens. 2015, 19, 719–732. [Google Scholar]
  20. Zhao, Y.H.; Wang, H.; Li, Y.F.; Li, Y.; Zhang, X.X. High-precision radiometric calibration techniques for long-wave infrared space optical remote sensors. J. Remote Sens. 2021, 25, 1646–1654. [Google Scholar]
  21. Masek, J.G.; Wulder, M.A.; Markham, B.; McCorkel, J.; Crawford, C.J.; Storey, J.; Jenstrom, D.T. Landsat 9: Empowering open science and applications through continuity. Remote Sens. Environ. 2020, 248, 111968. [Google Scholar] [CrossRef]
  22. Reuter, D.; Richardson, C.; Pellerano, F.; Irons, J.; Allen, R.; Anderson, M.; Jhabvala, M.; Lunsford, A.; Montanaro, M.; Smith, R.; et al. The Thermal Infrared Sensor (TIRS) on Landsat 8: Design overview and pre-launch characterization. Remote Sens. 2015, 7, 1135–1153. [Google Scholar] [CrossRef] [Green Version]
  23. Jhabvala, M.; Reuter, D.; Choi, K.; Sundaram, M.; Jhabvala, C.; La, A.; Waczynski, A.; Bundas, J. The QWIP focal plane assembly for NASA’s Landsat Data Continuity Mission. In Proceedings of the Infrared Technology and Applications XXXVI, Orlando, FL, USA, 5–9 April 2010; SPIE: Bellingham, WA, USA, 2010; pp. 1114–1126. [Google Scholar]
  24. Guangqi, A.; Yan, Z.; Haifeng, Z. Blind pixel detection and compensation on infrared detector. Aero Weapon. 2016, 3, 54–58. [Google Scholar]
  25. Wang, B.; Liu, S.; Li, Q.; Lei, R. Blind-pixel correction algorithm for an infrared focal plane array based on moving-scene analysis. Opt. Eng. 2006, 45, 036401. [Google Scholar] [CrossRef]
  26. Donnelly, V.M.; Kornblit, A. Plasma etching: Yesterday, today, and tomorrow. J. Vac. Sci. Technol. Vac. Surf. Film. 2013, 31, 050825. [Google Scholar] [CrossRef] [Green Version]
  27. Arthur, J.R. Molecular beam epitaxy. Surf. Sci. 2002, 500, 189–217. [Google Scholar] [CrossRef]
  28. Lee, J.; Devre, M.; Reelfs, B.; Johnson, D.; Sasserath, J.; Clayton, F.; Hays, D.; Pearton, S. Advanced selective dry etching of GaAs/AlGaAs in high density inductively coupled plasmas. J. Vac. Sci. Technol. A Vac. Surf. Film. 2000, 18, 1220–1224. [Google Scholar] [CrossRef]
  29. He, M.; Chen, Z.; Qi, G. Solid state interfacial reaction of Sn–37Pb and Sn–3.5 Ag solders with Ni–P under bump metallization. Acta Mater. 2004, 52, 2047–2056. [Google Scholar] [CrossRef]
  30. Johnson, J.F. Direct Injection Readout Circuit Model. In Infrared Readout Electronics II; Fossum, E.R., Ed.; SPIE: Bellingham, WA, USA, 1994; pp. 120–129. [Google Scholar]
  31. Wang, T.T.; Wang, L.B.; Zhang, M.C.; Sun, C.; Deng, P.; Cheng, C.; Yu, B.; Pan, Q. Design and performance of the Gauder Infrared RS058 rotating Stirling cooler. Infrared Technol. 2016, 38, 990–995. [Google Scholar]
  32. Akselrod, M.S.; Bruni, F.J. Modern trends in crystal growth and new applications of sapphire. J. Cryst. Growth 2012, 360, 134–145. [Google Scholar] [CrossRef]
  33. Tang, M.; Zhu, W.; Zou, H.; Zu, G.; Han, Y.; Ran, X. High strength and high light transmittance sapphire/sapphire joints bonded using a La2O3-Al2O3-SiO2 glass filler. J. Eur. Ceram. Soc. 2022, 42, 4607–4615. [Google Scholar] [CrossRef]
  34. Li, C.L.; Lin, C.; Chen, X.W.; Ding, X.Z.; Wang, J.Y. A satellite-borne long-wave infrared focal plane imaging system. Infrared Laser Eng. 2012, 41, 2253–2260. [Google Scholar]
  35. Hachem, H.; Gheith, R.; Aloui, F.; Nasrallah, S.B. Technological challenges and optimization efforts of the Stirling machine: A review. Energy Convers. Manag. 2018, 171, 1365–1387. [Google Scholar] [CrossRef]
  36. Gavin, H.P. The Levenberg-Marquardt Algorithm for Nonlinear Least Squares Curve-Fitting Problems; Department of Civil and Environmental Engineering, Duke University: Tulane, NC, USA, 2019; p. 19. [Google Scholar]
  37. Marri, V.D. RNN-based multispectral satellite image processing for remote sensing applications. Int. J. Pervasive Comput. Commun. 2021, 17, 583–595. [Google Scholar] [CrossRef]
  38. Abdi, H. The method of least squares. Encycl. Meas. Stat. 2007, 1, 530–532. [Google Scholar]
  39. Dhruv, P.; Naskar, S. Image Classification Using Convolutional Neural Network (CNN) and Recurrent Neural Network (RNN): A Review. In Machine Learning and Information Processing; Springer: Singapore, 2020; pp. 367–381. [Google Scholar]
  40. Wolfe, W.L. Introduction to Infrared System Design; SPIE Press: Tucson, AR, USA, 1996; Volume 24. [Google Scholar]
Figure 1. Schematic diagram of the dark current noise correction model.
Applsci 12 12967 g001
Figure 2. The cross-sectional figure of the QWIP.
Applsci 12 12967 g002
Figure 3. Fabrication of QWIP with dark pixels; (a) QWIP with dark pixels; (b) design schematic of QWIP with dark pixels.
Applsci 12 12967 g003
Figure 4. LWIR QWIP detection system.
Applsci 12 12967 g004
Figure 5. Source composition of the radiation received by two pixel types.
Applsci 12 12967 g005
Figure 6. Model of feature data built using RNN.
Applsci 12 12967 g006
Figure 7. Radiometric calibration curves of imaging pixels and dark pixels.
Applsci 12 12967 g007
Figure 8. Position of the selected pixels.
Applsci 12 12967 g008
Figure 9. Characteristic data collection experiment: (a) device for collecting characteristic data; (b) characteristic data of dark pixels and imaging pixels.
Applsci 12 12967 g009
Figure 10. Comparison of predicted and actual dark level correction values.
Applsci 12 12967 g010
Figure 11. Response before and after correction of imaging pixels.
Applsci 12 12967 g011
Table 1. The QWIP’s primary parameters.
Detector ParametersParameter Values
Array size320 × 256
Pitch/um30
f-number2.0
Peak wavelength/um10.5
Response bandwidth/um≥1.0
Blind pixel rate0.75%
Noise-Equivalent Temperature Difference/mK34.5
Non-uniformity4.35%
Cooling temperature/K50
Frame rate/Hz20
Table 2. Correction effect of imaged pixels.
Pixel Coordinates/(i, j)Temporal Noise Before CorrectionTemporal Noise After CorrectionNoise Reduction Ratio
Center(159, 112)4.052.0250.37%
(151, 120)3.942.0148.98%
(157, 139)3.922.0547.70%
(160, 128)4.212.1050.11%
Edge(3, 71)4.132.1148.91%
(158, 2)3.982.0348.99%
(320, 202)4.322.1250.93%
(162, 221)4.012.0349.38%
Other(186, 53)4.422.1750.90%
(51, 125)3.962.0149.24%
(261, 67)3.832.1045.17%
(190, 124)4.182.0251.67%
(255, 176)4.082.1148.28%
(82, 190)4.082.0450.00%
(134, 150)4.192.1748.21%
(221, 87)4.602.4047.83%
Table 3. Calibration effect at different target temperatures.
Temperature of
the Target/k
296298300305
Noise Reduction Ratio48.82%49.17%49.30%48.79%
Publisher’s Note: MDPI stays neutral with regard to jurisdictional claims in published maps and institutional affiliations.

