Abstract
Plastic materials can absorb moisture from the atmosphere even after drying. This absorbed moisture can cause many defects in the molding process. Conventionally, a dryer is used to reduce the moisture content. However, the use of a drying unit involves huge daily power consumption and is also time-consuming. Therefore, this study proposed a new method to reduce the impact of moisture on molded product part quality through the optimization of plasticization parameters while reducing drying time. Two plastic materials, polyurethane (TPU) and polycarbonate (PC), were used for the experimental verification. Key plasticization parameters, including back pressure, screw rotation speed, and barrel temperature were chosen; their influence was investigated by the design of experiments (DOE). Moisture-induced defects, such as air bubble area, part surface gloss, and appearance were measured and correlated with the plasticization parameters. It was found, after optimization via a three-level DOE and factorial design multivariate statistical analysis using TPU, that the gloss (GU) of the PC part without drying was very close to that (98.4 GU) of the fully dried PC. The proposed methodology may help molders to improve production efficiency and achieve cost savings.
1. Introduction
The traditional injection molding manufacturing process is still the mainstream processing method in the plastics industry due to its low processing cost, fast production speed, large production volume, and formable products with complex shapes.
The molding principle is to plasticize plastic pellet particles, transforming the raw materials into a molten state by the action of external heat and the sheer heat generated by screw rotation. The molten polymer is injected into a pre-designed mold cavity through screw advancement and molded into the shape of the mold design. The output product quality [1] is a function of the processing conditions, melt quality, material property, mold design, and machine parameter setting; any changes in the above will deliver a defective product with short shot, flash, air bubbles, silver streaks, warpage, shrinkage, etc.
In an injection molding process, factors [2] that affect the final quality of the product include the quality of the plastic pellets, the injection speed, the injection pressure, the packing pressure [3], the melt temperature, and the mold temperature. Among the many variable factors, plastic pellets determine the mechanical properties of the product [4].
Most plastics can absorb moisture from the air before production. This ability is influenced by the type of plastic material used, environmental conditions, drying temperature and time, and so on. Hygroscopic materials [5] such as polyurethane, acrylonitrile butadiene styrene, polycarbonate, and others, can absorb moisture even after drying when exposed to the atmosphere. If the plastic pellets contain moisture even after drying, the absorbed moisture will cause many difficulties in the molding and processing of the product part. Furthermore, the internal quality [6] of plastic products will significantly deteriorate, resulting in polymer degradation [7]; product quality is reflected in the appearance of silver streaks [8], scorch marks, air bubbles, and poor surface finish, and a decrease in product surface transparency [9] that can be observed with the naked eye. Consequently, the effect of moisture produces additional plastic waste in an injection molding process, affecting the sustainability of the production process. Research scholars have conducted studies to improve the surface quality. For example, Heinzler [10] proposed a method to compensate for the influence of moisture content in plastic pellets on molded parts quality by combining the pressure controller with a switching point and feedback control of the injection pressure during the injection stage. Dong G and Zhao G [11] “investigated the morphology evolution and elimination mechanism of bubble marks on the surface of microcellular injection-molded parts with dynamic mold temperature control”. Dyi-Cheng Chen and Tse-Hsi Chen [12] explored the effect of gate design on the surface finish of thin-film components according to process parameter injection pressure and injection rate. These methods help to improve the surface finish of product parts and reduce the appearance of air bubbles in the final product part. However, these studies did not determine the effect on injection molding parameters of moisture content or propose a method to regulate the generation of air bubbles in the plasticization stage in an injection molding process.
The materials are affected by moisture factors, so it is necessary to use a dryer to reduce the moisture content in the material to ensure consistency in the process and product quality. However, using a traditional 50 kg drying machine with a daily power consumption of 4.5 kilowatt hours and a required drying time of 2 to 4 h before production, the accumulated power consumption is very great. In large-scale plastic molding processing plants, a larger number of dryer machines are required to cooperate with each other to maintain an uninterrupted supply of production materials. Moreover, high electricity consumption not only does not meet green production standards, but also increases the company’s economic expenditure on dryer machine purchases. Therefore, the objective of this study is to investigate the influence of plasticization parameters on moisture content and to assess if the moisture in the pellets can be removed directly during the plasticizing stage; this will enable reduction in the drying time, avoid possible problems with absorbed moisture, and power-saving to achieve green production standards.
In injection molding, the maximum allowable moisture content is typically low [13], which can be adjusted based on material properties. If the pellet has an excessive moisture content, then some plastic materials will react with the water vapor at high temperature, and air bubbles will be generated [14] by mixing with the molten material during the plasticization process. These air bubbles are injected into the mold cavity during the injection phase, resulting in an air bubble defect in the output product part as nearby air bubbles fuse together to form one big bubble form. The size and number of air bubbles that appear in the final product part vary throughout the process based on the melt temperature, screw rotation rate, melt pressure, and melt state of the melt resin. D.V. Rosato and Marlene G. Rosato [15] proposed that surface defects, such as splay marks and silver streaks, are most often caused by bubbles in the melt coming from moisture, trapped air, etc. They suggest that appearance properties are heavily influenced by the plasticization variables of screw rotation, back pressure, and melt temperature and suggest that higher screw rotation and melt temperature cause more bubble formation since the melt is less viscous, while M. Joseph Gordon [16] suggested that back pressure removes trapped air, gases, and moisture from the pellet. All these exemplify that the generation of air bubbles, splay marks, and silver streaks, due to material moisture, is heavily influenced by the plasticization variables, melt quality, and melt temperature. According to Amano and Utsugi [17], plasticization melt quality and melt temperature is determined by the processing operating conditions, such as screw speed rotation, barrel temperature, barrel resident time, and the effect of shear heating and heat absorption rate on the molten resin. Dontula [18] successfully assessed the impact of screw speed, back pressure, and injection stroke on melt temperature distribution using infrared sensors. Similarly, Jian-Yu Chen [19] assessed the online quality monitoring of melt resin variation by placing a pressure sensor on the load cell, nozzle, and mold cavity and by attaching four strain gauges on the tie bars of the machine. He repeated the experiment with different back pressure, barrel temperature, and screw speed rotation level, and assessed pressure, viscosity, and energy quality indexes. Many of these studies indicate that variation in melt temperature and melt quality at the plasticization stage is heavily dependent on the effect of screw rotation, back pressure, and melt temperature. Furthermore, the melt temperature and melt quality of the polymer plays a key role in the generation of bubbles in the injection molding plasticization process. Thus, the effects of plasticization variables, the impact of material moisture content, and resin melt state quality are inextricably linked with each other and an experimental study is required to analyze the output response.
For this purpose, factorial design analysis has proven to be an effective, reliable, and cost-effective solution in investigating the effect of each parameter variable with the influence of moisture content on the output response. Factorial designs [20] are experimental studies that use more than one independent variable to study the effect on the output response. The factorial design of the experiment (DOE) table provides a very simple way to run an experiment with multiple factors and levels in an effective manner to analyze the output response with multivariate statistics. When it is essential to define which factor is statistically significant for an output response, a factorial design approach is frequently used [21]. In this study, the hygroscopic material used to conduct the experiments was thermoplastic polyurethane. Thermoplastic polyurethane (TPU) [22] is a class of thermoplastic elastomers that have the material properties of both plastic and rubber. Because of their excellent tensile strength, high elongation at break, and good load-bearing capacity, TPU has been found useful in a wide range of indoor, outdoor, underwater, and biomedical applications. It also has exceptional mechanical, physical, and chemical properties, as well as biocompatibility. Moreover, the hydrolysis resistance property [23] of TPU helps to identify the most significant plasticization parameters. By comparison, the appearance of splay marks, silver streaks, etc., due to material moisture, is most often found to occur with transparent hygroscopic polycarbonate material.
2. Methodology
The purpose of this research is to reduce the impact of moisture on molded product parts through optimization of plasticization parameters, and to reduce the drying time required for the material by changing the plasticization parameters. Therefore, the overall experiment is essentially divided into three parts.
The first part investigates the significant plasticization parameters and their impact on hygroscopic material with moisture content using a factorial design multivariate statistical analysis. The second part involves discussion of the effect and influence of the plasticization parameters, back pressure, screw rotation, and barrel temperature, with material moisture content, on the appearance of surface defects in the final product part. The optimized plasticization parameters are, thus, defined by measuring the glossiness properties and through visual observation of the product part surface quality. The third part evaluates the impact of these plasticization parameters with different moisture content; the experimental plasticization parameter combinations associated with the most improved conditions of the second part of the experimental results are used to conduct the experiment with different drying times. By measuring the glossiness properties and by visual observation of the product part, whether the plasticization parameters can be improved to achieve the purpose of shortening the drying time is assessed.
3. Materials and Methods
Thermoplastic polyurethane (TPU) and polycarbonate (PC) materials were selected to conduct the experiment. Hydrolysis-resistant TPU was used in the first instance to check the correlation of the existing air bubble formation visually with plasticization parameters and PC was then used to conduct a three-level DOE for optimization verification and to examine the surface gloss of the molded parts as further verification.
3.1. First Part: Factorial Design Multivariate Statistical Analysis
BASF polyurethane Elastollan, Grade 1185, thermoplastic polyurethane (TPU), hygroscopic, hydrolysis resistant, and transparent material was used to conduct this experiment. The material was exposed to open air for 24 h to absorb atmospheric moisture. Plastic injection molding experiments were conducted on a Victor—VS100 injection molding machine (IMM) using the thermoplastic polyurethane (TPU), The effect of moisture content on the melted polymer was assessed by the formation of air bubbles in the product part. In this experiment, three plasticization factors (variables), screw rpm, barrel temperature, and back pressure, with two-levels, were used, as shown in Table 1.

Table 1.
Injection Molding Parameters and their Levels.
The molding parameter feasible space was defined by varying the injection screw rpm from 75 to 125 rpm, the melting barrel temperature from 180 °C to 220 °C, and the back pressure from 2 to 6 Bar. These ranges were chosen from material processing technical data sheets, experimental observation, and plastics injection molding handbooks. Table 2 shows the experimental parameter settings.
Table 2.
Experimental Parameter Settings.
In this experiment, the parameters and levels from a 2 × 2 × 2 full factorial DOE (Table 3) was used to design the experiment to study the output response of air bubble formation in the final product.
Table 3.
Full factorial 2 × 2 × 2 DOE.
Experiment runs were conducted in sequential order as specified in the experiment plan, DOE (Table 3), where each row of the table represents a combination of different parameters with their levels. To ensure consistency, the samples were taken after every ten repeated runs for each row combination run. Thermoplastic polyurethane material with moisture content was used to perform the experiment.
There were two outcome variables to investigate: (1) the air bubble area size, and (2) the number of air bubbles that appeared in a product part. To effectively conduct the statistical response study and to understand the interaction and significance of moisture content on each factor with the output variables bubble area and number, the experimental runs DOE was replicated five times in sequential order, making a total of 40 runs.
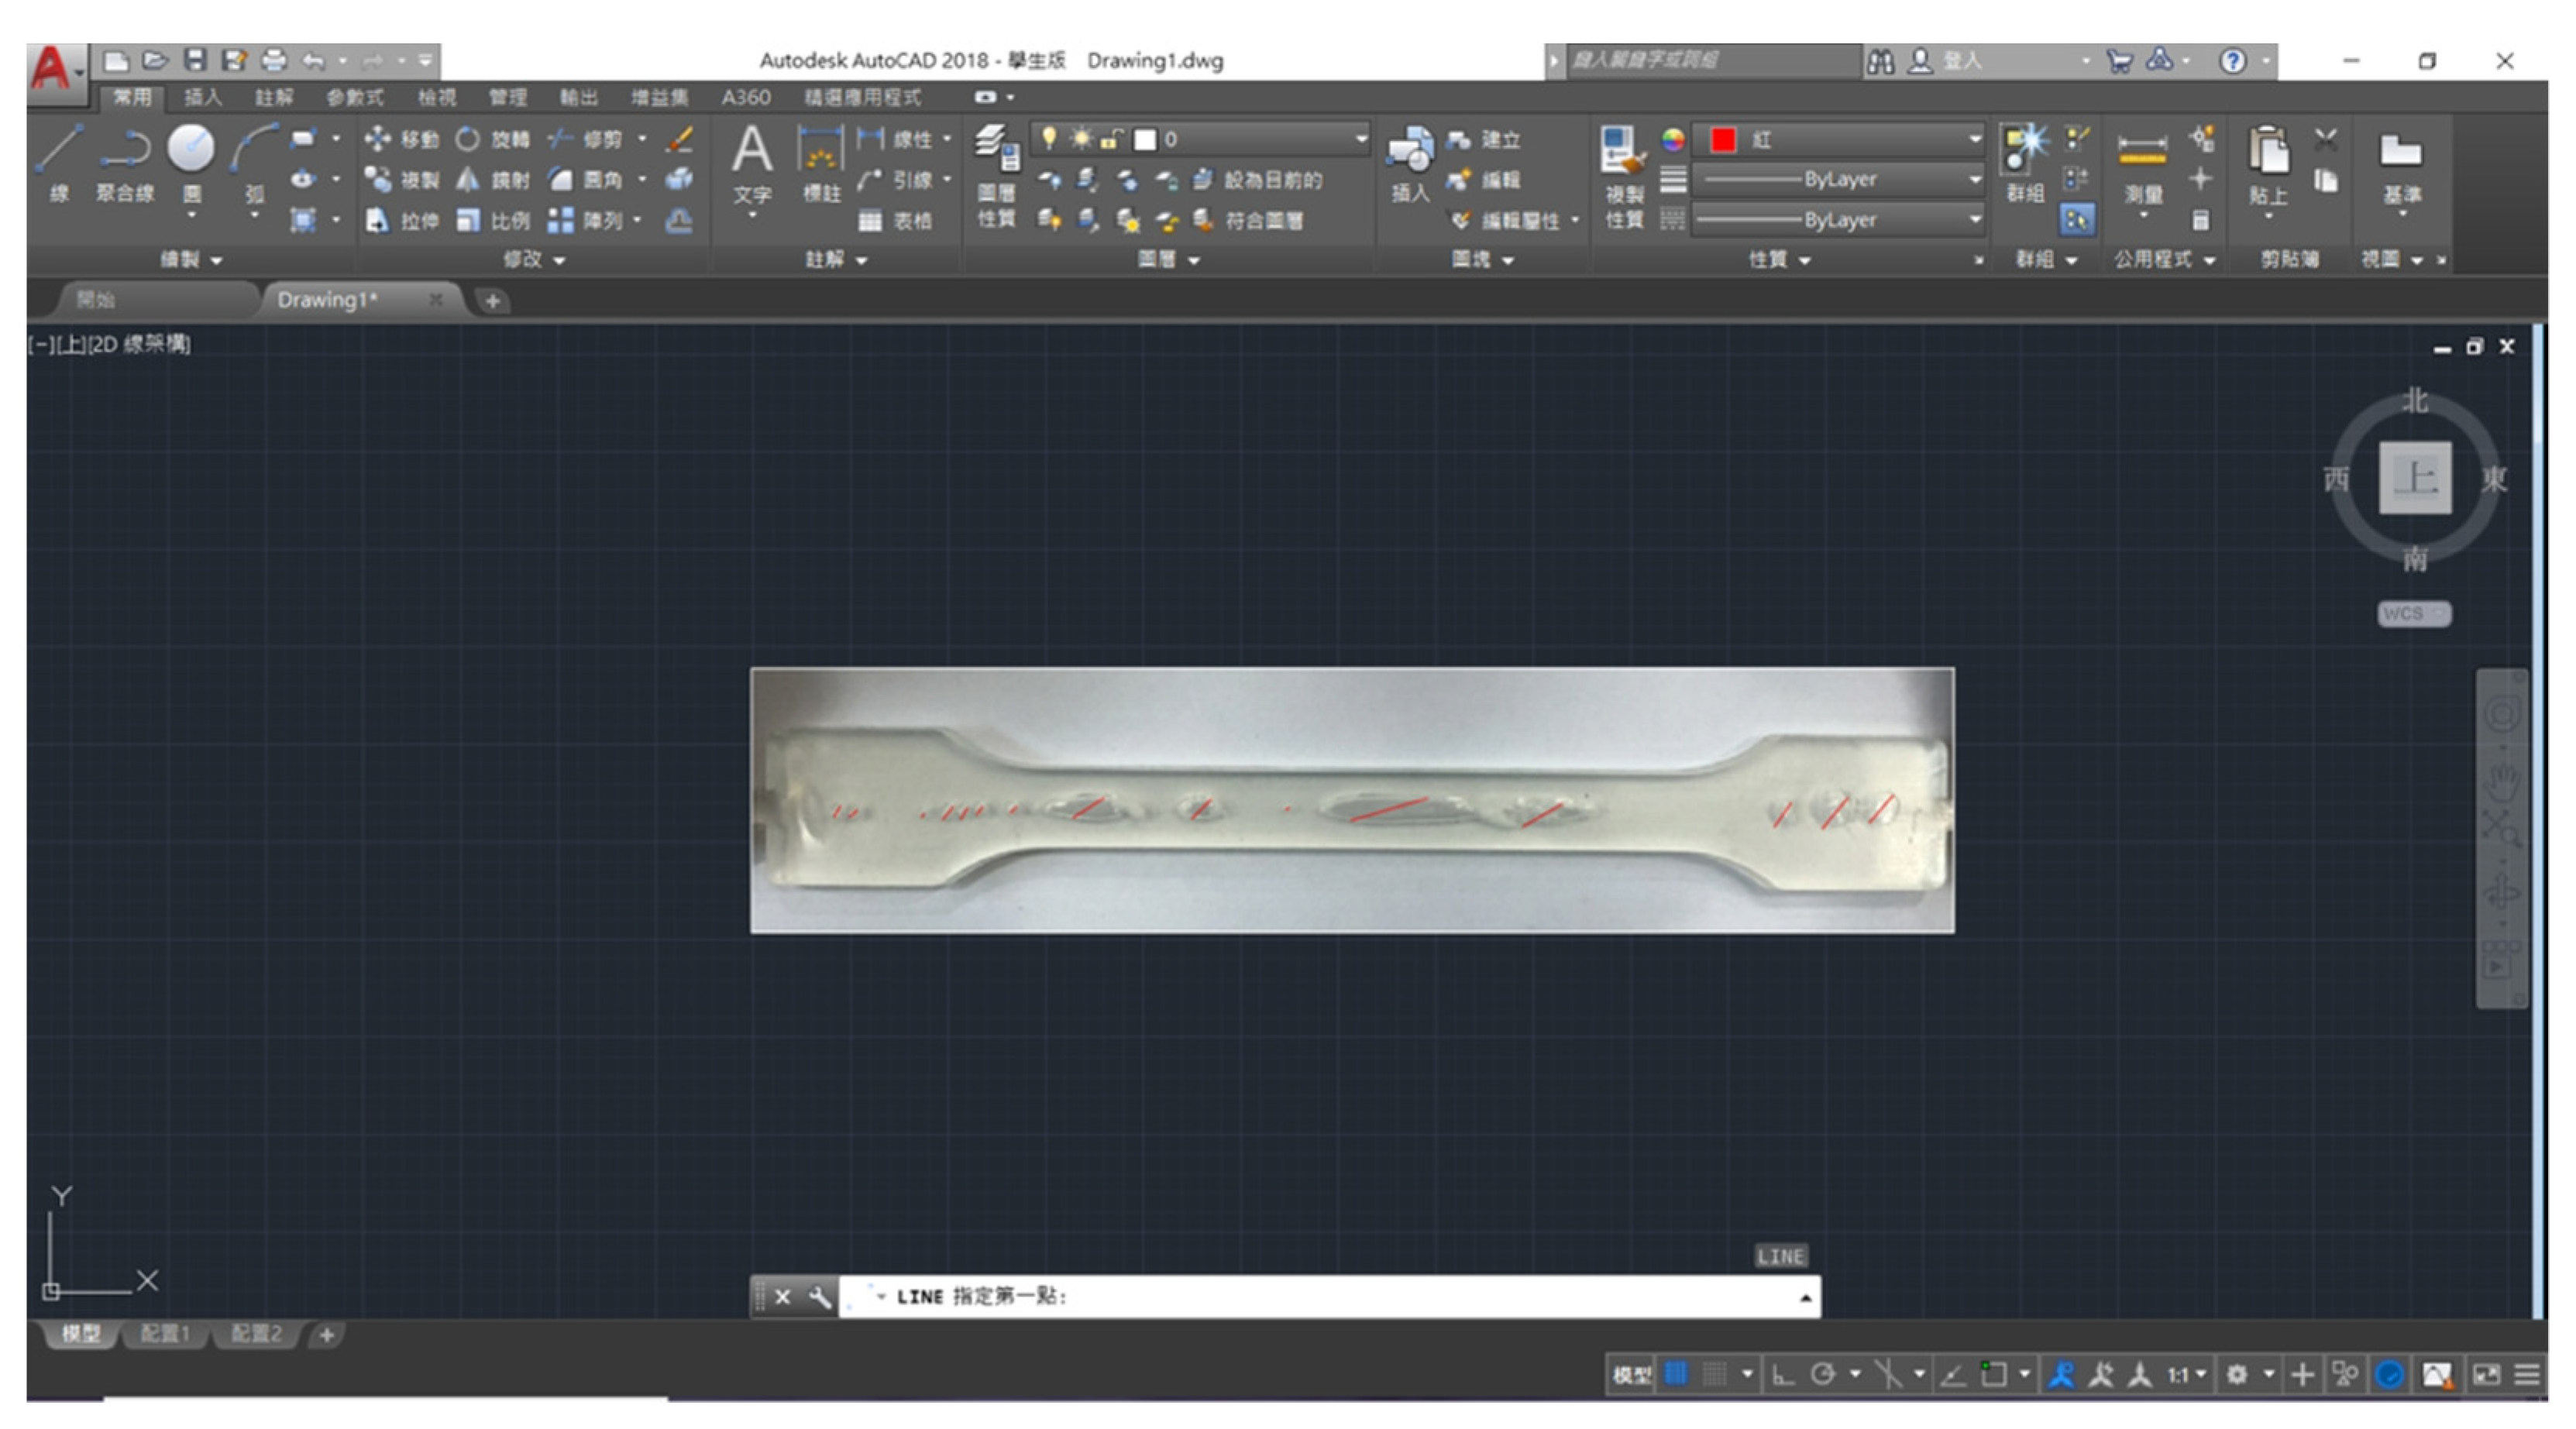
The air bubble-area measurement was conducted with the help of AutoCAD software, as shown in Figure 1. The product part image files were saved in a folder with their experiment run numbers. For this, each of the experimental run images was imported into the AutoCAD workspace, as shown in Figure 1. Figure 2 shows the method adopted to represent the measured area in an Excel sheet, in which each of the air bubble areas was marked using the AutoCAD extraction tool, as shown in Figure 2a, to calculate the overall air bubble area in mm2. The measured air bubble areas were saved in an Excel sheet with their experiment run numbers.
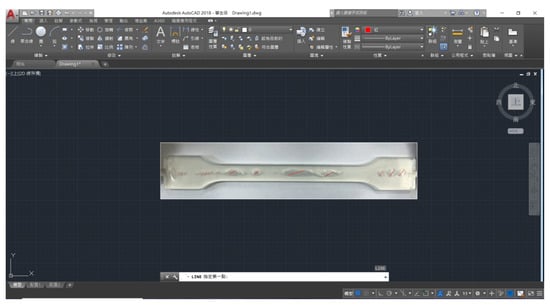
Figure 1.
Air bubble-area measurement using AutoCAD software.
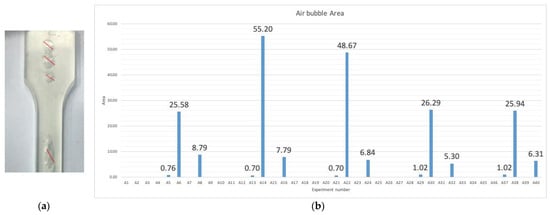
Figure 2.
Air bubble area measurement using AutoCAD extraction tool. (a) Air bubble area measurement in mm2, (b) Experiment run number versus measured air bubble area.
The output response figures show that for a few experimental runs, the air bubble defect appeared, and for the rest of the experimental runs, parameter factor combinations and levels were good enough to produce product parts without any air bubble defects. From this, we can assert that some parameter factor combinations and levels have a significant effect on the moisture content. To determine the influence of moisture content with the parameter factors and levels, the measured output response values for air bubble area and air bubble number were copied into Minitab software to analyze the output response with multivariate statistics. This software was used for factorial regression analysis on the measured output response value and to estimate the interaction and main effect strength associated with the output response.
3.2. Second Part: The Influence of Plasticization Parameters with Moisture Content
This part of the experiment was conducted using the polycarbonate, WONDERLITE® PC-110 produced by the CHIMEI corporation. The moisture content of the newly opened undried PC materials was found to be 1700 ppm. To reduce the moisture content of the material to 600 ppm the material was dried at 120 °C with a drying time of 2 h. Material with 600 ppm moisture was used to run the experimental group DOE. The moisture content of the material was measured using the moisture analyzer HC103 produced by Mettler Toledo. The detection method complied with the ASTM D570 standard test method for plastic water absorption. The injection molding machine used in this research was an oil-electric mixer, model HSP100EH2, a direct pressure injection molding machine produced by the Japan Sodick Company. The machine parameter settings of the injection molding machine parameter settings are shown in Table 4. Table 5 shows the plasticization parameter table of the second stage experimental group.
Table 4.
Injection molding machine (HSP100EH2) parameter settings.
Table 5.
Plasticization parameter table of the second stage experimental group.
This part of the experiment investigated the influence of the plasticization parameter back pressure, screw rotation, and barrel temperature on the appearance of moisture defects, such as silver marks, air bubbles, etc., to determine the optimized plasticization parameters to reduce the impact of moisture defects and the drying time of the hygroscopic material. Therefore, polycarbonate hygroscopic material (PC-110) with moisture content was used to perform this experimental component.
Material with a moisture content of 600 ppm was molded with an injection speed of 20 mm/s, with sufficient pressure holding time to ensure that the molded product was filled without short shots. Three plasticization parameters, back pressure, barrel temperature, and screw speed, with three-levels, were used to perform the experiment to study the effect of these parameters on the appearance of moisture defects, such as silver marks, air bubbles, etc., in the transparent final product part. These plasticization parameter settings were divided into: back pressure 5 MPa, 10 MPa, and 15 MPa; barrel temperature 280 °C, 300 °C, and 320 °C; screw speeds of 50 rpm, 100 rpm, and 150 rpm. The parameters were applied in all possible combinations; the plasticization combination experiment was carried out under the conditions shown in Table 5.
Experiment runs were conducted in sequential order as specified in the experiment plan DOE (Table 6), where each row of the table represents a combination of different parameters with their levels. To ensure consistency the samples were taken after every ten repeated runs for each row combination run. Due to the non-crystalline nature of polycarbonate, the material has a high degree of transparency; therefore, with the change in the plasticization combination, the moisture defects, such as silver marks, air bubbles, etc., were found to appear in the final product part. The surface gloss of the sample changed due to the moisture defects. To measure the glossiness of the surface of the part sample, a gloss meter (BYK MICRO-TRI-GLOSS 4333) was used to measure the glossiness at angles of 60 and 85 degrees. The product part weight was also measured and these measured values and product part images were saved with experiment numbers to assess the effect of plasticization parameters in different combinations. The samples were assessed in terms of surface glossiness proportion, visual observation of the moisture defects, and the standard deviation of the product molding weight. This process enabled determination of the most suitable plasticization parameter combination for improvement and reduction in moisture surface defects, and selection of the optimal combination for plasticization in subsequent experiments.
Table 6.
Second stage experimental group design of experiments (DOE).
3.3. Third Part: Comparison of Product Part Forming under Different Moisture Content
This part of the experiment was mainly to investigate the potential for reducing the drying time, by determining the optimized plasticization parameter settings to reduce the product part surface moisture defects. The experimental materials were the same batch of newly opened, undried PC materials. The plasticization parameter combination experiment was carried out under the conditions shown in Table 7. The PC material was subject to a drying time of 4 h until the moisture content was 100 ppm, defined as the B1 parameter group. Similarly, the polycarbonate material subject to 2 h of drying time, with a moisture content of 600 ppm, was defined as parameter group B2. The plasticization parameters (e.g., barrel temperature, back pressure, screw speed) used in the B3 group were the optimized parameters obtained from the previous experiment observation (”Section 4.2”); that is, when the product was at the barrel temperature of 280 °C, the back pressure was 15 MPa, and the screw rotation was 50 rpm, this was defined as the B3 plasticization parameter group. Experiment runs were conducted with the parameter combinations as specified in Table 7. To ensure consistency the samples were taken after every ten repeated runs for each row combination run. The sample part surface glossiness was measured at angles of 60 and 85 degrees to compare the surface gloss of the products.
Table 7.
Plasticization parameter table of the third stage experimental group.
4. Results and Discussion
4.1. First Part: Factorial Design Multivariate Statistical Analysis
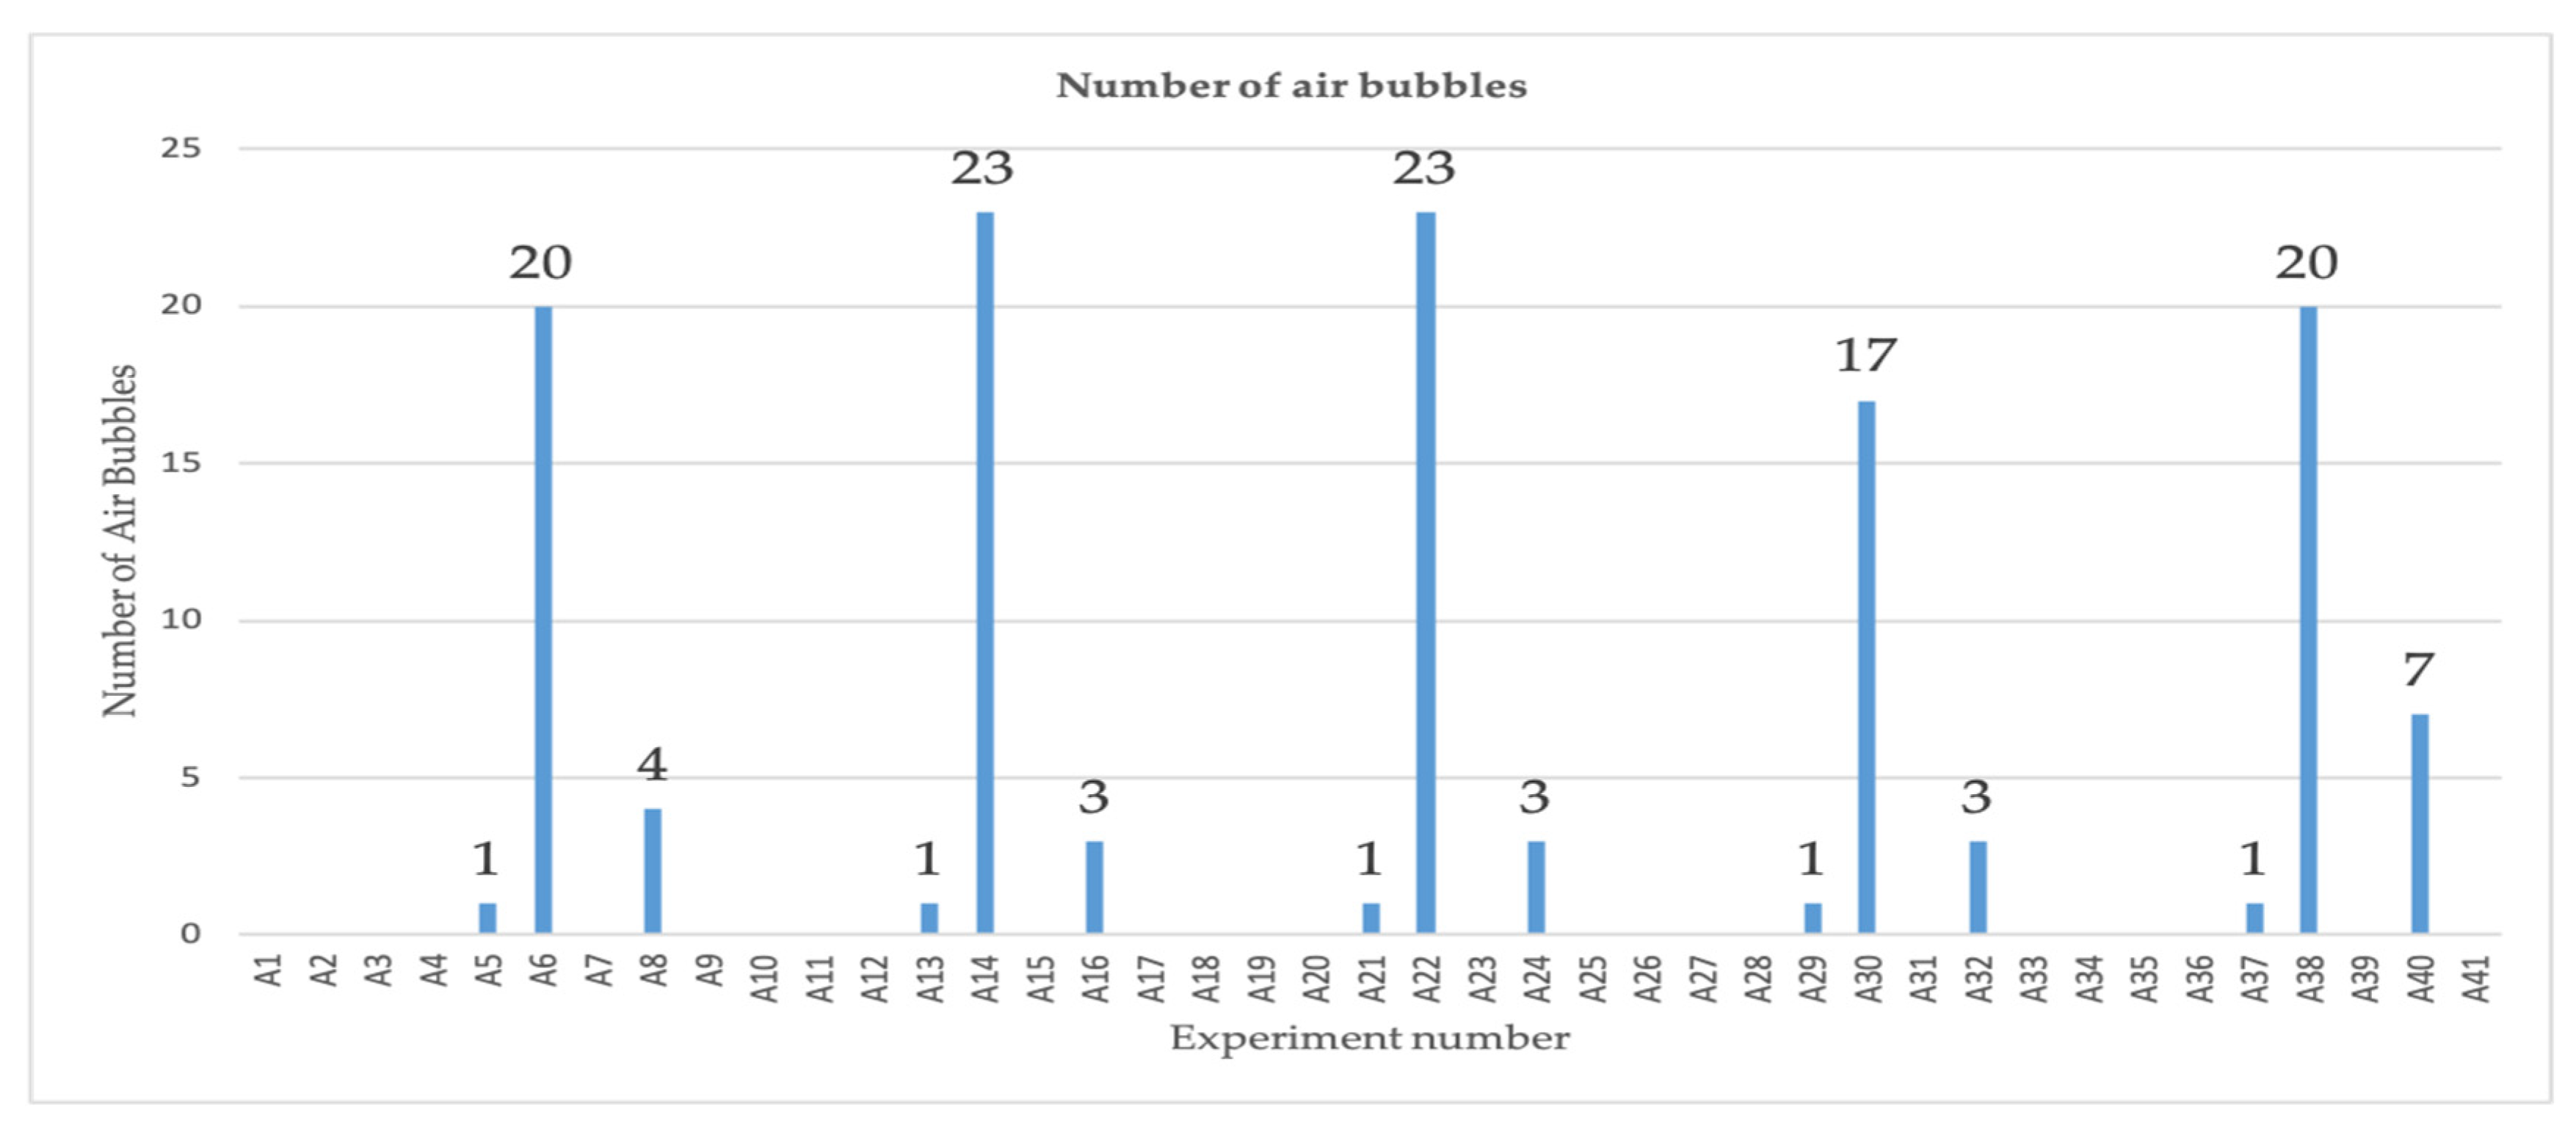
The effect of the plasticization parameters, screw rpm, barrel temperature, and back pressure, with moisture effect, are shown in Figure 2b and Figure 3. Figure 2b shows the experiment run number versus measured air bubble area. The number of visible air bubbles in the product part was counted and saved in an Excel sheet. Figure 3 shows the experiment run number versus counted air bubble number.
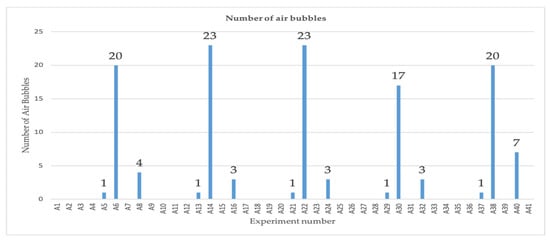
Figure 3.
Experiment run number versus counted air bubble number.
The experiment run versus measured value figure shows that for a few experimental runs, the air bubble defect appeared, and for the remainder of the experimental runs, parameter factor combinations and levels were good enough to produce product parts without any air bubble defects. From this, we can assert that some parameter factor combinations and levels have a significant effect on the moisture content. To find out the influence of moisture content with the parameter factor and levels, the measured output response values of air bubble area and air bubble numbers were copied into Minitab software to analyze the output response with multivariate statistics. This software was used for factorial regression analysis on the measured output response value and to estimate the interaction and main effect strength with the output response. From Figure 2b and Figure 3, it was observed that for a few of the experimental runs, the two output responses, the number of air bubbles and the air bubble area, seemed to increase, which shows that there was a strong correlation between the air bubble area and the number of air bubbles that appeared. The output response variables were generated during the plasticization process, and it appeared that the plasticization parameter factor levels in the experimental run played a key role in determining and controlling the air bubble defect in the final product part. As a result, we can say that the parameter factor levels can be used to control air bubble defects because the rest of the machine parameter settings were constant variables, as shown in Table 2.
4.1.1. Pareto Chart—Student’s t-Test Analysis
The Pareto chart shown in Figure 4 illustrates the relative importance of the main factors and their interaction effects with the output response. The Student’s t-test was used to determine whether the measured effects were statistically different from zero. The values for each factor effect are represented by horizontal columns in the Pareto chart. The t value for a 95 percent confidence level is 2.037. The red vertical line on the Pareto chart represents the minimum statistically significant effect magnitude at a 95% confidence level. From the standardized effect Pareto chart, it can be seen that all the main factors, such as, the melt temperature, screw speed, and back pressure and their interaction, cross the red dotted lines. From this, it is clear that all the main factors and their interactions were significant at the 95% confidential interval (α = 0.05). Therefore, we cannot exclude any of these factors, and we need to consider all the main factors and their interaction to evaluate the effect on air bubble generation.
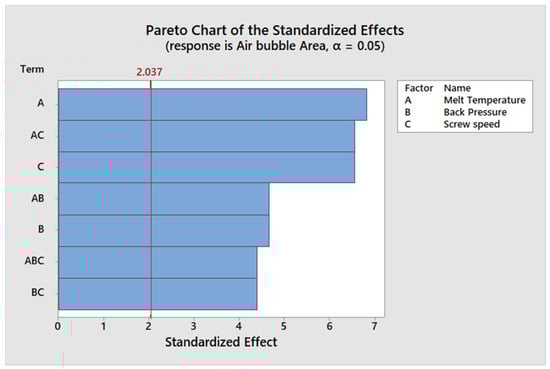
Figure 4.
Main factors and their interaction effects with the output response.
4.1.2. Factor Regression Analysis
By analyzing the factor regression (Table 8), the coefficient column shows the magnitude value of all the factors and their interactions, which denotes the effect strength of these factors on the air bubble defect or in the formation of the air bubble area. Among these factors, the strongest effect was contributed by the interaction factor combination of melt temperature*screw speed at levels of 180 °C and 30% with a magnitude value of 3428, followed by the main factor back pressure at the level of 2 bar, and finally by the combined interaction of melt temperature*back pressure*screw speed with variable values of 180 °C, 2 bar, and 30%.
Table 8.
Factor regression analysis.
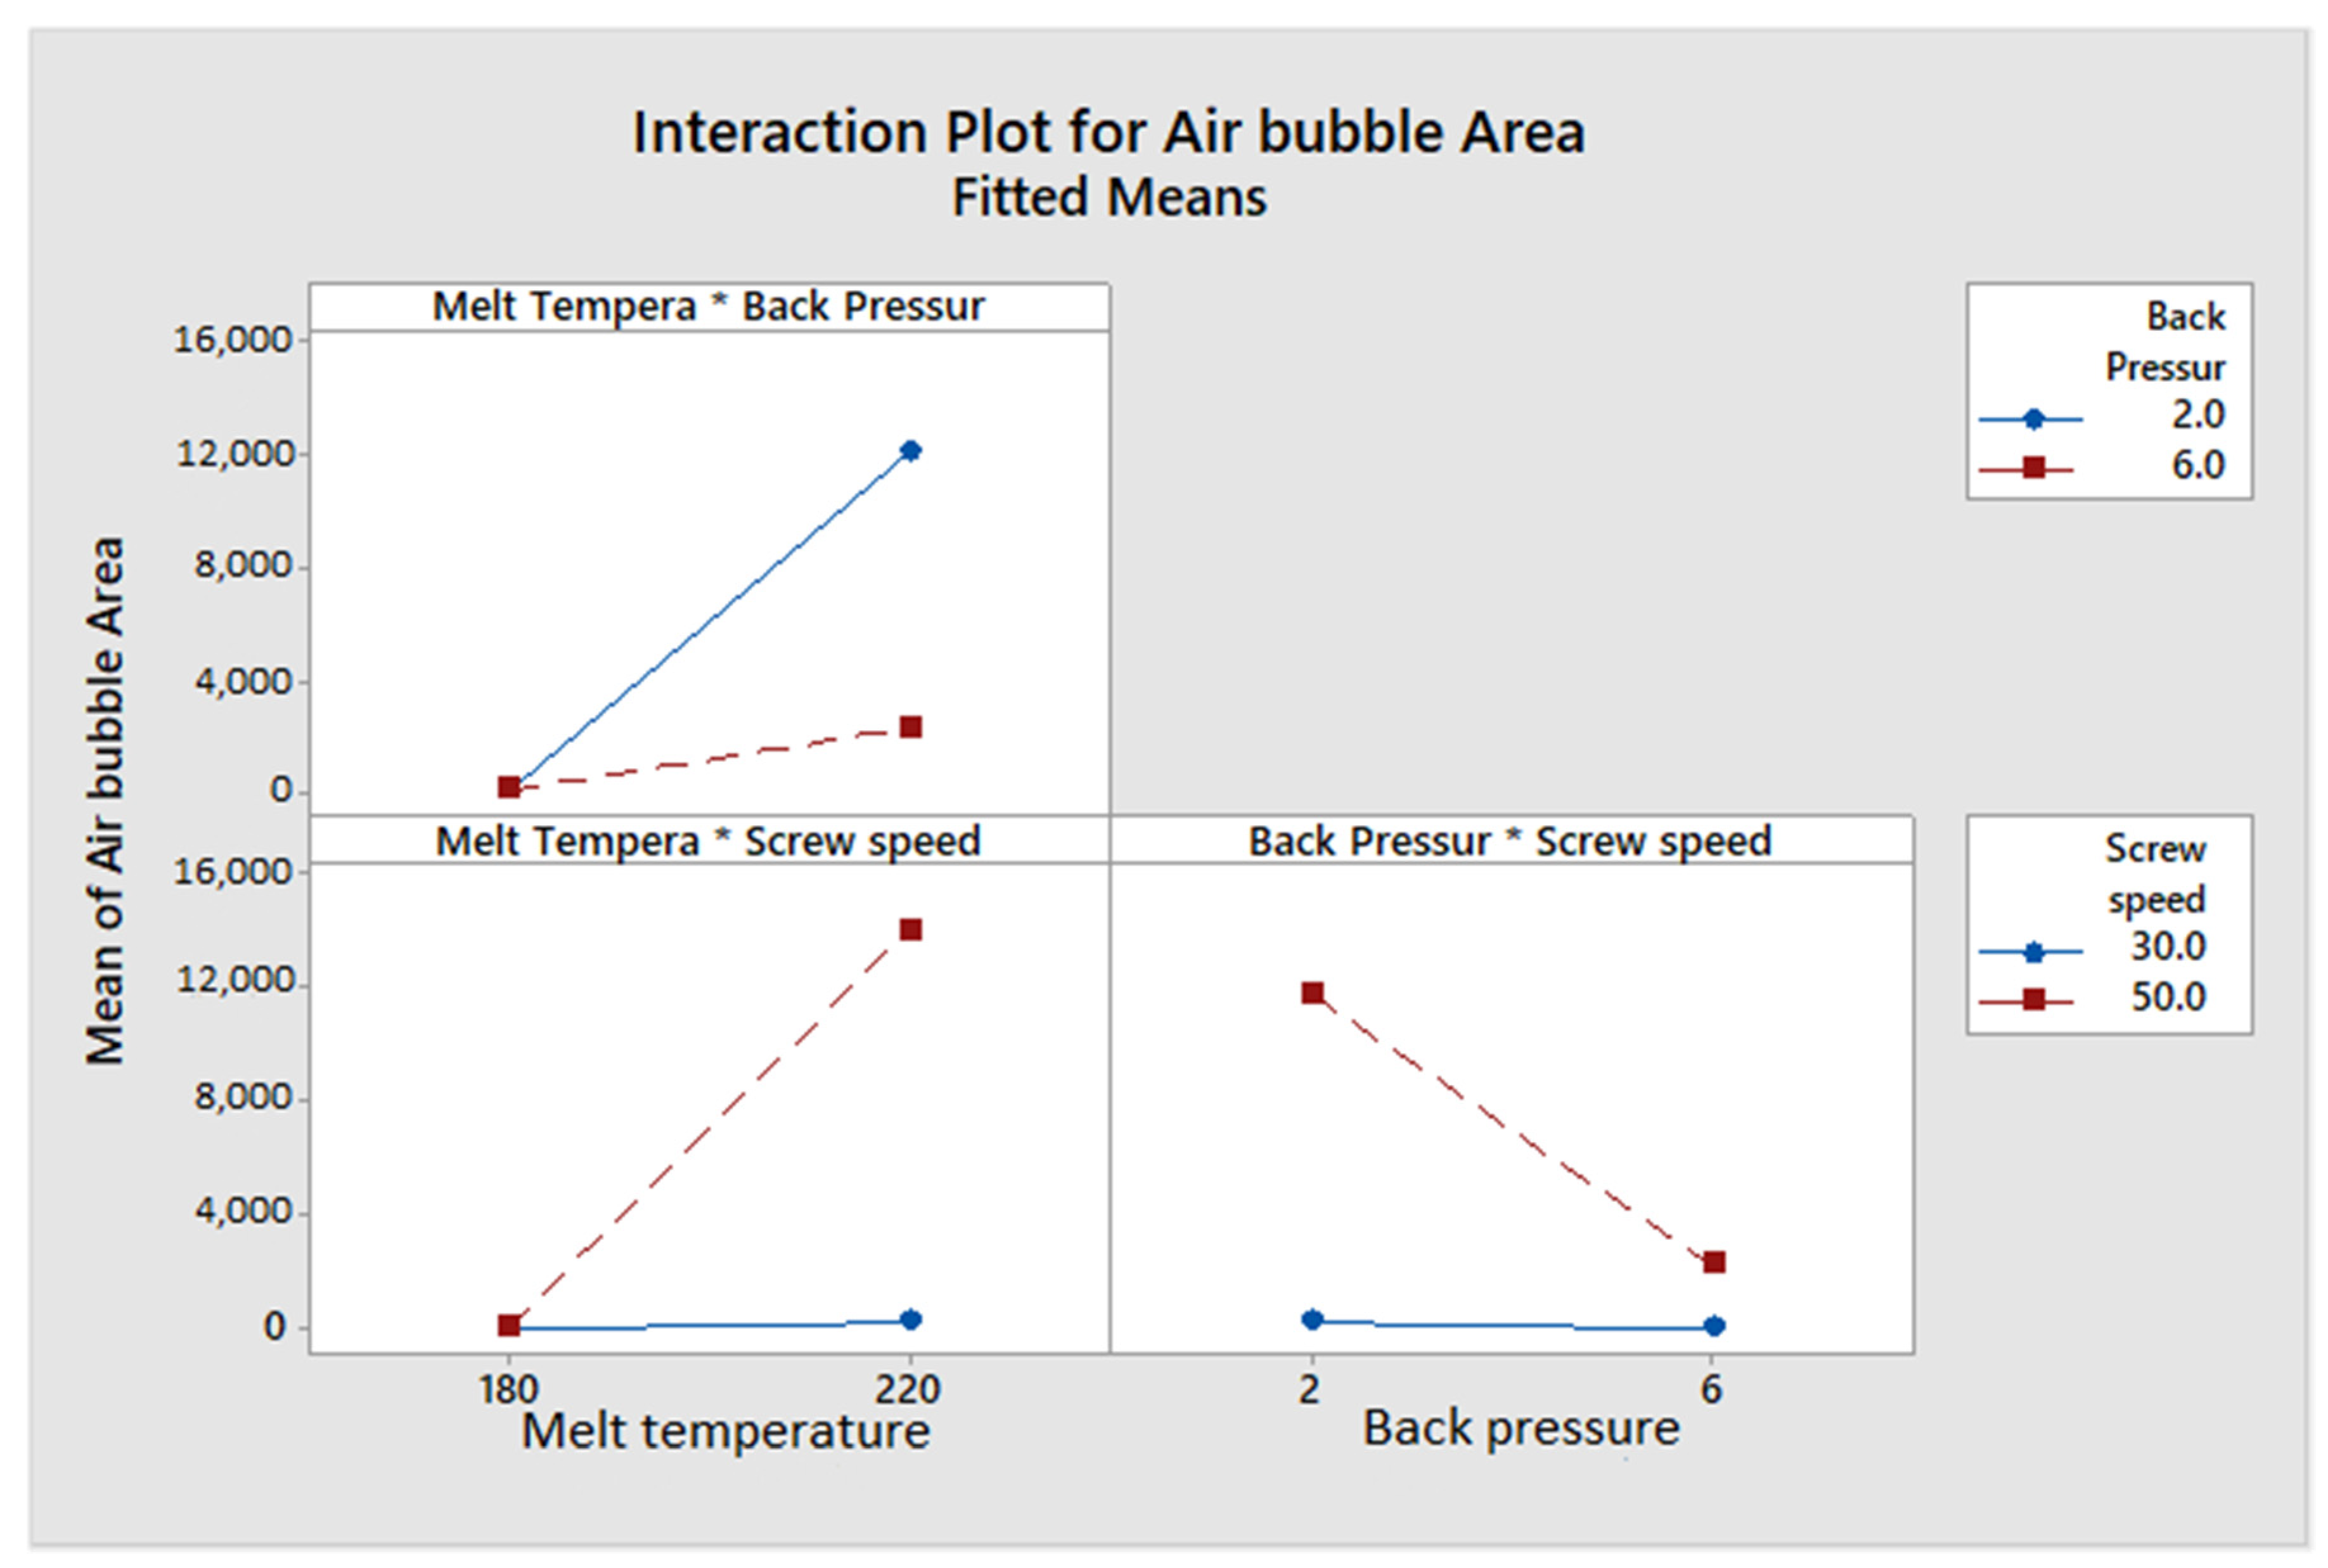
4.1.3. Interaction Plot Analysis in Terms of Air Bubble Area
Aside from the Pareto chart and regression analysis of the factor used, the interaction between these factors helps to explain the output response better. The interaction plot (Figure 5) illustrates the interaction effect of these factors. The interaction effect analysis plot of ‘back pressure versus screw speed’ on the air bubble area reveals that air bubble area enlargement is highly reliant on the screw speed and the back pressure level. The plot shows that a higher screw speed level in a low back pressure range produces more air bubbles and a higher back pressure level can substantially suppress the air bubble area. Therefore, back pressure with a low screw speed can be used as one of the plasticization parameters to regulate the air bubble area.
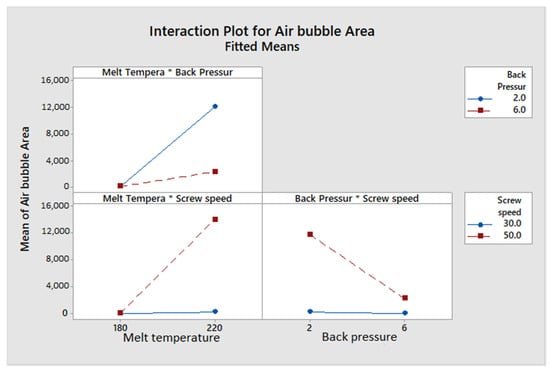
Figure 5.
Interaction plot analysis in terms of air bubble area.
The ‘melt temperature and back pressure’ interaction plot shows that when the temperature is high, the air bubble area formed is significantly dependent on the back pressure level, where a low back pressure level produces more air bubble area, but when high back pressure is imposed at a low temperature, the air bubble area would seem to be reduced. Similarly, when the melt temperature versus screw speed interaction is analyzed, it also seems that at high temperatures, high screw speed levels have some effect on the formation of the air bubble area, but when the temperature is reduced, the screw speed level has no effect on the generation of air bubble area. Thus, the interaction chart illustrates that the melt temperature plays a significant role in controlling the air bubble area and that it is possible to regulate the formation of the air bubble area at low temperature with low screw speed and high back pressure.
4.2. Second Part: The Influence of Plasticization Parameters with Moisture Content
4.2.1. Influence and Comparison of Product Part Forming under Different Back Pressure
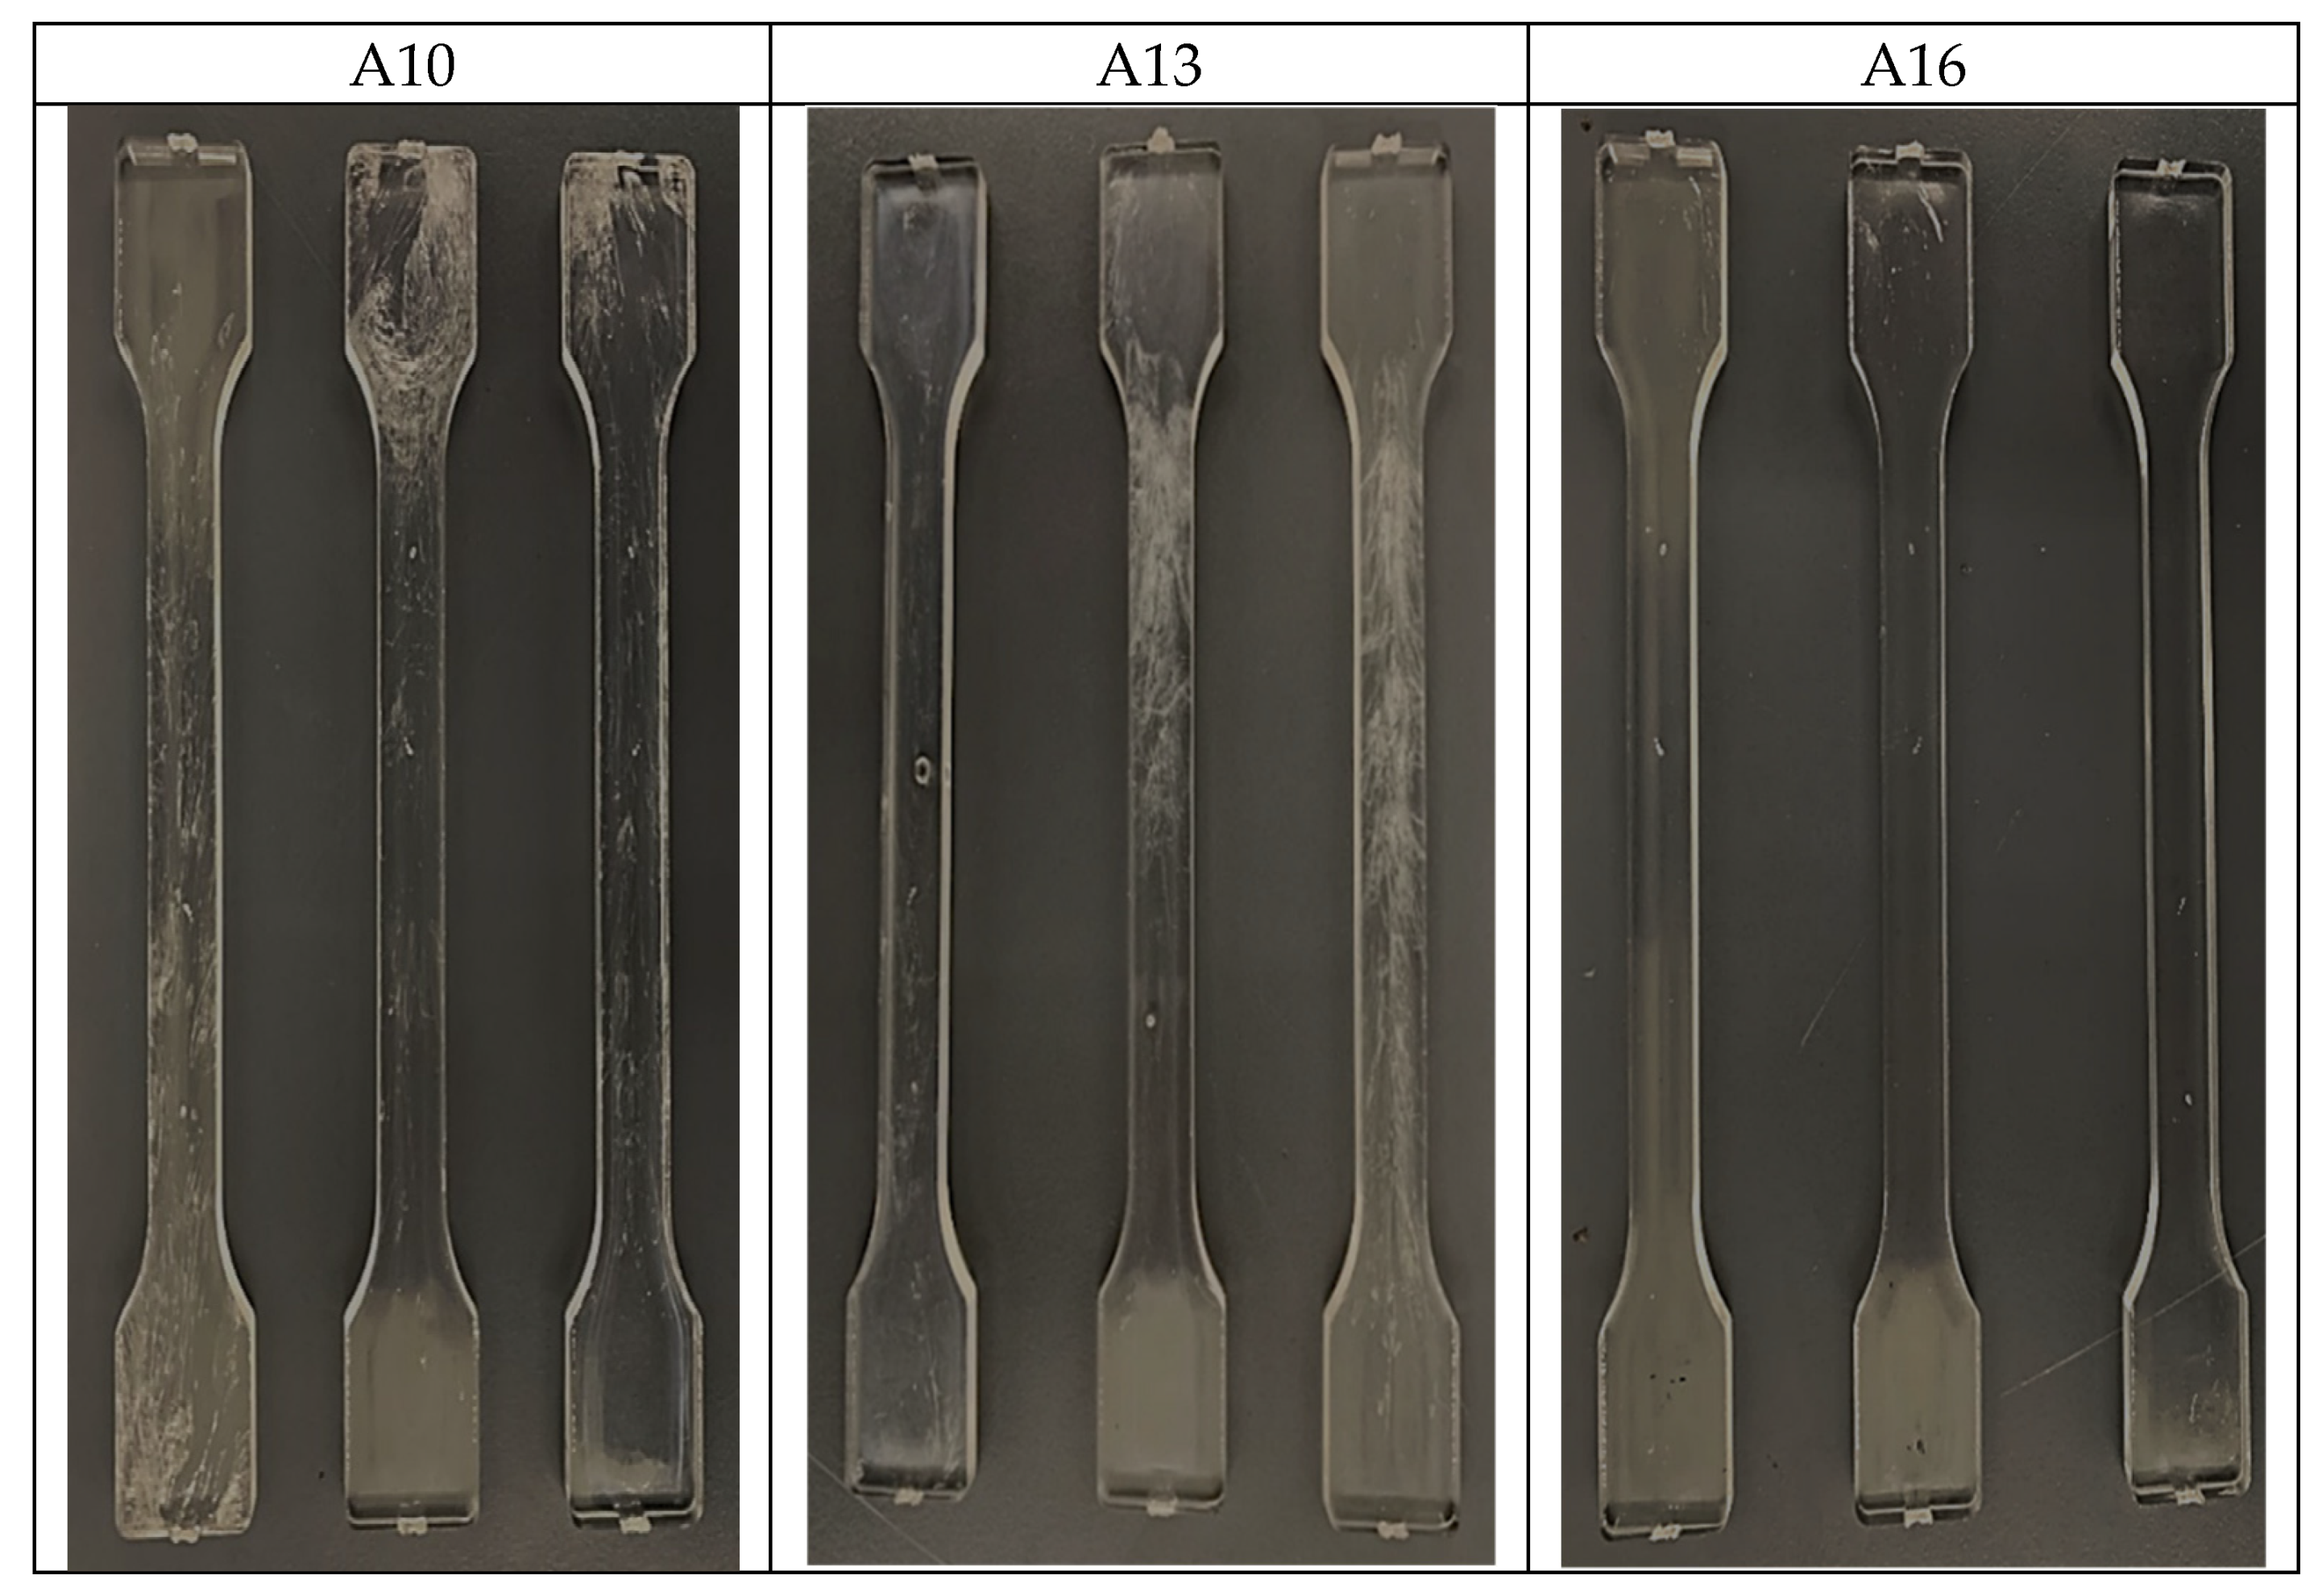
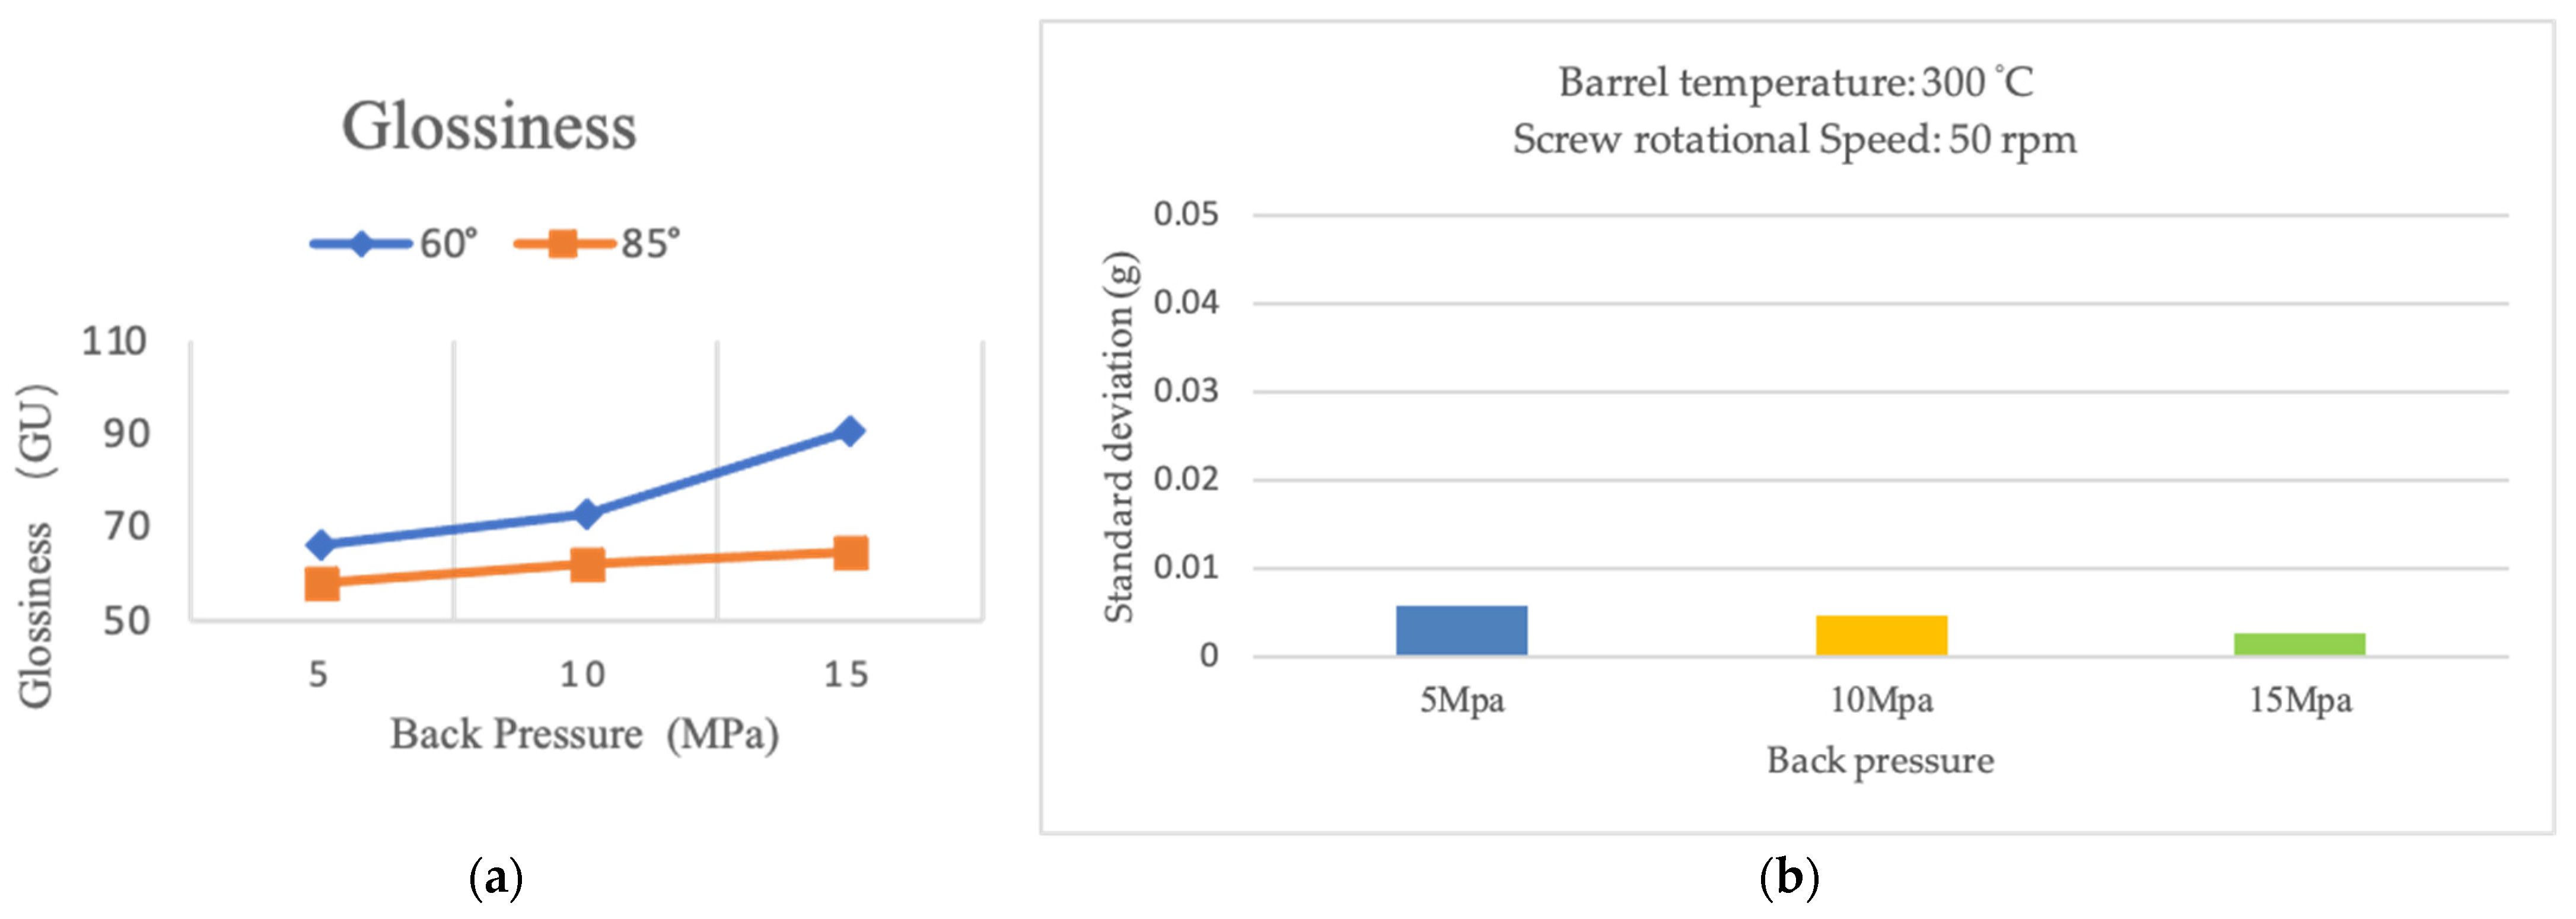
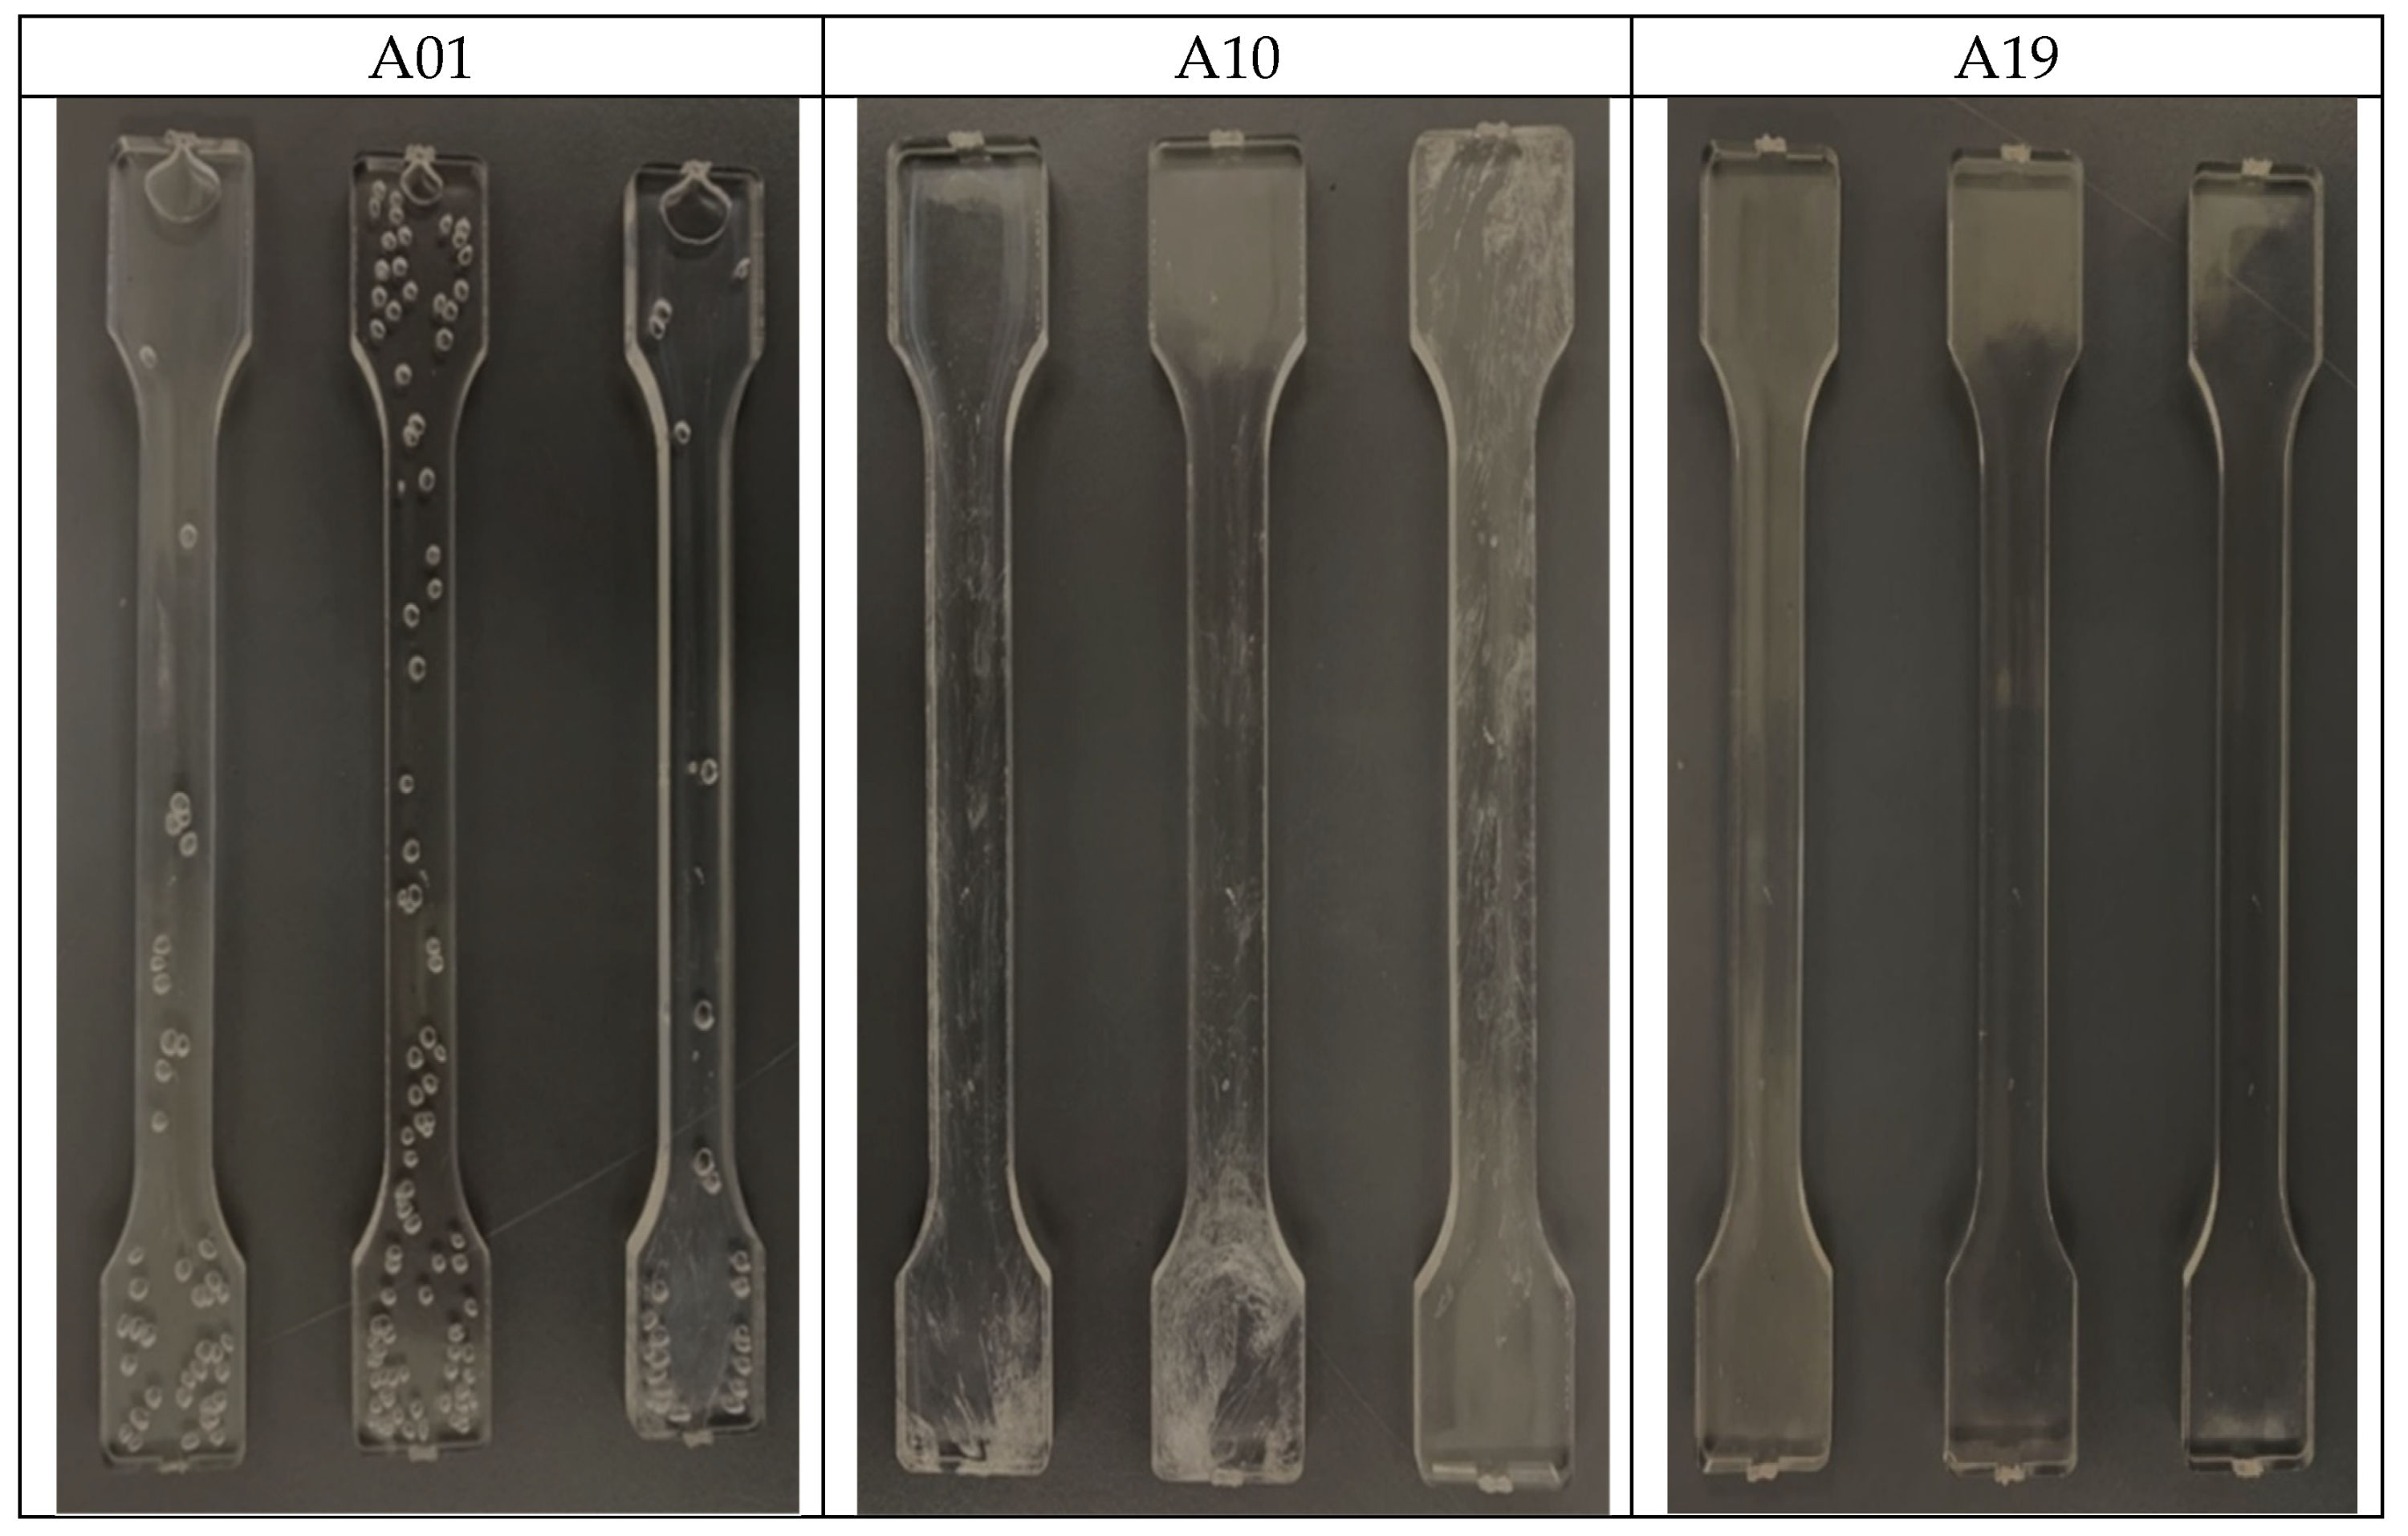
Figure 6 shows a comparison of product part samples forming under different back pressure value (5 Mpa, 10 Mpa and 15 Mpa) in which the moisture-absorbed PC material is molded at a 20 mm/s injection speed, with a barrel temperature of 300 °C, and plasticization parameters of 50 rpm screw rotational speed. With sufficient pressure holding time, this ensured that the molded product was completely filled without short shots. From the figure sample, it can be observed that when the plasticization parameter back pressure was 5 MPa (A10—Figure 6), the silver marks caused by the influence of water vapor had a larger area of distribution on the transparent product part surface. However, the surface defect seems to reduce with increase in backpressure (A13—10 Mpa, A16—15 Mpa). Similarly, Figure 7a shows the measured surface gloss value under different back pressure, showing the change of the surface gloss of the injected sample. The surface gloss of the sample will change due to moisture defects and, from the gloss measured values, it can be seen that with increase in back pressure, the area of the product’s silver mark distribution has been significantly reduced, and the frequency of defects also gradually decreased. Thus, when the back pressure was 15 Mpa, the product was transparent (A16—Figure 6) with high gloss value, and no defects were found in the sample under this parameter. Furthermore, the back pressure acting on the melt plasticization process helped to avoid the uneven melt density caused by the rapid retreat of the plunger. Therefore, increasing the back pressure will extend the plunger retreat time during the plasticization stage, and at the same time, the material will be stored. Moreover, the heat generated by friction with the wall of the material tube (barrel) will also increase during the process, and the energy transfer can effectively destroy the bubble film mixed with water vapor in the melt. Figure 7b shows the comparison of the standard deviations of the product molding weight. In this group comparison, the product weight stability is shown to be maintained at a better level. This indicates that the back pressure during the plasticization process can improve the melt uniformity. However, excessive temperature rises caused by increase in back pressure may affect the quality of the melt.
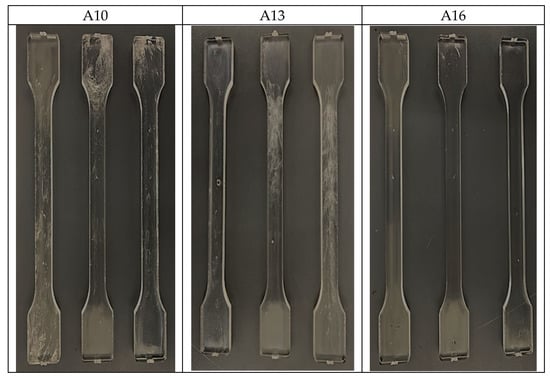
Figure 6.
Product part appearance molding under different back pressure.

Figure 7.
Measurement data of product: (a) Surface gloss under different back pressure (measurement angle 60°, 85°); (b) Standard deviation of product molding weight under different back pressure.
4.2.2. The Influence of Screw Rotational Speed on Molded Products
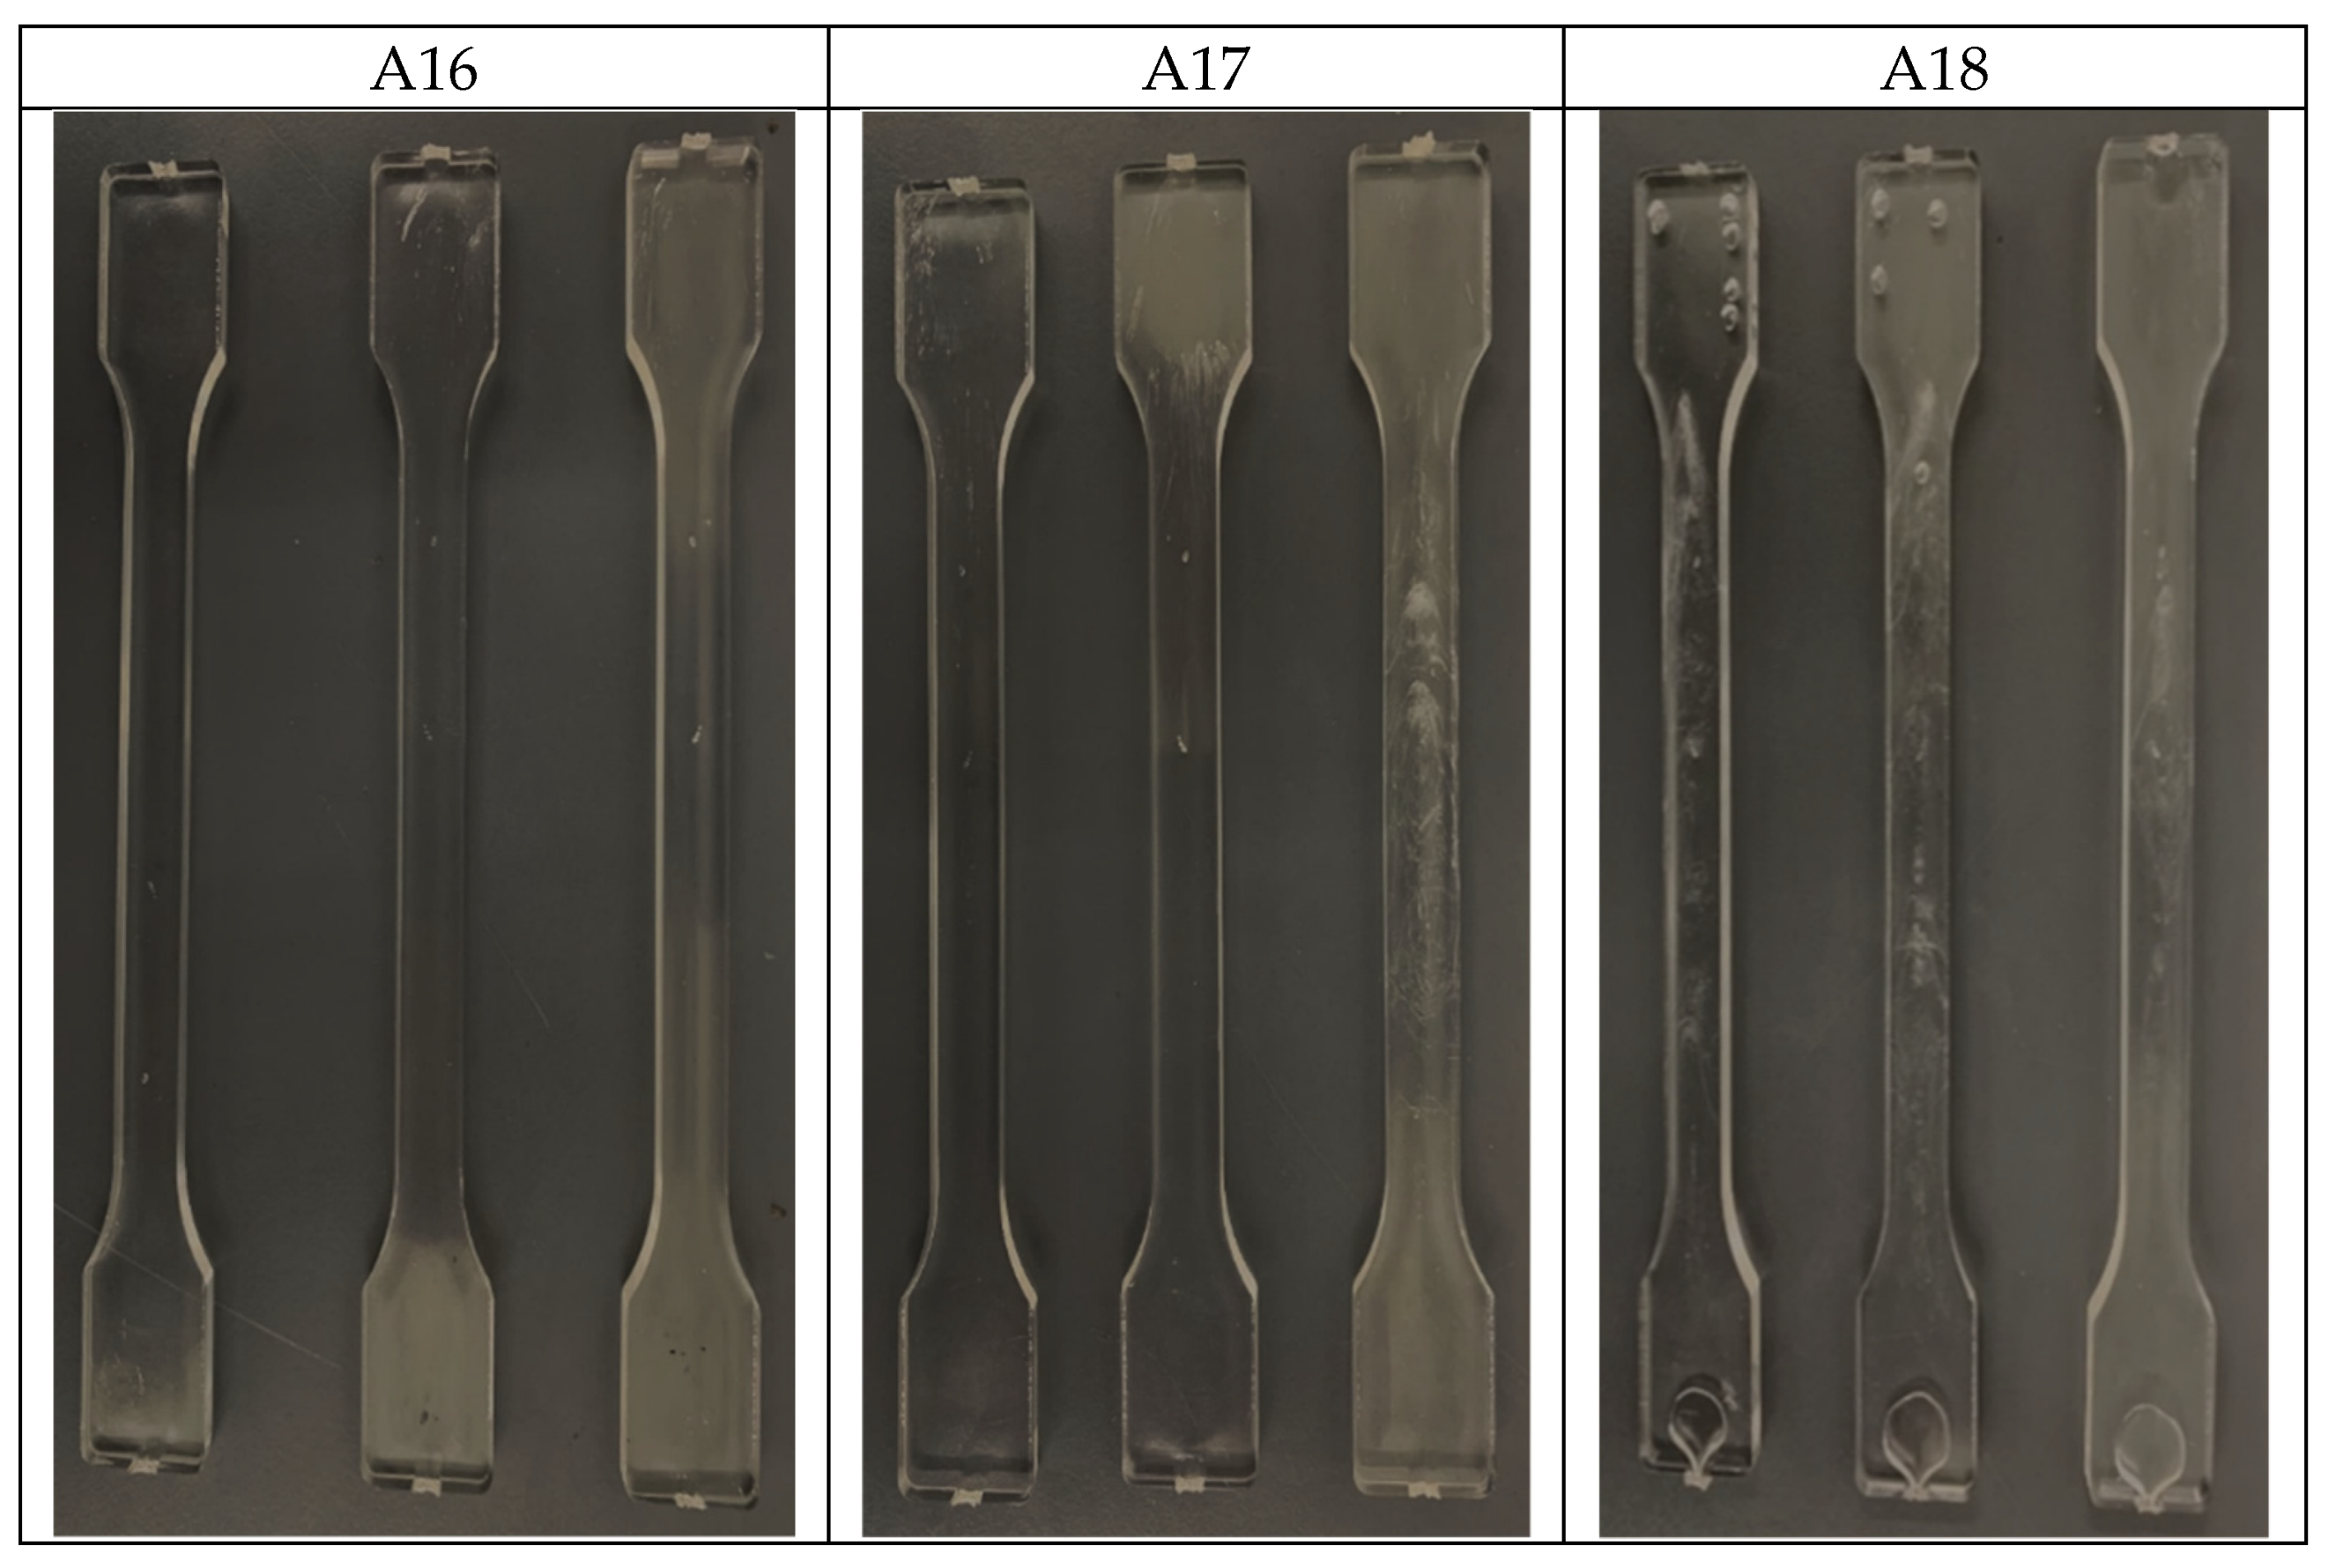
Figure 8 shows the images obtained from moisture-absorbed PC material molded parts with different screw rotation speeds and keeping fixed values for the barrel temperature (300 °C), and back pressure (15 MPa). From the figure, it can be seen that when the screw rotation was 50 rpm (A16—Table 6), the product part was transparent (A16—Figure 8), and no defects were found in the sample under these conditions. However, with increase in the screw rotational speed, it can be seen that the proportion of product defects also increased; Figure 8—A17 shows the increase in surface defects at a screw speed of 100 rpm. Similarly, when the rotation speed was increased to 150 rpm (A18—Figure 8), the defects in the product part surface also tended to increase and expand. From this, it is clear that a low screw rotation speed produces the least surface defects in the product part and, therefore, a low screw rotational speed can be used to control the generation of bubbles, sparks, and silver streak line marks on the product surface.
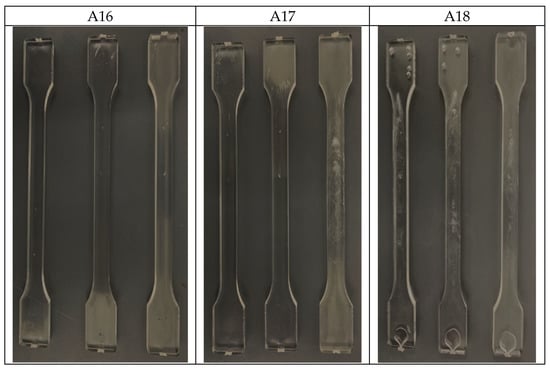
Figure 8.
Product part appearance under different screw rotational speeds.
Figure 9b shows the standard deviation of the product weight measures. From the figure, it can be seen that the higher the screw speed, the higher the standard deviation of the product weight, and the greater the weight change between the mold products. On the other hand, the least change in product weight was found at low screw speed. Moreover, higher screw speed shortens the plasticizing time, and too short a plasticizing time will cause uneven plasticization of the plastic. A high speed will cause higher shear heat leading to material degradation with the barrel resident time. Figure 9a shows the surface gloss changes of injection molded samples in this parameter group. From the appearance of the experimental samples, it is clear that the product can obtain a higher gloss finished product when the temperature of the barrel is lowered.
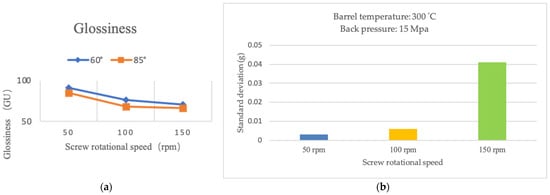
Figure 9.
Measurement data of product: (a) Surface gloss under different screw rotational speeds (measurement angle 60°, 85°); (b) Standard deviation of product molding weight under different screw rotational speeds.
4.2.3. The Influence of Barrel Temperature on Molded Products
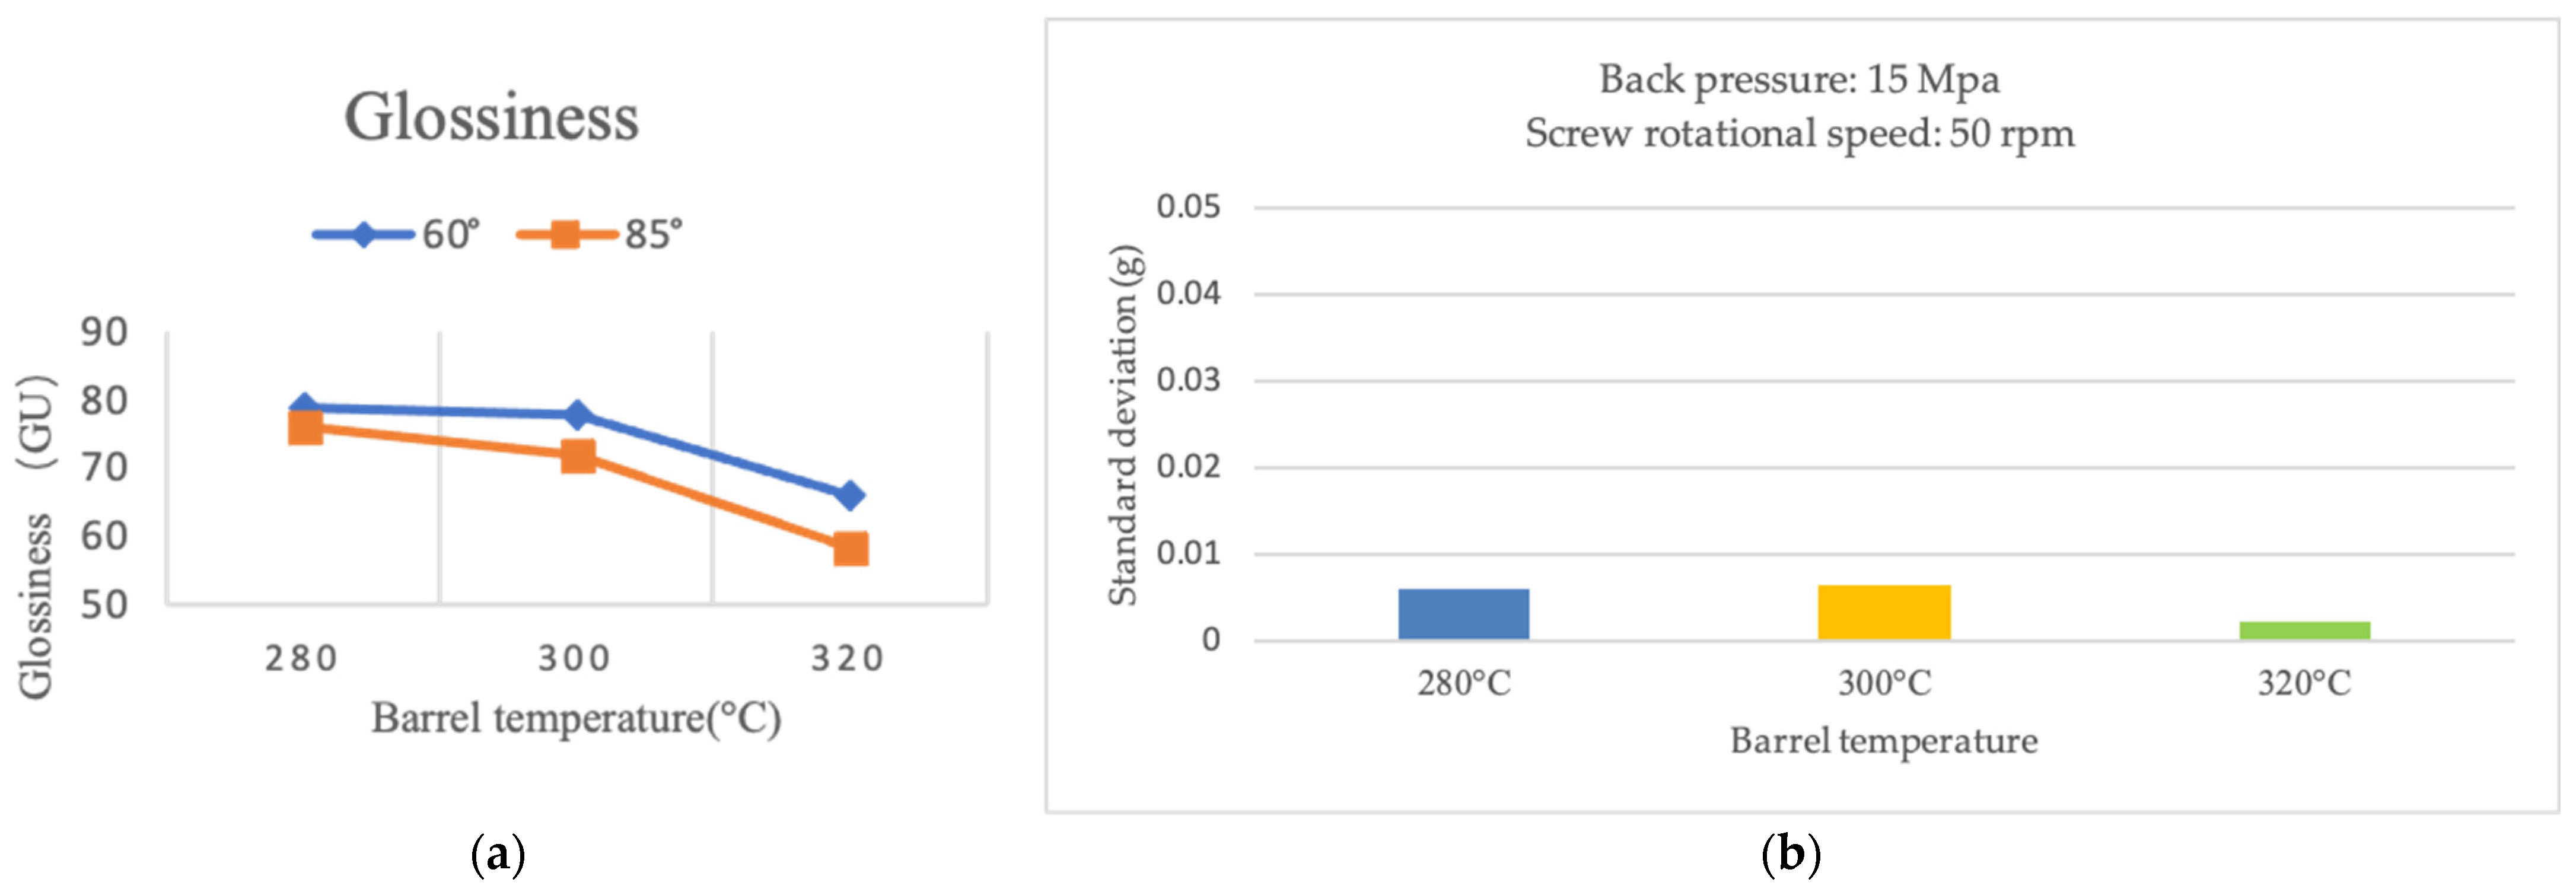
Figure 10 shows the product part appearance under different barrel temperatures (320 °C, 300 °C, and 280 °C) and when the PC material was molded with plasticization back pressure at 5 MPa and at 50 rpm screw rotational speed. Figure 11a shows the surface gloss change of injection molded samples in this parameter group. From the appearance of the experimental samples, it is observed that the product can obtain a higher gloss finished product when the temperature of the barrel is lowered (Figure 10—A19). Increasing the melt flow process pressure can effectively promote the diffusion of water bubbles in the melt, thereby increasing the efficiency of gas discharge, but it will also increase the melt’s energy consumption during the filling process.
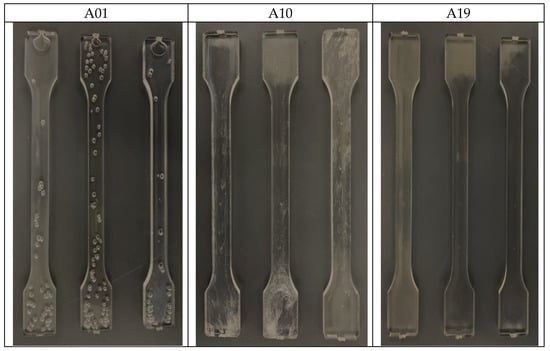
Figure 10.
Product part appearance under different barrel temperatures.
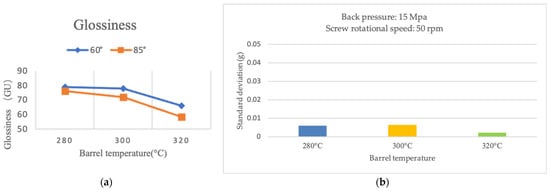
Figure 11.
Measurement data of product: (a) Surface gloss under different barrel temperature (measurement angle 60°, 85°); (b) Standard deviation of product molding weight under different barrel temperature.
Figure 11b shows the comparison of the standard deviation of the product molding weight under different barrel temperatures. The comparison of the results in this group shows that the influence of the temperature of the discharge tube has no obvious trend. The temperature and weight of the material tube at 320 °C were the most stable.
4.3. Comparison of Product Part Forming under Different Moisture Content
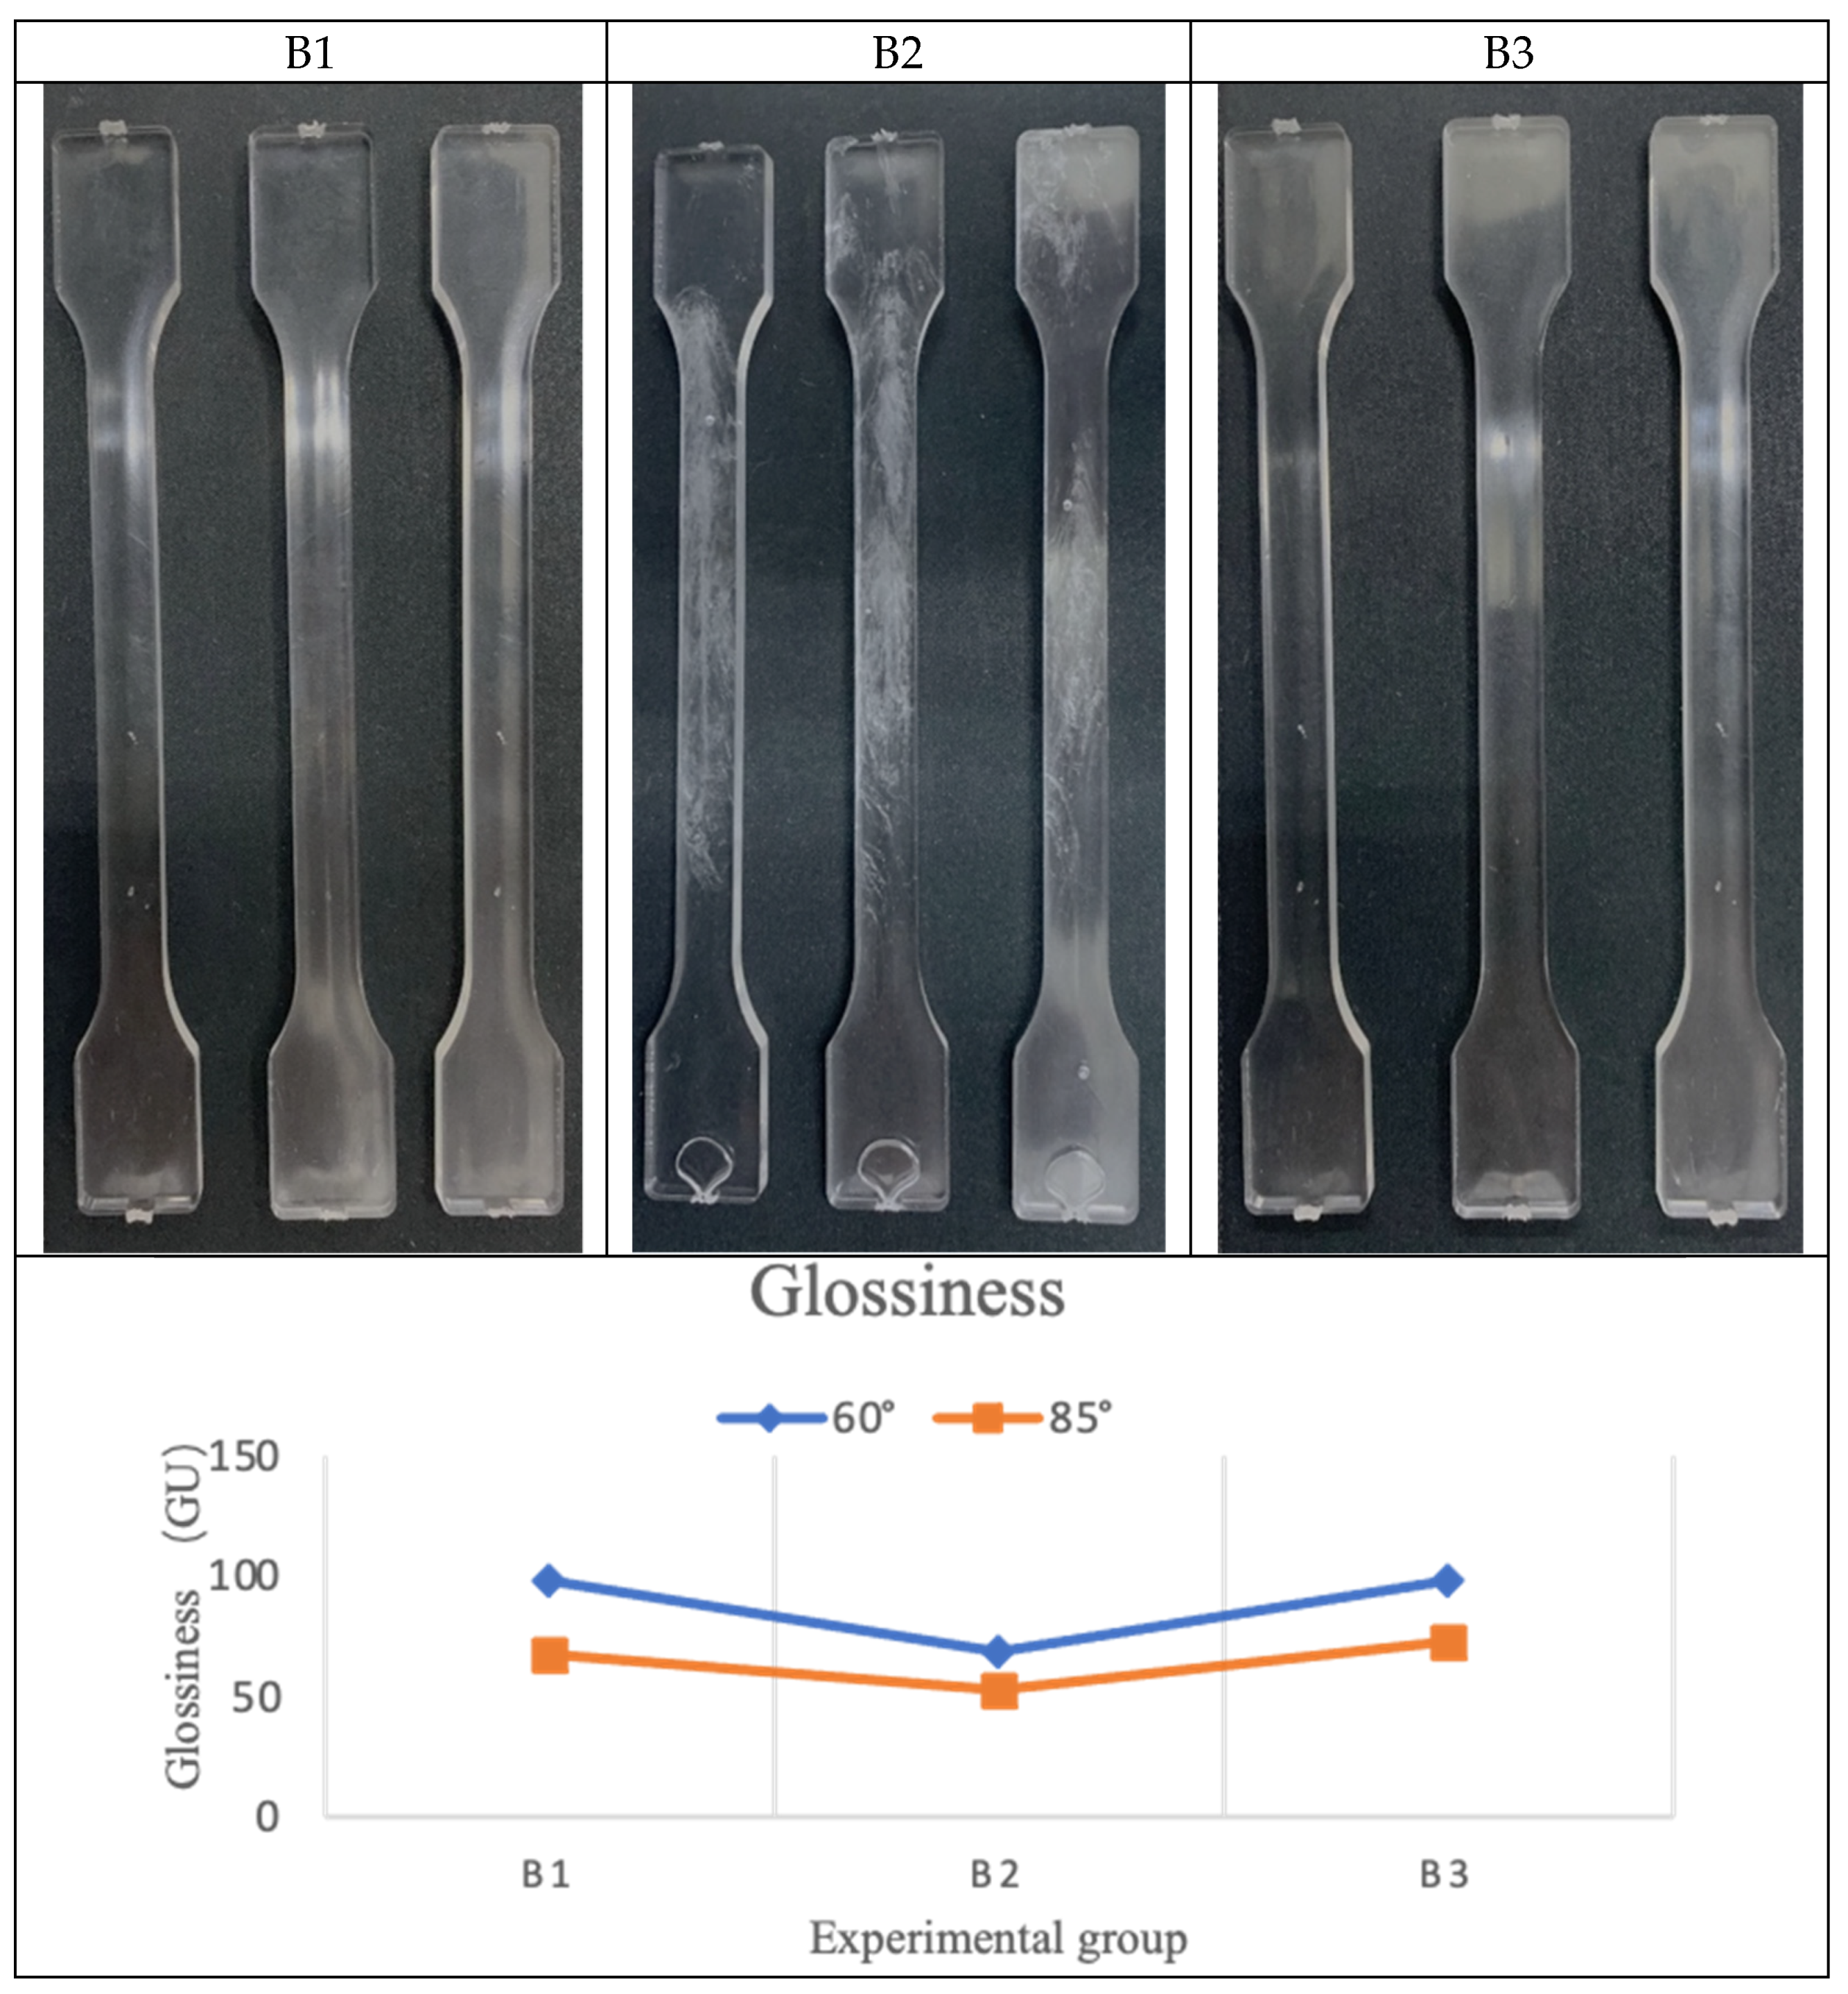
Figure 12—B1 shows the PC material molded sample image that has passed the material drying time of 4 h, as recommended by the material supplier, and the measured moisture content is 100 ppm which belongs to the B1 group. As expected, the product was transparent, and no defects were found in the sample under these parameters. The measured gloss of the bottom molded product was 98.4 GU. Similarly, Figure 12—B2 represents the molded sample image for the parameter group B2, in which the material passed through the 2 h material drying time, and the measured moisture content was 600 ppm. The image of the molded samples shows that the material had obvious silver mark defects and the measured gloss value of the product part sample was 68.43 GU.
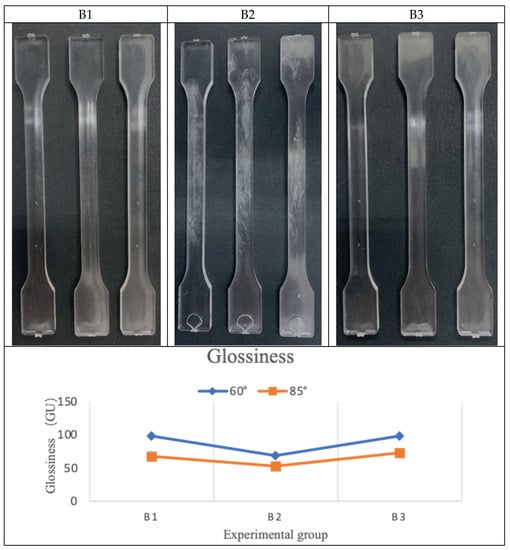
Figure 12.
Comparison of measurement data of product surface gloss (measurement angle 60°, 85°).
Figure 12—B3 represents the molded samples produced through the optimization of plasticization parameters (i.e., barrel temperature, back pressure, screw speed). When the product was at the barrel temperature of 280 °C, the back pressure was 15 MPa, and the screw speed was 50 rpm under the plasticization parameter B3 group, the measured gloss value was 98.1 GU. This experiment reveals that through reasonable plasticization parameter correction, it is possible to reduce the moisture defect and, comparing the gloss of the product samples (Figure 12), shows that the optimized plasticization parameter (B3 group) can reduce drying time to obtain a product surface quality that is the same as the fully dried material (B1 group) and conforms to the standard. The standard deviation of the gloss data in the B3 group was 0.6, which meets the gloss requirements of qualified products. The proposed value can be used as a basis for product quality judgment, and the surface quality of the molded samples can be controlled through parameter correction. Furthermore, this method may help molders to reduce drying time, improve production efficiency and achieve cost savings.
5. Conclusions
The experimental work in this paper supports a new innovative method to reduce the required drying time of plastic resin material, thereby promoting green production standards in the injection molding manufacturing process. Moreover, this study provides an alternative approach to minimize the appearance of moisture-induced defects, such as air bubble formation, silver streaks, etc., in the molded sample, by optimizing plasticization parameters instead of using a dryer. A factorial design multivariate statistical analysis with polyurethane material was used to determine the influence of plasticization parameters that have a significant effect on the moisture content at a 95% confidence interval (α = 0.05). Experimental analysis using polycarbonate material revealed that the plasticization parameters, screw speed, back pressure, and barrel temperature had a significant influence in controlling the effect of moisture. It is possible to suppress the formation of air bubbles, silver lines, etc., on the molded part by optimizing the plasticization parameters, by lowering the barrel temperature and screw speed and by increasing the back pressure. Comparing the glossiness measurement value of the product part produced with a moisture content of 600 ppm, 98.1 GU with the properly dried material with 100 ppm, 98.4 GU, shows that, through reasonable plasticization parameter correction, the standard deviation of the gloss data with moisture content was 0.6, which meets the gloss requirements of qualified products. Accordingly, the surface quality of the product part produced with moisture content can be improved and it is possible to reduce the drying time by changing the plasticization parameter. Furthermore, this study provides an alternative approach to reduce the impact of moisture-oriented air bubble formation, and other defects in the molded sample, even after drying and changing climatic conditions.
Author Contributions
Conceptualization, S.-C.C.; methodology, C.-W.H., J.J.M. and H.S.; software, H.S., J.J.M. and C.-W.H.; validation, C.-T.F. and C.-W.H.; formal analysis, J.J.M., H.G. and C.-W.H.; investigation, S.-C.C., H.S. and J.J.M.; resources, C.-W.H. and C.-T.F.; data curation, S.-C.C., J.J.M., C.-T.F. and H.S.; writing—original draft, S.-C.C. and J.J.M.; supervision, S.-C.C.; writing—review and editing, J.J.M., H.G. and C.-T.F. All authors have read and agreed to the published version of the manuscript.
Funding
This work was supported by the Ministry of Science and Technology (MOST) in Taiwan under the grant number 110-2622-8-033-002-SB.
Institutional Review Board Statement
Not applicable.
Informed Consent Statement
Not applicable.
Data Availability Statement
Not applicable.
Acknowledgments
This work was supported by the Ministry of Science and Technology (MOST) in Taiwan. The authors thank the funding provided by MOST (MOST 110-2622-8-033-002-SB) and the R&D Center for Semiconductor Carrier.
Conflicts of Interest
The authors declare no conflict of interest.
References
- Kulkarni, S. Robust Process Development and Scientific Molding: Theory and Practice; Carl Hanser Verlag GmbH Co KG: Munich, Germany, 2017; p. 5. [Google Scholar]
- Kamaruddin, S.; Khan, Z.A.; Foong, S.H. Quality characteristic improvement of an injection moulding product made from blends plastic by optimizing the injection moulding parameters using Taguchi method. Int. J. Plast. Technol. 2010, 14, 152–166. [Google Scholar] [CrossRef]
- Pratap, B.; Gupta, R.K.; Yadav, A.; Nag, M. Plastic injection molding and its process parameters. In AIP Conference Proceedings; AIP Publishing LLC: Rangpo, India, 2020. [Google Scholar]
- Kim, E.; Shin, Y.-J.; Ahn, S.-H. The effects of moisture and temperature on the mechanical properties of additive manufacturing components: Fused deposition modeling. Rapid Prototyp. J. 2016, 22, 887–894. [Google Scholar] [CrossRef]
- Stan, D.V. Considerations on the Drying of the Raw Material and Consequences on the Quality of the Injected Products. Mater. Plast. 2020, 57, 46–56. [Google Scholar] [CrossRef]
- Long, T.S.; Sokol, R.J. Molding polycarbonate: Moisture degradation effect on physical and chemical properties. Polym. Eng. Sci. 1974, 14, 817–822. [Google Scholar] [CrossRef]
- Xie, F.; Zhang, T.; Bryant, P.; Kurusingal, V.; Colwell, J.M.; Laycock, B. Degradation and stabilization of polyurethane elastomers. Prog. Polym. Sci. 2019, 90, 211–268. [Google Scholar] [CrossRef]
- Bílik, J.; Náplava, A.; Kusý, M.; Košík, M.; Likavčan, L. Silver Streaks on Surface of Injected Thermoplastic Parts. Res. Pap. Fac. Mater. Sci. Technol. Slovak Univ. Technol. 2014, 22, 21–27. [Google Scholar] [CrossRef] [Green Version]
- Schulz, U.; Jakobs, S.; Anton, B.; Kaiser, N. Formation of surface defects on polymer lenses depending on moisture absorption. Anal. Bioanal. Chem. 1995, 353, 740–742. [Google Scholar] [CrossRef]
- Heinzler, F.; Mistier, M.; Wortberg, J. Quality improvement by enhanced pressure controlled injection molding. In Proceedings of the SPE ANTEC, Las Vegas, NV, USA, 28–30 April 2014. [Google Scholar]
- Dong, G.; Zhao, G.; Zhang, L.; Hou, J.; Li, B.; Wang, G. Morphology Evolution and Elimination Mechanism of Bubble Marks on Surface of Microcellular Injection-Molded Parts with Dynamic Mold Temperature Control. Ind. Eng. Chem. Res. 2018, 57, 1089–1101. [Google Scholar] [CrossRef]
- Chen, D.C.; Tse-Hsi, C.; Geng-Fu, L.; Yi-Kai, W.; Yu-Chen, C. Experimental investigation into suitable process conditions for plastic injection molding of thin-sheet parts. Int. J. Eng. Technol. Innov. 2014, 4, 107. [Google Scholar]
- Dininger, J. Three critical measurements on injection molding processes. In Proceedings of the 1994 IEEE Industry Applications Society Annual Meeting, Denver, CO, USA, 2–6 October 1994. [Google Scholar]
- Park, H.; Kim, B.; Gim, J.; Han, E.; Rhee, B. A Study on the Entrapped Air Bubble in the Plasticizing Process. In Proceedings of the Annual Technical Conference—ANTEC, Conference Proceedings, Anaheim, CA, USA, 8–10 May 2017. [Google Scholar]
- Rosato, D.V.; Rosato, M.G. Molding variable & property responses-Appearance properties. In Injection Molding Handbook; Springer: New York, NY, USA, 2012; p. 599. [Google Scholar]
- Gordon, M.G., Jr. Back pressure. In Total Quality Process Control for Injection Molding; John Wiley & Sons: Hoboken, NJ, USA, 2010; p. 294. [Google Scholar]
- Amano, O.; Utsugi, S. Temperature measurements of polymer melts in the heating barrel during injection molding. Part 3: Effects of screw geometry. Polym. Eng. Sci. 1990, 30, 385–393. [Google Scholar] [CrossRef]
- Dontula, N.; Sukanek, P.C.; Devanathan, H.; Campbell, P.G.A. An experimental and theoretical investigation of transient melt temperature during injection molding. Polym. Eng. Sci. 1991, 31, 1674–1683. [Google Scholar] [CrossRef]
- Chen, J.-Y.; Tseng, C.-C.; Huang, M.-S. Quality Indexes Design for Online Monitoring Polymer Injection Molding. Adv. Polym. Technol. 2019, 2019, 1–20. [Google Scholar] [CrossRef] [Green Version]
- Yang, Y.J.; Draper, N.R. Two-Level Factorial and Fractional Factorial Designs in Blocks of Size Two. J. Qual. Technol. 2003, 35, 294–305. [Google Scholar] [CrossRef]
- Mason, R.L.; Gunst, R.F.; Hess, J.L. Statistical Design and Analysis of Experiments: With Applications to Engineering and Science; John Wiley & Sons: Hoboken, NJ, USA, 2003; Volume 474, pp. 126–161. [Google Scholar]
- Papers, O. Key Properties of -Polyurethanestpu. Available online: https://omnexus.specialchem.com/selection-guide/thermoplastic-polyurethanes-tpu (accessed on 3 July 2021).
- BASF. Elastollan® TPU Technical Data Sheet. Available online: http://www.elastollan.basf.us/pdf/1180A.pdf (accessed on 18 July 2021).


Publisher’s Note: MDPI stays neutral with regard to jurisdictional claims in published maps and institutional affiliations. |
© 2022 by the authors. Licensee MDPI, Basel, Switzerland. This article is an open access article distributed under the terms and conditions of the Creative Commons Attribution (CC BY) license (https://creativecommons.org/licenses/by/4.0/).